Investigating kinematics and dynamics of three open clusters towards Galactic anti-center
Abstract
We present the intra-cluster kinematics and dynamics of three open clusters: NGC 1193, NGC 2355, and King 12 by incorporating kinematical and photometric data from Gaia DR3, as well as a ground-based telescope. After selecting cluster members based on proper motion data, clusters’ fundamental and structural parameters are investigated. We found the clusters at distances of 4.45, 1.97, and 3.34 kpc from the Sun in the direction of the Galactic anticenter. The luminosity function of the cluster NGC 1193 is flat, whereas it advances towards the fainter ends of the other two clusters. We observed a dip in the luminosity function of King 12. The mass function slopes for all three clusters differ from the solar neighbourhood reported by Salpeter, with NGC 1193 and NGC 2355 being flatter and King 12 having a higher value than the Salpeter value. The intra-cluster kinematics depict that stars in King 12 are moving outwards due to tidal forces from the Galactic disc, which we confirmed by plotting the cluster’s orbit in the Galaxy. Stars in NGC 2355 are moving with smaller relative velocities and have zero mean relative motion, which signifies that the cluster is neither contracting nor evaporating. The Galactic orbits of NGC 1193 suggest that it is orbiting farther from the Galactic disc, and so is less impacted by the Galactic tidal forces.
keywords:
Galaxy: kinematics and dynamics - open clusters and associations: general - open clusters and associations: individual (NGC 1193, NGC 2355, King 12)1 Introduction
Open clusters (OCs) of our Galaxy have an extensive range of ages that can cover the Galactic disc’s entire lifetime. The older OCs are tracing the thick disc, while the younger ones are found in spiral arms in the thin disc where the perturbation is numerous. Motion and spatial distribution of these objects in the Galaxy can assist in comprehending the gravitational potential and perturbations which shape the configuration and dynamics of the Galaxy (Soubiran et al., 2018). In addition to the evolution of an isolated system, dynamical evolution of the stars in open clusters are influenced by the disruptive effects of the tidal forces arising from the Galactic disc and the molecular clouds present in the Galactic disc (Friel, 1995). The theoretical models suggest that generally, in the time scale of to years, all the open clusters will disrupt, and the disruption time scales depend on the mass as well as the core radius of the clusters (Spitzer, 1958; Spitzer & Harm, 1958). Most of the OCs in the Milky Way survive due to their higher mass and central concentration and the path they follow to revolve around the Galactic centre, which avoids the influence of large disruptive forces (Friel, 1995). So old open clusters are worth exploring to test these theories. Also, we can predict the survival of the younger systems according to these theories.
| Cluster | (deg) | (deg) | (pc) | (dex) | ||||
|---|---|---|---|---|---|---|---|---|
| NGC 1193 | 03:05:32 | +44:23:00 | 146.749 | -12.199 | 4300 | 0.12 | 9.90 | -0.29 |
| NGC 2355 | 07:16:59 | +13:45:00 | 203.39 | 11.803 | 2200 | 0.12 | 8.85 | -0.07 |
| King 12 | 23:53:00 | +61:58:00 | 116.124 | -0.130 | 2378 | 0.59 | 7.04 | - |
For this study, we selected three open clusters, NGC 1193, NGC 2355 and King 12, found towards the Galactic anti-centre. These clusters are at different dynamical stages and have distinct spatial locations in the Galactic disc. NGC 1193 is one of the Galaxy’s oldest and most well-populated open clusters of faint stars. Kaluzny (1988) studied this cluster using CCD data and determined age, metallicity, and distance modulus as 8 Gyr, 0.001 dex, and 13.8 mag. They also identified five blue straggler stars in this cluster. Tadross (2005) studied this cluster extensively using USNO-B1.0 catalogue. They found age, metallicity, , and distance as 8.0 Gyr, 0.008, 0.10 0.06 mag and 5250 240 pc, respectively. Kyeong et al. (2008) conducted an photometric study and estimated the fundamental parameters for this cluster as , , and age as 0.19 0.04, -0.45 0.12, 13.3 0.15 and, 5 Gyr respectively.
NGC 2355 is an intermediate open cluster at a distance of 2 kpc from the Sun. Kaluzny & Mazur (1991) studied the central part of this cluster using CCD photometric data in filters and calculated the fundamental parameters , and distance as 0.12 mag, 0.13 dex, and 2.2 kpc respectively. Soubiran et al. (2000a) studied it using photometric and spectroscopic data and found that the cluster is at a distance of 1.65 kpc from Sun, has reddening, age, and equal to 0.16 mag, 1 Gyr, and -0.07 0.11 dex, respectively. They concluded that the turn-off stars of this cluster are fast rotators. They also found a blue straggler and one unusual straggler star above the main sequence. Wang et al. (2022) conducted a time-series study for NGC 2355 and found 88 variable stars in this cluster.
King 12 is a very young open cluster having a heliocentric distance of 3 kpc. This cluster was first studied by Mohan & Pandey (1984) using photoelectric data, and they identified 30 stars in the cluster field. They calculated the distance of the cluster as 2.49 kpc. Tripathi et al. (2013) calculated the cluster’s age, reddening, and distance as 10 0.1 Myr, 0.63 0.05 mag and 2.5 0.1 kpc respectively in their CCD photometric study of this cluster. Davidge (2012) studied this cluster using CFHT MegaCam data and determined its age to be 20 Myr. They used data of brighter stars from Mohan & Pandey (1984) due to photometric saturation. They observed breaks in luminosity function in this cluster and argued that this might be the onset of pre-main sequence stars. Glushkova et al. (2013) conducted a CCD photometric study for this cluster and determined age, distance, and reddening for the cluster as 70 Myr, pc and 0.51 0.05 mag respectively. They also found a gap in the luminosity function of the cluster, but the gap is for a different magnitude bin compared to the gap reported by Davidge (2012). They inferred this gap as a discontinuity in the star formation process inside the cluster. Lata et al. (2014) also studied these clusters using photometric data in filters and determined the radius as 4.0 arcmin, reddening as 0.58 mag, and age between 10 to 500 Myr. They also found a mass function slope comparable to the Salpeter (1955) value.
Despite numerous investigations on these clusters in the literature, the values of the cluster’s properties remain inconsistent. The study of the dynamics of these clusters has not yet been conducted. The general information on the clusters taken from the WEBDA database is listed in Table 1. The kinematical data from Gaia (Gaia Collaboration et al., 2016a, b; Luri et al., 2018; Cantat-Gaudin et al., 2018) is revolutionizing our understanding of the dynamics of clusters in the Galaxy. Its third data release (Gaia Collaboration et al., 2016a, b, 2018, 2021a, 2021b) is providing precise kinematic and photometric data with minimum uncertainty. For the present analysis, we used kinematic and photometric data from Gaia DR3 and ground- based photometric data to study the dynamics of the three clusters NGC 1193, NGC 2355, and King 12. The description of data is provided in sections 2 and 3. In section 4, the process of selecting cluster members is discussed, and the fundamental properties of the clusters are determined in section 5. The dynamical properties of the clusters are discussed in section 6. In section 7, the internal and external dynamics of the clusters are discussed. Finally, we concluded the article in section 8.
2 Observational data and reduction
We have observed the three clusters, namely NGC 1193, NGC 2355, and King 12, using the PyLoN CCD mounted on 104-cm Sampurnanad telescope located at ARIES, Nainital India, in the standard Johnson , , and -band filters. The size of CCD is 1340 1300 pixels with a pixel size of 20 microns and covers an area of 6.8 6.5 arcmin2 in the sky. The observations were carried out on 14 November 2017 and 4 October 2018. Besides science images, many biases, flat images, and two standard fields, PG 2331 and PG 2336, were observed during the observing nights. A log of observational data is provided in Table 2. For the pre-reduction process of CCD images, such as bias subtraction, flat-fielding, and cosmic ray correction, we used the package available in software. The reduction of images, including determining the accurate positions and magnitude of the stars, was carried out with the help of PSF photometry available in DAOPHOT II software originally developed by Stetson (1987). In this analysis, we used the Fortran version of this software, updated by Stetson in 2004. The reduction process started with finding the stars in every image taken from the CCD using an automatic algorithm of DAOPHOT II. Since the field is crowded, we adopted the profile-fitting photometry routine available in DAOPHOT II. This constructs a point spread function using bright stars in the field and then applies it to all the stars. The output of this process is a catalogue of positions and instrumental magnitudes of the stars in the image.
| Filters | Exposure Time | Date |
| (in seconds) | ||
| NGC 1193 | ||
| 420 3 | 4 Oct 2018 | |
| 180 3 | " | |
| 420 3 | " | |
| 120 3 | " | |
| 240 3 | " | |
| 60 3 | " | |
| NGC 2355 | ||
| 420 3 | 14 Nov 2017 | |
| 180 3 | " | |
| 180 2 | 4 Oct 2018 | |
| 420 3 | 14 Nov 2017 | |
| 120 3 | " | |
| 120 2 | 4 Oct 2018 | |
| 240 3 | 14 Nov 2017 | |
| 60 3 | " | |
| 60 2 | 4 Oct 2018 | |
| King 12 | ||
| 420 3 | 14 Nov 2017 | |
| 180 3 | " | |
| 180 2 | 4 Oct 2018 | |
| 240 2 | 14 Nov 2017 | |
| 120 3 | " | |
| 120 2 | 4 Oct 2018 | |
| 240 3 | 14 Nov 2017 | |
| 60 3 | " | |
| 60 2 | 4 Oct 2018 | |
| PG 2331 | ||
| 90 14 | 4 Oct 2018 | |
| 60 14 | " | |
| 30 14 | " | |
| PG 2336 | ||
| 90 2 | " | |
| 60 2 | " | |
| 30 2 | " |
The instrumental magnitudes of the stars were calibrated into the standard Johnson
and Kron-Cousin system using the standard fields observed with the science frames.
This calibration was also done using the different calibration routines
in the DAOPHOT II package.
The transformation equations used to calibrate the instrumental magnitudes are as follows:
| (1) |
| (2) |
| (3) |
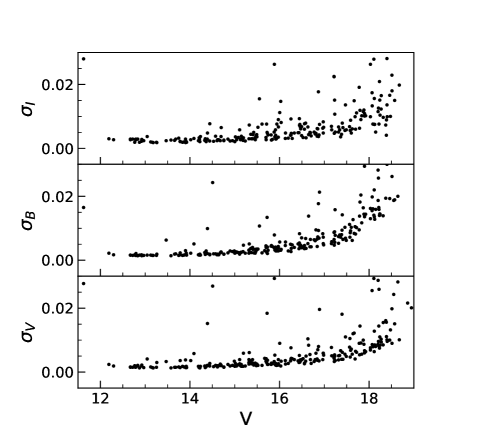
where , , and , , are the standards and instrumental magnitudes while , , and are the colour coefficients for , , and filters respectively. , and are the zero-points for respective filters and is the airmass. The colour coefficients and zero points obtained during the transformation for each cluster are listed in Table 3. The typical error in our photometry in different filters as a function of mag is plotted in Fig. 2. It is perceptible from this figure that the error is less than 0.05 mag up to for , and filters. We converted and pixel position of stars into the right ascension (RA) and declination (DEC) of using the and tasks in the IRAF.
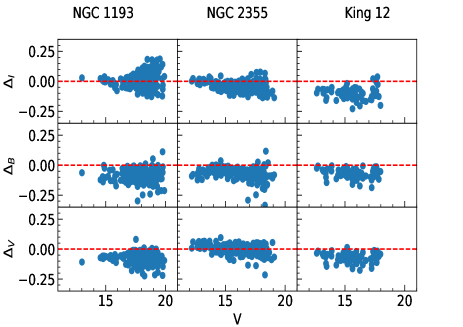
We also compared our photometry with the literature values shown in Fig. 3, the red dotted line denotes the zero difference. For this comparison, we used data from Kyeong et al. (2008), Ann et al. (1999) and Lata et al. (2014) for the clusters NGC 1193, NGC 2355 and King 12 respectively. Our photometry looks analogous to the literature values in each filter. The mean differences are -0.06 0.04, -0.001 0.04, -0.07 0.04 mag in filter, -0.09 0.05, -0.06 0.050, -0.07 0.04 mag in filter and 0.008 0.0, -0.03 0.04, -0.09 0.05 mag in filter for the clusters NGC 1193, NGC 2355 and King 12, respectively.
3 Photometric and Kinematical data from Gaia DR3
Gaia, a space observatory of the European Space Agency, unleashed its third data release (Gaia DR3) on 13 June 2022. Gaia DR3 provides full astrometric solutions for 1.46 billion sources, including positions, proper motion, and parallax for stars having magnitude . Gaia DR3 also includes photometric data in , and filters for 1.806 billion, 1.54 billion, and 1.55 billion stars, respectively, and radial velocity data for 33 million stars (Gaia Collaboration et al., 2021a, b). Since the field of view of the observed clusters using the 104-cm Sampurnanand telescope is small, we took advantage of Gaia DR3 data with more extensive spatial coverage. We used photometric data in three Gaia bands which are , , and , for a field having 30 arcmin diameter to cover the potential extent of the clusters. In addition, kinematical data for these stars (proper motion, radial velocity, and parallax) is taken from the Gaia DR3 catalogue. In this analysis, we only incorporated the stars having a maximum proper motion error of 1 mas .
4 Selection of cluster members and mean proper motion
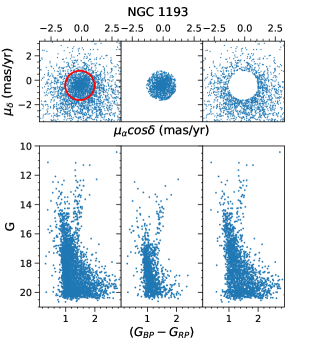
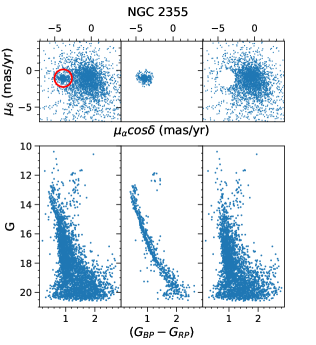
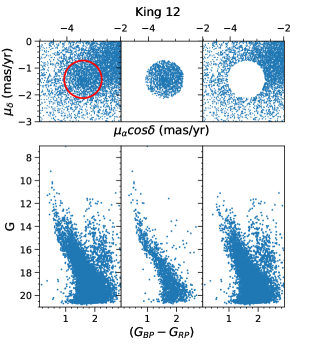
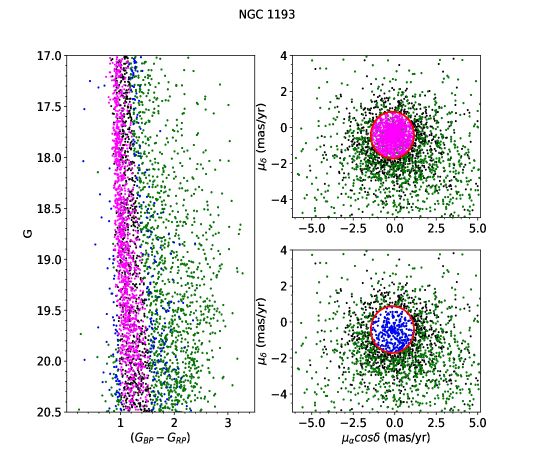
Due to the proximity of the Galactic disc, the Galactic open clusters are highly degraded by the field stars, which include both background and foreground stars. Hence the first measure of our analysis is to decontaminate the sample of cluster stars. For the present analysis, we selected the members of these clusters using the proper motion from the Gaia DR3 catalogue and then calculated their membership probability using the method given by Balaguer-Núnez et al. (1998) and described by Sariya & Yadav (2015) and Sariya et al. (2017). For the initial separation of cluster stars from the field stars, the plot between proper motion in RA () and proper motion in DEC () known as Vector Point Diagrams (VPDs) are used and shown in the top panels of Fig. 4. In the first top panel from the left, a compact clump of stars is differentiable from the scattered field stars for all three clusters. The stars of these clumps have similar proper motions and hence are selected as the most probable cluster members by defining an eye-estimated circle (shown in red) around it. The circle radius selection is performed to minimize the contamination from the field as well as save the faint members of the cluster. The chosen circle radii are 1.2, 1.2, and 0.7 mas for NGC 1193, NGC 2355 and King 12, respectively. The lower first panel from the left shows the colour-magnitude diagram (CMD) of total stars in the field of diameter 30′. The second panel shows VPD and CMD for the stars inside the red circle. A precise sequence for all the clusters is visible in all three clusters. The third panel shows VPD and CMD for the stars outside the circle in VPD.
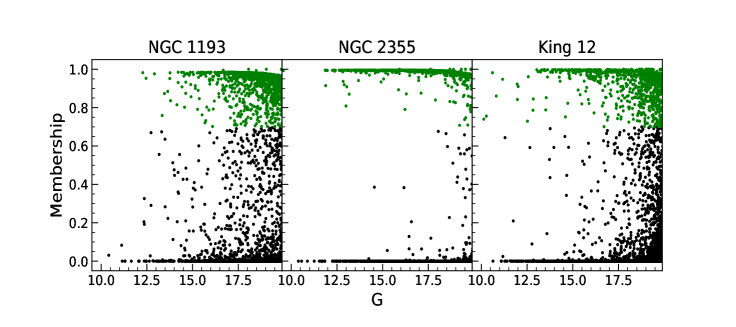
To calculate the membership probabilities of the stars in the clusters, we require the centres of the cluster as well as the field distributions. These are calculated by fitting the Gaussian over the histograms of closely packed stars and other group of sparsely packed stars in VPD. The calculated proper motion centre for the cluster distribution is (-0.16, -0.45), (-3.84, -1.05) and (-3.32, -1.37) mas , and the centre for the field distribution is (0.34, -1.63), (-0.44, -1.20) and (-1.82, -0.69) mas for the clusters NGC 1193, NGC 2355, and King 12 respectively. The proper motion dispersion for the cluster distribution is calculated using the method given by Jones (1970) and reported by Sagar & Bhatt (1989) as 0.41, 0.18, and 0.09 mas , and for the field distribution, it is calculated as (3.81, 3.06), (3.23, 3.80), and (3.81, 3.06) mas for the clusters NGC 1193, NGC 2355, and King 12, respectively. The membership probability for the stars in the three clusters is plotted against their G magnitude which is shown in the Fig. 5. For this analysis, we only used the stars having membership probability as shown with green colour and the black points signify the rejected stars.
We again selected the cluster members according to the parallax of the cluster members. We calculated the mean parallaxes for the chosen stars above and then picked stars having parallax less than times the mean parallax. So the final catalogue of cluster members consists of the stars with membership probability and a parallax angle within from the mean cluster parallax.
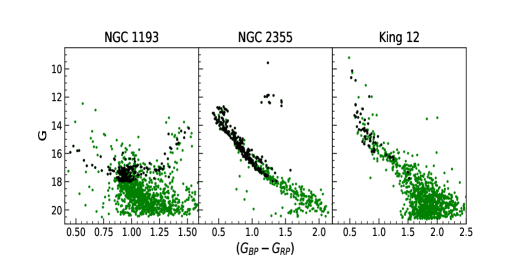
We also inspected the members of these clusters in Cantat-Gaudin et al. (2020). We found 215, 260, and 40 members having membership probability 0.7 for the clusters NGC 1193, NGC 2355, and King 12, respectively. While in our analysis, we identified 1432, 577, and 1107 stars having membership probability 0.7 for the clusters NGC 1193, NGC 2355, and King 12, respectively. The cluster members from both analyses are shown in Fig. 6.
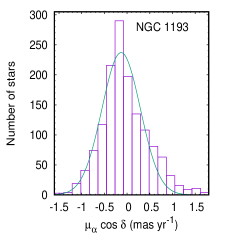
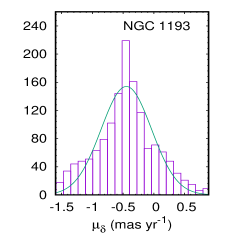
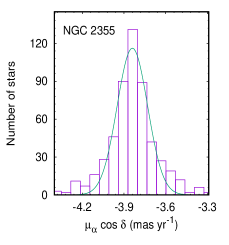
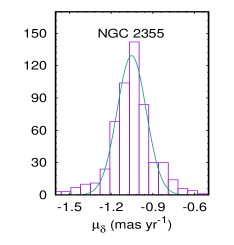
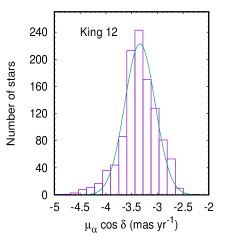
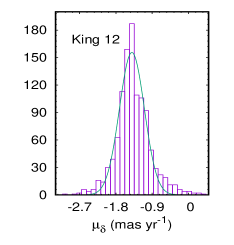
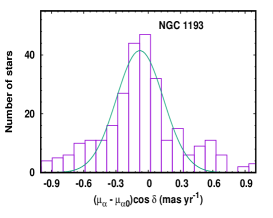
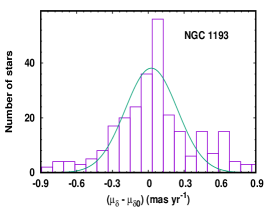
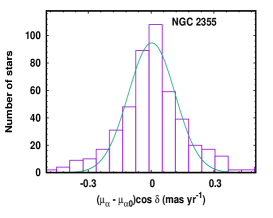
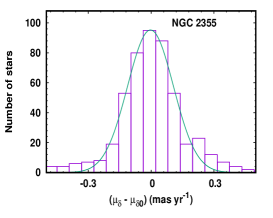
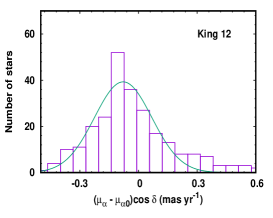
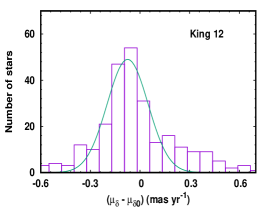
The mean proper motions for the clusters are estimated by fitting a Gaussian over histograms of and as shown in Fig. 7. Hence, the mean proper motions of the clusters are estimated as and mas for NGC 1193; and mas for NGC 2355 and , and mas for King 12.
4.1 Distance estimation using parallax
We utilised the approach given by Luri et al. (2018), which suggests the estimation of the distance of a cluster using its average parallax value. Due to the associated errors in the parallax data from Gaia DR3, we calculated their weighted mean using the probable cluster members selected above. The mean parallax angles are , and mas for the clusters NGC 1193, NGC 2355, and King 12, respectively. These values are corrected for the Gaia DR3 parallax zero-point (-0.021 mas) offset suggested by Groenewegen (2021),
According to Bailer-Jones (2015), distance cannot be estimated by just inverting the Gaia parallax. They suggested a probabilistic analysis to determine distance and their uncertainties from the Gaia parallax data (Bailer-Jones, 2015). By embracing the method illustrated by Bailer-Jones et al. (2018), we determined the distances of the clusters NGC 1193, NGC 2355, and King 12 as , , and kpc, respectively. For the clusters NGC 1193 and NGC 2355, these values are in good agreement with those in Table 1; however, for King 12, the distance obtained in the present analysis is higher than that given in WEBDA.
5 Basic Parameters of the Clusters
5.1 Cluster center and radius
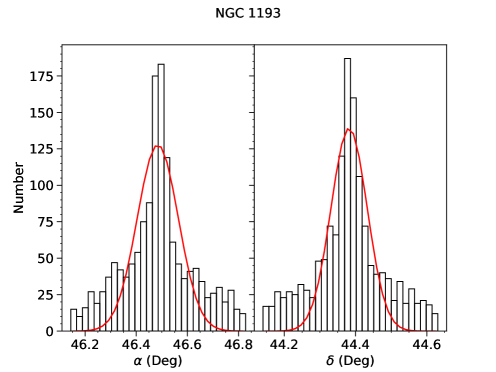
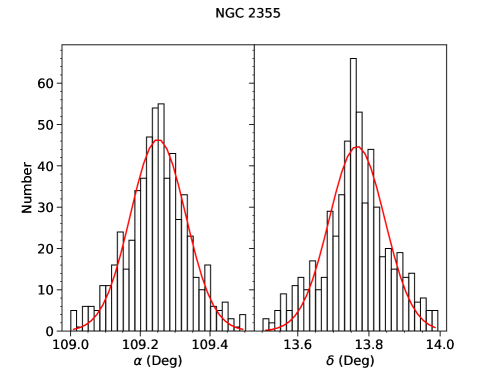
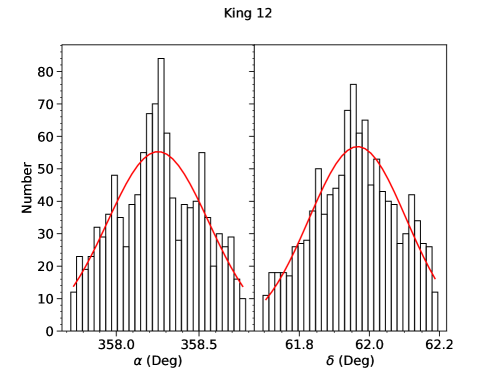
Generally, OCs are systems of thinly dispersed and loosely bound stars, but they maintain the highest stellar density at their centre. For meticulous determination of cluster centre, we fitted Gaussian over histograms of right ascension (RA) and declination (DEC), which is shown in Fig. 8. The estimated central coordinates for the clusters NGC 1193, NGC 2355, and King 12 are (46.484, +44.382), (109.251, +13.768), and (358.246, +61.967) degrees, respectively.
| Cluster | Parallax | ||||||
|---|---|---|---|---|---|---|---|
| (deg) | (deg) | (mas) | (kpc) | (km/sec) | (mas/yr) | (mas/yr) | |
| NGC 1193 | 46.484 | +44.382 | |||||
| NGC 2355 | 109.251 | +13.768 | |||||
| King 12 | 358.246 | +61.967 |
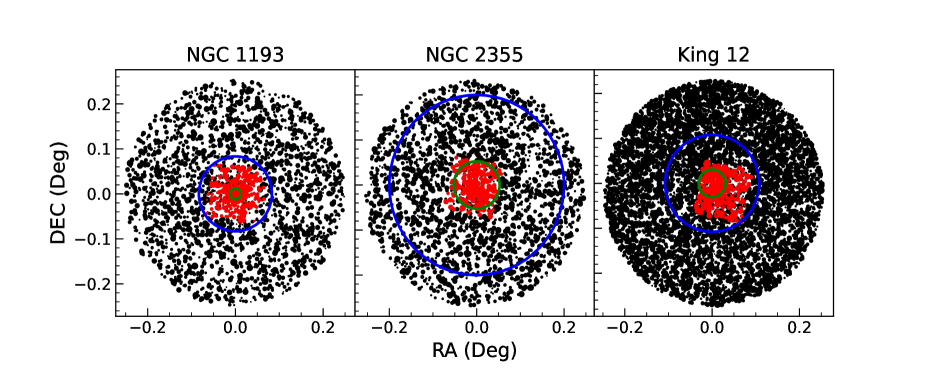
We have analyzed data of a larger area for each cluster as compared to their
visual size cited in the literature so that we can determine the precise sizes of the clusters and also
find the existence of corona.
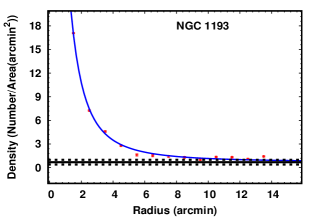
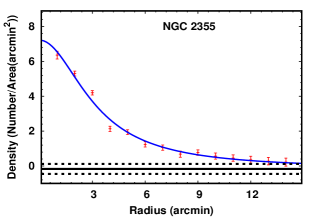
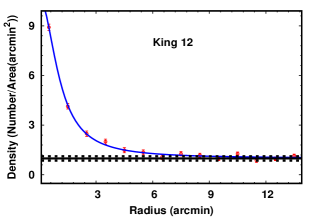
To accomplish this goal, we plotted the radial surface density profile (RDP) for
each of the clusters under study.
We divided the cluster area into concentric
rings having the same thickness of and then computed the stellar density in each ring. The stellar densities are plotted in Fig. 9
against distance from the cluster centre.
We fitted King profile (King, 1962) on the RDP of each cluster by adopting the least-square method, as shown
by the blue curve in Fig. 9.
The equation of the King profile is expressed as:
| (4) |
where is the background density, is the central density and is core radius. The core radius of a cluster can be defined as the distance from the cluster centre where the stellar density becomes half of the density at the cluster’s centre. The resultant parameters from this fitting for all the clusters are listed in Table 5. By visual examination of this fitting, the radius of clusters is determined as 5 0.4, 12 0.3, and 6.5 0.5 arcmin for the clusters NGC 1193, NGC 2355, and King 12, respectively and there is no signature of corona in any cluster. We found that the central stellar density is more pronounced for cluster NGC 2355 than the other clusters. Hence the chances for survival of NGC 2355 are more as compared to NGC 1193 and King 12 based on their higher central concentration. The forthcoming sections will examine the factors impacting the clusters’ survival.
| Cluster | Radius | |||
|---|---|---|---|---|
| (arcmin) | () | (arcmin) | () | |
| NGC 1193 | ||||
| NGC 2355 | ||||
| King 12 |
5.2 Age, reddening, metallicity and distance of the clusters
The basic parameters of the clusters are determined by fitting theoretical evolutionary isochrones from Marigo et al. (2017) on the colour-magnitude diagrams of the clusters. These isochrones are emanated from the evolutionary tracks computed with PARSEC (Bressan et al., 2012) and COLIBRI (Marigo et al., 2013) codes. Details of these isochrones can be found in (Caffau et al., 2011; Rangwal et al., 2019). In this section, we used the magnitude of stars in different filters for a reliable determination of cluster properties through isochrone fitting. Along with data in the optical range from Gaia DR3, and the observations from 104-cm ST, we also included near-IR data from 2MASS; except for NGC 1193, we could not find enough member stars to fit isochrones. The uncertainty in the parameters determined in this section is computed from the range in a good fit of isochrones. The isochrones fitting and resulting parameters for each cluster are discussed as follows:
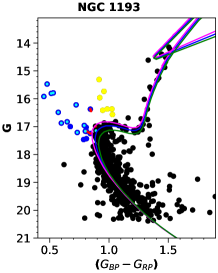
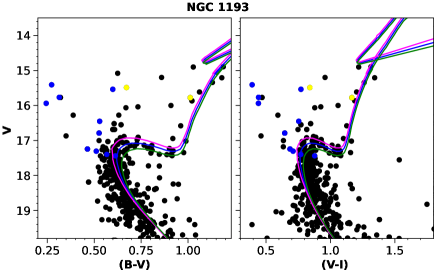
NGC 1193: For this cluster, we plotted three colour-magnitude diagrams i.e. , , and and shown in Fig. 10. After performing several iterations with isochrones of different ages and metallicity, we found the best fitted isochrones of and age ( ) Gyr. The fitting gives the distance modulus as mag. From this, the heliocentric distance of the cluster is found to be kpc. This distance is proximate to the distance calculated by the mean parallax of the cluster. We have also calculated the values of colour excess , and as 0.26, 0.16 and 0.20 mag respectively.
The stars which are bluer and brighter than the turn-off stars in the CMD of a star cluster are known as Blue straggler Stars (BSS), and evolved counterparts of these stars are known as Yellow Straggler stars (YSS) (Jadhav & Subramaniam, 2021b). Based on their positions in the CMD in Gaia filters, we found seventeen blue straggler stars with membership probability 95 % and seven yellow straggler stars with membership probability 88 % in this cluster, as shown in blue and yellow, respectively. We cross-matched these blue stragglers with the catalogue of blue stragglers by Rain et al. (2021) and Jadhav & Subramaniam (2021a). Rain et al. (2021) and Jadhav & Subramaniam (2021a) catalogued twelve and eighteen BSS, respectively, for this cluster. Among the twelve common stars between the two catalogues, as shown by the cyan points in the cluster CMD, we confirm eleven stars as BSS, and the twelfth star lies on the cluster main-sequence hence not a BSS. The remaining six BSS claimed by Jadhav & Subramaniam (2021a) are also plotted in the same CMD with red colour, three of which we confirm as cluster BSS one lie on the main-sequence hence not BSS and the remaining two located beyond the cluster region hence are field BSS. In addition, we found four more BSS not compiled in the catalogues mentioned above. The yellow stragglers found in our analysis are shown by yellow colour in the cluster CMD, and none of these YSS is catalogued in these catalogues.

We also inspected the location of these BSS and YSS and found that all the BSS are located near to the cluster centre with a maximum radius of 1.7 arcmin except for one BSS, which is located at a distance of 4.5 arcmin from the centre of the cluster, while only three YSS are located close to the cluster centre (having a maximum distance of 1.5 arcmin), and four are located on the outskirts of the cluster with a maximum distance of 5 arcmin. Since BSS are more massive than the MS stars hence the location of BSS towards the cluster’s centre might be a result of the mass segregation. According to (Jadhav & Subramaniam, 2021b), the low mass BSS found in the clusters older than 2 Gyr are most likely formed by mass transfer between the companion binary stars. Hence, we expect a mass transfer mode of formation for BSS found in this cluster.
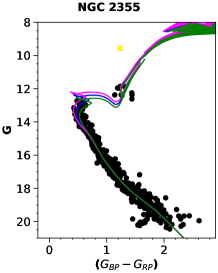
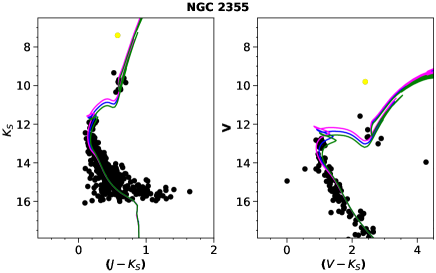
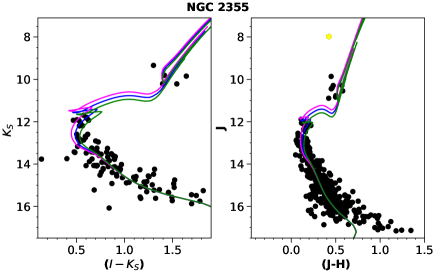
NGC 2355: We plotted seven CMDs (, , , , , and ) for this cluster and shown in Fig. 11. From the best-fitted isochrone in all these CMDs, we found , age as Gyr and distance modulus as mag. The heliocentric distance is derived as kpc. The distance derived here agrees with the distance derived using parallax. Values of colour-excess , , , , , and are estimated as 0.23, 0.15, 0.20, 0.60, 0.03, 0.075, and 0.33 mag respectively.
We identified an unusual star above the red clump of the cluster, which was also reported by Soubiran et al. (2000b) as a straggler star. This might be a probable Yellow Straggler star and is shown in the CMDs with yellow colour. The membership probability of this star is more than 90 %. This star is saturated in the filter.
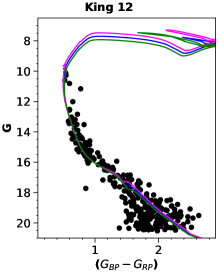
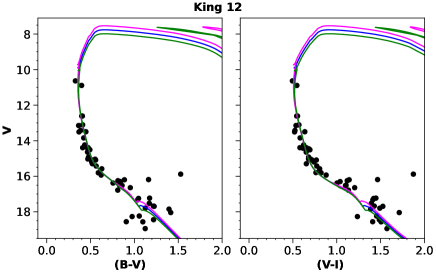
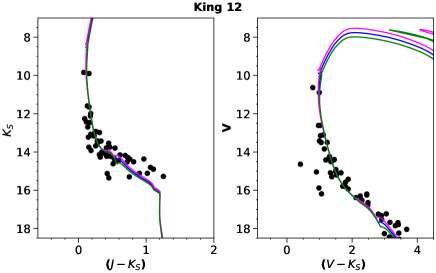
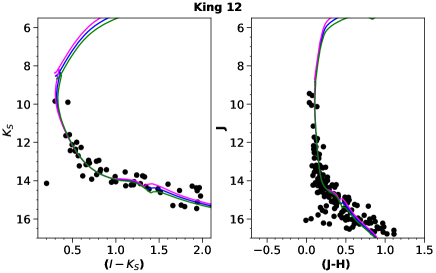
King 12: Fig. 12 shows CMDs in , , , , , and planes for the cluster King 12 with best-fitted isochrones. From the best-fitted isochrones, the cluster’s age, metallicity, and distance modulus values are determined as Myr, 0.0152 and mag, respectively. The distance corresponding to the distance modulus is 2.63 0.06 kpc. The isochrone fitting gives the value of , , , , , and as 0.87, 0.58, 0.75, 1.70, 0.20, 0.29, and 0.80 mag, respectively.
| Cluster | ||||
|---|---|---|---|---|
| (mag) | (mag) | (mag) | (mag) | |
| Normal | 0.76 | 1.25 | 0.33 | 0.49 |
| NGC 1193 | 0.62 0.10 | 1.25 0.05 | - | - |
| NGC 2355 | 0.65 0.12 | 1.33 0.11 | 0.33 | 0.50 0.10 |
| King 12 | 0.66 0.03 | 1.29 0.03 | 0.34 0.02 | 0.50 0.02 |
We calculated the color-excess ratios as , , and and tabulated in Table 6 in different filters for each cluster. The normal values are taken from Dutra et al. (2002); Dias et al. (2012); Wang & Chen (2019) following the general interstellar law for = 3.1. All the values are comparable with the normal values suggesting the presence of general interstellar dust in the direction of these clusters. A comparison between parameters calculated in the present analysis and literature values is given in Table 7. The table displays a sound consensus of parameters determined in current studies with the literature.
| Author | Age | DM | |
| (Gyr) | (mag) | (mag) | |
| NGC 1193 | |||
| Kaluzny (1988) | 8 | 13.8 | 0.33 |
| Tadross (2005) | 8 | - | 0.10 0.06 |
| Kyeong et al. (2008) | 5 | ||
| Present study | 0.16 | ||
| NGC 2355 | |||
| Kaluzny & Mazur (1991) | - | - | 0.12 |
| Soubiran et al. (2000b) | 1 | 12.5 | 0.16 |
| Present study | 0.15 | ||
| King 12 | |||
| Tripathi et al. (2013) | 0.01 | 12.00 0.15 | |
| Davidge (2012) | 0.02 | - | - |
| Glushkova et al. (2013) | 0.07 | 12.05 | |
| Lata et al. (2014) | 0.01 to 500 | 14.1 | 0.58 |
| Present study | 0.58 |
6 Luminosity and mass function of the clusters
6.1 Photometric completeness and contamination from field
The true number of cluster members is required to generate the luminosity function for a cluster. The estimation of the number of cluster members can be affected by two factors: the completeness of the data set and the inclusion of field stars. This analysis uses stars found in the Gaia DR3 catalogue. The Gaia DR3 catalogue has the same sources with kinematical data and photometry in three broad bands as in Gaia EDR3. Gaia EDR3 is complete for the sources having . For the sources fainter than 17 mag, completeness depends on the density. Since the open clusters under study are not such a dense and crowded field, data incompleteness may not be affected. For Gaia DR2 stars, Boubert & Everall (2020) computed a completeness of more than 90 percent upto 20 G mag stars in an uncrowded field. Since the completeness of EDR3 is higher than DR2 in fainter regions (van Leeuwen et al., 2021), we expect more than 90 per cent completeness for the stars up to 20 mag. To construct the luminosity function, we only included stars brighter than 20 mag for the current analysis.
We have selected the cluster members using Gaia DR3 proper motion and parallax to minimize the field star contamination. Field stars are not entirely separated from the cluster region even after involving these criteria. Also, some field stars having similar motion as the cluster stars might be included as cluster members. We adopted the method used by Milone et al. (2012) to overcome these possibilities. The VPDs of the three clusters shown in Fig. 4 have two types of distributions. One is that the cluster distribution is not separated from the field stars, which is valid for the cluster NGC 1193 and the other is that the cluster distribution is entirely different from the field star distribution, which is true for the clusters NGC 2355 and King 12. So Milone et al. (2012) suggested two different approaches for these different distributions.
The first approach is shown in Fig. 13. For this, only main-sequence stars have been used. The figure shows CMD and VPD of the stars in cluster NGC 1193. This method uses CMD and VPD to calculate the number of field stars. There are three populations of stars in this diagram: the first population is inside the VPD circle as well as on the main-sequence (magenta), the second population is located inside the VPD circle but outside the main-sequence (blue), and the third population is outside the VPD circle as well as the main-sequence (green). So the stars in blue are field stars but got selected as cluster stars; similarly, the main-sequence may contain field stars. The number of field stars can be calculated as follows:
| (5) |
where, is total number of field stars, is the total number of stars which are outside the circle in VPD, is the total number of stars inside the circle in VPD and outside of the CMD, and is the total stars outside of the CMD. Using this method number of the field stars is calculated in every magnitude bin and then calculated the number of cluster members in each magnitude bin.
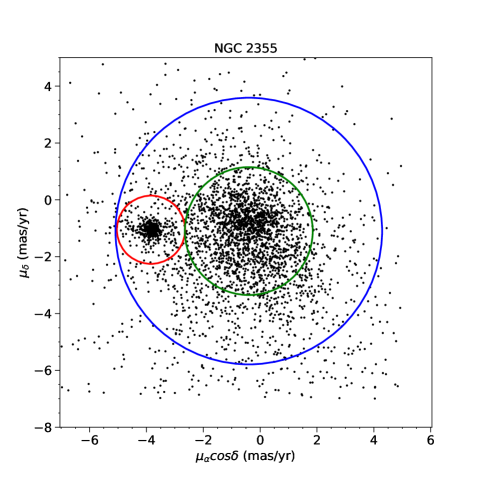
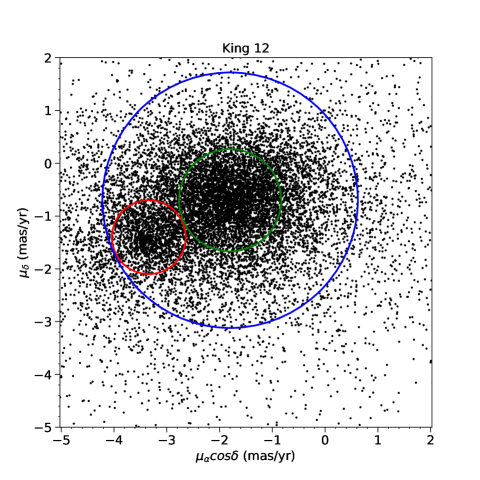
The second approach for the distribution of VPD of clusters NGC 2355 and King 12 is shown in Fig. 14. Two different populations for cluster and field are visible in the VPDs, but the possibility of field stars with similar proper motion stays. To calculate the number of field stars, three circles are drawn on the cluster VPD. One is drawn around the cluster population having the same radius as used in section 14 shown in red colour, the second is around the field population shown in green colour, and the third one is a concentric circle around the field population in blue colour. The two concentric circles should touch the red circle. So now the VPDs are divided into three regions, cluster region (), field region (), and outer annulus (). So the number of field stars inside the cluster region can be calculated as follows:
| (6) |
where, is the number of field stars in region , is the number of stars in region and, and are the area of the regions and respectively. We calculated the field stars and actual cluster members in each magnitude bin using this method.
The number of field stars inside the cluster region in each magnitude bin is listed in Table 8. The cluster member selection using proper motion eliminates all the bright field stars but includes several faint field stars. The number of cluster members calculated in this section produces the luminosity function, mass function, and mass segregation in the open clusters under study.
| (Mag) | NGC 1193 | NGC 2355 | King 12 |
|---|---|---|---|
| 10 - 11 | - | - | 0 |
| 11 - 12 | - | 0 | 0 |
| 12 - 13 | - | 0 | 0 |
| 13 - 14 | - | 1 | 1 |
| 14 - 15 | - | 2 | 2 |
| 15 - 16 | - | 3 | 3 |
| 16 - 17 | - | 5 | 5 |
| 17 - 18 | 09 | 6 | 10 |
| 18 - 19 | 21 | 10 | 21 |
| 19 - 20 | 29 | 12 | 40 |
6.2 Luminosity function
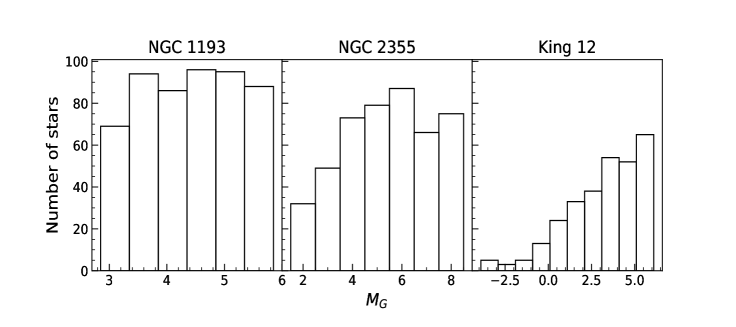
The luminosity function reflects the distribution of stars in a cluster according to the luminosity. As stated above, the luminosity function for the main-sequence stars in each cluster is generated from true cluster stars calculated above. The apparent magnitude of these stars is converted into the absolute magnitude using the distance modulus calculated in section 5.2. The number of stars in each magnitude bin was calculated and then corrected for the field star contamination and plotted in Fig.15 for the clusters NGC 1193, NGC 2355, and King 12.
From Fig. 15, it is concluded that NGC 1193 has a flat luminosity function which implies that with age brighter stars of the cluster are evolved, but it still holds its fainter stars. The luminosity function of NGC 2355 increases up to 6 mag but decreases later. For King 12, an increasing luminosity function is observed. This implies that the cluster retains most of its low mass stars due to its very young age, hence not much dynamically evolved. One dip between -2.8 to -1.9 is also visible for this cluster which was also observed by Glushkova et al. (2013).
6.3 Mass function and Mass segregation
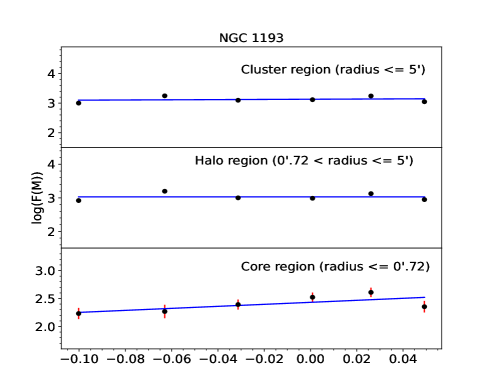
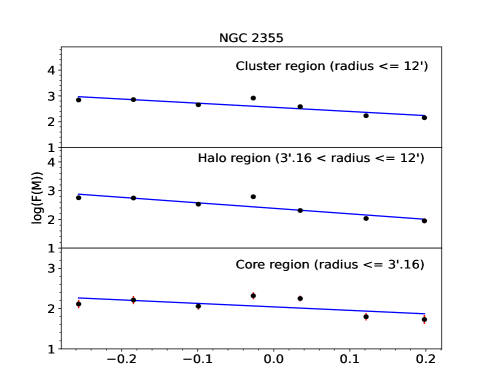
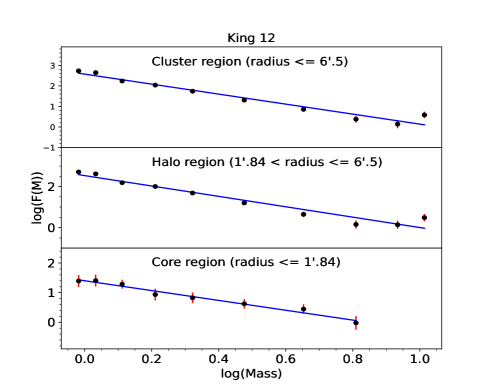
In this section, the luminosity function of a cluster is converted into the mass
function with the help of best-fitted theoretical evolutionary tracks, and shown in
Fig. 16 for the clusters NGC 1193, NGC
2355 and King 12, respectively.
For this conversion, theoretical models given by Marigo
et al. (2017) have
been used as discussed in section 5.2.
By least-square fitting, we calculated the slope of the distribution by the fitting of the following equation:
| (7) |
where is the number of stars in a particular mass bin , and is the central mass of that bin. The mass function slope can be determined from the above equation. The mass function slope is calculated in three regions for each cluster, i.e., core, halo, and the entire cluster region. The radii values of these cluster regions are taken from section 5.1. The values of mass function slopes for all the regions in each cluster are listed in Table 9.
| Cluster | Mass | Mass function slope () | ||
|---|---|---|---|---|
| range | Core | Halo | Entire region | |
| NGC 1193 | 0.75 - 1.15 | |||
| NGC 2355 | 0.50 - 1.69 | |||
| King 12 | 0.90 - 10.97 | |||
For NGC 1193 and NGC 2355, the mass-function slopes for all three regions are less than the Salpeter value (Salpeter, 1955). The mass function slope for the core and entire cluster region of King 12 is higher than the Salpeter value, while it is lower for the halo region. Mass function slopes are becoming flatter towards the outer region as compared to the core region in all the clusters.
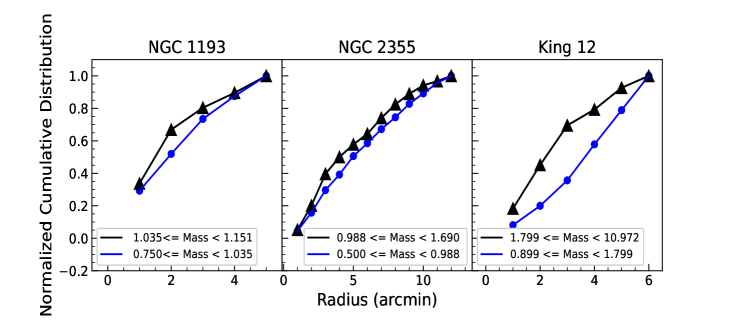
The cumulative radial distribution in two mass ranges are shown in Fig. 17 for the clusters NGC 1193, NGC 2355, and King 12. Using this figure, we have studied the signature of mass segregation in the sample clusters. By the visual examination of the Fig. 17, it is evident that the two populations are mixed for the clusters NGC 1193 and NGC 2355 but for King 12 it looks like the high-mass stars are more centrally located than the fainter population. We then examined these populations statistically using the Kolmogorov-Smirnov (K-S) test. We find a very low percentage of confidence level for these populations to be distinct. So we conclude that mass-segregation is not present in these clusters.
7 Kinematics and dynamics of the clusters
7.1 Internal kinematics
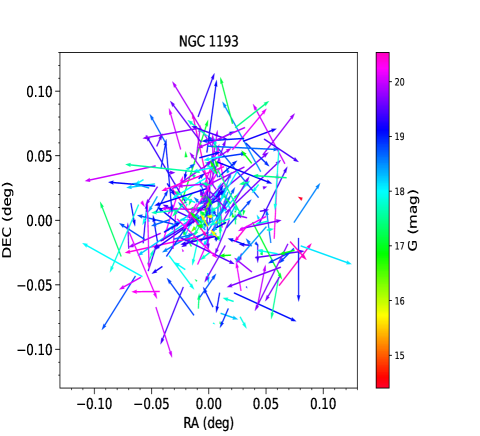
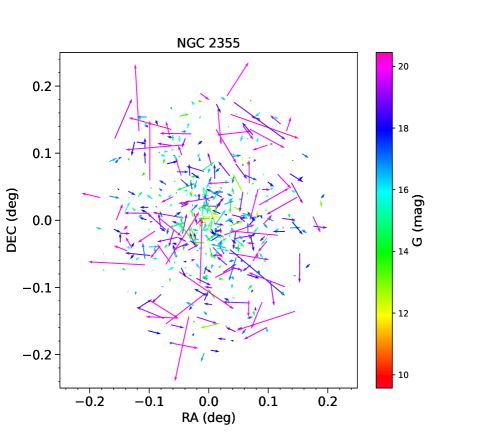
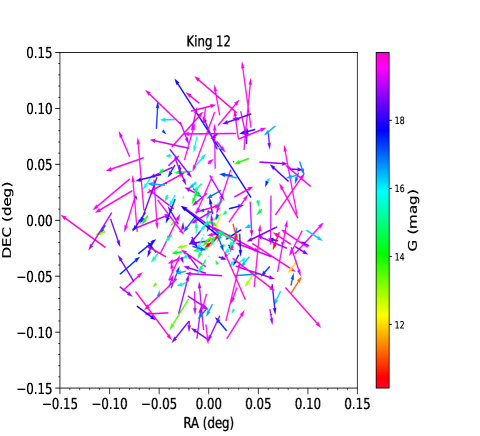
Fig. 18 shows the internal kinematics of the three studied clusters. In this figure, the motion of the individual star relative to the mean cluster motion is plotted in cluster space within the cluster radius. The length of the arrows represents the magnitude, and the direction of the arrows shows the direction of the relative motion. The colour of the arrows represents the magnitude in filter. These figures show that all the stars are moving randomly, stars in NGC 1193 are moving with larger velocities than the other two clusters. The mean relative motion of stars in the clusters is calculated using the histogram shown in Fig. 19. In this figure, we plotted the histograms of the relative motion of stars in the clusters and fitted a Gaussian over it. From this histogram, mean relative motion is calculated as (), () and () for the clusters NGC 1193, NGC 2355 and King 12, respectively. Based on these values, it can be deduced that the overall relative motion for NGC 2355 is nearly zero in both directions, whereas stars in NGC 1193 move outward in the RA direction only. The stars in King 12 have negative relative motion in both directions, indicating that the stars of this cluster are moving outward and, thus cluster is expanding.
7.2 Dynamics in the Galaxy
| Cluster | ||||||
|---|---|---|---|---|---|---|
| (kpc) | (kpc) | (radians) | (km/sec) | (km/sec) | (km/sec) | |
| NGC 1193 | 12.20 | 0.20 | -0.92 | |||
| NGC 2355 | 10.13 | 0.08 | 0.42 | |||
| King 12 | 10.25 | 0.30 | 0.01 |
We studied the dynamics of the three clusters in the Galaxy by deriving their orbits with the help of the Galactic model given by Allen & Santillan (1991). For this analysis, we followed the procedure discussed in Rangwal et al. (2019). For orbit calculation, we have included the updated values of constants in Galactic potentials given by Bobylev et al. (2017). The position and velocity components for all the clusters are taken from Table 4. The radial velocity data for NGC 1193 and NGC 2355 come from Gaia DR3 while, for King 12, it is adopted from Kharchenko et al. (2007). To transform the clusters’ heliocentric position and velocity coordinates into Galactocentric coordinates, transformation matrices given by Johnson & Soderblom (1987) were used. For this conversion, the coordinates of the Galactic centre and Galactic North pole are taken from Reid & Brunthaler (2004) as (17:45:32.224, -28:56:10) and (12:51:26.282, 27:7:42.01) respectively. The position and velocity of the Sun are taken as (8.3,0,0.02) kpc and (-10.4, +237, +7.3) km/s. The resulting position () and velocity () components are listed in Table 10. The radial component is positive towards the Galactic centre, the tangential component is positive along the Galactic rotation, and the vertical component is positive towards the Galactic north pole.
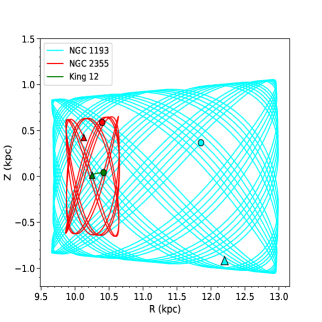
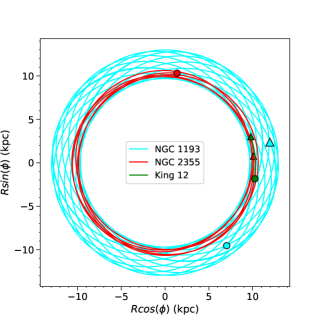
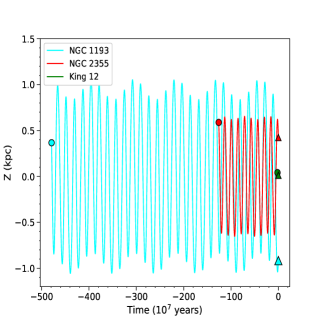
The path of the clusters in the Galaxy is integrated backwards in time equal to the age of the clusters from their current positions and shown in Fig. 20 with cyan, red and green colours for the clusters NGC 1193, NGC 2355 and King 12 respectively. The left panel of this figure shows a plot of the distance from the Galactic centre and the height from the Galactic disc. The middle panel shows a plot between the two components of the radial distance from the Galactic centre. The right panel shows a plot between the time the cluster takes to reach its present-day position from its birth and the vertical distance from the Galactic disc. Here, the present-day position is denoted by zero, and negative time denotes its past lifetime. The filled circles denote the present-day positions, and the filled triangles denote the birth positions of the clusters in all the panels. The orbital parameters of all three clusters are tabulated in Table 11. As shown in Fig. 20, King 12 have not completed even one revolution; hence to calculate the orbital parameters, we again integrated its motion for a time period of 800 Myr. In this table, is the eccentricity of the orbits, and are the apogalactic and perigalactic distances respectively, is the energy, is the third component of the momentum, is the time period of radial motion.
| Cluster | |||||||
|---|---|---|---|---|---|---|---|
| (kpc) | (kpc) | (kpc) | (100 kpc km/s) | (Myr) | |||
| NGC 1193 | 0.001 | 12.90 | 12.98 | -1.06 | -9.17 | -26.84 | 346 |
| NGC 2355 | 0.001 | 10.64 | 10.61 | 0.66 | -9.72 | -24.98 | 256 |
| King 12 | 0.000 | 11.59 | 11.58 | -0.05 | -9.39 | -26.56 | 247 |
The left panel of Fig. 20 infers that the side view of the orbits looks like a box, and the middle panel infers that all the clusters are moving in a circular orbit around the Galactic centre. All three clusters’ birth and present-day positions are located towards the Galactic anticenter. The eccentricity for the clusters NGC 1193 and NGC 2355 is nearly zero and completely zero for King 12, indicating that the clusters’ orbit is circular. Comparing the values from Table 11, it is evident that the cluster NGC 1193 is tracing the highest distance from the Galactic disc. In the right panels of Fig. 20, the maximum distance in the Z direction is constant with time for NGC 2355, while it changes periodically for NGC 1193. A similar change in Z is visible in the left panels that the maximum value of Z is constant for NGC 2355, but it decreases on going towards the Galactic centre. It may be due to the birth positions of the clusters, as the birth position of NGC 2355 is closer to the Galactic disc, while the birth location of NGC 1193 is more than double. So NGC 2355 is experiencing almost constant force from the Galactic disc while this force is increasing towards the Galactic centre for the cluster NGC 1193. King 12 is a very young cluster; hence not completed even one circle. This cluster was born even closer to the Galactic disc, moving very immediately to the disc, leading to a shorter life for this cluster. The comparatively small force from the Galactic disc on NGC 1193 is reflected as longer velocity vectors in Fig. 18 compared to the other two clusters. We compared the orbital parameters calculated in this analysis with Wu et al. (2009) in which we found data only for NGC 2355 and King 12. We found that the orbits in Wu et al. (2009) are more eccentric than in the present study. It is because Wu et al. (2009) have taken the same integration time for all the clusters, whereas we have taken it equal to the cluster’s age. Also, they adopted a slightly different approach for calculating the eccentricity than the present study.
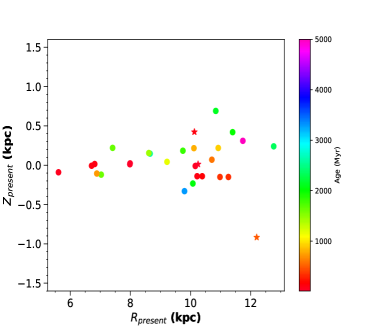
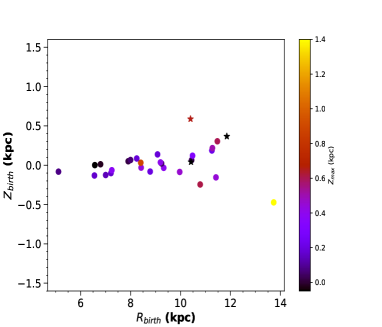
To investigate how orbital parameters behave with the cluster properties we created two diagrams that are displayed in Fig 21 and 22. To produce these figures, we included a total of 29 open clusters, in which 26 open clusters are included from our past studies (Rangwal et al., 2019; Bisht et al., 2020b; Bisht et al., 2020a; Sariya et al., 2021; Bisht et al., 2021b, c, a; Bisht et al., 2022a; Bisht et al., 2022b; Sariya et al., 2023) and three clusters are from the present analysis. The three clusters from the current analysis are shown by asterisk symbols while the clusters from the earlier analysis are represented by filled circles. The present-day positions of the clusters in the Galaxy as a function of their ages are plotted in the left panel of Fig. 21, which shows that all the young clusters are quite near to the Galactic disc. In contrast, older clusters are spread over comparatively at a longer distance. In the right panel of this figure, the birth positions of the clusters are plotted as a function of the maximum distance travelled by the clusters in the Z direction. This figure shows that the clusters born close to the Galactic disc are orbiting closer to it while those born at a larger distance from the Galactic core and Galactic disc are tracing higher scale height.
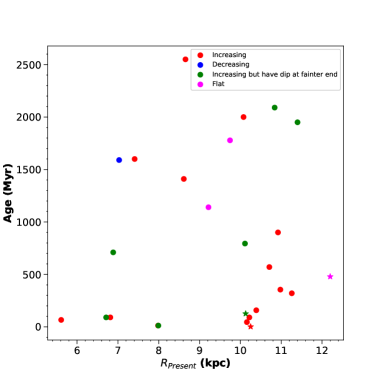
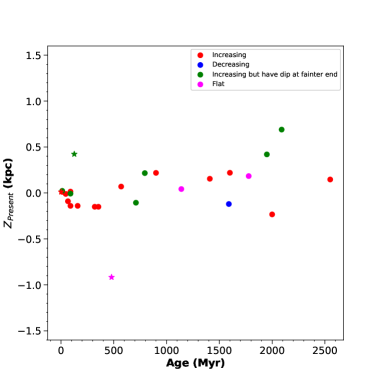
Tarricq et al. (2022) have studied 389 open clusters in the Galaxy and they found that as a cluster gets older, its halo becomes less populated and core size decreases, resulting from mass segregation and evaporation of stars from the cluster. They also concluded that there are several physical processes along with mass segregation, which led to the disruption of the cluster. The other factor which affects the cluster disruption might be their closeness to the galactic disc is visible in Fig. 22. The left panel of Fig. 22 shows the relationship between distance from the Galactic centre, age, and luminosity function of the clusters. There is no strong relationship evident from this diagram except a few young clusters located towards the Galactic centre have lost their faint stars. For more clear inference, a large sample is required. The right panel of this figure shows the relationship between age, distance from the Galactic disc and the luminosity function of the clusters. The young clusters that are very close to the Galactic disc have lost their fainter stars while the clusters, those are located far from the disc, have their fainter stars intact, even a few intermediate-age clusters have increasing luminosity functions.
8 Discussion and Conclusions
This article presents a detailed study of the three open clusters NGC 1193, NGC 2355 and King 12 using photometric and kinematic data. We selected the cluster members from the field population by calculating their membership probability. We analyzed data covering large areas to determine the true extent of the clusters and to check if any signatures of the corona were present in these clusters. We found that among the three clusters, NGC 1193 is a small and compact cluster, while NGC 2355 is a sparsely populated cluster populating a large area in the sky having a highly dense central region. We found no sign of corona in these clusters.
The fundamental parameters for the clusters were determined by fitting the isochrones on cluster CMDs. To get more reliable results, the CMDs were constructed in several wavebands using data from Gaia DR3 in filters, 104-cm ST in filters and 2MASS in filters. From these diagrams, we found that NGC 1193 is an old cluster of 4.79 Gyr, NGC 2355 is an intermediate age cluster of age 1.26 Gyr, and King 12 is a young open cluster of age 19 Myr. NGC 1193 consists of a thick main sequence than a usual main sequence of an open cluster. This cluster has several giant stars, blue stragglers and yellow stragglers. The members of NGC 2355 have very different kinematics from the field stars, showing a clean cluster population in CMDs.
The CMD of King 12 shows that the cluster has a handful of stars at its brighter end. As mentioned in the introduction of this article, Davidge (2012) and Glushkova et al. (2013) found a gap in the main sequence, which reflected a gap in the luminosity function of the cluster. In the current analysis, we found a gap in the main-sequence of the cluster in 11 to 12 mag in filter, but the gap is not there in CMDs constructed using Gaia and 2MASS filters. The number density of stars dropped in this region, which is reflected as a dip in the luminosity function of the cluster.
We have studied the internal and external dynamics of the clusters using the photometric and kinematical data from Gaia DR3. The influence of dynamical evolution on the clusters can be studied in terms of luminosity functions. We found a flat luminosity function for NGC 1193, which reveals that the high-mass stars evolved over time, and low-mass stars are still bound to the clusters. The luminosity function of NGC 2355 increases up to 6 mag, and a dip is observed afterwards. It is because the cluster has lost a few of its fainter members. We found an increasing luminosity function for cluster King 12, which indicates that the fainter stars bind this cluster due to its very young age. The mass function slopes for all the clusters are different from the solar neighbourhood for NGC 1193 and NGC 2355, the slope is flatter than the Salpeter (Salpeter, 1955) value, and for King 12, it is comparatively higher.
The two-dimensional velocity diagram shows the internal kinematics of the clusters plotted in Fig. 18. These figures show that the stars are moving randomly inside the clusters. We also calculated the clusters’ relative mean motions, as shown in Fig. 19. The dynamics of the clusters in our Galaxy are studied by determining their orbits using the Galactic potential models. From these plots, we can conclude that NGC 1193 is born at a more considerable distance from Galactic centre as well as Galactic disc and moving up to larger distances in both radial and perpendicular directions. It is moving up to a scale height of 1.21 kpc from the Galactic disc. NGC 2355 is moving at a comparatively low scale height, having a maximum value of 0.65 kpc from the Galactic disc and tracing approximately equal distance in every orbit in a perpendicular direction. King 12 was born very close to the Galactic disc hence going only upto 0.03 kpc distance from the Galactic disc. These orbits indicate that King 12 is highly affected by the Galactic tidal forces, therefore it is evaporating at a faster rate. The cluster’s higher negative mean relative motion in both directions can confirm this. The mean relative motion of NGC 2355 is zero, possibly because the cluster is comparatively larger in size, has a dense central region, and the stars have smaller velocities. NGC 1193 has negative relative mean motion in the RA direction only, and this cluster is least affected by the Galactic tidal forces; hence still bound by its fainter members despite its older age.
We tried to find a relation between the positions of the open clusters in the Galaxy and their age and orbits, for which we have included the results from our previous analyses and shown in Fig 21. From these plots, we found that the younger clusters are close to the Galactic disc, while the older clusters show a spread in their positions. The clusters born close to the disc are not tracing a larger scale height from the Galactic disc. We also investigated the relations of cluster positions with the luminosity functions in Fig. 22. These show that the open clusters, located at a more considerable distance from the Galactic centre, have increasing luminosity functions. Even young clusters close to the galactic disc have lost their fainter stars, and the older clusters located at a certain height from the Galactic disc have increasing luminosity functions.
Acknowledgements
We would like to thank the anonymous reviewer for taking the time and effort to review this manuscript and giving very valuable suggestions to improve the quality of this manuscript. We thank Prof. Annapurni Subramaniam and Dr Vikrant V. Jadhav for having such constructive discussions. This work has made use of data from the European Space Agency (ESA) mission Gaia (https://www.cosmos.esa.int/gaia), processed by the Gaia Data Processing and Analysis Consortium (DPAC, https://www.cosmos.esa.int/web/gaia/dpac/consortium). Funding for the DPAC has been provided by national institutions, in particular, the institutions participating in the Gaia Multilateral Agreement.
DATA AVAILABILITY
We have used two publicly available data sets: Gaia DR3 and 2MASS for the clusters NGC 1193, NGC 2355 and King 12. Data from Gaia DR3 can be accessed from: https://gea.esac.esa.int/archive/
Data from 2MASS can be accessed from: https://vizier.cds.unistra.fr/viz-bin/VizieR?-source=II/246
The photometric data of the three clusters NGC 1193, NGC 2355 and King 12 can be requested to Geeta Rangwal (geetarangwal91@gmail.com).
References
- Allen & Santillan (1991) Allen C., Santillan A., 1991, Rev. Mexicana Astron. Astrofis., 22, 255
- Ann et al. (1999) Ann H. B., Lee M. G., Chun M. Y., Kim S. L., Jeon Y. B., Park B. G., 1999, Journal of Korean Astronomical Society, 32, 7
- Bailer-Jones (2015) Bailer-Jones C. A. L., 2015, PASP, 127, 994
- Bailer-Jones et al. (2018) Bailer-Jones C. A. L., Rybizki J., Fouesneau M., Mantelet G., Andrae R., 2018, AJ, 156, 58
- Balaguer-Núnez et al. (1998) Balaguer-Núnez L., Tian K. P., Zhao J. L., 1998, A&AS, 133, 387
- Bisht et al. (2020a) Bisht D., Elsanhoury W. H., Zhu Q., Sariya D. P., Yadav R. K. S., Rangwal G., Durgapal A., Jiang I.-G., 2020a, AJ, 160, 119
- Bisht et al. (2020b) Bisht D., Zhu Q., Yadav R. K. S., Durgapal A., Rangwal G., 2020b, MNRAS, 494, 607
- Bisht et al. (2021a) Bisht D., Zhu Q., Elsanhoury W. H., Sariya D. P., Rangwal G., Yadav R. S., Durgapal A., Jiang I.-G., 2021a, PASJ, 73, 677
- Bisht et al. (2021b) Bisht D., Zhu Q., Yadav R. K. S., Rangwal G., Durgapal A., Sariya D. P., Jiang I.-G., 2021b, AJ, 161, 182
- Bisht et al. (2021c) Bisht D., Zhu Q., Yadav R. K. S., Ganesh S., Rangwal G., Durgapal A., Sariya D. P., Jiang I.-G., 2021c, MNRAS, 503, 5929
- Bisht et al. (2022a) Bisht D., Zhu Q., Yadav R. K. S., Rangwal G., Sariya D. P., Durgapal A., Jiang I.-G., 2022a, PASP, 134, 044201
- Bisht et al. (2022b) Bisht D., Zhu Q., Elsanhoury W. H., Yadav R. K. S., Rangwal G., Sariya D. P., Durgapal A., Jiang I.-G., 2022b, AJ, 164, 171
- Bobylev et al. (2017) Bobylev V. V., Bajkova A. T., Gromov A. O., 2017, Astronomy Letters, 43, 241
- Boubert & Everall (2020) Boubert D., Everall A., 2020, MNRAS, 497, 4246
- Bressan et al. (2012) Bressan A., Marigo P., Girardi L., Salasnich B., Dal Cero C., Rubele S., Nanni A., 2012, MNRAS, 427, 127
- Caffau et al. (2011) Caffau E., Ludwig H. G., Steffen M., Freytag B., Bonifacio P., 2011, Sol. Phys., 268, 255
- Cantat-Gaudin et al. (2018) Cantat-Gaudin T., et al., 2018, A&A, 618, A93
- Cantat-Gaudin et al. (2020) Cantat-Gaudin T., et al., 2020, A&A, 640, A1
- Davidge (2012) Davidge T. J., 2012, ApJ, 761, 155
- Dias et al. (2012) Dias W. S., Monteiro H., Caetano T. C., Oliveira A. F., 2012, A&A, 539, A125
- Dutra et al. (2002) Dutra C. M., Santiago B. X., Bica E., 2002, A&A, 381, 219
- Friel (1995) Friel E. D., 1995, ARA&A, 33, 381
- Gaia Collaboration et al. (2016a) Gaia Collaboration et al., 2016a, A&A, 595, A1
- Gaia Collaboration et al. (2016b) Gaia Collaboration et al., 2016b, A&A, 595, A2
- Gaia Collaboration et al. (2018) Gaia Collaboration et al., 2018, A&A, 616, A11
- Gaia Collaboration et al. (2021a) Gaia Collaboration et al., 2021a, A&A, 649, A1
- Gaia Collaboration et al. (2021b) Gaia Collaboration et al., 2021b, A&A, 649, A6
- Glushkova et al. (2013) Glushkova E. V., Zabolotskikh M. V., Koposov S. E., Spiridonova O. I., Leonova S. I., Vlasyuk V. V., Rastorguev A. S., 2013, MNRAS, 429, 1102
- Groenewegen (2021) Groenewegen M. A. T., 2021, A&A, 654, A20
- Jadhav & Subramaniam (2021a) Jadhav V. V., Subramaniam A., 2021a, VizieR Online Data Catalog, p. J/MNRAS/507/1699
- Jadhav & Subramaniam (2021b) Jadhav V. V., Subramaniam A., 2021b, MNRAS, 507, 1699
- Johnson & Soderblom (1987) Johnson D. R. H., Soderblom D. R., 1987, AJ, 93, 864
- Jones (1970) Jones B. F., 1970, AJ, 75, 563
- Kaluzny (1988) Kaluzny J., 1988, Acta Astron., 38, 339
- Kaluzny & Mazur (1991) Kaluzny J., Mazur B., 1991, Acta Astron., 41, 279
- Kharchenko et al. (2007) Kharchenko N. V., Scholz R. D., Piskunov A. E., Röser S., Schilbach E., 2007, Astronomische Nachrichten, 328, 889
- King (1962) King I., 1962, AJ, 67, 471
- Kyeong et al. (2008) Kyeong J.-M., Kim S.-C., Hiriart D., Sung E.-C., 2008, Journal of Korean Astronomical Society, 41, 147
- Lata et al. (2014) Lata S., Pandey A. K., Sharma S., Bonatto C., Yadav R. K., 2014, New A, 26, 77
- Luri et al. (2018) Luri X., et al., 2018, A&A, 616, A9
- Marigo et al. (2013) Marigo P., Bressan A., Nanni A., Girardi L., Pumo M. L., 2013, MNRAS, 434, 488
- Marigo et al. (2017) Marigo P., et al., 2017, ApJ, 835, 77
- Milone et al. (2012) Milone A. P., et al., 2012, A&A, 540, A16
- Mohan & Pandey (1984) Mohan V., Pandey A. K., 1984, Ap&SS, 105, 315
- Rain et al. (2021) Rain M. J., Ahumada J. A., Carraro G., 2021, VizieR Online Data Catalog, pp J/A+A/650/A67
- Rangwal et al. (2019) Rangwal G., Yadav R. K. S., Durgapal A., Bisht D., Nardiello D., 2019, MNRAS, 490, 1383
- Reid & Brunthaler (2004) Reid M. J., Brunthaler A., 2004, ApJ, 616, 872
- Sagar & Bhatt (1989) Sagar R., Bhatt H. C., 1989, Monthly Notices of the Royal Astronomical Society, 236, 865
- Salpeter (1955) Salpeter E. E., 1955, ApJ, 121, 161
- Sariya & Yadav (2015) Sariya D. P., Yadav R. K. S., 2015, A&A, 584, A59
- Sariya et al. (2017) Sariya D. P., Jiang I.-G., Yadav R. K. S., 2017, AJ, 153, 134
- Sariya et al. (2021) Sariya D. P., Jiang I.-G., Bisht D., Yadav R. K. S., Rangwal G., 2021, AJ, 161, 102
- Sariya et al. (2023) Sariya D. P., Jiang I.-G., Bisht D., Yadav R. K. S., Rangwal G., 2023, New A, 98, 101938
- Soubiran et al. (2000a) Soubiran C., Odenkirchen M., Le Campion J. F., 2000a, A&A, 357, 484
- Soubiran et al. (2000b) Soubiran C., Odenkirchen M., Le Campion J. F., 2000b, A&A, 357, 484
- Soubiran et al. (2018) Soubiran C., et al., 2018, A&A, 619, A155
- Spitzer (1958) Spitzer Lyman J., 1958, ApJ, 127, 17
- Spitzer & Harm (1958) Spitzer Lyman J., Harm R., 1958, ApJ, 127, 544
- Stetson (1987) Stetson P. B., 1987, PASP, 99, 191
- Tadross (2005) Tadross A. L., 2005, Astronomische Nachrichten, 326, 19
- Tarricq et al. (2022) Tarricq Y., Soubiran C., Casamiquela L., Castro-Ginard A., Olivares J., Miret-Roig N., Galli P. A. B., 2022, A&A, 659, A59
- Tripathi et al. (2013) Tripathi A., Pandey U. S., Kumar B., 2013, Bulletin of the Astronomical Society of India, 41, 209
- Wang & Chen (2019) Wang S., Chen X., 2019, ApJ, 877, 116
- Wang et al. (2022) Wang H., Zhang Y., Zeng X., Hu Q., Liu J., Qin M., Lü G., 2022, AJ, 164, 40
- Wu et al. (2009) Wu Z.-Y., Zhou X., Ma J., Du C.-H., 2009, MNRAS, 399, 2146
- van Leeuwen et al. (2021) van Leeuwen F., et al., 2021, Gaia EDR3 documentation, Gaia EDR3 documentation, European Space Agency; Gaia Data Processing and Analysis Consortium. Online at <A href=“https://gea.esac.esa.int/archive/documentation/GEDR3/index.html”>https://gea.esac.esa.int/archive/documentation/GEDR3/index.html</A>