Smaller Language Models are Better
Black-box Machine-Generated Text Detectors
Abstract
As large language models are becoming more ubiquitous and embedded in different user-facing services, it is important to be able to distinguish between human-written and machine-generated text, to verify the authenticity of news articles, product reviews, etc. Thus, in this paper we set out to explore whether it is possible to use one language model to identify machine-generated text produced by another language model, even if the two have different architectures and are trained on different data. Further, if this is possible, which language models make the best general-purpose detectors? We find that overall, smaller and partially-trained models are better universal machine-generated text detectors: they can more precisely detect text generated from both small and larger models. Interestingly, we find that whether or not the detector and generator models were trained on the same data or have similar parameter counts is not critically important to the detection success. For instance the OPT-125M model has an AUC of 0.81 in detecting ChatGPT generations, whereas a larger model from the GPT family, GPTJ-6B, has AUC of 0.45.
1 Introduction
With the rapid improvement in fluency of the text generated by large language models (LLMs), these system are being adopted more and more broadly in a wide range of applications, including chatbots, writing assistants, and summarizers. Generations from these models are shown to have human-like fluency Liang et al. (2022); Yuan et al. (2022), making it difficult for human readers to differentiate machine-generated text from human-written text. This can have significant ramifications, as such LLM-based tools can be abused for unethical purposes like phishing, astroturfing, and generating fake news He et al. (2023). As such, we need to be able to reliably and automatically detect machine generated text.
Previous work has found that identifying local optima in the likelihood surface of a trained language model allows for detection of training utterances Mattern et al. (2023), and generations for a given target model Mitchell et al. (2023). Specifically, the approximate measure of local optimality, dubbed curvature, is formed by comparing the loss of a target sequence to the loss of nearby perturbations of the target sequence, under the target model. The intuition in both prior works is that this measure of curvature is higher around both training examples and model generations, compared to unseen human-written text and can therefore be used to determine if a given sequence is part of the training data or not Mattern et al. (2023) or a generation of the target (generator) model or not Mitchell et al. (2023).
In practice, however, we often want to distinguish between machine-generated text and human-written text in situations where we do not know which model could have been used as the generator — and even if we do know the generator, we might not have access to its likelihood function (e.g. ChatGPT), or access might be behind a paywall (e.g. GPT3). Therefore, in this paper we set out to explore the detection of machine-generated text without knowledge of the generator. We do this by exploring whether it is possible to use the curvature metric measured on one language model (a detector model) to identify machine-generated text generated by another language model ( the generator), and under what conditions such cross-detection performs best. We use surrogate detector models, whose likelihood functions we do have access to. Then, we run the curvature test using the surrogate (see Figure 1) and compare detection power with the same test, but using the true generator’s likelihood.
We conduct an extensive empirical analysis by experimenting on a slew of models with different sizes (from tens of millions to billions of parameters), architectures (GPTs, OPTs, Pythias) and pre-training data (Webtext and the Pile) and also from different training stages (ranging from the first thousand steps of training to full training– 143k steps). Our main finding is that cross-detection can come very close to self-detection in terms of distinguishablity, and that there are universal cross-detectors with high average distinguishablity performance, meaning they perform well in terms of detecting generations from a wide-range of models, regardless of the architecture or training data. More specifically, we find that smaller models are better universal detectors. For instance the OPT-125M model comes within area under the ROC curve of self-detection, on average (see Figure 10). And for models where we don’t have self-detection, such as ChatGPT, the AUC of using OPT-125M is , whereas OPT 6.7B’s AUC is .
We also find that partially trained models are better detectors than the fully trained ones, and this gap is bigger for larger models (see Figure 9). We then further investigate some possible reasons for this phenomenon by analyzing curvature and log-likelihood of the different models, and find that larger models are more conservative in terms of the likelihood and curvature they assign to generations from other models. Smaller models, however, assign higher curvature to generations of models their size or larger, therefore they can be used to cross-detect on a broader range of models so the smaller model is the best universal detector.
2 Methodology
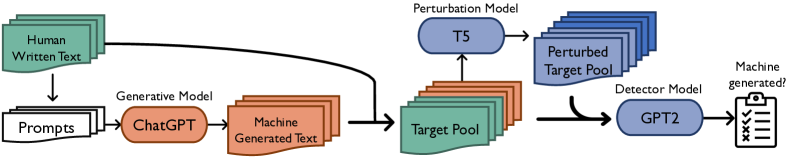
Figure 1 shows the methodology of our work, and how we conduct our experiments: For a given target pool of sequences, the task is to determine if each sequence is human-written or machine-generated by running a curvature (local optimality) test using the likelihood surface of a surrogate detector model that is different from the generator model, as our main assumption is that we have no information about the generator model. In the rest of this section we delve deeper into the details of each component in the setup.
Target pool. The pool of sequences for which we want to conduct the machine-generated text detection. We form this pool such that there is a 50%/50% composition of machine-generated/human-written text. The machine-generated text is created by prompting the generator model with the first tokens of each human-written sequence.
Generator model. This model is the generator of the machine-generated utterances we would like to distinguish from human-written utterances. We do not always have full access to this model, or even know what model it is. This scenario is what we are actually interested in: we want to know how we detect text generated by unknown models.
Detector model. This model is used as a surrogate for the target model, to help us detect generations when using the curvature test. The pool of sequences and their neighbors are fed to the detector model, and their loss under the detector model is measured and used to calculate curvature and to distinguish between generations and human written text.
Curvature (local optimality) test. The method we use to distinguish between machine-generated and human-written text relies on the local optimality (curvature) of the target sequence, building on the intuition that generations are more likely to be locally optimal than unseen human-written text Mitchell et al. (2023); Mattern et al. (2023).
To estimate local optimality, following Mattern et al. (2023); Mitchell et al. (2023), we generate additional utterances in a local neighborhood around the target by perturbing the target (e.g. re-sampling words at several positions). Then, the measure of local optimality is computed by comparing the likelihood of the target with the likelihood of the local perturbations as follows:
| (1) |
Here, is the target sequence, are the parameters of the detector model, and is the th perturbation of the target utterance (i.e. the th neighbor) out of the overall perturbations. The perturbed sequences are generated by masking parts of and filling the mask using a perturbation model. The curvature is thresholded to make the machine-generated/human-written text decision. While technically this measure is an approximate estimate of local optimality, past work has referred to it as ’curvature’. For simplicity, we use this nomenclature going forward.
Perturbation model. This model helps generate neighbors by filling in randomly selected spans of the target sequences in the pool and perturbing them. We use T5-3B for this purpose in our experiments.
Success metric. We evaluate the success of the detector by measuring the area under the ROC curve (AUC), i.e. the false positive vs. true positive rate curve. The higher the AUC, the more distinguishing power the detection mechanism has.
Evaluation strategy. The results we report in the paper fall into two main categories: (1) using a model to detect its own generations, which is the main goal of Mitchell et al. (2023) (in this setup, the target and detector models are the same, we call this self-detection); and (2) using a model different from the generator of the text to detect the generations. In this setup, what we are basically doing is acting as if a surrogate model has generated the text. In other words, we want to see how well a model would claim another model’s generation as its own. We call this cross-detection.
3 Experimental Setup
This section briefly covers the experimental setup. For more details refer to Appendix B.
Models We use the following model families in our experiments: Facebook’s OPT (we use the 125M, 350M, 1.3B, and 6.7B models), EleutherAI’s GPT-J, GPTNeo and Pythia Biderman et al. (2023) (we use GPTNeo-125M, GPTNeo-1.3B, GPTNeo-2.7B, GPTJ-6B and Pythia models ranging from 70M to 2.8B parameters), and OpenAI’s GPT models (distilGPT, GPT2-Small, GPT2-Medium, GPT2-Large, GPT2-XL, GPT-3 and ChatGPT).
Evaluation dataset. We follow Mitchell et al. (2023)’s methodology for pre-processing and feeding the data to the detector model. We use a subsample of the SQuAD Rajpurkar et al. (2016) and WritingPrompts Fan et al. (2018) datasets, where the original dataset sequences are used as the human-written text in the target sequence pool. We then use the first tokens of each human-written sequence as a prompt, and feed this to the target model, and have it generate completions for it. We then use this mix of generations and human-written text to create the target pool on which we do the detection. In all cases, our pool consists of human-written target samples, and machine-generated samples, so the overall pool size is .
Pre-training datasets for the generator models. The ElutherAI and Facebook models (GPTJ, GPTNeo, Pythia and OPT families) are all trained on the Pile dataset Gao et al. (2020). There is limited information and access to the training data of the OpenAI models. The GPT-2 family is reportedly trained on the WebText dataset, GPT-3 is trained on a combination of the Common Crawl, WebText2, books and Wikipedia, and there is not any information released about the training data of ChatGPT.
4 Does cross-detection work?
In this section we conduct an extensive set of experiments where we use models with different sizes and architectures as detectors of text generated by other models. The results are averaged over the SQuAD and WritingPrompts dataset. We also experiment with partially trained checkpoints of the detector models, to see how the detection power of the models changes as the training progresses.
Our main finding is that cross detection can perform as well as self-detection, or come very close to it. Figures 2 and 3 (full heatmap is Fig. 8 in Appendix) show the AUC of cross-detection for different models. Figures 10 and 9 in Appendix show how close each detector comes, in terms of AUC, to self-detection. We can see that on average, OPT-125M is the best fully trained universal cross-detector, showing on average lower AUC, compared to self-detection. If we look at partially trained detector models, however, we see that the Pythia-160M comes as close as AUC points, with its , and step trained models (the fully trained model is trained for steps). These models seem to even outperform self-detection in some cases, for example when we look at GPTJ-6B generations. In the rest of this section we further elaborate on these results and draw connections between model size, training, and detection power.
4.1 Smaller Models Are Better Detectors
In this section we aim to see if there are any correlations between model size and detection power. To this end, we use different models with different parameter counts, ranging from to to detect machine-generation texts from all the models listed in Section 3.
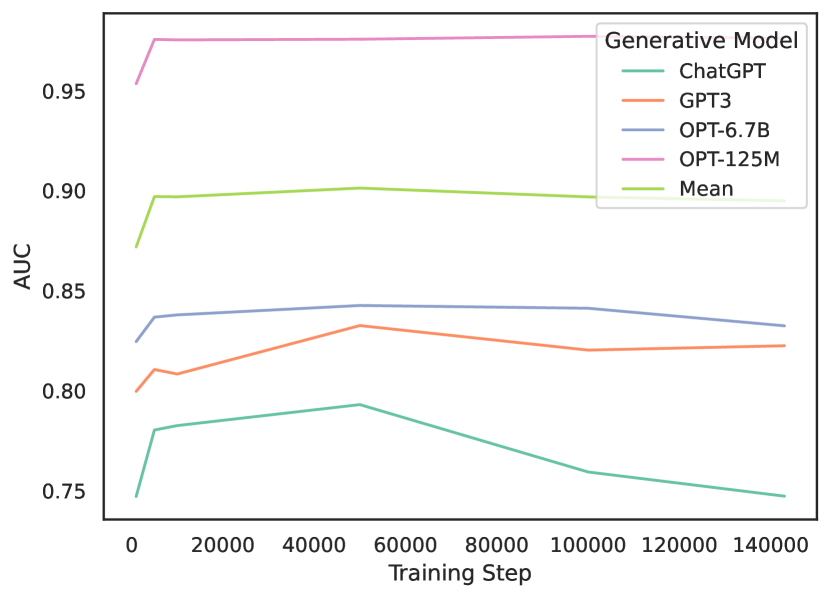
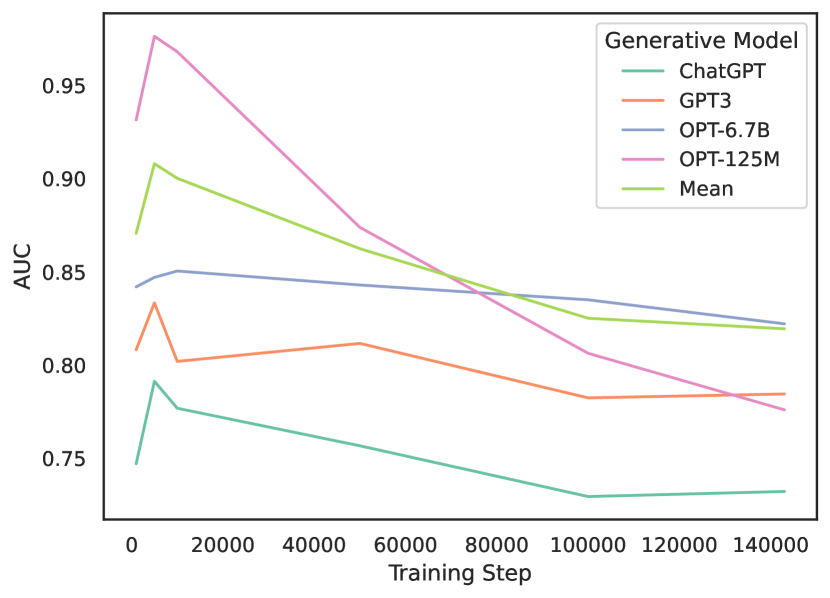
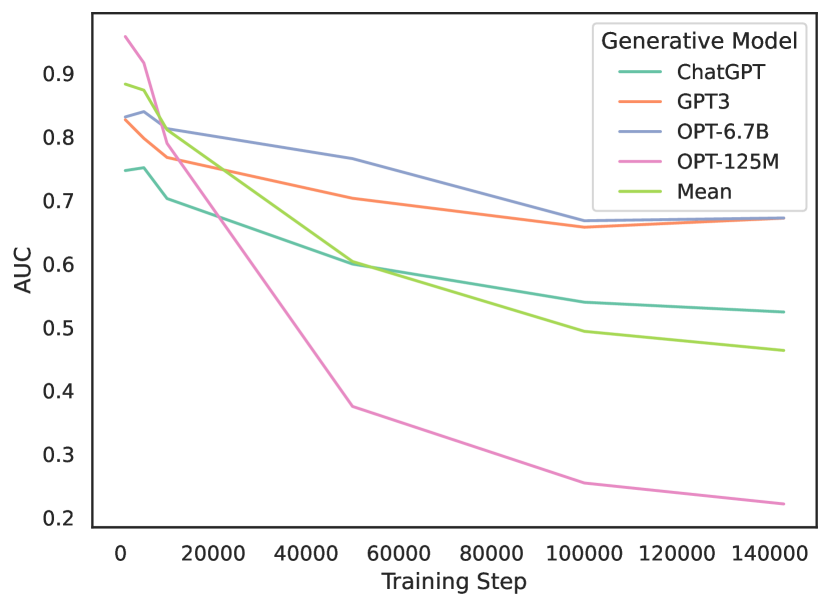
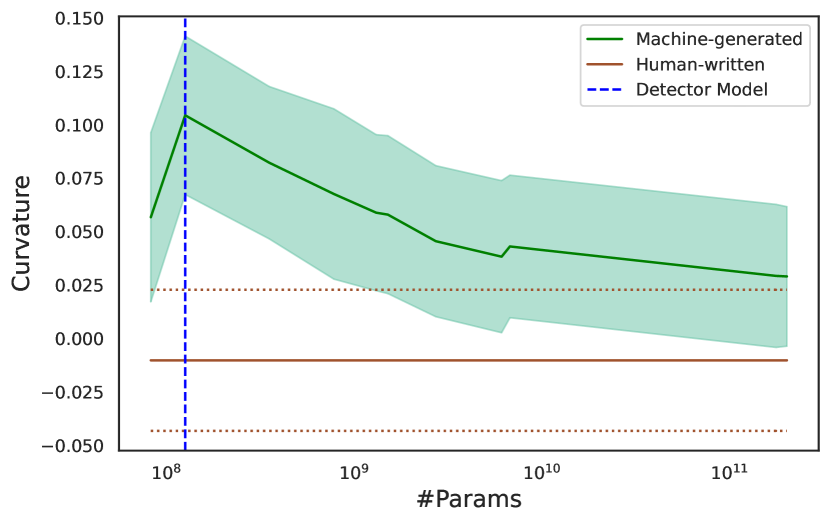
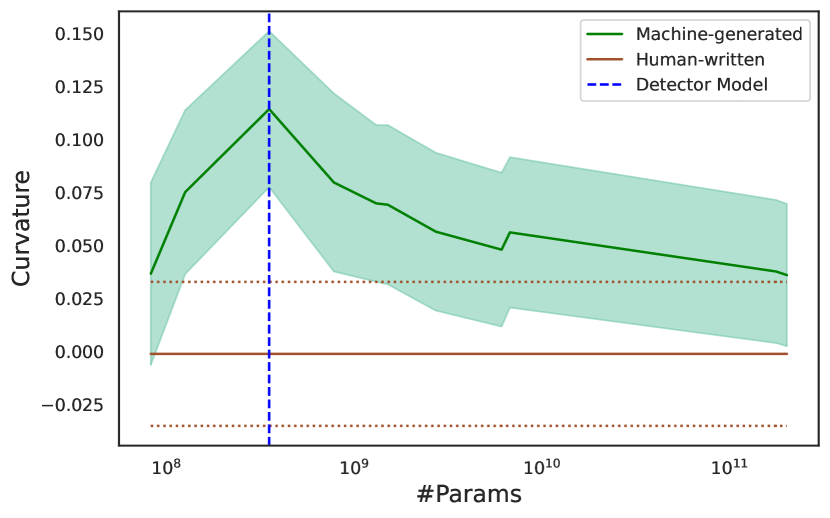
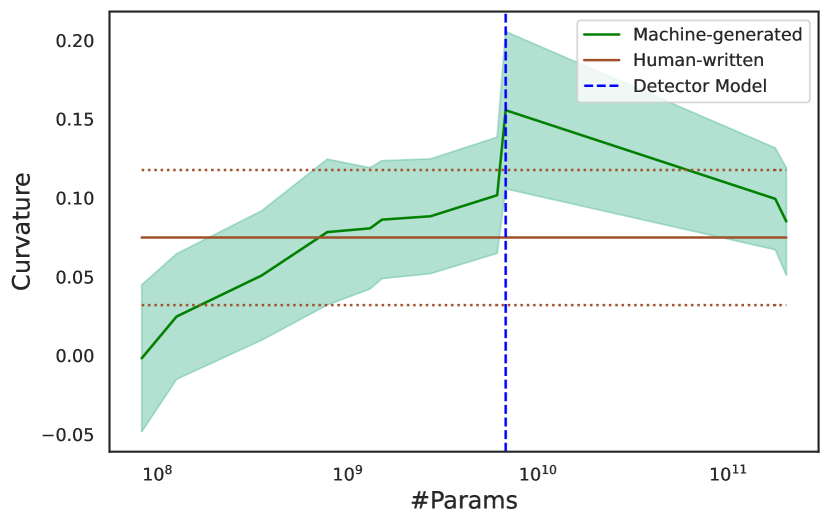
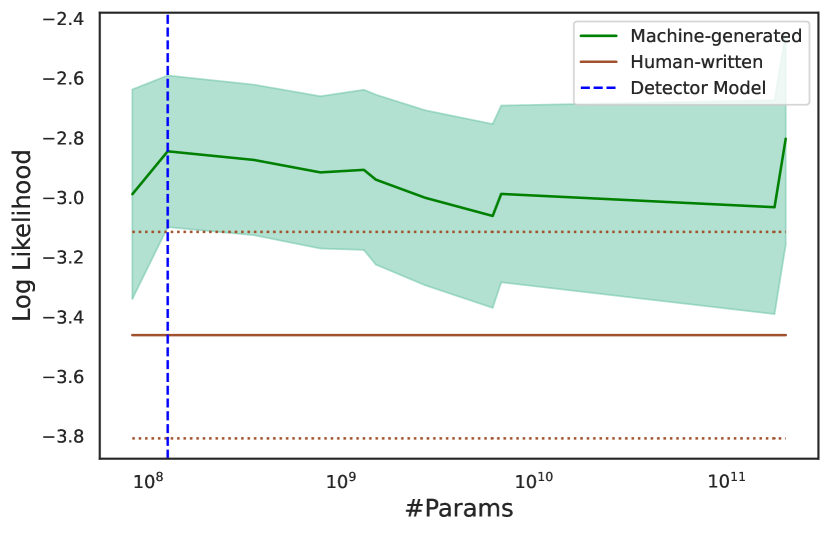
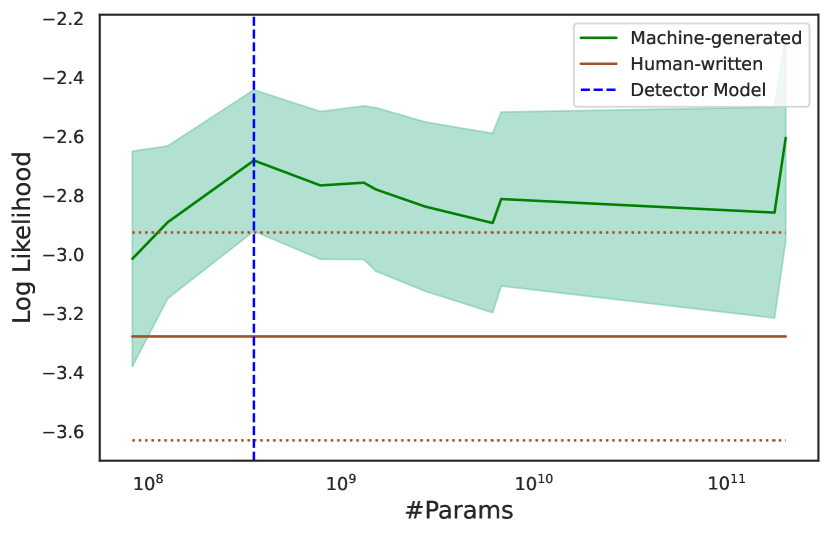
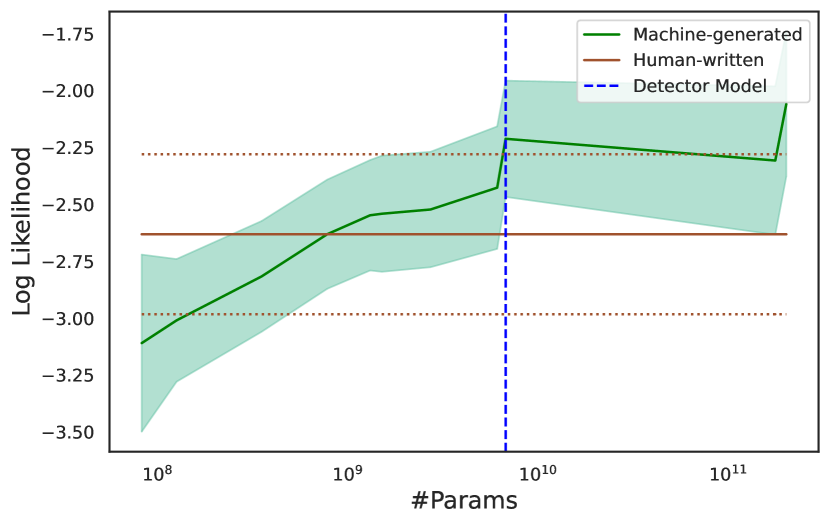
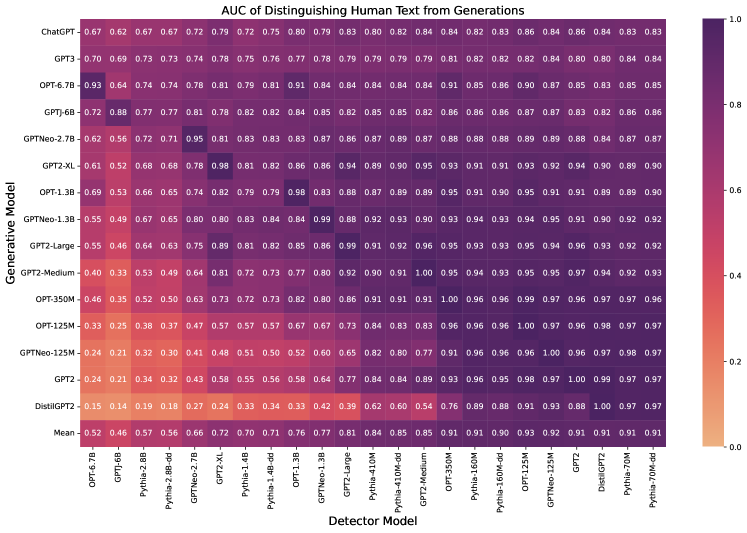
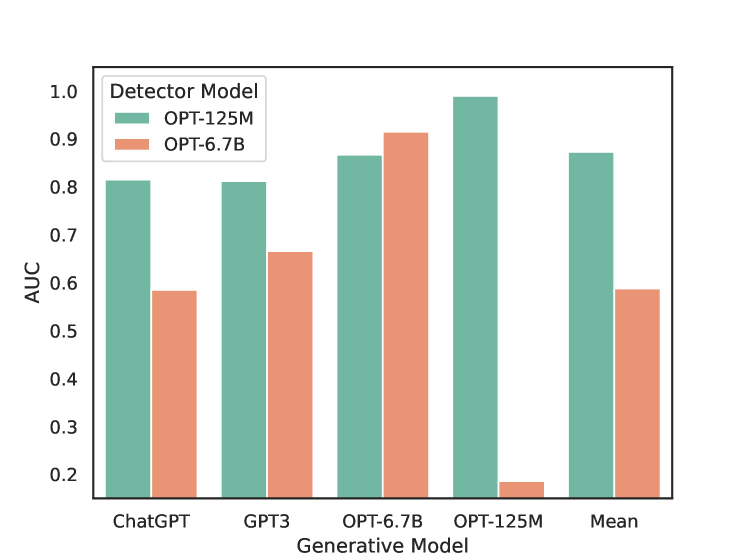
Figure 2 shows the results for this experiment, where the rows are the generator models (sizing up from bottom row to top) and the columns show the detector models (sizing up from right to left). So each cell shows the detection power (AUC) of the given detector model (column), on text generated from the generator model (row). The last row is the mean, which is an overall metric of how good of a detector that model is.
We see that the bottom left has the lowest values, showing that larger models are not good at detecting machine generated text from other models, and they are particularly bad at it for detecting small model generations. We can also see that smaller models are much better detectors, as the right side of the graph has much higher AUC values. Another observation is the correlations between the dataset and model architecture of the generator and detector models. As the heatmap shows, models from the same architecture family and trained on the same/overlapping dataset are better at detecting their own text, compared to models from a different family. For instance, for detecting text generated by OPT-6.7B the other models from the OPT family are the best cross-detectors, with AUCs ranging from 0.89-0.87 (OPT-6.7B self-detects with AUC 0.91). The next best cross-detector is the smallest GPTNeo-125M with AUC 0.86. However, the OpenAI GPT2 model of the same size has a lower AUC of 0.84 (and overall the GPT2 family has the lowest cross-detection AUC on OPT), which we hypothesize is due to the larger gap in the training data, as the OPT and GPTNeo/GPTJ models are all trained on the Pile dataset, but GPT2 is trained on the Webtext. All in all, the difference due to the dataset/architecture differences is small as most of the dataset for all these models is comprised of web-crawled data, showing that cross-detection can be effective, regardless of how much information we have about the target model, and how accessible similar models are.
One noteworthy observation is that OPT-125M can detect generations from models like GPT3 and ChatGPT with relatively high AUC (0.81). However, if the intuitive approach of taking another large, “similar” model were to be taken and we were to use OPT-6.7B, we would get AUC of 0.67 and 0.58 for these models, respectively, which are both close to random (0.5). Thus, intuitively, it seems that larger models have more refined taste: they only show higher local optimality (relative to human-written text) on generations from large models. Conversely, smaller models are more forgiving: they show higher local optimality on generations from similarly small models and larger, making them better universal detectors via local optimality comparison. We discuss this further in Section 5.
4.2 Partially Trained Models are Better Detectors
We take different training checkpoints of the Pythia models Biderman et al. (2023) at different steps (steps , , , , and ) with different sizes (2.8B, 410M, and 70M), and use them as detectors of generations from the 4 target models. Figure 3 shows the results for this experiment (Figures 8 and 9 show entire heatmaps of this experiment). For each model we can see that the final checkpoint is consistently the worst one in terms of machine-generated text detection, and it is one of the middle checkpoints that has the best performance. Our hypothesis for this is similar to that of Section 4, where we believe that partially trained models have not yet fit to the training data tightly (and have a smoother surface), so they over claim other models’ generations as their own, whereas the longer a model is trained, the sequences it ranks higher as its own narrow down.
5 How are smaller models better detectors?
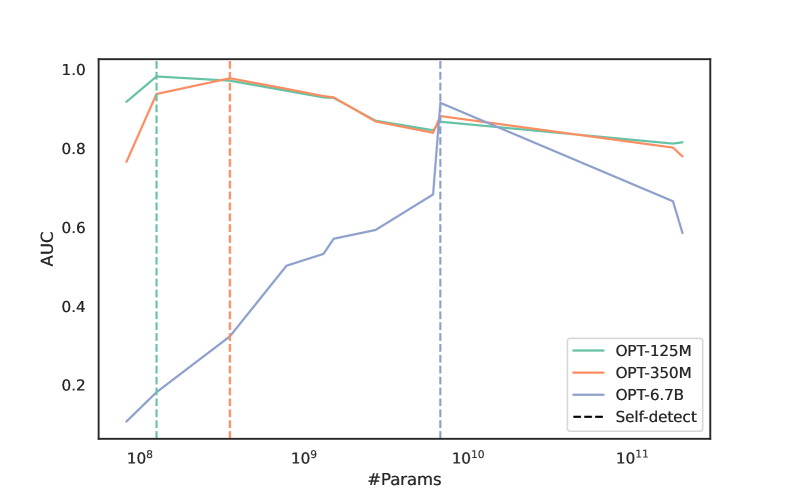
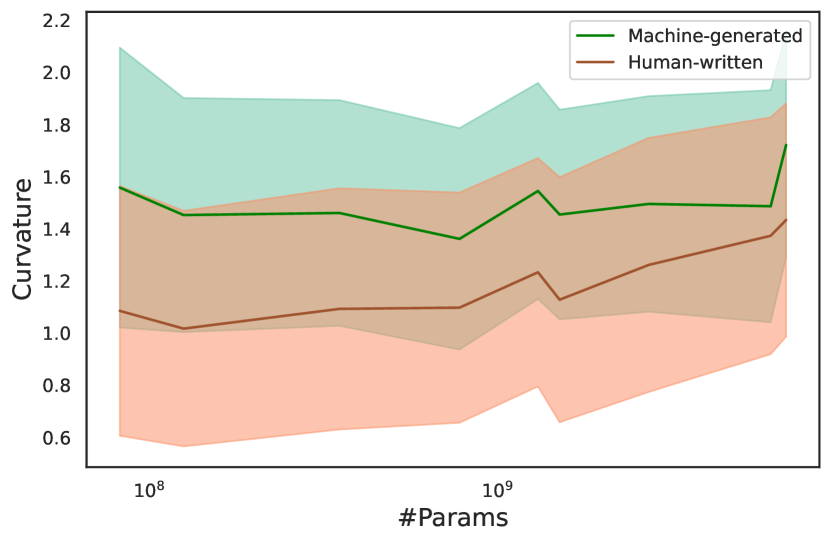
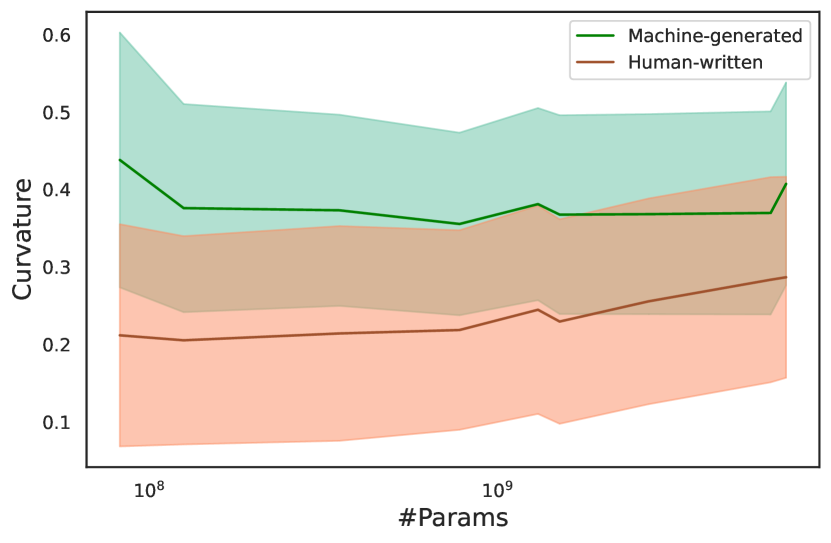
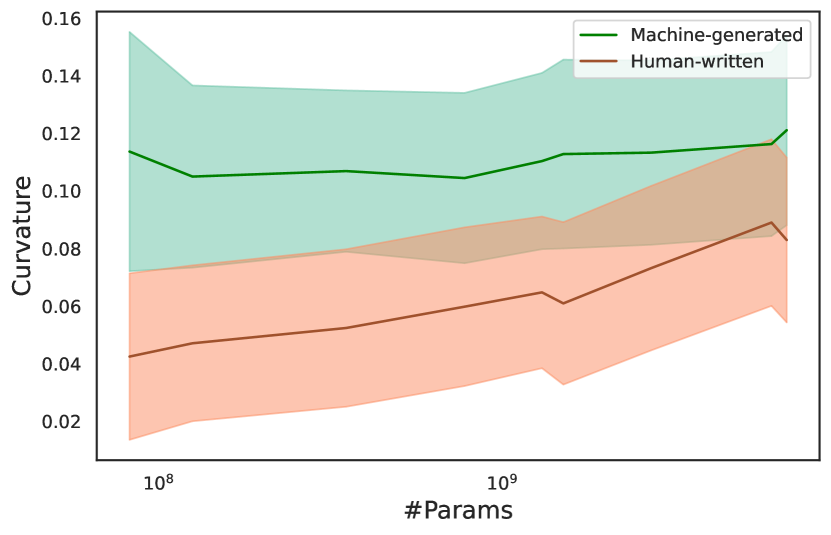
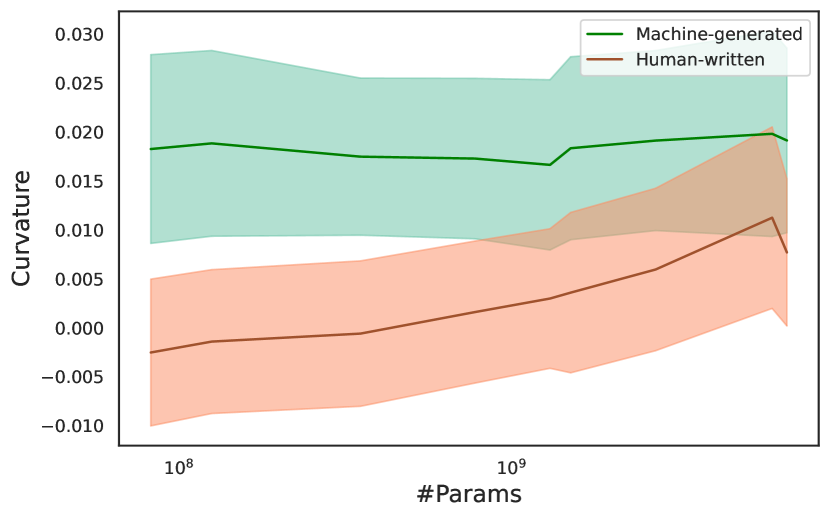
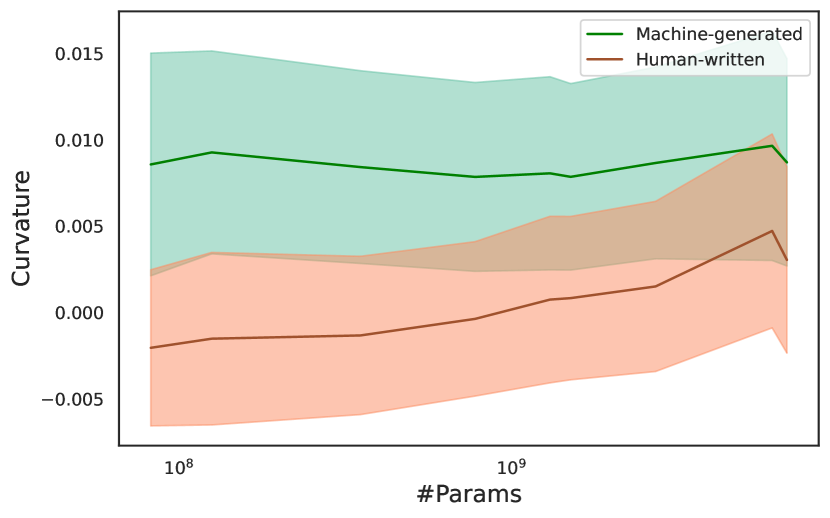
To help shed light on why smaller models are better detectors and larger models are not good at detecting machine generated text, we plot a breakdown of the curvature metric (Section 2) and log-likelihood values for the best universal detector (OPT-125M), a medium sized detector of the same family (OPT-350M) and a larger one from the same family (OPT-6.7B), shown in Figure 4. The y-axis is the curvature/log likelihood of the target generations (from the models from Section B.1) under the detector models (OPT-125M, 350M or 6.7B). The x-axis is the number of parameters of the generator model (we do not know how many parameters ChatGPT has, so we plotted it as the rightmost point in the plots). Figure 5 plots the AUCs for detection under the three models, for the generator models.
We can see that for the smaller detector model (Figures 4(a) and 4(d)), the mean curvature and log-likelihood values for the generated text are consistently higher than the curvature for the human-written text. However, for the larger model (Figure 4(c) and 4(f)), the curvature and log-likelihood values for the machine-generated text is in most cases smaller than or around the same value as the human written text. The curvature and log-likelihood values for human written text for both graphs are stable since the text is the same and doesn’t depend on the target model.
We can also see that overall the curvature and likelihood values for the larger model are higher, especially for the original text, than those of the smaller model, and the values for text generated by the other models have lower curvature and likelihood value. This shows that the larger model places higher likelihood on the human written text and fits it better. The smaller model, however, assigns lower curvature and likelihood to the human-written text compared to generations by a large gap, and the assigned values are overall lower than those of the large model. Broadly we observe that all models respond similarly to machine generated text from other models, so long as the other model is same size or bigger. In other words, they place high likelihood on text from larger models. However, for models smaller than themselves, they place lower likelihood and curvature. As such, smaller models are better universal detectors, as the size of the set of sequences they assign higher likelihood and curvature to is bigger than it is for large models, and this higher curvature is much higher than the curvature assigned to the human written text. The spikes in all the sub-figures of Figure 4 graphs are for the detector model detecting its own text.
6 Does neighborhood choice matter?
Our estimation of “curvature” hinges upon generating numerous perturbations (neighbors) and comparing their loss with that of a target point. Therefore, if these perturbed neighbors are not sufficiently nearby and lie in a different basin of the likelihood surface, our measure of curvature is not accurate (the closer the perturbed points are, the more accurate estimation of curvature we achieve). The perturbation method directly impacts the size and shape of the neighborhood we create. Therefore, we compare different perturbation schemes in order to see how sensitive detectors of different sizes are to neighborhood choice.
We investigate two different methods for changing the distance of the generated perturbations: (1) we change the mask filling model size, by experimenting with T5-Small, T5-Large and T5-3B Wolf et al. (2019); Raffel et al. (2020) to test the intuition that larger mask-filling models, generate semantically closer neighbors than a smaller model, we present the extended results for this in Appendix A. A similar analysis is also conducted in Mitchell et al. (2023), we however, do a more extensive analysis on numerous models of different sizes and probe the curvature values. (2) We change the percentage of the tokens that get masked and replaced by the mask-filling model, as the more tokens we mask and replace, the farther the generated perturbations would be. (3) Finally, we look into how many tokens we actually need in the generated/human-written sequences to create a neighborhood and be able to accurately distinguish the texts.
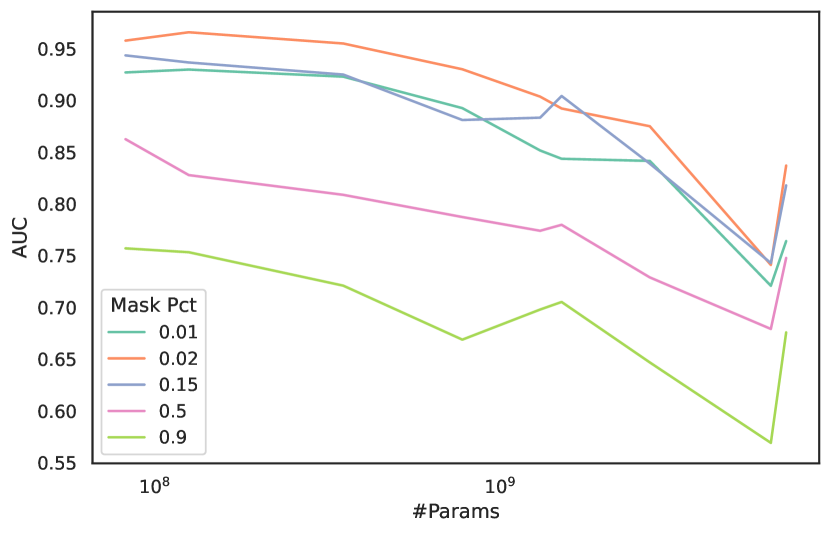
6.1 Masking Percentage
Figure 6 shows the results for the experiment where we change the percentage of tokens that are masked, to produce the neighbors. In all previous experiments, we used masking with mask span length of tokens following the experimental setup in Mitchell et al. (2023). In this section, however, we change the percentage of the masked tokens (and we set the masking to be contiguous) to see how it affects the curvature mean and standard deviation values, and the AUCs. We can see that as the masking percentage decreases (from to ), the AUCs and the self-detection power of models increase rather consistently. When we go to , however, we see the AUC drop. If we look at Figure 6(e) which depicts the curvature measures for the masking, we see that the curvatures overlap between machine-generated and human-written text, which we hypothesize is because our implementation does not enforce that re-sampled words must differ from the words they are replacing. Thus, for the smallest masking percentage, it is possible that some perturbations are identical to the target, which may explain reduced detection accuracy in this setting111Its noteworthy that the slight discrepancy between the results for masking in this section and the previous section is that there, the mask span length was so the masked portion of the sequence is not contiguous. In this experiment, however, we use contiguous masking. .
6.2 How many tokens do we need for detection?
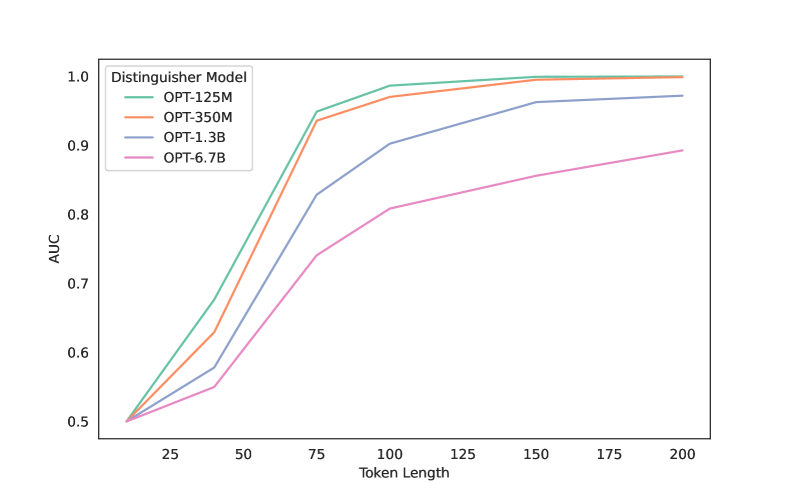
Figure 7 shows how the length of the target sequence affects the sequence’s detectablity (AUC of detection), and how many tokens we need to be able to do precise detection. We compare sequences of different lengths, ranging from 10 tokens to 200, for four different models with four different parameter counts, on the SQuAD dataset. In this setup we target self-detection. We can see that the longer the sequence, the easier it is to distinguish if it is human-written or machine-generated, and 75-100 tokens seems like the point where we hit diminishing returns. We can also see that across different sequence lengths, as models get smaller, the detection power increases, as seen throughout the rest of the paper.
7 Related Work
The problem of machine-generated text detection has already been studied for multiple years using a variety of different approaches (Ippolito et al., 2020; Jawahar et al., 2020; Uchendu et al., 2020, 2021): Both Gehrmann et al. (2019) and Dugan et al. (2022) have found that humans generally struggle to distinguish between human- and machine-generated text, thereby motivating the development of automatic solutions. Among those, some methods aim to detect machine-generated text by training a classifier in a supervised manner (Bakhtin et al., 2019; Uchendu et al., 2020), while others perform detection in a zero-shot manner (Solaiman et al., 2019; Ippolito et al., 2020). There is also a line of work that relies on bot detection through question answering Wang et al. (2023); Chew and Baird (2003), which is outside the scope of this paper.
Most recently, Mitchell et al. (2023) introduced the zero-shot method DetectGPT, which is based on the hypothesis that texts generated from a LLM lie on local maxima, and therefore negative curvature, of the model’s probability distribution. Other strategies have been proposed to enable the detection of machine-generated text in the wild. Particularly through efforts on the side of the LLM provider, more powerful detection methods can be devised. One such method is watermarking, which injects algorithmically detectable patterns into the released text while ideally preserving the quality and diversity of language model outputs. Watermarks for natural language have already been proposed by Atallah et al. (2001) and have since been adapted for outputs of neural language models (Fang et al., 2017; Ziegler et al., 2019). Notable recent attempts for transformer based language models include work by Abdelnabi and Fritz (2021), who propose an adversarial watermarking transformer (AWT). While this watermarking method is dependent on the model architecture, Kirchenbauer et al. (2023) propose a watermark that can be applied to texts generated by any common autoregressive language model. As a strategy more reliable than watermarking, Krishna et al. (2023) suggest a retrieval-based approach: By storing all model outputs in a database, LLM providers can verify whether a given text was previously generated by their language model. In practice, this would however require storage of large amounts of data and highly efficient retrieval techniques in order to provide fast responses as the number of generated texts grows.
Relationship to Membership Inference Attacks (MIA)
Prior work Mattern et al. (2023) demonstrated that the same optimality test can be used to distinguish between training set members and non-training members, i.e. as a membership inference attack. As our experiments showed, when models size up the detection power (i.e. distinguishablity between machine-generated and human-written text) decreases. For MIA, however, prior work demonstrate inverse scaling, as in larger models demonstrate higher distinguishing power Mireshghallah et al. (2022); Mattern et al. (2023). We attribute this to the higher memorization capablities of these models, as shown by Tirumala et al. (2022), making it easier for them to recognize their training data.
8 Conclusion
With the increasing prevalence of LLMs and their integration into various different services, it becomes crucial to differentiate between text written by humans and text generated by machines so as to avoid fake news and impersonations. As such, we set out to explore the possibilities of using existing models to detect generations from unknown sources, and distinguish them from human written text. We find that when using zero-shot detection methods that rely on local optimality, smaller models are overall better at detecting generations, and larger models are poor detectors. Our results offer hope of robust general purpose protection against LLMs used with nefarious intentions. However, as LLMs continue to change and detection evasion methods become more prevalent, so must methods for detection and validation studies.
Limitations
Although we see high AUCs for black-box detection of machine generated text in our experiments, this does not necessarily mean that these detection methods are not avoidable, and that they can be applied to all models and achieve high performance. Further experiments are needed to evaluate the generalization of our findings to other architectures and setups.
Acknowledgments
This research is supported in part by DARPA SemaFor Program No. HR00112020054.
References
- Abdelnabi and Fritz (2021) Sahar Abdelnabi and Mario Fritz. 2021. Adversarial watermarking transformer: Towards tracing text provenance with data hiding. In 42nd IEEE Symposium on Security and Privacy.
- Atallah et al. (2001) Mikhail J. Atallah, Victor Raskin, Michael Crogan, Christian Hempelmann, Florian Kerschbaum, Dina Mohamed, and Sanket Naik. 2001. Natural language watermarking: Design, analysis, and a proof-of-concept implementation. In Information Hiding, pages 185–200, Berlin, Heidelberg. Springer Berlin Heidelberg.
- Bakhtin et al. (2019) Anton Bakhtin, Sam Gross, Myle Ott, Yuntian Deng, Marc’Aurelio Ranzato, and Arthur Szlam. 2019. Real or fake? learning to discriminate machine from human generated text.
- Biderman et al. (2023) Stella Biderman, Hailey Schoelkopf, Quentin Anthony, Herbie Bradley, Kyle O’Brien, Eric Hallahan, Mohammad Aflah Khan, Shivanshu Purohit, USVSN Sai Prashanth, Edward Raff, et al. 2023. Pythia: A suite for analyzing large language models across training and scaling. arXiv preprint arXiv:2304.01373.
- Chew and Baird (2003) Monica Chew and Henry S. Baird. 2003. Baffletext: a human interactive proof. In IS&T/SPIE Electronic Imaging.
- Dugan et al. (2022) Liam Dugan, Daphne Ippolito, Arun Kirubarajan, Sherry Shi, and Chris Callison-Burch. 2022. Real or fake text?: Investigating human ability to detect boundaries between human-written and machine-generated text.
- Fan et al. (2018) Angela Fan, Mike Lewis, and Yann Dauphin. 2018. Hierarchical neural story generation. arXiv preprint arXiv:1805.04833.
- Fang et al. (2017) Tina Fang, Martin Jaggi, and Katerina Argyraki. 2017. Generating steganographic text with LSTMs. In Proceedings of ACL 2017, Student Research Workshop, pages 100–106, Vancouver, Canada. Association for Computational Linguistics.
- Gao et al. (2020) Leo Gao, Stella Biderman, Sid Black, Laurence Golding, Travis Hoppe, Charles Foster, Jason Phang, Horace He, Anish Thite, Noa Nabeshima, et al. 2020. The pile: An 800gb dataset of diverse text for language modeling. arXiv preprint arXiv:2101.00027.
- Gehrmann et al. (2019) Sebastian Gehrmann, Hendrik Strobelt, and Alexander Rush. 2019. GLTR: Statistical detection and visualization of generated text. In Proceedings of the 57th Annual Meeting of the Association for Computational Linguistics: System Demonstrations, pages 111–116, Florence, Italy. Association for Computational Linguistics.
- He et al. (2023) Xinlei He, Xinyue Shen, Zeyuan Chen, Michael Backes, and Yang Zhang. 2023. Mgtbench: Benchmarking machine-generated text detection. arXiv preprint arXiv:2303.14822.
- Ippolito et al. (2020) Daphne Ippolito, Daniel Duckworth, Chris Callison-Burch, and Douglas Eck. 2020. Automatic detection of generated text is easiest when humans are fooled. In Proceedings of the 58th Annual Meeting of the Association for Computational Linguistics, pages 1808–1822, Online. Association for Computational Linguistics.
- Jawahar et al. (2020) Ganesh Jawahar, Muhammad Abdul-Mageed, and Laks Lakshmanan, V.S. 2020. Automatic detection of machine generated text: A critical survey. In Proceedings of the 28th International Conference on Computational Linguistics, pages 2296–2309, Barcelona, Spain (Online). International Committee on Computational Linguistics.
- Kirchenbauer et al. (2023) John Kirchenbauer, Jonas Geiping, Yuxin Wen, Jonathan Katz, Ian Miers, and Tom Goldstein. 2023. A watermark for large language models.
- Krishna et al. (2023) Kalpesh Krishna, Yixiao Song, Marzena Karpinska, John Wieting, and Mohit Iyyer. 2023. Paraphrasing evades detectors of ai-generated text, but retrieval is an effective defense. arXiv preprint arXiv:2303.13408.
- Liang et al. (2022) Percy Liang, Rishi Bommasani, Tony Lee, Dimitris Tsipras, Dilara Soylu, Michihiro Yasunaga, Yian Zhang, Deepak Narayanan, Yuhuai Wu, Ananya Kumar, et al. 2022. Holistic evaluation of language models. arXiv preprint arXiv:2211.09110.
- Mattern et al. (2023) Justus Mattern, Fatemehsadat Mireshghallah, Zhijing Ji, Bernhard Scholkop, Mrinmaya Sachan, and Taylor Berg-Kirkpatrick. 2023. Membership inference attacks against language models via neighbourhood comparison. In Proceedings of the 61st Annual Meeting of the Association for Computational Linguistics (ACL Findings).
- Mireshghallah et al. (2022) Fatemehsadat Mireshghallah, Kartik Goyal, Archit Uniyal, Taylor Berg-Kirkpatrick, and Reza Shokri. 2022. Quantifying privacy risks of masked language models using membership inference attacks. arXiv preprint arXiv:2203.03929.
- Mitchell et al. (2023) Eric Mitchell, Yoonho Lee, Alexander Khazatsky, Christopher D Manning, and Chelsea Finn. 2023. Detectgpt: Zero-shot machine-generated text detection using probability curvature. arXiv preprint arXiv:2301.11305.
- Raffel et al. (2020) Colin Raffel, Noam Shazeer, Adam Roberts, Katherine Lee, Sharan Narang, Michael Matena, Yanqi Zhou, Wei Li, and Peter J Liu. 2020. Exploring the limits of transfer learning with a unified text-to-text transformer. The Journal of Machine Learning Research, 21(1):5485–5551.
- Rajpurkar et al. (2016) Pranav Rajpurkar, Jian Zhang, Konstantin Lopyrev, and Percy Liang. 2016. Squad: 100,000+ questions for machine comprehension of text. arXiv preprint arXiv:1606.05250.
- Solaiman et al. (2019) Irene Solaiman, Miles Brundage, Jack Clark, Amanda Askell, Ariel Herbert-Voss, Jeff Wu, Alec Radford, Gretchen Krueger, Jong Wook Kim, Sarah Kreps, Miles McCain, Alex Newhouse, Jason Blazakis, Kris McGuffie, and Jasmine Wang. 2019. Release strategies and the social impacts of language models.
- Tirumala et al. (2022) Kushal Tirumala, Aram Markosyan, Luke Zettlemoyer, and Armen Aghajanyan. 2022. Memorization without overfitting: Analyzing the training dynamics of large language models. Advances in Neural Information Processing Systems, 35:38274–38290.
- Uchendu et al. (2020) Adaku Uchendu, Thai Le, Kai Shu, and Dongwon Lee. 2020. Authorship attribution for neural text generation. In Proceedings of the 2020 Conference on Empirical Methods in Natural Language Processing (EMNLP), pages 8384–8395, Online. Association for Computational Linguistics.
- Uchendu et al. (2021) Adaku Uchendu, Zeyu Ma, Thai Le, Rui Zhang, and Dongwon Lee. 2021. TURINGBENCH: A benchmark environment for Turing test in the age of neural text generation. In Findings of the Association for Computational Linguistics: EMNLP 2021, pages 2001–2016, Punta Cana, Dominican Republic. Association for Computational Linguistics.
- Wang et al. (2023) Hong Wang, Xuan Luo, Weizhi Wang, and Xifeng Yan. 2023. Bot or human? detecting chatgpt imposters with a single question.
- Wolf et al. (2019) Thomas Wolf, Lysandre Debut, Victor Sanh, Julien Chaumond, Clement Delangue, Anthony Moi, Pierric Cistac, Tim Rault, Rémi Louf, Morgan Funtowicz, et al. 2019. Huggingface’s transformers: State-of-the-art natural language processing. arXiv preprint arXiv:1910.03771.
- Yuan et al. (2022) Ann Yuan, Andy Coenen, Emily Reif, and Daphne Ippolito. 2022. Wordcraft: story writing with large language models. In 27th International Conference on Intelligent User Interfaces, pages 841–852.
- Ziegler et al. (2019) Zachary Ziegler, Yuntian Deng, and Alexander Rush. 2019. Neural linguistic steganography. In Proceedings of the 2019 Conference on Empirical Methods in Natural Language Processing and the 9th International Joint Conference on Natural Language Processing (EMNLP-IJCNLP), pages 1210–1215, Hong Kong, China. Association for Computational Linguistics.
Appendix A Ablating Mask Filling Models
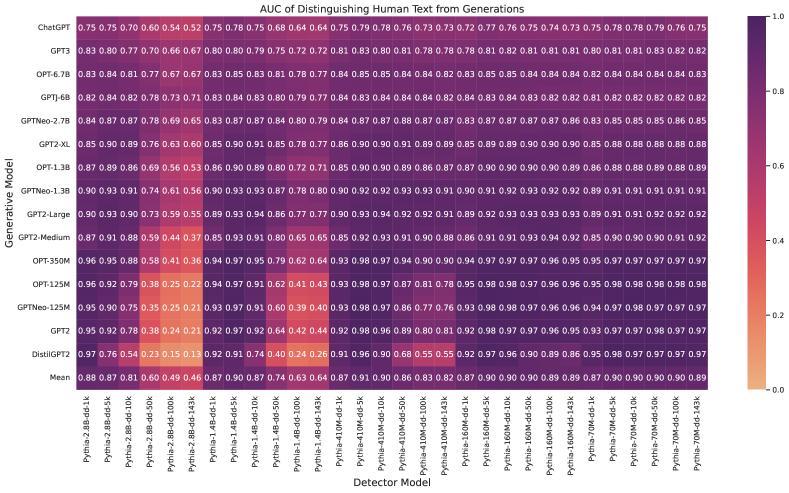
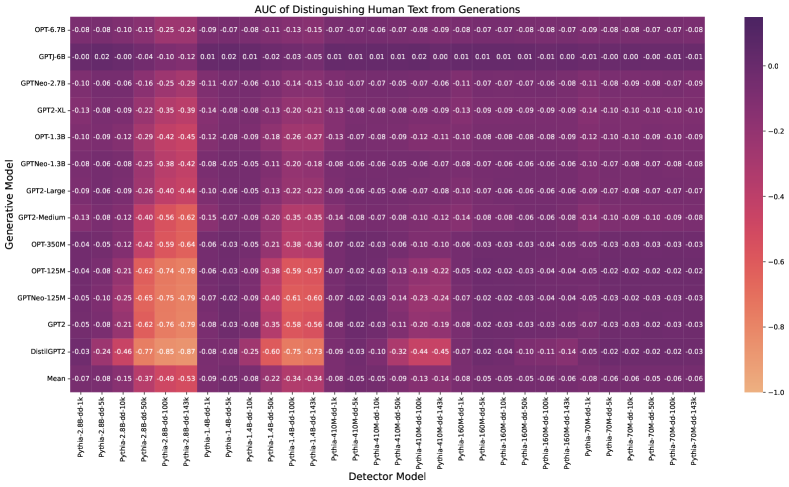
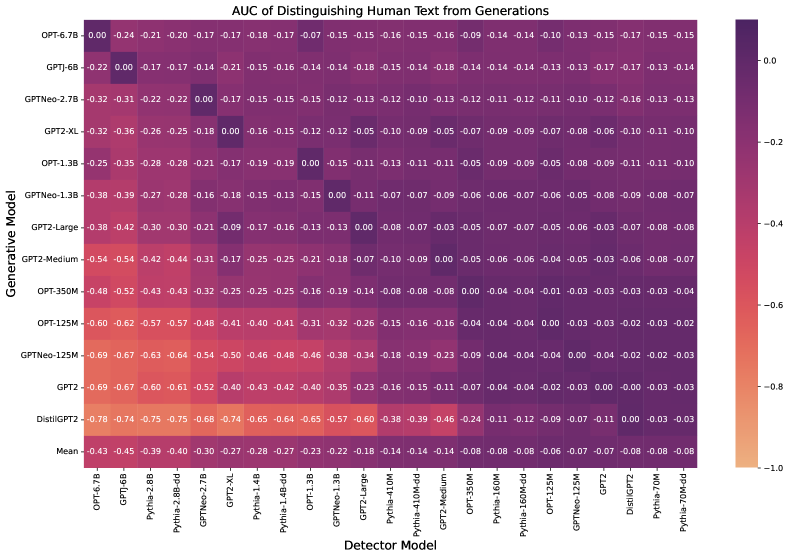
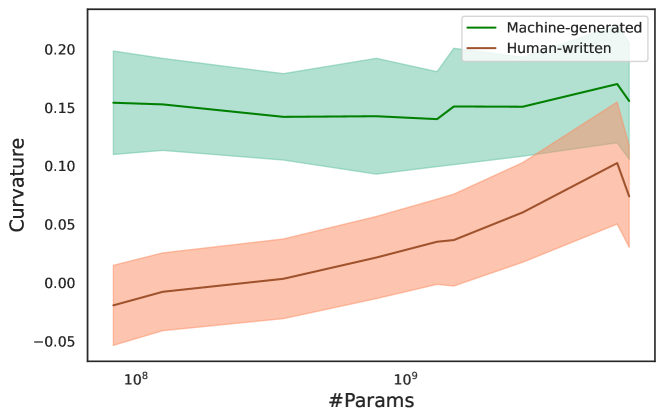
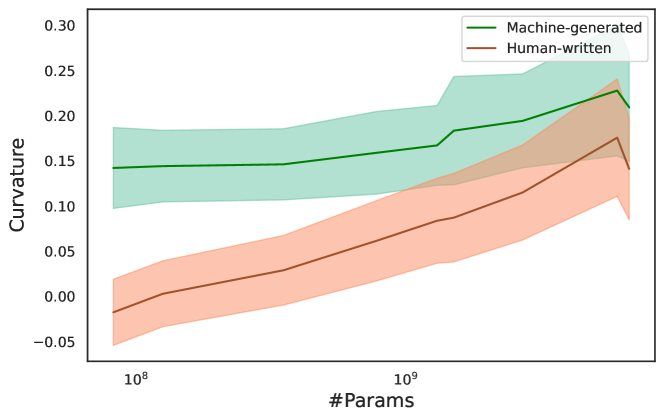
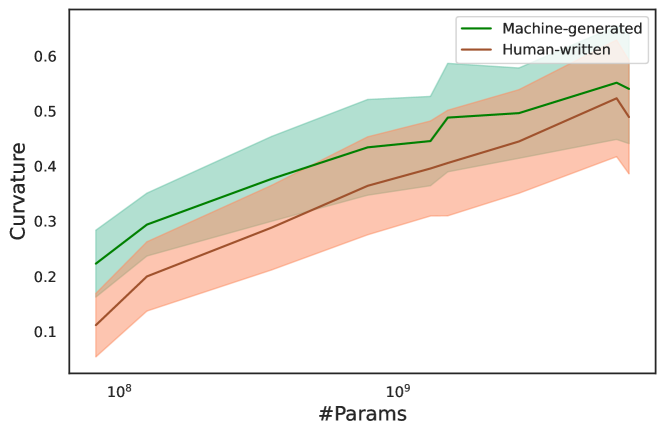
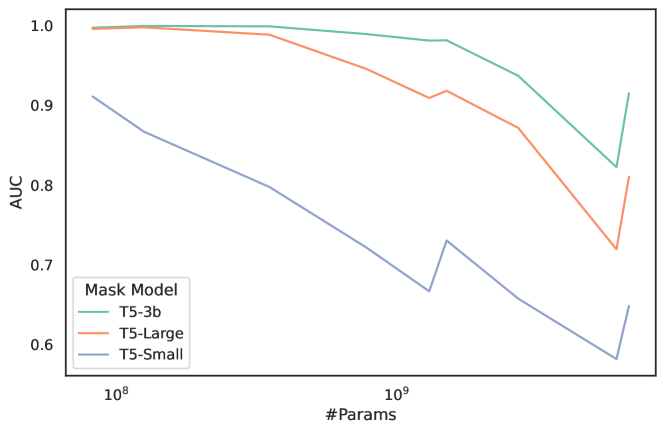
Figure 11 shows the curvature numbers for each model trying to detect its own generations, so for each model the generator is also the detector. We experiment with three perturbation generating models, with three different sizes: (1) T5-small ( million parameters) (2) T5-Large ( million parameters) (3) T5-3B (3 billion parameter). The intuition behind using three model sizes is to see the effect of having a better replacement model on the measured curvatures and the detection power of the detector models.
We can see that as the masking model sizes down (going from top to the bottom subfigures), the overall curvature values for both human-written and machine-generated text increases (going from 0.2 maximum in Figure 11(a) to 0.6 maximum in Figure 11(c)), and the two sets of texts become less distinguishable. T5-Small produces low-quality (low-fluency) neighbors that are assigned lower likelihoods by the detector model, resulting in high curvature numbers for both human and machine generated text, making them indistinguishable. As we improve the mask filling model, however, the generated neighbors become of higher quality (and semantically closer to the target point), thereby creating a more accurate estimate of the curvature and providing better distinguishablity, as shown by the AUC numbers in Figure 11(d).
Appendix B Experimental Setup
B.1 Models
We want to experiment with a wide range of models, with different architectures, parameter counts and training datasets, therefore we use the following model families in our experiments: Facebook’s OPT (we use the 125M, 350M, 1.3B, and 6.7B models), EleutherAI’s GPT-J, GPTNeo and Pythia Biderman et al. (2023) (we use GPTNeo-125M, GPTNeo-1.3B, GPTNeo-2.7B, GPTJ-6B and Pythia models ranging from 70M to 2.8B parameters), and OpenAI’s GPT models (distilGPT, GPT2-Small, GPT2-Medium, GPT2-Large, GPT2-XL, GPT-3 and ChatGPT).
We also have experiments where we use partially trained models as detectors. For those experiments, we only use the Pythia models as they are the only ones with available, open-source partially trained checkpoints. For each Pythia models, there is also a de-duplicated version available, where the model is trained on the de-duplicated version of the data, as opposed to the original dataset. All the models we use are obtained from HuggingFace Wolf et al. (2019).
B.2 Dataset
Evaluation dataset.
We follow Mitchell et al. (2023)’s methodology for pre-processing and feeding the data. We use a subsample of the SQuAD dataset Rajpurkar et al. (2016), where the original dataset sequences are used as the human-written text in the target sequence pool. We then use the first tokens of each human-written sequence as a prompt, and feed this to the target model, and have it generate completions for it. We then use this mix of generations and human-written text to create the target pool for which we do the detection. In all cases, following the methodology from Mitchell et al. (2023), our pool consists of human-written target samples, and machine-generated samples, so the overall pool size is .
Pre-training datasets for the generative models.
The ElutherAI and Facebook models (GPTJ, GPTNeo, Pythia and OPT families) are all trained on the Pile dataset Gao et al. (2020), a curated collection of English language datasets (consisting of web-crawled data, academic articles, dialogues, etc.). As mentioned above there are two versions of each Pythia model Biderman et al. (2023), one version is trained on Pile, the other is trained on de-duplicated Pile. The de-duplicated Pile is approximately 207B tokens in size, compared to the original Pile which contains 300B tokens. There is limited information and access to the training data of the OpenAI models. The GPT-2 family is reportedly trained on the WebText dataset, GPT-3 is trained on a combination of the Common Crawl 222https://commoncrawl.org, WebText2, books and Wikipedia, and there is not any information released about the training data of ChatGPT.
Appendix C Additional Plots
C.1 Extensive Heatmaps
We provide the full heatmaps from experiments of Section 4 here, to provide a detailed breakdown. Figures 2 and 3 (full heatmap is Fig. 8 in Appendix) show the AUC of cross-detection for different models. Figures 10 and 9 in Appendix show how close each detector comes, in terms of AUC, to self-detection.