A non-linear solution to the tension II: Analysis of DES Year 3 cosmic shear
Abstract
Weak galaxy lensing surveys have consistently reported low values of the parameter compared to the Planck cosmology. Amon & Efstathiou (2022) used KiDS-1000 cosmic shear measurements to propose that this tension can be reconciled if the matter fluctuation spectrum is suppressed more strongly on non-linear scales than assumed in state-of-the-art hydrodynamical simulations. In this paper, we investigate cosmic shear data from the Dark Energy Survey (DES) Year 3. The non-linear suppression of the matter power spectrum required to resolve the tension between DES and the Planck model is not as strong as inferred using KiDS data, but is still more extreme than predictions from recent numerical simulations. An alternative possibility is that non-standard dark matter contributes to the required suppression. We investigate the redshift and scale dependence of the suppression of the matter power spectrum. If our proposed explanation of the tension is correct, the required suppression must extend into the mildly non-linear regime to wavenumbers . In addition, all measures of using linear scales should agree with the Planck cosmology, an expectation that will be testable to high precision in the near future.
keywords:
cosmology: cosmological parameters, weak lensing, observations,1 Introduction
The six-parameter cosmological model has been incredibly successful in explaining the anisotropies of the cosmic microwave background (CMB; e.g. Planck Collaboration et al., 2020a), baryon acoustic oscillations (BAO; e.g. Alam et al., 2021) and a wide range of other astronomical data. Nevertheless, there are indications of ’tensions’ between this model and some observations. The ‘Hubble tension’, i.e. the discrepancy between distance ladder measurements of the Hubble parameter at present day, , and the value inferred from the CMB assuming the model, is the most well known (for reviews see Freedman, 2021; Shah et al., 2021; Kamionkowski & Riess, 2022). In addition, there is an apparent discrepancy between the amplitude of the matter fluctuations inferred from the CMB and that measured in cosmic shear surveys which has become known as the ‘ tension’111Where , is the present day matter density in units of the critical density and is the root mean square linear amplitude of the matter fluctuation spectrum., (e.g. Heymans et al., 2013; Asgari et al., 2021; Amon et al., 2022; Secco et al., 2022; Dalal et al., 2023; Li et al., 2023). Since new physics may be required to explain these tensions, they have become the focus of many recent observational and theoretical studies.
This paper is a sequel to Amon & Efstathiou (2022), hereafter Paper I, and is devoted exclusively to the tension. Paper I investigated the hypothesis that the Planck cosmology accurately describes matter fluctuations on linear scales, including their growth rate. The tension is then explained by modifying the matter power spectrum on non-linear scales. Paper I adopted a simple phenomenological model for the matter power spectrum
| (1) |
where the superscript denotes the linear theory power spectrum and the superscript NL denotes the non-linear power spectrum in a model in which the matter behaves like cold dark matter (i.e. ignoring the thermal pressure of baryons and baryonic feedback). The parameter modulates the amplitude of the non-linear spectrum and can describe a suppression of power on small scales. Paper I compared this model to the weak lensing measurements from the Kilo-Degree Survey (KiDS) reported by Asgari et al. (2021) and showed that the Planck cosmology provides acceptable fits to the KiDS shear-shear two-point statistics if the suppression parameter has a value . Our hypothesis explains why the Planck cosmology agrees so well with: (a) the background expansion history measured from Type Ia supernovae over the entire redshift range spanned by the Pantheon sample, (e.g. Brout et al., 2022) and (b) gravitational lensing of the CMB (Planck Collaboration et al., 2020b; Darwish et al., 2021; Omori et al., 2023), since these measurements are dominated by linear scales and are consistent with the predictions of General Relativity (i.e. there is no evidence for ‘gravitational slip’ as might be expected in theories of modified gravity, see e.g. Bertschinger 2011). In fact, point (b) has been strongly reinforced with the recently released CMB weak lensing results from the Atacama Cosmology Telescope (ACT), which are in excellent agreement with the Planck cosmology (Madhavacheril et al., 2023, and references therein).
Our hypothesis predicts that all measures of the fluctuation amplitude dominated by linear scales, such as galaxy redshift-space distortions (e.g. Alam et al., 2021; Philcox & Ivanov, 2022; Chen et al., 2022a; D’Amico et al., 2022) and cross-correlations of CMB lensing with galaxy surveys (e.g. Chang et al., 2023; White et al., 2022; Chen et al., 2022b) should agree with the predictions of the Planck model. As discussed in Paper I there is not yet a consensus on the interpretation of these types of measurements, with some authors reporting tension with . This situation is likely to change in the near future, for example, via cross-correlations of the new ACT lensing maps and galaxy surveys and redshift-space distortion measurements with the Dark Energy Spectroscopic Instrument, (DESI Collaboration et al., 2016, DESI). Should such measurements conflict with on linear scales, our proposed solution of the tension will become untenable.
If the hypothesis of Paper I is correct, what physical processes might be responsible for a suppression of power on small scales? Baryonic feedback is an obvious candidate, though the suppression required to explain the KiDS data is stronger than seen in recent cosmological hydrodynamical simulations (e.g. Dubois et al., 2014; McCarthy et al., 2017; Springel et al., 2018). The physics of feedback is, however, complex and is not yet sufficiently well understood to exclude baryonic feedback as the sole cause of the suppression. Suppression of the power spectrum can also be achieved by invoking more complex models of dark matter, for example, adding a component of warm or axionic dark matter (see e.g. Widrow & Kaiser, 1993; Hu et al., 2000; Hui et al., 2017; Rogers et al., 2023) to the cold dark matter of . Since it may be difficult to disentangle the effects of baryonic feedback from those of exotic dark matter, we adopt a phenomenological approach to modelling the power spectrum on non-linear scales. An alternative approach, based on ad hoc modifications to the halo mass function, has been described recently by Gu et al. (2023). As in Paper I, we remain agnostic as to the exact physical cause of power spectrum suppression.
In this paper, we analyse the cosmic shear two-point statistics from the Dark Energy Survey (DES) Year 3 analysis presented in Amon et al. (2023); Secco, Samuroff et al. (2022), hereafter DES22. The DES measurements are mostly independent of those from KIDS and have somewhat higher statistical power. Our analysis of DES, therefore, provides a check of the results of Paper I. In this work, we extend the analysis of Paper I by generalising Eq. 1 to allow the power suppression to vary with redshift and wavenumber. As we will see it is difficult to extract detailed information on these dependencies with the current generation of weak lensing surveys.
This paper is structured as follows. Sec. 2 discusses the Dark Energy Survey, the data used and the modelling choices made in our analysis. We compare the DES and KiDS constraints on the parameter in Sec. 3. Sec. 4 explores constraints imposed by the DES measurements on the redshift dependence of the power suppression. In Sec. 5, we explore the scale dependence of the suppression to provide more stringent tests of whether baryon feedback can resolve the tension. Finally, we summarize our conclusions and discuss the implications of our results in Sec. 6.
2 Dark Energy Survey
The Dark Energy Survey (DES Abbott et al., 2018, 2021) is a six-year imaging programme that observed deg2 of the Southern Hemisphere in five photometric bands. In this paper, we use data from the first three years of observations (DES Y3) which span the complete footprint of the full survey at a reduced depth. The DES Y3 cosmic shear two-point correlation function measurements presented in DES22 are based upon the shape estimations of over 100 million galaxies (Gatti et al., 2022), calibrated using a suite of image simulations (MacCrann et al., 2022). The data is divided into four redshift bins and the redshift distributions are calibrated to give an overall mean redshift of (Myles et al., 2021).
We reanalyse the DES cosmic shear data using the public DES pipeline and following the analysis of DES22222Following the DES Y3 analysis, we use nested sampling via the Cosmosis cosmology parameter estimation framework (Zuntz et al., 2015), but instead use the MultiNest sampler (Feroz et al., 2009), as used in Paper I. For this specific analysis, investigations of a subset of models made with the sampler Polychord (Handley et al., 2015) gave consistent results, though requiring substantially more computing time for convergence.. We update the analysis choices as follows: we assume three neutrino species with two massless states and one massive state with a mass of ; we adopt the non-linear alignment (NLA) model for intrinsic alignments as described in Secco, Samuroff et al. (2022); we use HMCode2020 (Mead et al., 2021) to model the nonlinear matter power spectrum, which generates a non-negligible shift in the posterior compared to the Halofit model (Takahashi et al., 2012) used in DES22. These analysis choices are tested and compared in detail in DES & KiDS Collaborations (2023).
Table 1 lists the priors used in this paper. For the ‘Free’ cases, we applied uninformative priors on the cosmological parameters, following DES22, with the exception of the neutrino mass which is kept fixed in our analysis. The remaining entries in Table 1 give the priors for the redshift calibration for each bin, , the shear calibration for each bin, , and the single intrinsic alignment parameter of the NLA model, as in DES22.
In Paper I, which was exploratory in nature, we demonstrated that the best fit Planck cosmology provides acceptable fits to the KiDS shear-shear statistics if . However, we did not account for any uncertainty on the cosmological parameters, particularly , as measured by Planck. As a consequence ,Paper I overestimated the suppression of small scale power required to resolve the tension with KiDS. In this paper, instead of a joint analysis, we include the Planck uncertainty on by applying a prior on and derived from the base Planck TTTEEE chains:
| (2) | |||||
This prior is described in more detail in Appendix A. The scalar spectral index and physical baryon density are poorly determined by DES and KiDS but are determined to high-precision by Planck within the context of the six-parameter cosmology. Therefore, we fix these parameters to the best-fit Planck values from Efstathiou & Gratton (2021): and . Finally, for a given value of , the Hubble parameter is set from the well-determined parameter combination . Applying a prior in this way allows us to accurately account for the Planck uncertainty without needing to evaluate the Planck likelihood in our analysis.
| Parameter | ‘Free’ prior | ‘Planck ’ |
| Cosmological | ||
| Total matter density | F | - |
| Baryon density | F | - |
| - | 0.02226 | |
| Scalar spectrum amp. | F | - |
| Hubble parameter | F | - |
| - | 0.09612 | |
| Spectral index | F | 0.9671 |
| Neutrino mass | 0.06 | |
| Systematic | ||
| Intrinsic alignment amp. | F | 0.131 |
| Source redshift 1 | 0.004 | |
| Source redshift 2 | -0.001 | |
| Source redshift 3 | 0.001 | |
| Source redshift 4 | 0.001 | |
| Shear calibration 1 | -0.006 | |
| Shear calibration 2 | -0.019 | |
| Shear calibration 3 | -0.025 | |
| Shear calibration 4 | -0.037 |
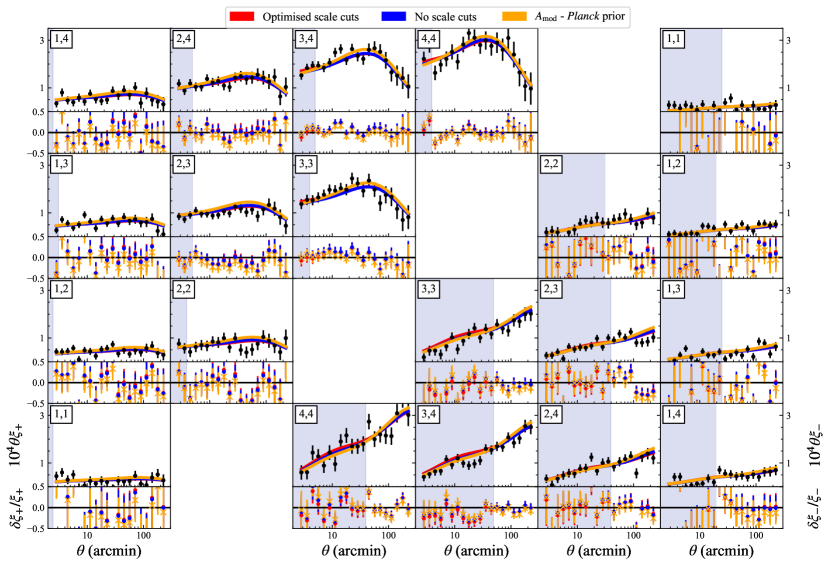
Results of analysing the DES Y3 data for the different parameterisations and modelling choices discussed in this paper are summarized in Table 2. The first two entries (labelled 1 and 2), summarize results from DES22 (see their Table III) using their ‘ Optimised’ scale cuts, which excludes data points lying within the shaded regions in Fig. 1 from the analysis. Both of these analysis variants use Halofit to model the non-linear power spectrum. Variant 1 uses the 5-parameter Tidal Alignment and Tidal Torquing (TATT) model for intrinsic alignments and allows the neutrino mass to vary, as described in DES22. In variant 2, the neutrino mass is fixed to and the two-parameter NLA model, a sub-space of the TATT model which includes a redshift dependence, is used to model intrinsic alignments, resulting in a shift toward a higher value of .
| Variant | Data | Small-scale model | Other | Cosmology | ||||||
| 1* | DES | SC | Halofit, TATT, free- | Free | 273 | 14 | 285.0 | 1.14 | 1.06 | |
| 2* | DES | SC | Halofit | Free | 273 | 14 | 288.1 | 1.28 | 1.07 | |
| 3 | DES | SC | Free | 273 | 14 | 283.7 | 0.66 | 1.06 | ||
| 4 | DES | - | Free | 400 | 14 | 418.1 | 0.80 | 1.06 | ||
| 5 | DES | Free | 400 | 15 | 417.1 | 0.77 | 1.05 | |||
| 6 | DES | Planck | 400 | 3 | 420.7 | 0.80 | 1.06 | |||
| 7 | DES | + SC | Planck | 273 | 3 | 289.4 | 0.81 | 1.07 | ||
| 8 | DES | Free | 400 | 20 | 413.1 | 0.63 | 1.04 | |||
| 9 | DES | Planck | 400 | 8 | 419.3 | 0.77 | 1.05 | |||
| 10 | DES | Free | 400 | 19 | 414.2 | 0.85 | 1.05 | |||
| 11 | DES | Planck | 400 | 7 | 418.1 | 0.73 | 1.05 | |||
| 12 | KiDS | Free | 225 | 21 | 260.3 | 1.89 | 1.18 | |||
| 13 | KiDS | Planck | 225 | 3 | 265.5 | 2.04 | 1.19 |
Variant 3 in Table 2 uses HMCode2020 dark matter model for the non-linear power spectrum, instead of Halofit and simplifies the intrinsic alignment model even further using the NLA model without a redshift-dependence (which Secco, Samuroff et al. (2022) have shown gives an acceptable fit to the DES Y3 data). As in variant 2, the cosmological and nuisance parameters are allowed to vary over the prior ranges given in Table 1. With this set of analysis choices, the mean posterior value of in variant 3 is about higher than the value from variant 2. We refer the reader to DES & KiDS Collaborations (2023) for a detailed analysis of the impact of each these modelling strategies.
Variant 4 is the same as variant 3 except that it uses measurements over the entire angular ranges plotted in Fig. 1 333Note that although the DES Y3 scale cuts were chosen to reduce the sensitivity of to baryonic feedback, small angular scales are subject to other systematics. The most important of these concerns is the modelling of the point spread function, which has been shown to be unimportant on the angular scales used in DES22. Further work is required to assess the impact of PSF uncertainties on on the angular scales falling within the shaded regions of Fig. 1.. The best-fit models from variants 3 and 4 are compared to the DES Y3 measurements in Fig. 1 and although baryon feedback is not accounted for in variant 4, they both provide excellent (almost indistinguishable) fits to the data. The values for these fits are given in Table 2.
Comparing the posterior widths of with the Planck TTTEEE result of (Efstathiou & Gratton, 2021), we see that in variants 3 and 4, is lower by about and , respectively. One might therefore conclude that with the choices made in this paper (i.e. adopting the NLA intrinsic alignment model and HMCode2020) the DES Y3 weak lensing measurements are consistent with Planck even if baryonic feedback effects are ignored. This inference holds, apparently, even for variant 4, which has a smaller error on and is sensitive to spatial scales at which all cosmological hydrodynamical simulations show power spectrum suppression caused by baryonic feedback. However, focusing on the parameter gives a misleading impression of consistency because cosmological parameters allowed by DES are disfavoured by Planck. As we will show in the next section, suppression of the non-linear power spectrum is required at high significance to reconcile the Planck cosmology with DES (and KiDS) weak lensing measurements.
3 Small-scale power suppression: constraints on the parameter
Following Paper I, in this section we incorporate the parameter to model suppression of power on non-linear scales via Eq. 1. Variants 5 and 6 in Table 2 use the full range of angular scales plotted in Fig. 1. Variant 5 allows the cosmological parameters to vary freely over their priors, i.e. it is identical to variant 4 but with the addition of the parameter444Aricò et al. (2023) report constraints using DES weak lensing measurements without scale cuts (see also Chen et al., 2022a). Aricò et al. (2023) use the baryonification prescription (Schneider & Teyssier, 2015; Aricò et al., 2020) to model baryonic feedback but choose priors that restrict the strength of the feedback. Variant 6 includes the Planck prior of Eq. 2.
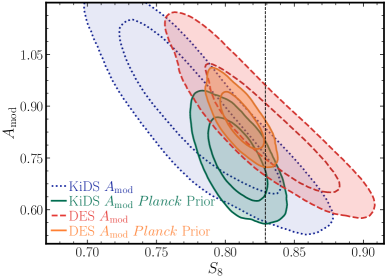
Fig. 2 (left-hand side) compares the DES constraints from variants 5 (red) and 6 (yellow) in the plane. As shown in Paper I and in Fig. 2, the parameter is strongly degenerate with the linear theory value of . The vertical dashed line in Fig. 2 shows the best fit Planck value . The inclusion of the Planck prior tightens the constraints significantly555Note that when we apply the prior, the nuisance parameters are fixed to their best-fit values. We have verified that freeing the nuisance parameters does not significantly alter the constraint on . Similarly, the use of the prior does not cause any significant shifts in the nuisance parameters compared to the DES Y3 fiducial analysis. These tests show that the value of in Eq. 3 is insensitive to the nuisance parameters.. One can see that adding the Planck prior shifts the best fit value of downwards, but within about of the best fit value measured by Planck alone. The Planck cosmology is therefore compatible with the DES Y3 weak lensing measurements provided that the power spectrum is suppressed on non-linear scales with
| (3) |
Thus if no scale cuts are applied, differs from unity by about . Note that the best fit model in variant 6 is plotted as the orange line in Fig. 1 and is almost indistinguishable from the best fits to variants 3 and 4 which allow cosmological parameters to vary freely.
Variant 7 is the same as variant 6 but applies the DES scale cuts. For this case,
| (4) |
The error bar increases compared to Eq. 3 and now the parameter differs from unity by only about . This, of course, does not conflict with Eq. 3 and tells us merely that large angular scales are not as sensitive to power spectrum suppression as smaller angular scales.
The choice of scale cuts in the DES Y3 analysis was based on the baryonic feedback effects measured from the EAGLE (McAlpine et al., 2016) and from the OWLS-AGN (van Daalen et al., 2011) simulations, as detailed in Krause et al. (2021); Secco, Samuroff et al. (2022). Using these simulations, scale cuts were determined which resulted in a maximum two-dimensional bias in the plane of for the cosmic shear analysis. DES22 reported cosmological constraints by applying these scale cuts instead of modelling baryonic feedback effects. Our results in Eq. 4 suggest that this strategy does largely reduce the sensitivity of cosmological results to power suppression on non-linear scales, since the value of in variant 3 is within of the Planck value. However, as scale cuts are used to mitigate baryonic effects, with no attempt to model feedback, the exact biases introduced into the parameter such will depend on the accuracy of the OWLS-AGN simulation as an upper bound on baryonic feedback effects. One cannot rule out small biases towards low values of if the baryonic feedback is actually stronger than in these simulations (or if the power spectrum suppression is caused by the properties of the dark matter). The results in Eq. 4 perhaps hint that this might be the case. What is clear, however, is that when the scale cuts are removed, significant suppression of the non-linear spectrum is required to reconcile the DES Y3 lensing results with the Planck cosmology.
The values of in Eqs. 3 and 4 are both higher than the value reported in Paper I from an analysis of KiDS weak lensing. We compare KiDS with the result of Eq. 3, where no scale cuts are used in either case (though we note that KiDS measurements extend to smaller angular scales than DES). In the analysis of KiDS reported in Paper I, to infer a value of we kept the cosmological parameters fixed to the Planck best fit values, whereas in this paper we have applied the Planck prior of Eq. 2. Including a Planck prior skews towards higher values since the joint likelihood peaks at slightly lower values of . We have repeated the analysis of Paper Iusing including the Planck prior (variant 13 in Table 2) finding
| (5) |
which is higher than the value reported in AE. The joint constraints on and from this variant are shown by the filled blue contours in Fig. 2. The constraints from KiDS where cosmological parameters are allowed to vary freely (variant 12) are shown by the blue dotted contours. These constraints are similar to those from DES, though displaced to lower values of . The differences between KiDS and DES are consistent with sampling fluctuations. Naively combining the two estimates Eqs. 3-5 we find
| (6) |
Thus, according to our model, to reconcile the Planck base cosmology with DES+KiDS weak lensing data requires power spectrum suppression on small scales at high statistical significance ().
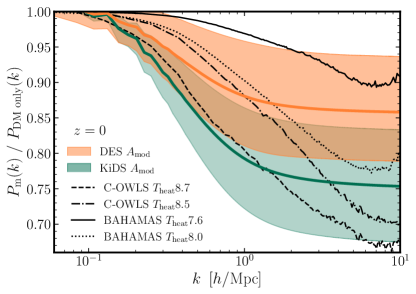
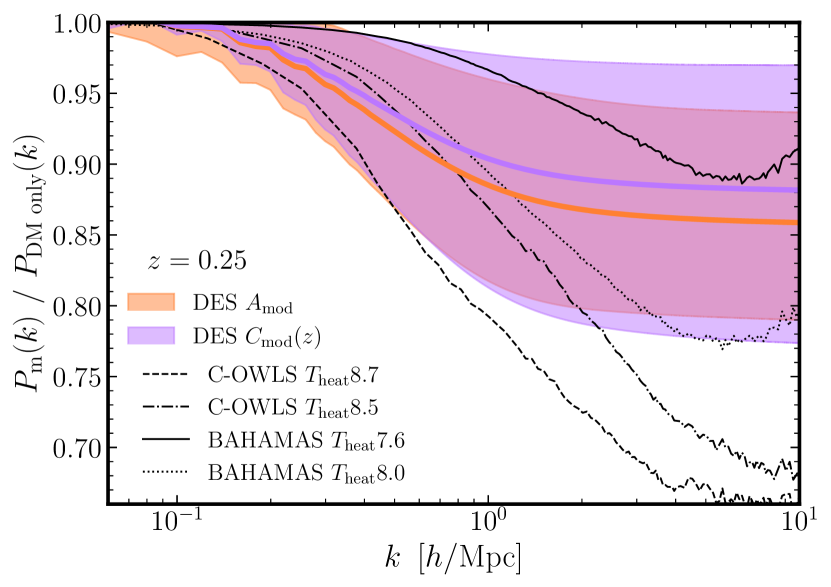
The power spectrum suppression corresponding to Eqs. 3 and 5 at is shown in the right-hand panel of Fig. 2. In this and subsequent figures, we compare our predictions to the power spectrum suppression measured from hydrodynamical simulations taken from van Daalen et al. (2020). The solid and dotted lines correspond to the lower and upper bounds on the power spectrum suppression suggested by the BAHAMAS simulations (McCarthy et al., 2017, BAryons and HAloes of MAssive Systems). These correspond to their AGN feedback parameter of and respectively. With the feedback prescription adopted in BAHAMAS, the choice provides a good match to the observed gas fractions in groups and clusters and to the stellar mass function at (van Daalen et al., 2020). The feedback prescription used in the two C-OWLS simulations (Le Brun et al., 2014, COSMO-Overwhelmingly Large Simulations) is the same as in BAHAMAS and uses higher values of log). As a result, the power spectrum suppression in C-OWLS is stronger and extends to lower wavenumbers than in the BAHAMAS simulations. As discussed in van Daalen et al. (2020) the stronger feedback in these simulations resulted in deficit of galaxies with stellar masses below compared to observations. For reference, the power spectrum suppression in the OWLS-AGN simulation used to select the DES angular scale cuts is similar to that in the fiducial BAHAMAS simulations with . The suppression in the EAGLE simulations is much weaker than any of the simulations plotted in Fig. 2, see Chisari et al. (2019).
To reconcile Planck with weak lensing based on DES and KiDS, the power spectrum on non-linear scales must be more strongly suppressed than in the BAHAMAS simulation with (which over the wavenumber range is well approximated by ). Stronger power spectrum suppression, closer to the two C-OWLS models plotted in Fig. 2 is required to match the results of Eqs. 3 and 5.
The one parameter model has the virtue of simplicity, but severely restricts the functional form of any power suppression. Ideally, one would want to reconstruct both the redshift and wavenumber dependence of the matter power spectrum directly from the observations. However, current weak lensing data are not sufficiently powerful to allow a full 2-dimensional reconstruction. The next two sections should therefore be considered exploratory. Sec. 4 investigates a simple parametric form for the redshift dependence, while Sec. 5 investigates the wavenumber dependence of the power spectrum by splitting into a coarse set of bins in .
4 Redshift dependent power suppression
As discussed in DES22, the DES Y3 shear analysis is performed using four tomographic redshift bins with mean redshifts of , , and . The mean redshift of the entire sample is so we would expect the weak lensing statistics to be most sensitive to the matter distribution at a redshift and to have little sensitivity to the matter distribution at higher redshifts.
This reasoning can be made more quantitative by analysing a parametric form of the redshift dependence of the matter power suppression. We chose the following functional form
| (7a) | |||
| where the functions are | |||
| (7b) | |||
The matter power spectrum suppression according to this model is
| (8) |
and uses six parameters , , , , , instead of the single parameter of Eq. 1. We adopt flat priors on these parameters as summarized in Table 3.
| Parameter | Prior | Marginal Mean | ||
|---|---|---|---|---|
| free cosmology | Planck prior | |||
| F[0.5, 1.0] | ||||
| F[0.5, 1.0] | ||||
| F[0.1, 1.0] | ||||
| F[1.0, 4.0] | ||||
| F[1.0, 4.0] | ||||
| F[1.0, 4.0] | ||||
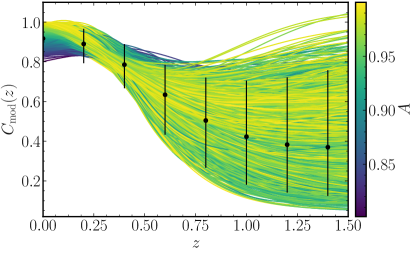
Figure 4 compares the power spectrum suppression constraints from variant 9 (purple contours) with those from the one-parameter model of variant 6 (orange contours). We show the results at a redshift of , since at this redshift the results are insensitive to our choice of the fitting function and priors. The purple contours span a slightly broader range than the orange contours, since in the model, one can trade off increased suppression at with decreases in suppression at higher and lower redshifts and vice-versa. We also show the suppression measured in the cosmological hydrodynamics simulations at . These are almost identical to the simulation results at shown in Fig. 2.
In conclusion, the results of this section show that the DES data lack the statistical power to reconstruct the redshift dependence of the power suppression. Most of the statistical power of DES weak lensing comes from the matter distribution at , with relatively little sensitivity to the behaviour at higher or lower redshifts. The one parameter model cannot therefore be extrapolated beyond a relatively narrow range of redshifts centred at .
5 Scale-dependent suppression
In this section, we explore the scale-dependence of the non-linear matter power spectrum suppression by replacing the parameter with five parameters, m separated in wavenumber as follows:
| (9) |
where is in units of throughout this section.
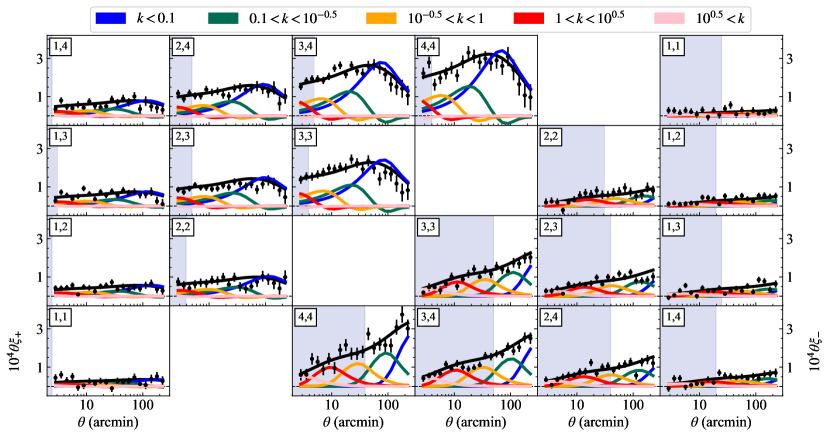
To begin, we examine the contribution of each of the -bins to the prediction of the DES Y3 data666Specifically, we use the best-fit parameters from the analysis variant 4 in Table 2, with no scale cuts, shown in Fig. 5. We make several observations: (i) as is well known at any given angular scale the statistics mix of information from a wide range of -scales; (ii) is significantly more sensitive to non-linear information compared to ; (iii) the bin covering linear scales (, plotted in blue) makes little contribution to over the measured angular range, though it is important for the larger values of ; (iv) the DES scale cuts effectively remove sensitivity to wavenumbers , thus small angular scales that are within the scale cuts must be included to constrain the parameters and .
| Parameter | Prior | Marginal Mean | ||
|---|---|---|---|---|
| free cosmology | Planck prior | |||
| F[0.5, 1.0] | ||||
| F[0.5, 1.0] | ||||
| F[0.5, 1.0] | ||||
| F[0.5, 1.0] | ||||
| F[0.5, 1.0] | ||||
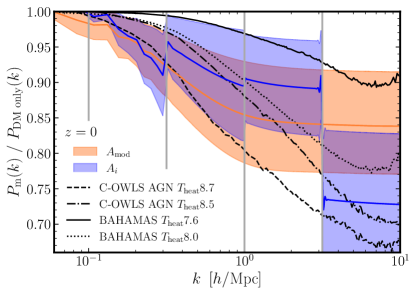
We adopt flat priors on each parameter, as summarized in Table 4, with the lower limits describing much more extreme power suppression than seen in cosmological hydrodynamical simulations. The posterior mean value of and reduced- for the analysis are given in Table 2 for both the free cosmology and Planck prior cases (variants 10 and 11 respectively). The mean value of the posterior and the standard deviations of the parameters are reported in Table 4.
Fig. 6 shows the predicted power suppression in each -bin (separated by grey vertical lines), compared to the fiducial for the fits that include the Planck prior. The constraints from the binned model track the general shape and amplitude of the one-parameter model. The main new result from this analysis is that power suppression of % spanning mildly non-linear scales (bin 2, spanning wavenumbers in the range ) is required to reconcile the Planck data with the DES weak lensing data. It is not possible to avoid suppression in bin 2 by increasing the suppression at smaller scales, mainly because is dominated by bin 2 over the angular range (see the green curves in Fig. 5).
Fig. 6 also shows the power spectrum suppression measured in the BAHAMAS and C-OWLS simulations (as in Fig. 2). Evidently, if baryonic feedback is responsible for the apparent tension, the analysis of this section shows that the feedback must propagate to scales . This requires stronger feedback than in the BAHAMAS simulation with favoured by (McCarthy et al., 2017), in agreement with the conclusions of Sec. 3.
6 Discussion and Conclusion
The aim of this investigation has been to assess whether the tension can be resolved, that is Planck cosmology can be made consistent with weak lensing observations by modifying the matter power spectrum on non-linear scales. Following Paper I, we have investigated constraints on the power suppression parameter, of Eq. 1, using DES Y3 cosmic shear data. In this analysis we include a Planck prior describing their constraints on key cosmological parameters and the associated uncertainties.
The DES data require substantial suppression of the matter power spectrum on non-linear scales to become consistent with Planck. The suppression required is less extreme than found from the KiDS weak lensing measurements, though the results from these two surveys are statistically consistent. However, if such a suppression is interpreted in terms of baryonic feedback, then it must be stronger than the most extreme feedback prescription implemented in the BAHAMAS simulations.
The constraints on depend on the angular scale cuts applied to the measurements. If the DES ‘-Optimised’ angular scale cuts are imposed on , the cosmological constraints from DES data are degraded and are statistically compatible with the Planck cosmology. For this case, is consistent with unity, though with a large error.
We have analysed the DES Y3 data using an extended model that includes either a redshift or wavenumber dependence. The DES data have little sensitivity to redshifts outside of a relatively narrow range centred at . The one parameter model, therefore, provides an adequate approximation at this redshift but cannot be extrapolated reliably to higher or lower redshifts.
To investigate the wavenumber dependence, we solved for amplitude suppression factors in five logarithmically spaced bins. The results show that consistency between DES and Planck requires suppression on scales . This result is in agreement with our results for and shows that the requirement of the data for power suppression on these scales is not an artefact of the simple parameterisation.
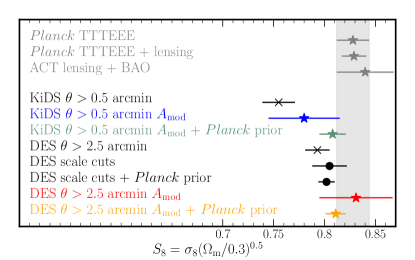
Fig. 7 summarizes both the updated results of Paper I and this paper. The entry labelled Planck TTTEEE shows the Planck base constraints from Efstathiou & Gratton (2021) and the entry labelled Planck TTTEEE+lensing includes the Planck lensing likelihood (Planck Collaboration et al., 2020b). ACT lensing+BAO shows the constraints from the recent ACT CMB lensing results combined with baryon acoustic oscillation measurements (Madhavacheril et al., 2023). These measurements are derived from predominantly linear scales () and demonstrate that the cosmology provides a consistent description of the matter fluctuations from the redshift of recombination to the low redshifts that dominate the CMB lensing signal, .
To compare the results from the CMB with those from weak gravitational lensing, it is necessary to extract the linear amplitude of the matter fluctuations from statistics that are dominated by non-linear scales. This requires an accurate model of the dark matter power spectrum on non-linear scales, including modifications caused by baryonic feedback. Incorrect modelling of the non-linear spectrum can therefore lead to an apparent tension between weak lensing estimates of and those measured from the CMB.
This is illustrated by the remaining entries in Fig. 7 which summarize results from the KiDS and DES Y3 weak lensing. One can see that there are varying degrees of tension with the CMB. The two entries labelled ‘KiDS ’ (from Paper I) and ‘DES ’ (variant 4) use the full angular ranges of reported by the two surveys (i.e. no scale cuts). For these entries Fig. 7 shows results on allowing cosmological parameters to vary freely, using HMCode2020 to model the non-linear spectrum and ignoring baryonic feedback. The ‘tension’777The numbers quoted here are based on the simple expression . with the Planck TTTEEE+lensing entry is for KiDS and for DES. If we apply the DES -Optimised scale cuts (variant 3) the tension with the Planck drops to . This suggests that the scale cuts have largely eliminated sensitivity to non-linear power spectrum suppression, at the expense of increasing the error on , leading to consistency with Planck. The fact that DES in this case is slightly low may be because the effects of non-linear power spectrum suppression have not been eliminated entirely.
If we impose a Planck prior and include the parameter , the DES and KiDS lensing can be made compatible with Planck, with or without scale cuts. The question then is whether the small scale suppression required is physically reasonable. As summarized above, if it is caused by baryonic feedback, then the suppression must be stronger than favoured in recent cosmological hydrodynamic simulations. However, underestimating baryonic effects is not the only plausible interpretation since the suppression may reflect non-standard properties of the dark matter on non-linear scales (see e.g. Poulin et al., 2022; Rogers et al., 2023).
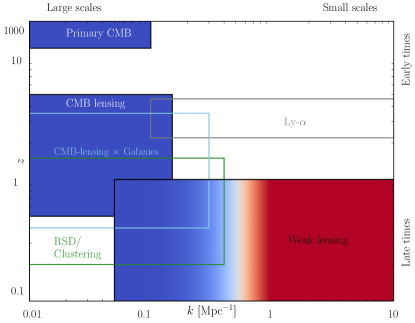
If the weak-lensing tension is caused by suppression of power on non-linear scales, what would we expect for other cosmological measurements? Fig. 8 shows a sketch of the wavenumber and redshift ranges covered by various cosmological observations. As noted in Paper I, all measures of at low redshift from linear scales should agree with the Planck cosmology. Specifically, CMB lensing measurements combined with baryon acoustic oscillations, such as recent measurements from Advanced ACT are consistent with the Planck cosmology (Madhavacheril et al., 2023). Cross-correlations of CMB lensing with galaxy surveys can provide an important test of this hypothesis. Forthcoming analyses using the latest CMB lensing maps from ACT (Qu et al., 2023) and the South Pole Telescope (Omori et al., 2023) should agree with the predictions of the Planck model.
As reviewed in Paper I redshift-space distortions measured from linear scales from current galaxy redshift surveys are consistent with our interpretation, but not to high precision. This situation should change decisively in the near future with RSD measurements from DESI (see e.g. Schlegel et al., 2022, and references therein). Measurements of from quasar Ly-alpha lines from DESI uniquely give access to high and and offer an opportunity to potentially break the degeneracy between baryonic feedback and non-standard dark matter. Tests of a redshift-dependent growth, or using measurements from from linear scales should be consistent with (White et al., 2022; DES Collaboration et al., 2022; García-García et al., 2021)888However, deviations from the growth rate have been reported when linear measurements are combined with weak galaxy lensing measurements that are sensitive to non-linear scales (García-García et al., 2021; Abbott et al., 2023)..
Weak galaxy lensing measurements offer a window to a wide range of scales as indicated in Fig. 8. In the future, it may be possible to reconstruct the power spectrum as a function of wavenumber and redshift from weak lensing data. Assuming that systematic errors can be sufficiently mitigated, it may become possible to accurately test the cosmology on linear scales and to reconstruct the matter power spectrum on small scales using weak galaxy lensing data alone. Such an analysis would establish unambiguously whether the tension is caused by a deviation from the model at late times, or whether it is an apparent tension caused by physics on non-linear scales.
Acknowledgements
The authors would like to thank Joe Zuntz and Niall MacCrann for help in handling cosmosis (Zuntz et al., 2015). CP would like to thank Jessie Muir and Sujeong Lee for helpful discussions on modified growth of structure, and Anthony Challinor for useful discussions on CMB lensing. Alexandra Amon is supported by a Kavli Fellowship. George Efstathiou is supported by an Leverhulme Trust Emeritus Fellowship. Calvin Preston is supported by a Science and Technology Facilities Council studentship.
This project has used public archival data from both the Dark Energy Survey and the Kilo Degree Survey. Funding for the DES Projects has been provided by the U.S. Department of Energy, the U.S. National Science Foundation, the Ministry of Science and Education of Spain, the Science and Technology FacilitiesCouncil of the United Kingdom, the Higher Education Funding Council for England, the National Center for Supercomputing Applications at the University of Illinois at Urbana-Champaign, the Kavli Institute of Cosmological Physics at the University of Chicago, the Center for Cosmology and Astro-Particle Physics at the Ohio State University, the Mitchell Institute for Fundamental Physics and Astronomy at Texas A&M University, Financiadora de Estudos e Projetos, Fundação Carlos Chagas Filho de Amparo à Pesquisa do Estado do Rio de Janeiro, Conselho Nacional de Desenvolvimento Científico e Tecnológico and the Ministério da Ciência, Tecnologia e Inovação, the Deutsche Forschungsgemeinschaft, and the Collaborating Institutions in the Dark Energy Survey. The Collaborating Institutions are Argonne National Laboratory, the University of California at Santa Cruz, the University of Cambridge, Centro de Investigaciones Energéticas, Medioambientales y Tecnológicas-Madrid, the University of Chicago, University College London, the DES-Brazil Consortium, the University of Edinburgh, the Eidgenössische Technische Hochschule (ETH) Zürich, Fermi National Accelerator Laboratory, the University of Illinois at Urbana-Champaign, the Institut de Ciències de l’Espai (IEEC/CSIC), the Institut de Física d’Altes Energies, Lawrence Berkeley National Laboratory, the Ludwig-Maximilians Universität München and the associated Excellence Cluster Universe, the University of Michigan, the National Optical Astronomy Observatory, the University of Nottingham, The Ohio State University, the OzDES Membership Consortium, the University of Pennsylvania, the University of Portsmouth, SLAC National Accelerator Laboratory, Stanford University, the University of Sussex, and Texas A&M University. Based in part on observations at Cerro Tololo Inter-American Observatory, National Optical Astronomy Observatory, which is operated by the Association of Universities for Research in Astronomy (AURA) under a cooperative agreement with the National Science Foundation. Based on observations made with ESO Telescopes at the La Silla Paranal Observatory under programme IDs 177.A-3016, 177.A-3017, 177.A-3018 and 179.A-2004, and on data products produced by the KiDS consortium. The KiDS production team acknowledges support from: Deutsche Forschungsgemeinschaft, ERC, NOVA and NWO-M grants; Target; the University of Padova, and the University Federico II (Naples).
Data availability
No new data were generated or analysed in support of this research.
References
- Abbott et al. (2018) Abbott T. M. C., et al., 2018, ApJS, 239, 18
- Abbott et al. (2021) Abbott T. M. C., et al., 2021, ApJS, 255, 20
- Abbott et al. (2023) Abbott T. M. C., et al., 2023, Phys. Rev. D, 107, 023531
- Alam et al. (2021) Alam S., et al., 2021, Phys. Rev. D, 103, 083533
- Amon & Efstathiou (2022) Amon A., Efstathiou G., 2022, MNRAS, 516, 5355
- Amon et al. (2022) Amon A., et al., 2022, Phys. Rev. D, 105, 023514
- Amon et al. (2023) Amon A., et al., 2023, MNRAS, 518, 477
- Aricò et al. (2020) Aricò G., Angulo R. E., Hernández-Monteagudo C., Contreras S., Zennaro M., Pellejero-Ibañez M., Rosas-Guevara Y., 2020, MNRAS, 495, 4800
- Aricò et al. (2023) Aricò G., Angulo R. E., Zennaro M., Contreras S., Chen A., Hernández-Monteagudo C., 2023, arXiv e-prints, p. arXiv:2303.05537
- Asgari et al. (2021) Asgari M., et al., 2021, A&A, 645, A104
- Bertschinger (2011) Bertschinger E., 2011, Philosophical Transactions of the Royal Society of London Series A, 369, 4947
- Brout et al. (2022) Brout D., et al., 2022, ApJ, 938, 111
- Chang et al. (2023) Chang C., et al., 2023, Phys. Rev. D, 107, 023530
- Chen et al. (2022a) Chen S.-F., White M., DeRose J., Kokron N., 2022a, J. Cosmology Astropart. Phys., 2022, 041
- Chen et al. (2022b) Chen S.-F., White M., DeRose J., Kokron N., 2022b, J. Cosmology Astropart. Phys., 2022, 041
- Chisari et al. (2019) Chisari N. E., et al., 2019, The Open Journal of Astrophysics, 2, 4
- D’Amico et al. (2022) D’Amico G., Donath Y., Lewandowski M., Senatore L., Zhang P., 2022, arXiv e-prints, p. arXiv:2206.08327
- DES & KiDS Collaborations (2023) DES KiDS Collaborations 2023, The Open Journal of Astrophysics
- DES Collaboration et al. (2022) DES Collaboration et al., 2022, arXiv e-prints, p. arXiv:2207.05766
- DESI Collaboration et al. (2016) DESI Collaboration et al., 2016, arXiv e-prints, p. arXiv:1611.00036
- Dalal et al. (2023) Dalal R., et al., 2023, Hyper Suprime-Cam Year 3 Results: Cosmology from Cosmic Shear Power Spectra (arXiv:2304.00701)
- Darwish et al. (2021) Darwish O., et al., 2021, MNRAS, 500, 2250
- Dubois et al. (2014) Dubois Y., et al., 2014, MNRAS, 444, 1453
- Efstathiou & Gratton (2021) Efstathiou G., Gratton S., 2021, The Open Journal of Astrophysics, 4, 8
- Feroz et al. (2009) Feroz F., Hobson M. P., Bridges M., 2009, Monthly Notices of the Royal Astronomical Society, 398, 1601
- Freedman (2021) Freedman W. L., 2021, ApJ, 919, 16
- García-García et al. (2021) García-García C., Ruiz Zapatero J., Alonso D., Bellini E., Ferreira P. G., Mueller E.-M., Nicola A., Ruiz-Lapuente P., 2021, arXiv e-prints,
- Gatti et al. (2022) Gatti M., et al., 2022, Phys. Rev. D, 106, 083509
- Gu et al. (2023) Gu S., Dor M.-A., van Waerbeke L., Asgari M., Mead A., Tröster T., Yan Z., 2023, arXiv e-prints, p. arXiv:2302.00780
- Handley et al. (2015) Handley W. J., Hobson M. P., Lasenby A. N., 2015, MNRAS, 453, 4384
- Heymans et al. (2013) Heymans C., et al., 2013, MNRAS, 432, 2433
- Hu et al. (2000) Hu W., Barkana R., Gruzinov A., 2000, Phys. Rev. Lett., 85, 1158
- Hui et al. (2017) Hui L., Ostriker J. P., Tremaine S., Witten E., 2017, Phys. Rev. D, 95, 043541
- Kamionkowski & Riess (2022) Kamionkowski M., Riess A. G., 2022, arXiv e-prints, p. arXiv:2211.04492
- Krause et al. (2021) Krause E., et al., 2021, arXiv e-prints, p. arXiv:2105.13548
- Le Brun et al. (2014) Le Brun A. M. C., McCarthy I. G., Schaye J., Ponman T. J., 2014, MNRAS, 441, 1270
- Li et al. (2023) Li X., et al., 2023, Hyper Suprime-Cam Year 3 Results: Cosmology from Cosmic Shear Two-point Correlation Functions (arXiv:2304.00702)
- MacCrann et al. (2022) MacCrann N., et al., 2022, MNRAS, 509, 3371
- Madhavacheril et al. (2023) Madhavacheril M. S., et al., 2023, The Atacama Cosmology Telescope: DR6 Gravitational Lensing Map and Cosmological Parameters (arXiv:2304.05203)
- McAlpine et al. (2016) McAlpine S., et al., 2016, Astronomy and Computing, 15, 72
- McCarthy et al. (2017) McCarthy I. G., Schaye J., Bird S., Le Brun A. M. C., 2017, MNRAS, 465, 2936
- Mead et al. (2021) Mead A. J., Brieden S., Tröster T., Heymans C., 2021, MNRAS, 502, 1401
- Myles et al. (2021) Myles J., et al., 2021, MNRAS, 505, 4249
- Omori et al. (2023) Omori Y., et al., 2023, Phys. Rev. D, 107, 023529
- Philcox & Ivanov (2022) Philcox O. H. E., Ivanov M. M., 2022, Phys. Rev. D, 105, 043517
- Planck Collaboration et al. (2020a) Planck Collaboration et al., 2020a, A&A, 641, A6
- Planck Collaboration et al. (2020b) Planck Collaboration et al., 2020b, A&A, 641, A8
- Poulin et al. (2022) Poulin V., Bernal J. L., Kovetz E., Kamionkowski M., 2022, arXiv e-prints, p. arXiv:2209.06217
- Qu et al. (2023) Qu F. J., et al., 2023, arXiv e-prints
- Rogers et al. (2023) Rogers K. K., Hložek R., Laguë A., Ivanov M. M., Philcox O. H. E., Cabass G., Akitsu K., Marsh D. J. E., 2023, arXiv e-prints, p. arXiv:2301.08361
- Schlegel et al. (2022) Schlegel D. J., et al., 2022, arXiv e-prints, p. arXiv:2209.03585
- Schneider & Teyssier (2015) Schneider A., Teyssier R., 2015, J. Cosmology Astropart. Phys., 2015, 049
- Secco et al. (2022) Secco L. F., Samuroff S., et al., 2022, Phys. Rev. D, 105, 023515
- Shah et al. (2021) Shah P., Lemos P., Lahav O., 2021, A&ARv, 29, 9
- Springel et al. (2018) Springel V., et al., 2018, MNRAS, 475, 676
- Takahashi et al. (2012) Takahashi R., Sato M., Nishimichi T., Taruya A., Oguri M., 2012, ApJ, 761, 152
- White et al. (2022) White M., et al., 2022, J. Cosmology Astropart. Phys., 2022, 007
- Widrow & Kaiser (1993) Widrow L. M., Kaiser N., 1993, ApJ, 416, L71
- Zuntz et al. (2015) Zuntz J., et al., 2015, Astronomy and Computing, 12, 45
- van Daalen et al. (2011) van Daalen M. P., Schaye J., Booth C. M., Dalla Vecchia C., 2011, MNRAS, 415, 3649
- van Daalen et al. (2020) van Daalen M. P., McCarthy I. G., Schaye J., 2020, MNRAS, 491, 2424
Appendix A Planck prior
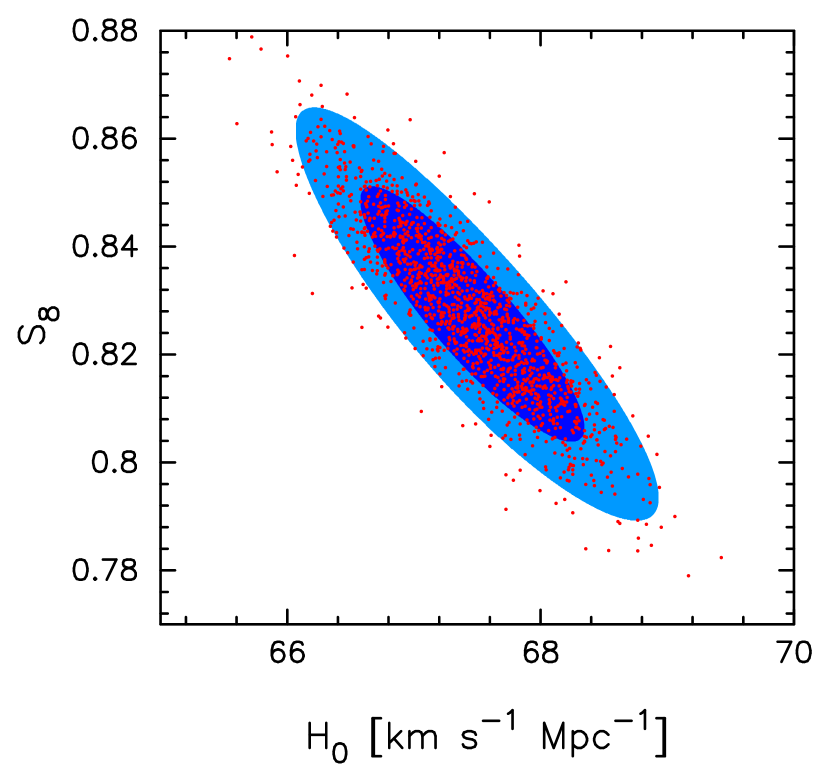
In this appendix we justify the Planck prior of Eq. 2. In the base model, the spectral index is well determined by Planck and can be fixed to the Planck best fit value. The main parameters that affect weak lensing are , and (or combinations of these parameters). The parameter combination is a proxy for the acoustic peak location parameter, , and is extremely well determined by Planck. The Planck degeneracies in the space of , and can be approximated accurately by adopting a two dimensional Gaussian in and and imposing a delta function constraint on the parameter combination . The specific form of Eq. 2 comes from the inverse of the covariance matrix of the parameters and determined from the COSMOMC chains. The degeneracies in the and planes inferred from Eq. 2 are plotted in Fig. 9 and are compared to samples from the COSMOMC chains.