Veršič et al. \righttitleIAU Symposium 379: Flattening of dark matter halo of NGC 5128
17 \jnlDoiYr2023 \doival10.1017/xxxxx
Proceedings of IAU Symposium 379
The flattening of dark matter halo of Centaurus A galaxy (NGC 5128) out to 40 kpc
Abstract
Cosmological simulations predict dark matter shapes that deviate from spherical symmetry. The exact shape depends on the prescription of the simulation and the interplay between dark matter and baryons. This signature is most pronounced in the diffuse galactic haloes that can be observationally probed with planetary nebulae and globular clusters (GCs). The kinematic observations of these halo tracers support intrinsic triaxial shape for the mass generating the gravitational potential. With discrete axisymmetric modelling of GCs as the halo tracers of NGC 5128 we investigate the overall mass distribution of this nearby giant elliptical galaxy. Our modelling approach constrains , and inclination. We derive a preliminary M⊙ and flattening indicative of prolate/triaxial halo for NGC 5128.
keywords:
(cosmology): dark matter; galaxies: halos; galaxies: elliptical and lenticular; evolution; individual: NGC 5128; galaxies: kinematics and dynamics1 Introduction
Mass is the dominant driver of structure formation and evolution. In the concordance model of CDM cosmology, dark matter is the dominant mass component in the Universe. CDM has been very successful at explaining the observed properties of galaxy populations. However, there are still some predictions from the theory that have been challenging to constrain observationally. One such challenge is the intrinsic shape of the dark matter haloes. The shape is quantified with the axis ratios of a 3D ellipsoid: and , where are semi-major, intermediate and minor axis. Halos with are considered prolate and are considered oblate, otherwise, the shape is triaxial.
NGC 5128 (CenA) is a nearby early-type galaxy (ETG), owing to its proximity and mass it is an excellent target for dynamical modelling of its halo tracers to constrain the flattening of the dark matter halo. At a distance of 3.8 Mpc (Harris et al.,, 2010) and with a stellar mass of M⊙ this galaxy hosts 1700 discrete kinematic tracers, Globular Clusters (GCs) and Planetary Nebulae (PNe) with velocity measurements in the literature. Using PNe kinematics Peng et al., 2004a found evidence for a triaxial potential of CenA.
In this proceeding, we outline the scientific rationale behind the dynamical studies of dark matter shapes, introduce NGC 5128 as a test case and discuss the first steps of the dynamical modelling of its halo tracers.
2 Dark matter halo shapes
Observationally, dark matter can only be probed through its gravitational influence on the baryons. We can use dynamical modelling to investigate the distribution of dark matter that best explains the motions of luminous matter in the dark matter-dominated galactic haloes. To carry out dynamical modelling and measure the shape of dark matter at these radii we need kinematic tracers of the galactic halo: GCs and PNe. In cosmological simulations, on the other hand, the distribution and shape of dark and baryonic matter can be determined directly through the positions of the simulated particles.
2.1 Simulations
Studies of N-body dissipationless simulations (Allgood et al.,, 2006) found a strong dependence of the halo shape with the different cosmological parameters and the dark matter fraction. These authors find dark matter haloes are prolate in the centres and become more spherical close to the virial radius, and similar conclusion was reached by Hayashi et al., (2007). In the Illustris simulations, Chua et al., (2019) found that baryonic physics acts to make the haloes rounder and more oblate. The impact varies with the halo mass and has strong radial variation, the strongest impact is for M⊙ at .
2.2 Observational constraints
The Milky Way provides a unique vantage point and the possibility to study a galaxy in the greatest detail. However, depending on the technique and data used the recovered shape of the dark matter halo of the Galaxy vary (Bland-Hawthorn and Gerhard,, 2016, and references therein).
Beyond the Milky Way isolated studies have found strongly prolate haloes for WLM, a gas-rich dwarf galaxy with the major axis of the dark and baryonic components perpendicular to each other (Leung et al.,, 2021). Khoperskov et al., (2014) found that polar ring galaxies are hosted in haloes that are more prolate in the outer regions and oblate in the centres. While dynamical modelling enables direct measurements of the shape, Pulsoni et al., (2018) find that ETGs have more diverse kinematic properties in their halos than in the central regions. With PNe they find all slow rotators and 40% of fast rotators show signatures of triaxial halos such as kinematic twists or misalignments.
3 The Centaurus A galaxy
NGC 5128 is the closest early-type galaxy to us classified as giant Elliptical or S0 and has clear evidence of a recent accretion history or possibly a major merger (Wang et al.,, 2020, and references therein). It hosts a radio source Cenutarus A and for simplicity, we will refer to the galaxy as CenA. Its proximity has enabled detailed studies of the resolved RGB (red giant branch) stars out to more than 25 Re(140 kpc) in Rejkuba et al., (2022) providing constraints on the stellar halo distribution. Spectroscopic observations of a large population of PNe (Peng et al., 2004a, ; Walsh et al.,, 2015) and GCs (Hughes et al.,, 2023) over a vast halo area provide a necessary sample of kinematic tracers for the dynamical modelling that we are exploiting in this work.
3.1 Kinematics of the globular clusters
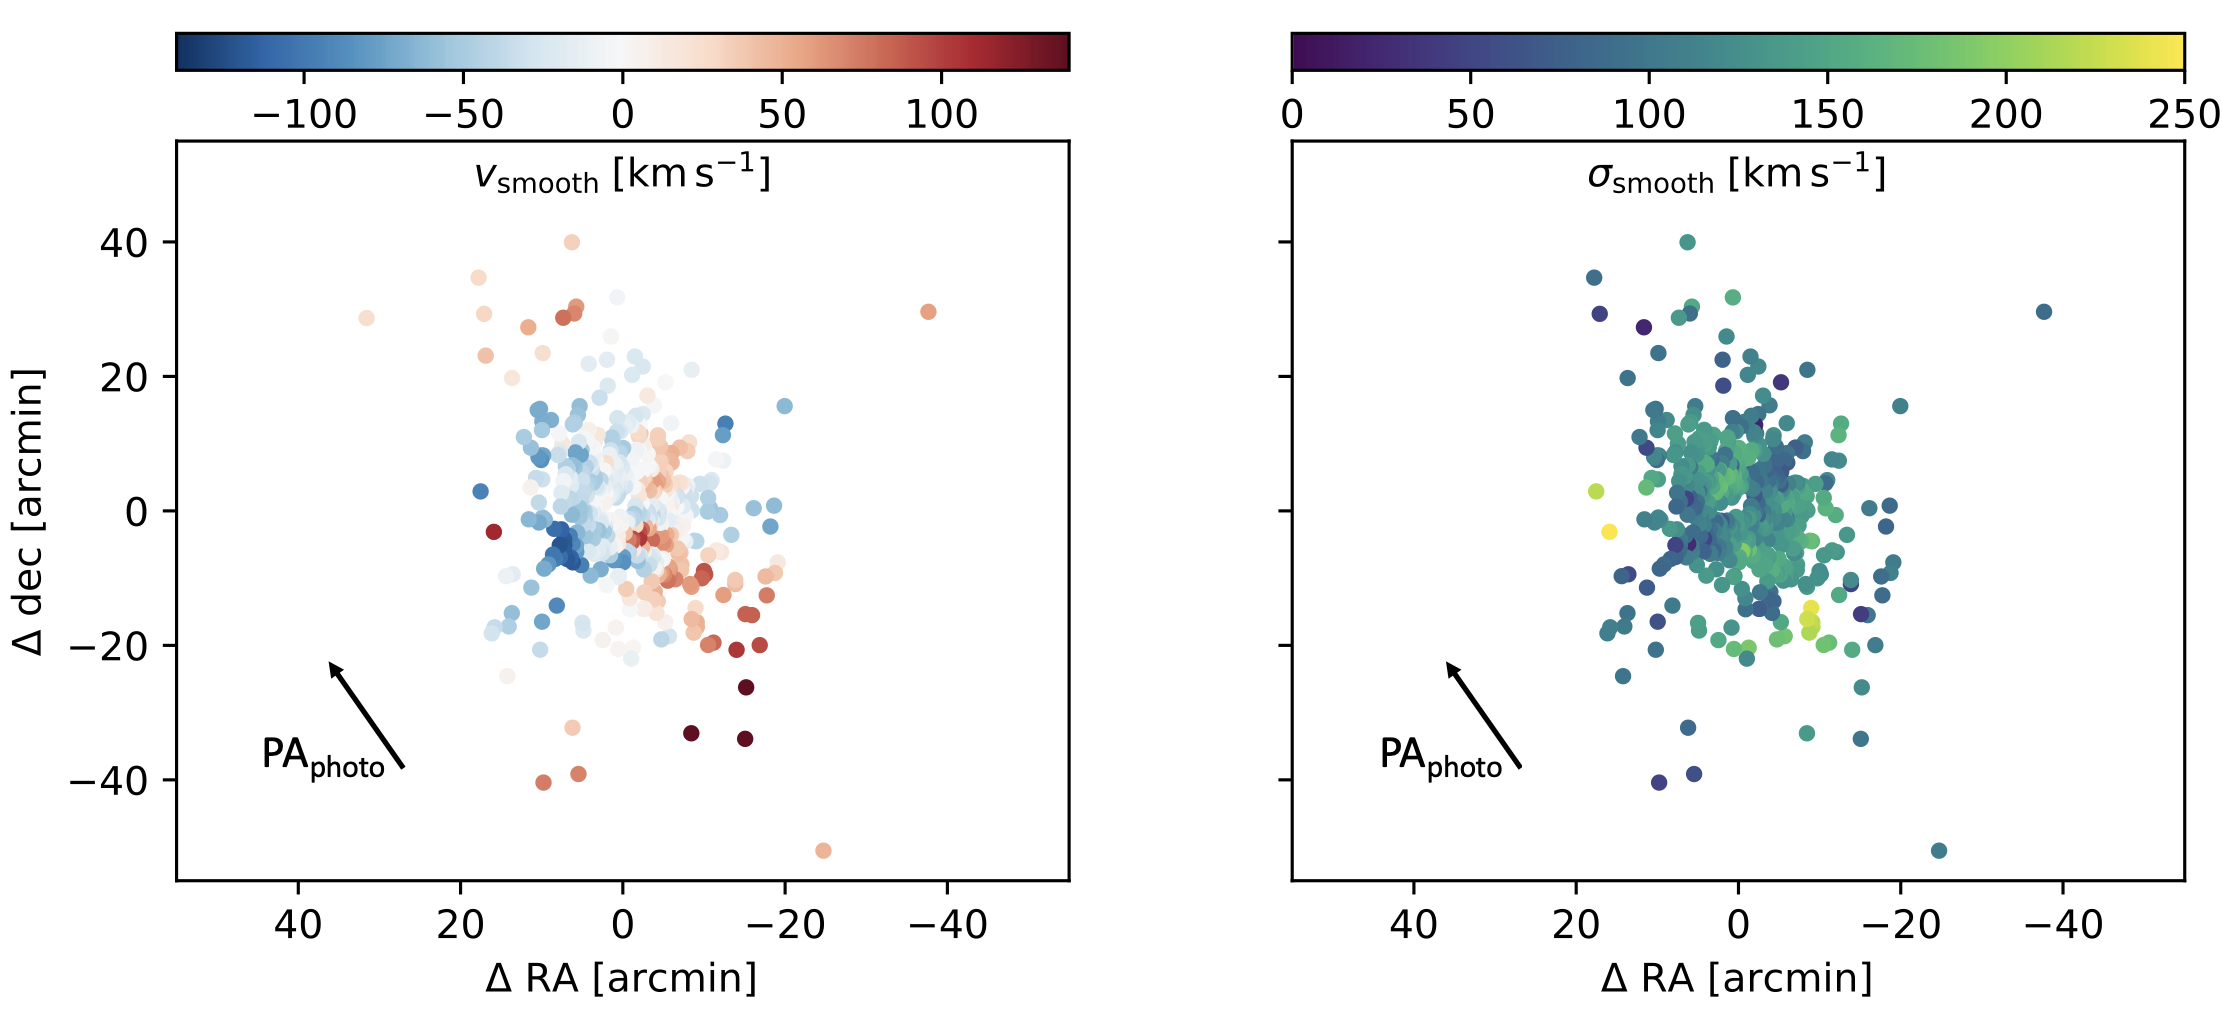
In this work, we use the kinematic sample compiled from the literature by Hughes et al., 2021a of around 550 GCs out to a median distance of 40 kpc. To investigate the velocity field of the GCs used in this work we adopted the Gaussian smoothing approach from Pulsoni et al., (2018) tested on simulated galaxies for a similarly sized discrete sample of kinematic tracers. Figure 1 shows the smooth velocity on the left panel and velocity dispersion on the right of the GCs within 50 arcmin ( Re). We can see signs of rotation both along the major and minor axis similar to the PNe velocity field. The velocity dispersion field shows a drop in the velocity dispersion along the minor compared with the major axis.
The GCs of CenA show bimodal colour distribution with red GCs exhibiting similar velocity properties as the field stars, traced by the PNe and blue GCs showing weaker rotation (e.g. Peng et al., 2004b, ). Woodley et al., (2010) confirmed the presence of metallicity bimodality first identified as a colour bimodality. Additionally, they found that of metal-rich GCs formed in the past 8Gyrs, supporting the continuous accretion and mergers in CenA.
3.2 Kinematics of the planetary nebulae
Peng et al., 2004a found that the inner rotation of the PNe along the major axis of the galaxy is extended out to the limit of their data (80kpc). They found evidence of a twist in the zero velocity curve which points to a triaxial or prolate potential of the galaxy. Using harmonic expansion Pulsoni et al., (2018) provided a systematic study of the PNe kinematics and computed the properties of a smooth velocity field from the discrete sample. The authors determined the radial variation of the kinematic position angle of the PNe and a drop in the velocity dispersion around 3 Re( 15 kpc).
3.3 Comparison between GC and PNe velocity field
To investigate the possible presence of substructures we use the smooth velocity field of the PNe from Pulsoni et al., (2018). We find the discrete sample of GCs is consistent with being drawn from the smooth velocity field of the PNe. The 1, 2, and 3 outliers show no preferred position in the plane of the galaxy that would indicate a presence of a dynamically cold component that has recently been accreted. Such a component would not be dynamically relaxed and would bias dynamical modelling that is based on a steady-state assumption.
4 Dynamical modelling
We use CJAM (Watkins et al.,, 2013) implementation of Jeans Anisotropic MGE (Multi Gaussian Expansion), axisymmetric Jeans equations with the assumptions on the cylindrical alignment of the velocity anisotropy introduced by Cappellari, (2008).
4.1 Introduction to the discrete dynamical modelling
We assume that a local line-of-sight velocity distribution (LOSVD) can be well described by a Gaussian function and use it as likelihood in our Bayesian analysis. Therefore, each kinematic tracer is used discretely to inform the likelihood to find the the best-fit parameters. This methodology has been used in the literature to investigate enclosed mass profiles, orbital properties of the kinematic tracers and flattening of the dark matter haloes on real and simulated galaxies (e.g. Zhu et al.,, 2016; Hughes et al., 2021b, ; Leung et al.,, 2021).
4.2 Globular cluster tracer density profile
The largest and most homogenous photometric catalogue of GC candidates is presented in Taylor et al., (2017) and we used it in this work to build the density profile of the kinematic tracers. To identify a sample of relaxed high-fidelity GCs from the GC candidates we analyzed the spatial symmetry of different magnitude selected populations. A dynamically relaxed population is expected to show a point-symmetric spatial distribution. To ensure well-characterized completeness we also require its magnitude distribution to be consistent with a theoretical Gaussian GC luminosity function.
We identified a population, which we called intermediate population: in the reddening corrected R-band magnitude. This population shows strong colour bimodality and we determine the colour separation of 2.7 for the red population and 2.7 for the blue, with approximately the same number of GCs in both. We computed the flattening of both red and blue GCs separately and found blue GCs are rounder. Finally, we binned them in elliptical radii and found the spatial distribution of GCs can be best described with a combination of an inner Sérsic and outer power-law profile.
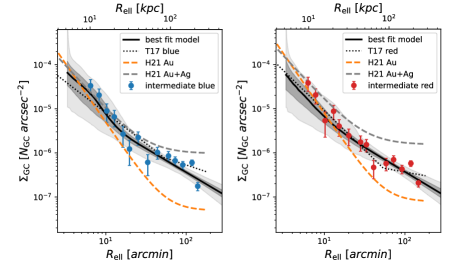
Figure 2 shows the best-fit results for the blue GCs on the left and the red GCs on the right panel. The data is shown with colored points, the black line shows the best-fit model with dark and light grey 1 and 3 uncertainties. To compare with the literature, the dotted black line shows the best-fit profiles for red and blue GCs from Taylor et al., (2017) work and the dashed orange and grey line show the golden and silver sample from Hughes et al., 2021a , where different datasets were used to analyze the contamination of the Taylor et al., (2017) GC candidates. Our profile is broadly consistent with the literature. In the inner regions, our profiles are steeper than the Hughes et al., 2021a silver and Taylor et al., (2017) and slightly shallower than the Hughes et al., 2021a golden sample. In the outer regions, our tracer density drops faster than in all literature studies.
4.3 Gravitational potential
In our dynamical modelling, both the stars and dark matter contribute to the gravitational potential.
Using photographic plates, Dufour et al., (1979) found the de Vaucouleurs profile can best reproduce the stellar surface density on nested ellipses with a very mild flattening of 0.93 within 1Re. Rejkuba et al., (2022) extended the stellar surface density profile out to 140kpc using resolved observations of RGB stars from HST observations. Halo stars were found to have a much flatter distribution with a flattening of 0.54. We used both results to create a 2-dimensional surface brightness profile in the range of 0.3R/Re25 accounting for the difference in the flattening of central and halo stellar components.
For the dark matter component, we assumed an NFW profile parametrised with the and parameters. For each set of and we decompose the profile with MGE and account for the assumed flattening of the dark matter and inclination. We define the flattening of the dark matter , where a is aligned along the photometric major axis and c along the photometric minor axis.
4.4 Likelihood analysis
Our model has 7 free parameters: , , , inclination, , velocity anisotropy and rotation ( and as defined in Cappellari, (2008)). For each combination of parameters, we use CJAM to compute the first and second velocity moments at the position of each GC and a Gaussian LOSVD as the likelihood to determine the best-fit parameters in a discrete approach. We model separately the red and blue GC populations.
Our modelling approach constrains , and inclination. We derive a preliminary dark matter mass M⊙ and flattening . The resulting maximum likelihood solutions for the variables of the gravitational potential are consistent between the blue and red GCs. With and showing expected differences for both populations of GCs that reflect their distinct dynamic origin.
5 Conclusions
The advancement in our understanding of galaxy formation and evolution as well as the increase in the size and quality of the photometric and spectroscopic datasets has made it necessary to move away from spherical symmetry assumptions in dynamical modelling. With large spectroscopic datasets of halo tracers we can constrain the triaxiality of dark matter.
We find that the magnitude selected intermediate population from Taylor et al., (2017) sample of GCs shows point symmetric spatial distribution, evidence that this population is in approximate dynamical equilibrium. We find that both red and blue GCs have flattened distributions. We used this information to construct a tracer density profile that is broadly consistent with the literature but has a declining density profile in the outskirts of the galaxy. Discrete axisymmetric dynamical modelling can constrain the flattening of the dark matter potential out to 40 kpc in CenA. Detailed results will be presented in Veršič et al. 2023 in prep.
Questions
Jianling WANG: This is nice work. I am concerned about the systematics. The underlying assumption about the dynamics modelling is that the system is at equilibrium state and well relaxed, and single dynamical population tracers used. But it is well known that CenA has experienced a recent major merger, which could violate these assumptions, then what could be the systematic errors? And it would be useful to apply your modelling to a realistic model, for example (major merger models for CenA) to quantify the systematics.
Answer: Given that CenA shows evidence of recent accretion the presence of a non-relaxed component is of course a concern. We investigated the potential presence of a non-relaxed and kinematically cold component of our GCs sample with the smooth velocity field determined from the PNe. We found no evidence of a kinematically cold component in the spatially limited sample of GCs we used in this work. We, therefore, did not make further analysis of what the systematic errors might be in the presence of strong non-relaxed components. Literature studies have looked at how the enclosed mass measurements are biased in the presence of non-relaxed tracers (e.g. Alabi et al.,, 2016). But I am not aware of a study looking at the impact on the flattening of the potential. It would be very interesting to investigate and quantify this effect with the simulations as you mentioned. Thank you for the suggestion.
Acknowledgements
TV & GvdV acknowledge funding by ERC under EU H2020 grant No. 724857 (ArcheoDyn).
References
- Alabi et al., (2016) Alabi, A. B., Forbes, D. A., Romanowsky, A. J., Brodie, J. P., Strader, J., Janz, J., Pota, V., Pastorello, N., Usher, C., Spitler, L. R., Foster, C., Jennings, Z. G., Villaume, A., & Kartha, S. 2016, mnras, 460(4), 3838–3860.
- Allgood et al., (2006) Allgood, B., Flores, R. A., Primack, J. R., Kravtsov, A. V., Wechsler, R. H., Faltenbacher, A., & Bullock, J. S. 2006, mnras, 367(4), 1781–1796.
- Bland-Hawthorn and Gerhard, (2016) Bland-Hawthorn, J. & Gerhard, O. 2016, araa, 54, 529–596.
- Cappellari, (2008) Cappellari, M. 2008, mnras, 390(1), 71–86.
- Chua et al., (2019) Chua, K. T. E., Pillepich, A., Vogelsberger, M., & Hernquist, L. 2019, mnras, 484(1), 476–493.
- Dufour et al., (1979) Dufour, R. J., van den Bergh, S., Harvel, C. A., Martins, D. H., Schiffer, F. H., I., Talbot, R. J., J., Talent, D. L., & Wells, D. C. 1979, aj, 84, 284–301.
- Harris et al., (2010) Harris, G. L. H., Rejkuba, M., & Harris, W. E. 2010, pasa, 27(4), 457–462.
- Hayashi et al., (2007) Hayashi, E., Navarro, J. F., & Springel, V. 2007, mnras, 377(1), 50–62.
- Hughes et al., (2023) Hughes, A. K., Sand, D. J., Seth, A., Strader, J., Lidman, C., Voggel, K., Dumont, A., Crnojević, D., Mateo, M., Caldwell, N., Forbes, D. A., Pearson, S., Guhathakurta, P., & Toloba, E. 2023, apj, 947(1), 34.
- (10) Hughes, A. K., Sand, D. J., Seth, A., Strader, J., Voggel, K., Dumont, A., Crnojević, D., Caldwell, N., Forbes, D. A., Simon, J. D., Guhathakurta, P., & Toloba, E. 2021,a apj, 914a(1), 16.
- (11) Hughes, M. E., Jethwa, P., Hilker, M., van de Ven, G., Martig, M., Pfeffer, J. L., Bastian, N., Kruijssen, J. M. D., Trujillo-Gomez, S., Reina-Campos, M., & Crain, R. A. 2021,b mnras, 502b(2), 2828–2844.
- Khoperskov et al., (2014) Khoperskov, S. A., Moiseev, A. V., Khoperskov, A. V., & Saburova, A. S. 2014, mnras, 441(3), 2650–2662.
- Leung et al., (2021) Leung, G. Y. C., Leaman, R., Battaglia, G., van de Ven, G., Brooks, A. M., Peñarrubia, J., & Venn, K. A. 2021, mnras, 500(1), 410–429.
- (14) Peng, E. W., Ford, H. C., & Freeman, K. C. 2004,a apj, 602a(2), 685–704.
- (15) Peng, E. W., Ford, H. C., & Freeman, K. C. 2004,b apj, 602b(2), 705–722.
- Pulsoni et al., (2018) Pulsoni, C., Gerhard, O., Arnaboldi, M., Coccato, L., Longobardi, A., Napolitano, N. R., Moylan, E., Narayan, C., Gupta, V., Burkert, A., Capaccioli, M., Chies-Santos, A. L., Cortesi, A., Freeman, K. C., Kuijken, K., Merrifield, M. R., Romanowsky, A. J., & Tortora, C. 2018, aap, 618, A94.
- Rejkuba et al., (2022) Rejkuba, M., Harris, W. E., Greggio, L., Crnojević, D., & Harris, G. L. H. 2022, aap, 657, A41.
- Taylor et al., (2017) Taylor, M. A., Puzia, T. H., Muñoz, R. P., Mieske, S., Lançon, A., Zhang, H., Eigenthaler, P., & Bovill, M. S. 2017, mnras, 469(3), 3444–3467.
- Walsh et al., (2015) Walsh, J. R., Rejkuba, M., & Walton, N. A. 2015, aap, 574, A109.
- Wang et al., (2020) Wang, J., Hammer, F., Rejkuba, M., Crnojević, D., & Yang, Y. 2020, mnras, 498(2), 2766–2777.
- Watkins et al., (2013) Watkins, L. L., van de Ven, G., den Brok, M., & van den Bosch, R. C. E. 2013, mnras, 436(3), 2598–2615.
- Woodley et al., (2010) Woodley, K. A., Harris, W. E., Puzia, T. H., Gómez, M., Harris, G. L. H., & Geisler, D. 2010, apj, 708(2), 1335–1356.
- Zhu et al., (2016) Zhu, L., Romanowsky, A. J., van de Ven, G., Long, R. J., Watkins, L. L., Pota, V., Napolitano, N. R., Forbes, D. A., Brodie, J., & Foster, C. 2016, mnras, 462(4), 4001–4017.