”Dust Giant”: Extended and Clumpy Star-Formation in a Massive Dusty Galaxy at
We present NOEMA CO (2-1) line and ALMA 870 m continuum observations of a main-sequence galaxy at . The galaxy was initially selected as a ”gas-giant”, based on the gas mass derived from sub-mm continuum (log), however the gas mass derived from CO (2-1) luminosity brings down the gas mass to a value consistent with typical star-forming galaxies at that redshift (log). Despite that the dust-to-stellar mass ratio remains elevated above the scaling relations by a factor of 5. We explore the potential physical picture and consider an underestimated stellar mass and optically thick dust as possible causes. Based on the updated gas-to-stellar mass ratio we rule out the former, and while the latter can contribute to the dust mass overestimate it is still not sufficient to explain the observed physical picture. Instead, possible explanations include enhanced HI reservoirs, CO-dark H2 gas, an unusually high metallicity, or the presence of an optically dark, dusty contaminant. Using the ALMA data at 870 m coupled with /ACS imaging, we find extended morphology in dust continuum and clumpy star-formation in rest-frame UV in this galaxy, and a tentative kpc dusty arm is found bridging the galaxy center and a clump in F814W image. The galaxy shows levels of dust obscuration similar to the so-called -dark galaxies at higher redshifts, and would fall into the optically faint/dark color-color selection at . It is therefore possible that our object could serve as low- analog of the -dark populations. This galaxy serves as a caveat to the gas masses based on the continuum alone, with a larger sample required to unveil the full picture.
Key Words.:
evolution –- galaxies: high-redshift –- galaxies: ISM –- submillimeter: ISM: photometry – methods: observational –- techniques: photometric1 Introduction
The interaction between the interstellar medium (ISM), which consists mostly of gas and dust, and the radiation fields produced by stellar activity, are thought to be the main mechanisms that drive galaxy evolution. Within the contemporary picture of galaxy formation and evolution, star formation rate (SFR), molecular gas masses (), dust mass (), gas to stellar mass ratio () and dust to stellar mass ratio () play a critical role in allowing us to interpret the mode and onset of star formation, the assembly of stellar mass, the final quenching of galaxies and their structure and dynamics. In particular, the amount of gas with respect to the ongoing star formation (star formation efficiency, SFE SFR) and the depletion timescale ( 1/SFE) allow us to clearly distinguish the star-formation modes between main-sequence (MS) and starburst (SB) galaxies. It is still unclear, however, whether enhanced SFE, galaxy mergers or increased molecular gas reservoirs are responsible for the manifestation of galaxies in the SB regime. To this end, the evolution of and across the cosmic time has been extensively studied and constrained both observationally (see Magdis et al. 2012; Santini et al. 2014; Sargent et al. 2014; Genzel et al. 2015; Tacconi et al. 2018; Liu et al. 2019; Donevski et al. 2020; Magnelli et al. 2020; Kokorev et al. 2021), as well as theoretically (e.g. Tan et al. 2014; Lagos et al. 2015; Lacey et al. 2016). The important takeaway point of these studies is that both and increase slowly from to their peak at , mirroring the evolution of star formation rate density (SFRD; Madau & Dickinson 2014).
The other key parameter in studying the evolution of galaxies is the metallicity (). Metals are introduced into the ISM by either stellar winds and/or via the injection by supernovae (Dwek & Scalo, 1980; Kobayashi et al., 2020). In this context the gas-to-dust mass ratio () connects the amount of metals locked in the gas phase, with the metals present as dust, therefore acting as a powerful tool to elucidate the evolutionary stage of a galaxy. Observations of both atomic (HI) and molecular hydrogen (H2) have revealed that decreases as a function of metallicity, at least for the local galaxies, (e.g. see Rémy-Ruyer et al. 2014), however the exact evolutionary scenarios are still uncertain.
Critical to understanding both the metallicity and modes of star formation is how we derive the . The most commonly used techniques involve utilising the carbon monoxide (CO) or neutral carbon [CI] line luminosities (Papadopoulos et al., 2004; Bolatto et al., 2013; Carilli & Walter, 2013; Valentino et al., 2018) or the dust continuum (e.g. Magdis et al. 2012; Scoville et al. 2016). Related to the dust method, in particular, the steadily growing number of galaxy populations with well-sampled IR properties has produced a series of unexpected results. One such discovery is an unusually large (e.g. Tan et al. 2014; Kokorev et al. 2021), in excess of what would be possible to produce involving return fractions from evolved stellar populations (Béthermin et al., 2015; Michałowski, 2015; Dayal et al., 2022). Far IR (FIR) galaxy spectral energy distributions (SEDs) are generally modelled under the assumption of optically thin FIR emission. However, in cases where FIR dust emission is truly optically thick (e.g. the case of Arp220; Scoville et al. 2017b), using an approximation for optically thin dust results in colder dust temperatures (), and therefore overestimated and (Hodge et al., 2016; Simpson et al., 2017; Scoville et al., 2017b; Cortzen et al., 2020; Jin et al., 2022). Alternatively, some use a constant mass-weighted temperature instead ( K), as suggested by Scoville et al. (2014). Recent results by Harrington et al. (2021), however, find little difference between mass and luminosity weighted temperatures at least at 1 mm, suggesting that 25 K might be insufficient. Given there is an adequate mid-to-far-IR coverage, it is possible to model galaxies with a more complex, optically thick assumption. However discriminating between the optically thick and thin solutions, when the data are limited, is often not possible due to degeneracies involved in the fitting. As such, to robustly determine the , dust continuum alone is often insufficient, and independent proxies are thus required to break these degeneracies.
In our homogeneous analysis of the ”Super-deblended” catalog (Kokorev et al., 2021) in the COSMOS field (Laigle et al., 2016; Jin et al., 2018), we have recovered scaling relations for FIR properties from thousands of galaxies. Among those we have identified some outliers which appear to have significantly elevated and , compared to the typical scaling relations at and log. Alternative gas mass tracers are thus necessary to confirm the extreme nature of these objects. In this paper we report observations of the CO (2-1) transition line with Northern Extended Millimeter Array (NOEMA), for one such ”gas-giant” candidate, presented in Kokorev et al. (2021).
Throughout this work we assume a flat CDM cosmology with , and H km s-1 Mpc-1, and a Chabrier (2003) initial mass function (IMF) within .
2 Selection, Data and Reduction
2.1 ’Gas Giants’
The sample of ’gas-giants’ was initially identified as a number of extreme outliers from the average and evolutionary trends. These typically have log() 0.5, i.e. their gas mass reservoir takes of total baryonic matter budget. Individual best - fit Stardust (Kokorev et al., 2021) SEDs of these objects have been examined along with the cut-out images in order to rule out either bad or insufficient optical photometry - resulting in an incorrect estimate, poor coverage of the FIR peak or blending issues that could result in erroneously large estimates. These sources are in stark contrast when compared to the expected evolutionary tracks, with the ’gas-giant’ sample being elevated by at least a factor of 3 in both and compared to median empirical trends, and appearing as outliers to the parent sample. When contrasted with simulations the results are even more puzzling, with deviation of a factor 5 and a staggering factor of 10 in , when parameterized to the same SFR/SFRMS, and . The possible explanations for the very high and subsequently estimates, could be optically thick FIR emission, poorly deblended FIR photometry, or simply an erroneous gas-to-dust ratio (). All three of these hypotheses have been thoroughly tested, via simulations, and alternative SED fitting techniques, but failed to demote a significant fraction of the ”gas giants”. We refer the reader to Kokorev et al. 2021, for a more detailed description of the sample.
In an attempt to explain the unusually elevated and we have selected a robust subsample of ’gas-giants’ candidates to follow up. These fulfil the following criteria: 1) Secure FIR coverage with continuum detections above level, and at least a single rest-frame m detection for a reasonable and estimates (e.g see Berta et al. 2016; Kokorev et al. 2021), 2) The galaxy needs to be isolated, to facilitate a secure estimate and minimize the possibility of blending in the FIR. From this subsample we selected a single object, to act as a pilot study into this potential population. Using the and SFR together with the - metallicity relation from Magdis et al. (2012), and the Pettini & Pagel (2004) scaling, we derive a , computing . Our galaxy exhibits what can be considered ‘typical’ values as MS galaxies at log(, and also does not appear to be a strong starburst with SFR/SFR 2.5, thus making it even more unique and puzzling.
2.2 NOEMA Observations
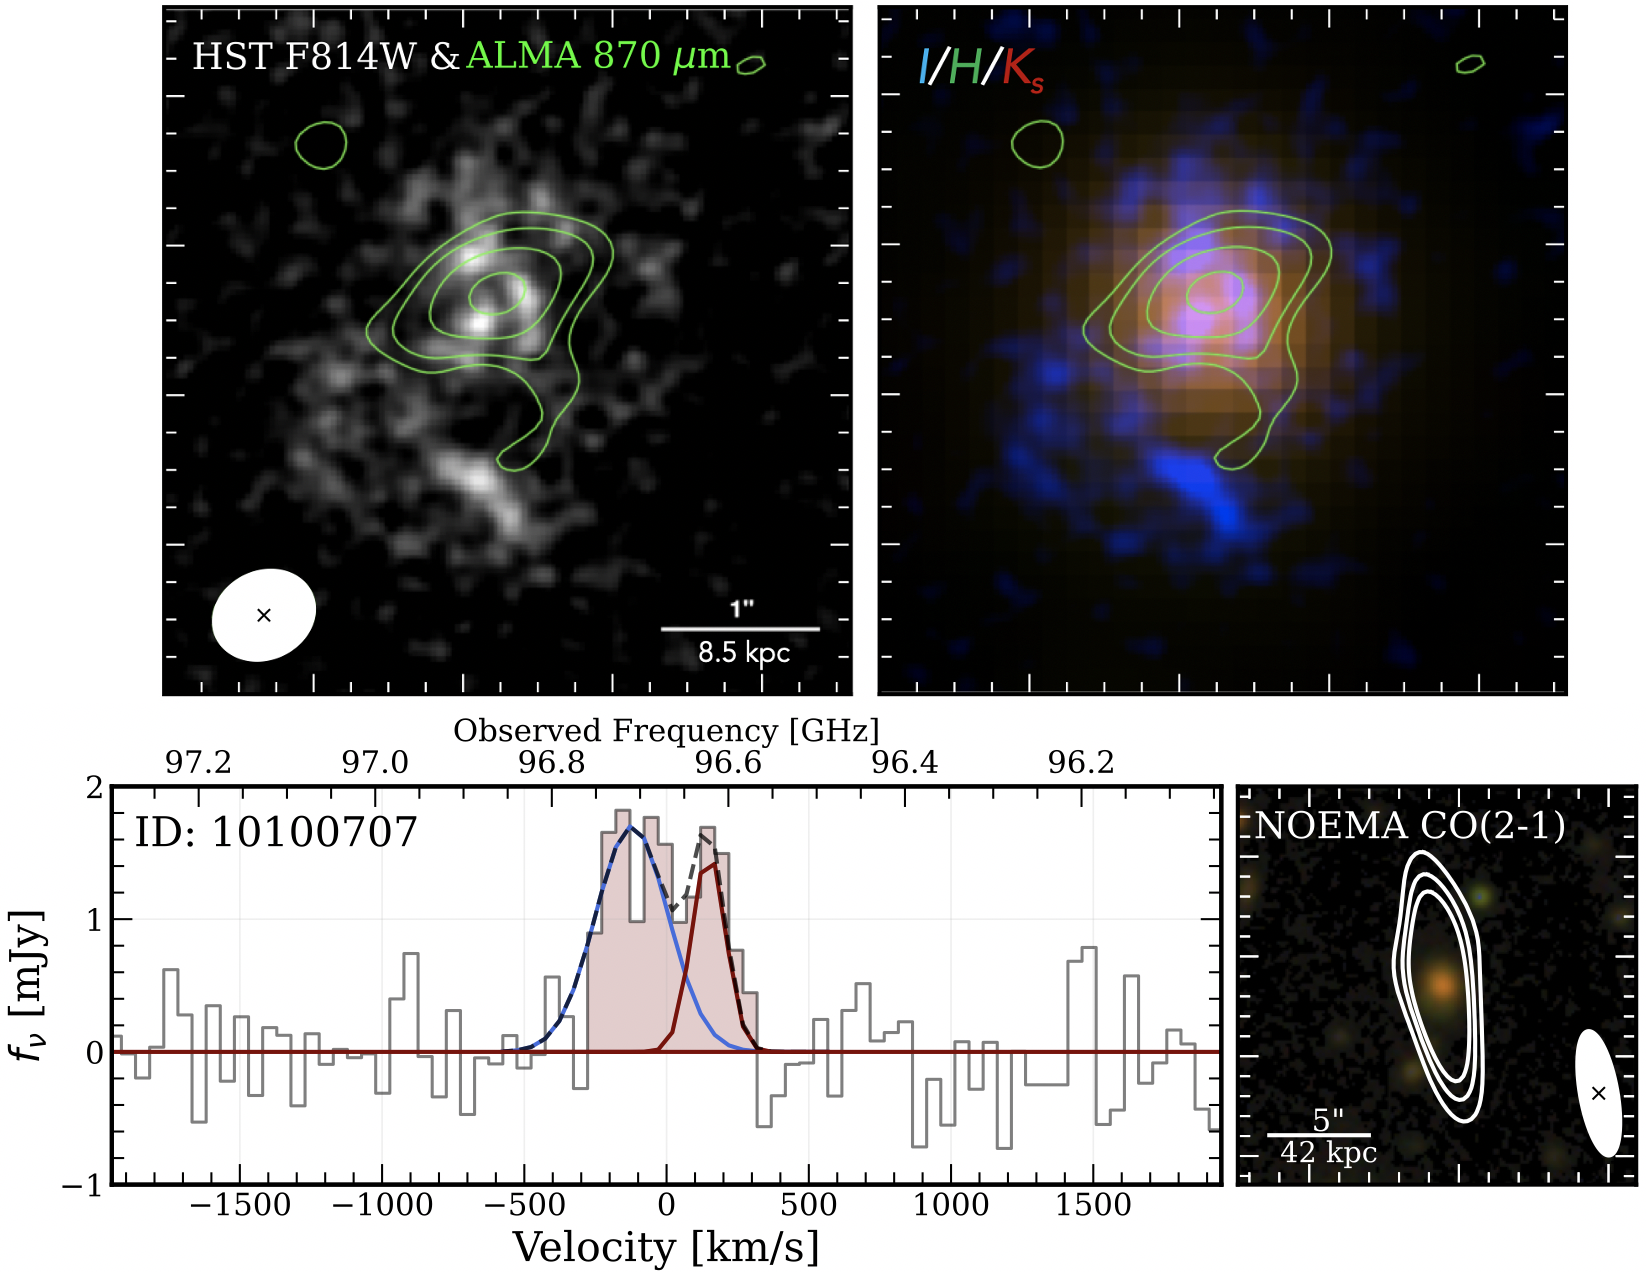
To confirm or rule out the high , we have used IRAM NOEMA to conduct observations of the CO (2-1) line transition a COSMOS galaxy ID: 10100707 (Jin et al., 2018), with a photometric redshift of from the COSMOS2015 catalog (Laigle et al., 2016). The NOEMA observations took place in April 2022, for a total of 8.6 h, using the 12D configuration (Program W21CO, PIs: V. Kokorev, C.Gómez-Guijarro). In our galaxy the CO(J=) line ( GHz) is redshifted to GHz at . The pointing was centered at the coordinates included in the parent ”Super-deblended” catalog (Jin et al., 2018). While the D-configuration has a generally lower angular resolution (”), our original proposal was focused on the line detection and thus was the most optimal balance between S/N and requested time. The source was observed with three tracks reaching rms sensitivities of 0.13 mJy per 500 km s-1.
The separate tracks were calibrated and recombined into a single table, using the GILDAS software package CLIC. No continuum was detected however we use the information from the separate tracks to derive the upper limit on the underlying 98 GHz (3 mm) continuum, which will further assist in deriving robust FIR properties from SED fitting. To produce the final 1-D spectra for the CO(2-1) line, we have used the Crab.Toolkit.PdBI 111https://github.com/1054/Crab.Toolkit.PdBI, which is a wrapper around the MAPPING module in GILDAS. Finally, we fit a point source model in the space at the position of peak flux in order to measure the flux density of the line. The line profile presented in Figure 1 appears to be double peaked. Due to that, in addition to the single Gaussian peak fit, we also model the line profile with two normal distributions.
2.3 ALMA Data
The galaxy has been observed with ALMA band 7 at 341 GHz (870 m) as a part of the program 2011.0.00097.S (PI: N. Scoville). Following the method in Jin et al. (2019, 2022), we reduced and calibrated the raw data using CASA pipeline. The calibrated data were exported into uvfits format to generate tables of the IRAM GILDAS, after which we perform further analysis in the space (visibility). The continuum map of the galaxy was imaged by combining visibilities of all spectral windows using uv_average and clean procedures in GILDAS/Mapping. The clean continuum image has an rms of 114.3 Jy and a peak flux of 1.096 mJy. The synthesised beam is with a position angle of .
As the contours show in Figure 1, the ALMA 870 m image is clearly resolved, as evidenced by the larger size than the synthesized beam. Therefore, we further fit the dust continuum with an elliptical Gaussian model in space using GILDAS uv_fit, which gives a total flux of mJy and a size of (PA). The total flux is higher than the peak flux density, indicating that the source is spatially resolved.
| ID | 10100707 |
|---|---|
| R.A. | 150.554 |
| Dec | 2.422 |
| 1.3844 | |
| log() | |
| SFR [M⊙ yr-1] | |
| log() | |
| log() | |
| SFR/SFRMS 1 | |
| [K] | |
| [K] | |
| log( | |
| 12+log(O/H) 2 | |
| [Jy km-1] | 0.780.05 |
| FWHMCO(2-1) [km s-1] | |
| ’CO(2-1) [K km s-1 pc2] | |
| log( | 0.03 |
| log( | |
| log( | |
3 Results
We present the resultant 1-D spectra in the bottom panel of Figure 1, along with the RGB image which was created by combining the /ACS F814W, UltraVista DR2 (UVISTA; McCracken et al. 2012) and filters. For our object we compute the integrated CO (2-1) line flux by taking the product of the average flux density in the appropriate channels, maximising the SNR and the velocity in these channels (e.g. see Daddi et al. 2015). Generally line flux estimates are performed by modelling the emission with a Gaussian profile, we however compared our non-parametric approach to the Gaussian fit and find results to be consistent.
While it quickly becomes uncertain for high ionisation states of CO, the conversion factor between CO J=21 and CO J=10 is small and very well constrained, it is also applicable for normal BzK galaxies on the MS, and presumably even more extreme objects which we describe in this work (Daddi et al., 2015). We therefore convert the to by assuming a standard CO SLED with the conversion factor /= = 0.85 (Bothwell et al., 2013).
3.1 Revised Gas Mass
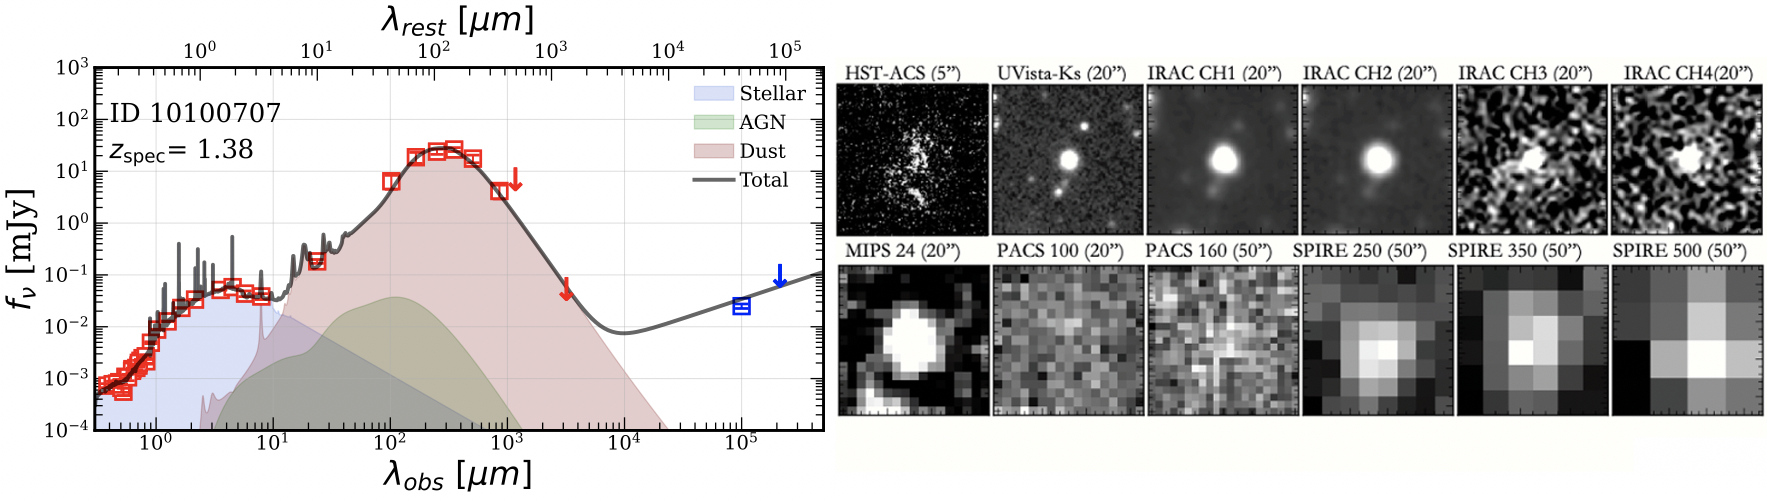
The best-fit SED, along with the cutouts for the galaxy are shown in Figure 2. This galaxy lies on the main sequence of star formation, as parametrised in Schreiber et al. (2015) with SFR/SFRMS¡5. Therefore, to convert the final value of to we assume (Bolatto et al., 2013). In Table 1 we present the final results from our CO J=21 observations, alongside other optical and FIR properties computed with Stardust in our previous work.
This ’gas-giant’ was initially identified due to its elevated rather than , with the former being robustly computed from the Herschel Space Observatory () and SCUBA2 detections, which securely cover the Rayleigh-Jeans (RJ) tail ( m, rest-frame). Using the additional constraint on the upper limit derived from the underlying 3 mm continuum, and the secure we re-fit our object to ensure that the previously derived properties are robust. We find that all FIR parameters remain unchanged from the ones presented in Kokorev et al. (2021), apart from the which has fallen by dex, from log to log. As such we also update the previous estimate of the sub-mm continuum derived from log to log. The results from the revised SED fitting are, however, still insufficient to bring our galaxy on the and evolutionary tracks.
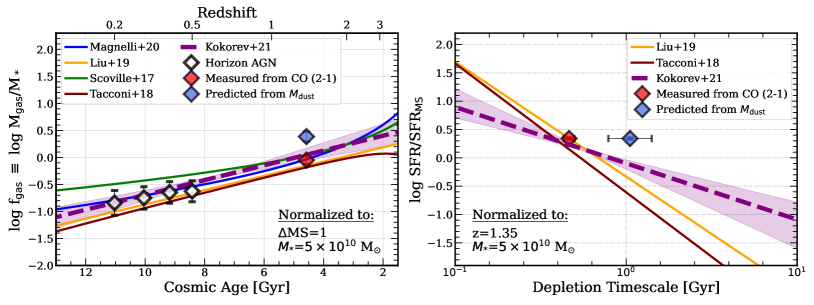
In a stark contrast to the updated which we compute from re-fitting the FIR data, the CO derived mass is found to be lower by 0.4 dex. We display the updated physical parameters with respect to the vs cosmic age and distance to the main sequence (SFR/SFRMS) vs relations of our source in Figure 3, additionally contrasting it to the updated SED fitting predictions of the . The new CO-based value has resulted in a decrease of both and , thus placing our object within the range of values expected from observational results (Scoville et al., 2017a; Tacconi et al., 2018; Liu et al., 2019; Magnelli et al., 2020; Kokorev et al., 2021), as well as simulations (Laigle et al., 2019). As a result our new observations now can rule out this object as a ”gas-giant” along with possible physical scenarios discussed in Kokorev et al. (2021).
The elevated still remains in disagreement with the existing literature trends, and now, in light of our CO(2-1) observations, creates even more tension with the updated estimate. For example, as displayed in Figure 4, the re-computed is a factor of lower compared to our previous prediction. We will discuss the potential reasons for this newfound tension in the next section.
3.2 Morphology
Compared to the deblended SCUBA2 850 m flux ( mJy), the total ALMA 870 m flux is lower by a factor of 2.3. In order to capture the total flux, we also adopted an aperture of with the same PA as Gaussian model, which results in a maximum flux of mJy, still lower than the SCUBA2 flux by a factor of 2. We argue, however, that the high SCUBA2 flux is not due to blending, because this galaxy is the only source visible in ALMA primary beam (). The SCUBA2 beam is , and thus is not contaminated by a dusty neighbor. The SCUBA2 photometry itself is well-measured using the prior position, with the uncertainty calibrated using MonteCarlo simulations (Jin et al., 2018). The only reasonable explanation of the flux discrepancy is that ALMA has over-resolved the galaxy, losing more than half of the total flux due to the incomplete coverage. In detail, the ALMA max recovery scale of this pointing is only , the emission from larger scale would be largely lost. This resolved nature is again confirmed by the extended morphology as present in both NIR and ALMA images. The significant flux loss in ALMA also hints that the dust emission is more extended out to ( kpc), which is consistent with the sizes reported in (Valentino et al., 2020) for a sample at . Given the linear scaling of with flux in the RJ tail, we find that ALMA continuum ends up resolving out more than half of the total reservoir.
In Figure 1 we show the ALMA 870 m together the RGB composite consisting of the F814W, UVISTA- and UVISTA- bands. We find that while our galaxy is not fully detected in F814W it appears to display a clumpy morphology. In order to estimate the optical size of the galaxy we therefore fit the UVISTA/ band image with IMFIT (Erwin, 2015), using a Sérsic (1963) profile. In addition to that we verify our result by computing the band from the mass-size relation presented in van der Wel et al. (2014). Both methods return a consistent result of . We also compute the ALMA size by converting the elliptical axes measured by GILDAS into . At we thus get a final size of kpc in band, and kpc in ALMA. However, while the peak of the ALMA emission coincides with the apparent center of the galaxy, we also report the tentative (2 level) and large ( kpc) dust arm. This dusty structure appears to be connected to the secondary clump seen in the south part of the F814W image. It is likely that the dusty arm is associated with the smaller peak in the CO (2-1) profile, however further high resolution observations would be required to verify this.
3.3 Dynamical Mass
Using the fact that the CO J=21 line is detected in multiple channels, we also compute the dynamical mass () for our object. To do that we consider both the UVISTA/ and ALMA sizes measured in the previous section. We use the relation from from Daddi et al. (2010) and estimate an inclination angle for our galaxy to be from the axis ratio measured on the ALMA 870 m image. This is also consistent with the statistical average of (Coogan et al., 2018). The total is then given as the mass contained within the full diameter of the galaxy - . We assume the contribution of dark matter to be , as there is evidence that dark matter fraction at this redshift is negligible within the (Daddi et al., 2010; Wuyts et al., 2016; Genzel et al., 2017).
We find dynamical masses of log10( and log10 (, using the optical and ALMA respectively. Given our previous discussion, it is very likely that the galaxy is over-resolved at 870 m, and thus its size and would be underestimated, which is in line with being lower than the . We therefore based our on the size of the galaxy. While it is rare for the sub-mm size to extend as far as the star-forming stellar disk, probed by the band (e.g. see Puglisi et al. 2021; Gómez-Guijarro et al. 2022), this estimate can serve as a robust upper limit. The are listed in Table 1 without the dark matter correction.
4 Discussion
4.1 Stellar Mass Underestimate
One of the potential reasons behind the ”gas-giant” population discussed in Kokorev et al. (2021) is an underestimate in . In return leading to erroneously larger dust/gas-to-stellar mass ratios. The optical-NIR data that was used to derive the relies mostly on the ground-based observations. This can result in potential flux losses, as a result of seeing limited point spread function (PSF). The Laigle et al. (2016) catalog used in our work utilises apertures to measure flux density, and might not adequately model the flux losses due to the wings of the PSF (e.g. see Weaver et al. 2022).
Despite that, when using the CO derived to compute , our galaxy is in line with the literature predictions for a MS galaxy at that redshift (Scoville et al., 2017a; Tacconi et al., 2018; Liu et al., 2019; Magnelli et al., 2020; Kokorev et al., 2021), as well as an extrapolation of Horizon AGN simulations results to higher- (Laigle et al., 2019). Therefore we have little reason to believe that an underestimate is responsible for the elevated .
4.2 Optically Thick Dust
Another mechanism responsible for the elevated / found in our galaxy could be the presence of optically thick FIR emission. Indeed in Kokorev et al. (2021) we report that ID: 10100707 can be fit with a generalized form of the modified blackbody (MBB) function (e.g. see Casey et al. 2012). In that case we find the effective wavelength () at which the optical depth becomes unity, to be m, deep in the RJ tail. In this case the intrinsic SED is shifted blueward, reducing the derived by a factor of a few. The unusually high dust-to-stellar mass ratio and when using the CO derived can therefore be a result of the optical depth effects. As we report in Kokorev et al. (2021), however, adopting an optically thick dust emission model reduces the by 0.25 dex, compared to the 0.4 dex correction required, which is insufficient to bring our galaxy back up to the expected dust-to-stellar mass ratio relation which we show in Figure 3.
4.3 Dust and Metallicity
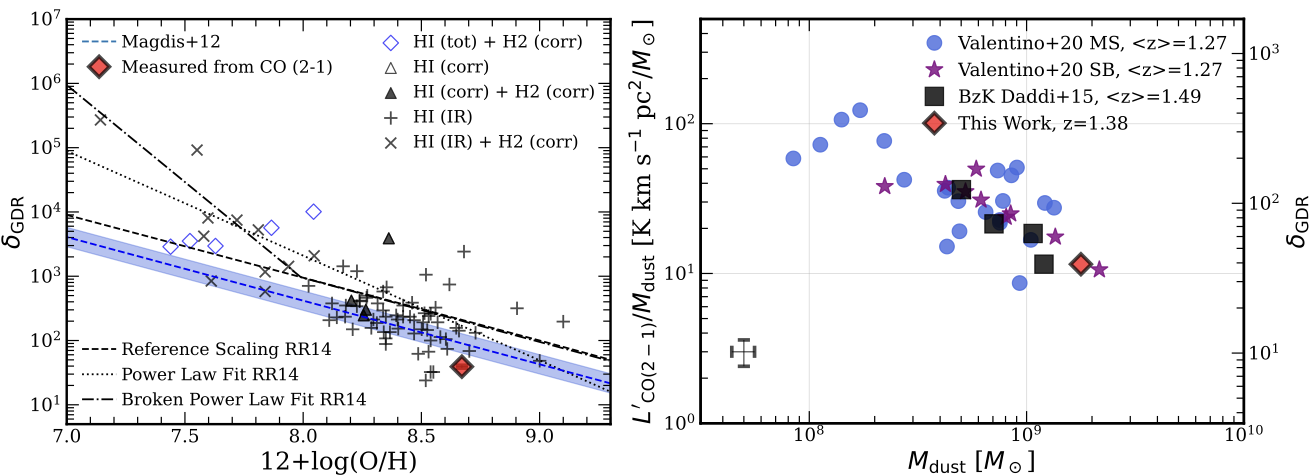
In Figure 4 we examine the location of our source on the vs relation. We additionally overplot the - relation from Magdis et al. (2012), which was originally used to compute the original as well as the relations from Rémy-Ruyer et al. (2014). Our findings indicate that ID: 10100707 displays a that is 2.5 times lower than what is expected from the scaling relations for star-forming galaxies, given the metallicity we have estimated (). For our galaxy to follow the scaling relations with its , it would require a super-solar metallicity of . Although it is possible that our object is simply very metal-rich, confirmation would require more direct metallicity indicators.
Conversely, an increasing number of theoretical studies highlight the significance of grain growth in dust production within the ISM, particularly for metal-rich galaxies (e.g. Asano et al. 2013; Rémy-Ruyer et al. 2014; Hirashita et al. 2015; Zhukovska et al. 2016; De Vis et al. 2019). Depending on the star-formation history within the galaxy, grain growth can become the dominant mechanism of dust production once a certain metallicity threshold is reached. As a result, metals are depleted from the ISM as the increases significantly (also see Donevski et al. 2023). Therefore, it is possible that our galaxy indeed has solar metallicity, and the observed may be a result of rapid metal-to-dust conversion via grain growth.
4.4 Dust to Gas Conversion
From our discussion and analysis we predict that the systematic shifts induced on and are not applicable or insufficient to explain the derived . Generally, the metallicity is not the only driver of the observed scatter in the values, and other phenomena in galaxies can lead to a large variation of this parameter. These would include the morphological type, stellar mass and SFR, however each of them having an effect on the observed (Rémy-Ruyer et al., 2014).
It is understood that when deriving the via the method, what is actually being computed is the total mass of hydrogen HI+H2 (e.g. see Magdis et al. 2012). It is therefore possible that our galaxy has elevated HI reservoirs, not traceable by CO, that could cause the observed discrepancy. By combining our dust and CO based measurements we compute the HI to stellar mass ratio , which is roughly 2 times larger than expected at that redshift (Heintz et al., 2022). Using the 21-cm line emission, however, Chowdhury et al. (2020, 2021) find that at some galaxies can indeed reach similar to, and in excess, of our findings. A large HI reservoir is therefore a plausible explanation for the elevated .
The observed disparity between the - relation for our object could also be explained by the presence of the CO - dark molecular gas. In this case the H2 reservoirs which can not be traced by CO (e.g. Papadopoulos et al. 2002; Röllig et al. 2006; Wolfire et al. 2010; Glover & Clark 2012; Madden et al. 2020) will require another method of tracing optically thick gas not normally probed by CO. In this case, hydrodynamical simulations (e.g. see Smith et al. 2014; Offner et al. 2014; Franeck et al. 2018; Seifried et al. 2020) have shown that neutral [CI] and ionized [CII] carbon, have the ability to trace molecular hydrogen in optically thick and warm environments. Comparably, the dust in our object is both optically thick out to m, and is warmer than in a typical MS galaxy at that redshift (e.g. Schreiber et al. 2015, 2018). It is therefore possible that our CO (2-1) study fails to quantify the full H2 reservoir, and further [CI] observations would be necessary to correctly compute the . Moreover, while optically thick HI has been suggested as a potential source of CO-dark gas, there is currently no convincing evidence to support its significant contribution to the dark neutral gas (Murray et al., 2018).
Based on the CO estimate, the galaxy can no longer be classified as a ”gas-giant”, yet the ratio remains high. We find that the ratio is marginally consistent with expected values, while the dust reservoir and are abnormal compared to galaxies of similar mass and redshift. Therefore, it would be more accurate to refer to ID: 10100707 as a ”dust-giant”.
Finally, in the right panel of Figure 4 we examine the position of our galaxy on the and vs diagram. We find that our galaxy is not an outlier compared to either the MS and SB sources from Valentino et al. (2020), as well as the BzK population discussed in Daddi et al. (2015). However, we find that our ”dust-giant” displays ratio consistent with those of SB objects, despite it lying on the main-sequence. In fact the object most closely associated with ID: 10100707 is an extreme starburst (SFR/SFR) of similar and presented in Puglisi et al. (2021).
4.5 Dynamical Mass Budget
Using the computed in the previous section we would like to understand whether the derived sub-mm continuum and CO are compatible with the total mass budget. Assuming a dark matter fraction of 10 % and using the galaxy size we obtain the log. While the galaxy size is most likely larger than the CO (2-1) emitting region (e.g. see (Puglisi et al., 2021; Gómez-Guijarro et al., 2022)) we believe it represents an adequate upper limit on the total baryonic mass of our galaxy, as opposed to the over-resolved ALMA 870 m emission. Subtracting the and leaves us with the allowed log, which lies within 1 from our sub-mm and CO estimates. In this case, taking into account the measured this would require an , a value typical of MS galaxies, which aligns with our SFR/SFRMS characterization. Due to the large uncertainty on the it is however not possible to ascertain which one of estimates is most likely to be correct.
4.6 Optically-Dark Dusty Contaminant
Finally, a presence of the optically dark companion, contaminating the FIR-mm emission, could potentially explain the elevated dust content. The existence of these dust obscured, optically faint, star-forming galaxies has been demonstrated by a large number of detections with Spitzer Space Telescope (Spitzer) and Herschel Space Observatory (Herschel; see Huang et al. 2011; Caputi et al. 2012; Alcalde Pampliega et al. 2019), as well as in the sub-mm regime (Talia et al., 2021; Wang et al., 2021) specifically by Atacama Large Millimeter/submillimeter Array (ALMA) (Simpson et al., 2014; Franco et al., 2018; Yamaguchi et al., 2019; Wang et al., 2019; Williams et al., 2019; Umehata et al., 2020; Caputi et al., 2021; Fudamoto et al., 2021; Manning et al., 2022; Gómez-Guijarro et al., 2022; Kokorev et al., 2022; Xiao et al., 2023).
A potentially similar case was presented in Kokorev et al. (2023), where a spatially resolved analysis with James Webb Space Telescope () NIRCam reveals a highly dust obscured disk () at . Previously only seen as a sub-mm galaxy (SMG) in Laporte et al. (2017) and Muñoz Arancibia et al. (2018), this HST-dark source has only been possible to detect with deep observations in the NIR. If such an object is indeed boosting the sub-mm flux density, it would have to be a FIR/ALMA only source. Further deep observations with would be necessary, in order to confirm if the extreme seen in our galaxy is in fact a result of such a dusty contaminant.
4.7 Low- Analog of HST-dark Galaxies
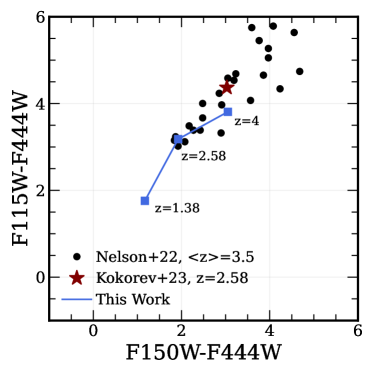
We find that this galaxy displays similar amount of dust obscuration (), is on the main-sequence and has a comparable and values to the higher- optically faint sources recently presented in the literature (e.g. Franco et al. 2018; Wang et al. 2019; Nelson et al. 2022; Barrufet et al. 2023; Gómez-Guijarro et al. 2023; Kokorev et al. 2023). To investigate this possibility, we apply the color-color classification presented in Nelson et al. (2022), which uses the F115W-F444W and F150W-F444W colors to identify candidate objects. We integrate our best-fit Stardust template through the filters and obtained the synthetic flux densities. In Figure 5 we display the location of our galaxy, along with the Nelson et al. objects and the -dark galaxy reported in Kokorev et al. (2023), on the color-color diagram. Furthermore, we trace the position of ID: 10100707 on the diagram if it were located at the same redshift as the Kokorev et al. object or at . Our analysis suggests that while our object would not qualify as an -dark galaxy at , it would meet the criteria for such classification at .
Following a similar analysis presented in Kokorev et al. (2023) we would like to test how likely is it to detect analogs of this object at high-. We use the detection limits of major surveys, including UNCOVER (PIs: I. Labbe, R. Bezanson; Bezanson et al. 2022), CEERS (PI: S. Finkelstein; Bagley et al. 2022) as well as COSMOS-Web (PIs: J. Kartaltepe, C. Casey; Casey et al. 2022). We also include the limit of the deepest public NIRCam observations taken at the moment of writing, from NGDEEP (PI: S. Finkelstein; Bagley et al. 2023). We find that at a similarly dusty galaxy would become an F200W dropout with NGDEEP - like depths ( AB mag), and is JWST-dark in all other major surveys. Dusty 2 m dropouts with elevated could be misidentified as galaxies, as has been discussed in Naidu et al. (2022); Zavala et al. (2022); Donnan et al. (2023) and most recently in Arrabal Haro et al. (2023). We thus highlight that the identification of dust-obscured main-sequence galaxies at and beyond the epoch of reionization remains a challenging task for JWST, and these will most likely end up being missed.
5 Conclusions
In this paper we describe NOEMA CO (2-1) line observations and analysis in a galaxy originally selected for its elevated . The object constitutes a pilot study of the ”gas-giant” population presented in Kokorev et al. (2021). With our new observations we have been able to spectroscopically confirm the redshift of our galaxy, as well as use the line luminosity to derive the . Additionally we updated the initial estimate of and dust-based with the addition of the 3 mm continuum upper limit from our NOEMA observations. With the re-computed CO based , however, we found that our initial ”gas-giant” selection no longer applies. The updated mass estimates, differ by -0.4 dex from the ones computed from , and position our galaxy along the expected evolutionary trends of . At the same time we found that the remains elevated, both with respect to the and now , leading to unusually low judging from the fundamental metallicity relations for a MS galaxy at this redshift and . Given the above it is more appropriate to refer to this galaxy as a ”dust-giant” instead.
Using the additional ALMA data at 870 m we find that the dust in our galaxy is extended, which is also supported by the fact that ALMA recovers a lower flux compared to the SCUBA2 data. Coupled with the double peaked CO (2-1) line this hints that gas in our galaxy is present both in the central region, as well as the spiral arms. In addition we note the presence of the blue clumps visible in the F814W image (rest-frame UV).
We find that while modelling our galaxy with optically thick dust emission reduces the dust mass, it is still not sufficient to bring it in line with the scaling relations. Instead, the discrepancy in the physical picture could potentially be explained by enhanced HI reservoirs, CO-dark H2 gas, an unusually high metallicity, or the presence of an optically dark, dusty contaminant. What is clear is that it is important to be cautious when drawing conclusions about the physical picture based solely on derived from dust continuum measurements, given the significant difference between expected and measured values. Problems with the continuum derived are becoming very apparent due to the extreme optically thick dust, as found in Jin et al. (2022).
Our object also displays similar amount of dust obscuration compared to the so-called -dark galaxies which exist at higher-. Using the based color-color selection for such galaxy types we have found that if our galaxy would exist at , it would be meet the criteria of such a color selection. In our work we aim to highlight that the identification of dust-obscured MS galaxies at and beyond the epoch of reionization remains a challenging task for , and a the most dusty galaxies will end up being missed.
While the source analyzed and discussed in our work will not be imaged as a part of COSMOS-Web survey (Casey et al., 2022), we expect that a few tens of galaxies that belong to the ”gas-giants” population will still be covered. Future observations with /NIRCam and MIRI instruments as a part of COSMOS-Web, as well as deep multi-band sub-mm data would therefore be imperative to understand the true nature of objects with elevated dust-to-stellar mass ratios.
Acknowledgements.
We thank Pratika Dayal for her helpful suggestions which helped improve this manuscript. We would like to thank Orsolya Feher for her help with NOEMA data reduction process. Based on observations carried out under project number W21CO with the IRAM NOEMA Interferometer [30-meter telescope]. IRAM is supported by INSU/CNRS (France), MPG (Germany) and IGN (Spain). SJ is supported by the European Union’s Horizon Europe research and innovation program under the Marie Skłodowska-Curie grant agreement No. 101060888. The Cosmic Dawn Center is funded by the Danish National Research Foundation under grant No. 140. GEM acknowledges the Villum Fonden research grant 13160 “Gas to stars, stars to dust: tracing star formation across cosmic time,” grant 37440, “The Hidden Cosmos,” and the Cosmic Dawn Center of Excellence funded by the Danish National Research Foundation under the grant No. 140.References
- Alcalde Pampliega et al. (2019) Alcalde Pampliega, B., Pérez-González, P. G., Barro, G., et al. 2019, ApJ, 876, 135
- Arrabal Haro et al. (2023) Arrabal Haro, P., Dickinson, M., Finkelstein, S. L., et al. 2023, arXiv e-prints, arXiv:2303.15431
- Asano et al. (2013) Asano, R. S., Takeuchi, T. T., Hirashita, H., & Nozawa, T. 2013, MNRAS, 432, 637
- Bagley et al. (2022) Bagley, M. B., Finkelstein, S. L., Koekemoer, A. M., et al. 2022, arXiv e-prints, arXiv:2211.02495
- Bagley et al. (2023) Bagley, M. B., Pirzkal, N., Finkelstein, S. L., et al. 2023, arXiv e-prints, arXiv:2302.05466
- Barrufet et al. (2023) Barrufet, L., Oesch, P. A., Weibel, A., et al. 2023, MNRAS[arXiv:2207.14733]
- Berta et al. (2016) Berta, S., Lutz, D., Genzel, R., Förster-Schreiber, N. M., & Tacconi, L. J. 2016, A&A, 587, A73
- Béthermin et al. (2015) Béthermin, M., Daddi, E., Magdis, G., et al. 2015, A&A, 573, A113
- Bezanson et al. (2022) Bezanson, R., Labbe, I., Whitaker, K. E., et al. 2022, arXiv e-prints, arXiv:2212.04026
- Bolatto et al. (2013) Bolatto, A. D., Wolfire, M., & Leroy, A. K. 2013, ARA&A, 51, 207
- Bothwell et al. (2013) Bothwell, M. S., Smail, I., Chapman, S. C., et al. 2013, MNRAS, 429, 3047
- Caputi et al. (2021) Caputi, K. I., Caminha, G. B., Fujimoto, S., et al. 2021, ApJ, 908, 146
- Caputi et al. (2012) Caputi, K. I., Dunlop, J. S., McLure, R. J., et al. 2012, ApJ, 750, L20
- Carilli & Walter (2013) Carilli, C. L. & Walter, F. 2013, ARA&A, 51, 105
- Casey et al. (2012) Casey, C. M., Berta, S., Béthermin, M., et al. 2012, ApJ, 761, 140
- Casey et al. (2022) Casey, C. M., Kartaltepe, J. S., Drakos, N. E., et al. 2022, arXiv e-prints, arXiv:2211.07865
- Chabrier (2003) Chabrier, G. 2003, PASP, 115, 763
- Chowdhury et al. (2020) Chowdhury, A., Kanekar, N., Chengalur, J. N., Sethi, S., & Dwarakanath, K. S. 2020, Nature, 586, 369
- Chowdhury et al. (2021) Chowdhury, A., Kanekar, N., Das, B., Dwarakanath, K. S., & Sethi, S. 2021, ApJ, 913, L24
- Coogan et al. (2018) Coogan, R. T., Daddi, E., Sargent, M. T., et al. 2018, MNRAS, 479, 703
- Cortzen et al. (2020) Cortzen, I., Magdis, G. E., Valentino, F., et al. 2020, A&A, 634, L14
- Daddi et al. (2015) Daddi, E., Dannerbauer, H., Liu, D., et al. 2015, A&A, 577, A46
- Daddi et al. (2010) Daddi, E., Elbaz, D., Walter, F., et al. 2010, ApJ, 714, L118
- Dayal et al. (2022) Dayal, P., Ferrara, A., Sommovigo, L., et al. 2022, MNRAS, 512, 989
- De Vis et al. (2019) De Vis, P., Jones, A., Viaene, S., et al. 2019, A&A, 623, A5
- Donevski et al. (2023) Donevski, D., Damjanov, I., Nanni, A., et al. 2023, arXiv e-prints, arXiv:2304.05842
- Donevski et al. (2020) Donevski, D., Lapi, A., Małek, K., et al. 2020, arXiv e-prints, arXiv:2008.09995
- Donnan et al. (2023) Donnan, C. T., McLeod, D. J., Dunlop, J. S., et al. 2023, MNRAS, 518, 6011
- Dwek & Scalo (1980) Dwek, E. & Scalo, J. M. 1980, ApJ, 239, 193
- Erwin (2015) Erwin, P. 2015, ApJ, 799, 226
- Franco et al. (2018) Franco, M., Elbaz, D., Béthermin, M., et al. 2018, A&A, 620, A152
- Franeck et al. (2018) Franeck, A., Walch, S., Seifried, D., et al. 2018, MNRAS, 481, 4277
- Fudamoto et al. (2021) Fudamoto, Y., Oesch, P. A., Schouws, S., et al. 2021, Nature, 597, 489
- Genzel et al. (2017) Genzel, R., Förster Schreiber, N. M., Übler, H., et al. 2017, Nature, 543, 397
- Genzel et al. (2015) Genzel, R., Tacconi, L. J., Lutz, D., et al. 2015, ApJ, 800, 20
- Glover & Clark (2012) Glover, S. C. O. & Clark, P. C. 2012, MNRAS, 421, 9
- Gómez-Guijarro et al. (2022) Gómez-Guijarro, C., Elbaz, D., Xiao, M., et al. 2022, A&A, 658, A43
- Gómez-Guijarro et al. (2023) Gómez-Guijarro, C., Magnelli, B., Elbaz, D., et al. 2023, arXiv e-prints, arXiv:2304.08517
- Harrington et al. (2021) Harrington, K. C., Weiss, A., Yun, M. S., et al. 2021, ApJ, 908, 95
- Heintz et al. (2022) Heintz, K. E., Oesch, P. A., Aravena, M., et al. 2022, ApJ, 934, L27
- Hirashita et al. (2015) Hirashita, H., Nozawa, T., Villaume, A., & Srinivasan, S. 2015, MNRAS, 454, 1620
- Hodge et al. (2016) Hodge, J. A., Swinbank, A. M., Simpson, J. M., et al. 2016, ApJ, 833, 103
- Huang et al. (2011) Huang, J. S., Zheng, X. Z., Rigopoulou, D., et al. 2011, ApJ, 742, L13
- Jin et al. (2018) Jin, S., Daddi, E., Liu, D., et al. 2018, ApJ, 864, 56
- Jin et al. (2019) Jin, S., Daddi, E., Magdis, G. E., et al. 2019, ApJ, 887, 144
- Jin et al. (2022) Jin, S., Daddi, E., Magdis, G. E., et al. 2022, A&A, 665, A3
- Kobayashi et al. (2020) Kobayashi, C., Karakas, A. I., & Lugaro, M. 2020, ApJ, 900, 179
- Kokorev et al. (2022) Kokorev, V., Brammer, G., Fujimoto, S., et al. 2022, ApJS, 263, 38
- Kokorev et al. (2023) Kokorev, V., Jin, S., Magdis, G. E., et al. 2023, arXiv e-prints, arXiv:2301.04158
- Kokorev et al. (2021) Kokorev, V. I., Magdis, G. E., Davidzon, I., et al. 2021, ApJ, 921, 40
- Lacey et al. (2016) Lacey, C. G., Baugh, C. M., Frenk, C. S., et al. 2016, MNRAS, 462, 3854
- Lagos et al. (2015) Lagos, C. d. P., Crain, R. A., Schaye, J., et al. 2015, MNRAS, 452, 3815
- Laigle et al. (2019) Laigle, C., Davidzon, I., Ilbert, O., et al. 2019, MNRAS, 486, 5104
- Laigle et al. (2016) Laigle, C., McCracken, H. J., Ilbert, O., et al. 2016, ApJS, 224, 24
- Laporte et al. (2017) Laporte, N., Bauer, F. E., Troncoso-Iribarren, P., et al. 2017, A&A, 604, A132
- Liu et al. (2019) Liu, D., Schinnerer, E., Groves, B., et al. 2019, ApJ, 887, 235
- Madau & Dickinson (2014) Madau, P. & Dickinson, M. 2014, ARA&A, 52, 415
- Madden et al. (2020) Madden, S. C., Cormier, D., Hony, S., et al. 2020, A&A, 643, A141
- Magdis et al. (2012) Magdis, G. E., Daddi, E., Béthermin, M., et al. 2012, ApJ, 760, 6
- Magnelli et al. (2020) Magnelli, B., Boogaard, L., Decarli, R., et al. 2020, ApJ, 892, 66
- Manning et al. (2022) Manning, S. M., Casey, C. M., Zavala, J. A., et al. 2022, ApJ, 925, 23
- McCracken et al. (2012) McCracken, H. J., Milvang-Jensen, B., Dunlop, J., et al. 2012, A&A, 544, A156
- Michałowski (2015) Michałowski, M. J. 2015, A&A, 577, A80
- Muñoz Arancibia et al. (2018) Muñoz Arancibia, A. M., González-López, J., Ibar, E., et al. 2018, A&A, 620, A125
- Murray et al. (2018) Murray, C. E., Peek, J. E. G., Lee, M.-Y., & Stanimirović, S. 2018, ApJ, 862, 131
- Naidu et al. (2022) Naidu, R. P., Oesch, P. A., Setton, D. J., et al. 2022, arXiv e-prints, arXiv:2208.02794
- Nelson et al. (2022) Nelson, E. J., Suess, K. A., Bezanson, R., et al. 2022, arXiv e-prints, arXiv:2208.01630
- Offner et al. (2014) Offner, S. S. R., Bisbas, T. G., Bell, T. A., & Viti, S. 2014, MNRAS, 440, L81
- Papadopoulos et al. (2002) Papadopoulos, P. P., Thi, W. F., & Viti, S. 2002, ApJ, 579, 270
- Papadopoulos et al. (2004) Papadopoulos, P. P., Thi, W. F., & Viti, S. 2004, MNRAS, 351, 147
- Pettini & Pagel (2004) Pettini, M. & Pagel, B. E. J. 2004, MNRAS, 348, L59
- Puglisi et al. (2021) Puglisi, A., Daddi, E., Valentino, F., et al. 2021, MNRAS, 508, 5217
- Rémy-Ruyer et al. (2014) Rémy-Ruyer, A., Madden, S. C., Galliano, F., et al. 2014, A&A, 563, A31
- Röllig et al. (2006) Röllig, M., Ossenkopf, V., Jeyakumar, S., Stutzki, J., & Sternberg, A. 2006, A&A, 451, 917
- Santini et al. (2014) Santini, P., Maiolino, R., Magnelli, B., et al. 2014, A&A, 562, A30
- Sargent et al. (2014) Sargent, M. T., Daddi, E., Béthermin, M., et al. 2014, ApJ, 793, 19
- Schinnerer et al. (2010) Schinnerer, E., Sargent, M. T., Bondi, M., et al. 2010, ApJS, 188, 384
- Schreiber et al. (2018) Schreiber, C., Elbaz, D., Pannella, M., et al. 2018, A&A, 609, A30
- Schreiber et al. (2015) Schreiber, C., Pannella, M., Elbaz, D., et al. 2015, A&A, 575, A74
- Scoville et al. (2014) Scoville, N., Aussel, H., Sheth, K., et al. 2014, ApJ, 783, 84
- Scoville et al. (2017a) Scoville, N., Lee, N., Vanden Bout, P., et al. 2017a, ApJ, 837, 150
- Scoville et al. (2017b) Scoville, N., Murchikova, L., Walter, F., et al. 2017b, ApJ, 836, 66
- Scoville et al. (2016) Scoville, N., Sheth, K., Aussel, H., et al. 2016, ApJ, 820, 83
- Seifried et al. (2020) Seifried, D., Haid, S., Walch, S., Borchert, E. M. A., & Bisbas, T. G. 2020, MNRAS, 492, 1465
- Sérsic (1963) Sérsic, J. L. 1963, Boletin de la Asociacion Argentina de Astronomia La Plata Argentina, 6, 41
- Simpson et al. (2017) Simpson, J. M., Smail, I., Wang, W.-H., et al. 2017, ApJ, 844, L10
- Simpson et al. (2014) Simpson, J. M., Swinbank, A. M., Smail, I., et al. 2014, ApJ, 788, 125
- Smith et al. (2014) Smith, R. J., Glover, S. C. O., Clark, P. C., Klessen, R. S., & Springel, V. 2014, MNRAS, 441, 1628
- Smolčić et al. (2017) Smolčić, V., Delvecchio, I., Zamorani, G., et al. 2017, A&A, 602, A2
- Tacconi et al. (2018) Tacconi, L. J., Genzel, R., Saintonge, A., et al. 2018, ApJ, 853, 179
- Talia et al. (2021) Talia, M., Cimatti, A., Giulietti, M., et al. 2021, ApJ, 909, 23
- Tan et al. (2014) Tan, Q., Daddi, E., Magdis, G., et al. 2014, A&A, 569, A98
- Umehata et al. (2020) Umehata, H., Smail, I., Swinbank, A. M., et al. 2020, A&A, 640, L8
- Valentino et al. (2018) Valentino, F., Magdis, G. E., Daddi, E., et al. 2018, ApJ, 869, 27
- Valentino et al. (2020) Valentino, F., Magdis, G. E., Daddi, E., et al. 2020, ApJ, 890, 24
- van der Wel et al. (2014) van der Wel, A., Chang, Y.-Y., Bell, E. F., et al. 2014, ApJ, 792, L6
- Wang et al. (2021) Wang, L., Gao, F., Best, P. N., et al. 2021, A&A, 648, A8
- Wang et al. (2019) Wang, T., Schreiber, C., Elbaz, D., et al. 2019, Nature, 572, 211
- Weaver et al. (2022) Weaver, J. R., Kauffmann, O. B., Ilbert, O., et al. 2022, ApJS, 258, 11
- Williams et al. (2019) Williams, C. C., Labbe, I., Spilker, J., et al. 2019, ApJ, 884, 154
- Wolfire et al. (2010) Wolfire, M. G., Hollenbach, D., & McKee, C. F. 2010, ApJ, 716, 1191
- Wuyts et al. (2016) Wuyts, S., Förster Schreiber, N. M., Wisnioski, E., et al. 2016, ApJ, 831, 149
- Xiao et al. (2023) Xiao, M. Y., Elbaz, D., Gómez-Guijarro, C., et al. 2023, A&A, 672, A18
- Yamaguchi et al. (2019) Yamaguchi, Y., Kohno, K., Hatsukade, B., et al. 2019, ApJ, 878, 73
- Zavala et al. (2022) Zavala, J. A., Buat, V., Casey, C. M., et al. 2022, arXiv e-prints, arXiv:2208.01816
- Zhukovska et al. (2016) Zhukovska, S., Dobbs, C., Jenkins, E. B., & Klessen, R. S. 2016, ApJ, 831, 147