Spatial Computing Opportunities in Biomedical Decision Support: The Atlas-EHR Vision
Abstract.
Consider the problem of reducing the time needed by healthcare professionals to understand patient medical history via the next generation of biomedical decision support. This problem is societally important because it has the potential to improve healthcare quality and patient outcomes. However, it is challenging due to the high patient-doctor ratio, the potential long medical histories, the urgency of treatment for some medical conditions, and patient variability. The current system provides a longitudinal view of patient medical history, which is time-consuming to browse, and doctors often need to engage nurses, residents, and others for initial analysis. To overcome this limitation, our vision, Atlas-EHR, is an alternative spatial representation of patients’ histories (e.g., electronic health records (EHRs)) and other biomedical data. Just like Google Maps allows a global, national, regional, and local view, the Atlas-EHR may start with the overview of the patient’s anatomy and history before drilling down to spatially anatomical sub-systems, their individual components, or sub-components. It will also use thoughtful cartography (e.g., urgency color, disease icons, and symbols) to highlight critical information for improving task efficiency and decision quality, analogous to how it is used in designing task-specific maps. Atlas-EHR presents a compelling opportunity for spatial computing since health is almost a fifth of the US economy. However, the traditional spatial computing designed for geographic use cases (e.g., navigation, land-survey, mapping) faces many hurdles in the biomedical domain, presenting several research questions. This paper presents some open research questions under this theme in broad areas of spatial computing.
1. Introduction
Electronic health records (EHRs) and other biomedical data are critical sources of information for healthcare professionals, providing them with valuable insights into patient health and medical history. However, the sheer amount of data can be time-consuming for healthcare professionals to navigate. Toward this goal, we envision the next generation of biomedical decision support to reduce the time that needed by healthcare professionals spend examining and understanding medical history from EHRs data.
This problem is societally important since it helps healthcare professionals make efficient and accurate informed decisions. This may ultimately improve the quality of care and patient outcomes. Also, by rethinking how medical professionals to access and interpret patient medical histories, they may have more time to spend and interact with patients, resulting in improved healthcare standards.
However, the problem is challenging due to several reasons. First, patient visits are short (e.g., around 15 minutes). In addition, a patient’s medical history can be long spanning decades. Furthermore, many primary care doctors are responsible for hundreds and thousands of patients. Additionally, changes in medical guidelines and practices introduce additional complexities. Some medical conditions also require treatment urgently. Further, some medical decisions are sensitive to patient demographics and underlying medical conditions.
Popular EHR systems (e.g., Epic Systems (Corporation, 2023)) provide a longitudinal view of a patient’s history, which makes it time-consuming for medical professionals to navigate through (See Figure 1(a) for illustration). This representation does not allow medical professionals to explore the interdependencies of EHRs data generated through different sensing modalities over various timescales spanning decades from the whole body to their components or sub-components. Early spatial vision approach includes inner space (Oliver and Steinberger, 2011). The paper discussed harnessing traditional medical imaging (e.g., X-ray, MRI) data and the concept of spatial networks to build a spatiotemporal database. Their spatial framework was supposed to answer long-term questions about how a disease would progress or the comparative effectiveness of a therapeutic intervention. Challenges they identified at the time included the lack of a spatial reference frame for the human body, how to determine the location in the body, routing in a continuous space, observing change across snapshots, and scalability. More recent work (Wolfson, 2018) explored the human brain as a spatiotemporal object. It highlighted the challenges of GIS-inspired methods (e.g., spatial aggregation for brain parcellations) to study the brain structure and signals communicated with it, which dynamically change depending on the mental task or the function performed by the person. Other literature includes human cell atlas (Regev et al., 2017; Rozenblatt-Rosen et al., 2017) and the early emergence of digitized human anatomy (Newman, 2018; Lozano et al., 2017; BioDigital, 2023) to form a reference map as a basis for understanding human health to improve diagnosis, prognosis, monitoring, and treatment of disease. However, these studies are either limited to specific parts or lack a comprehensive perspective regarding the electronic health records across the human body as a system of systems (Ackoff, 1971; Jackson and Keys, 1984) through the lens of spatial computing research.
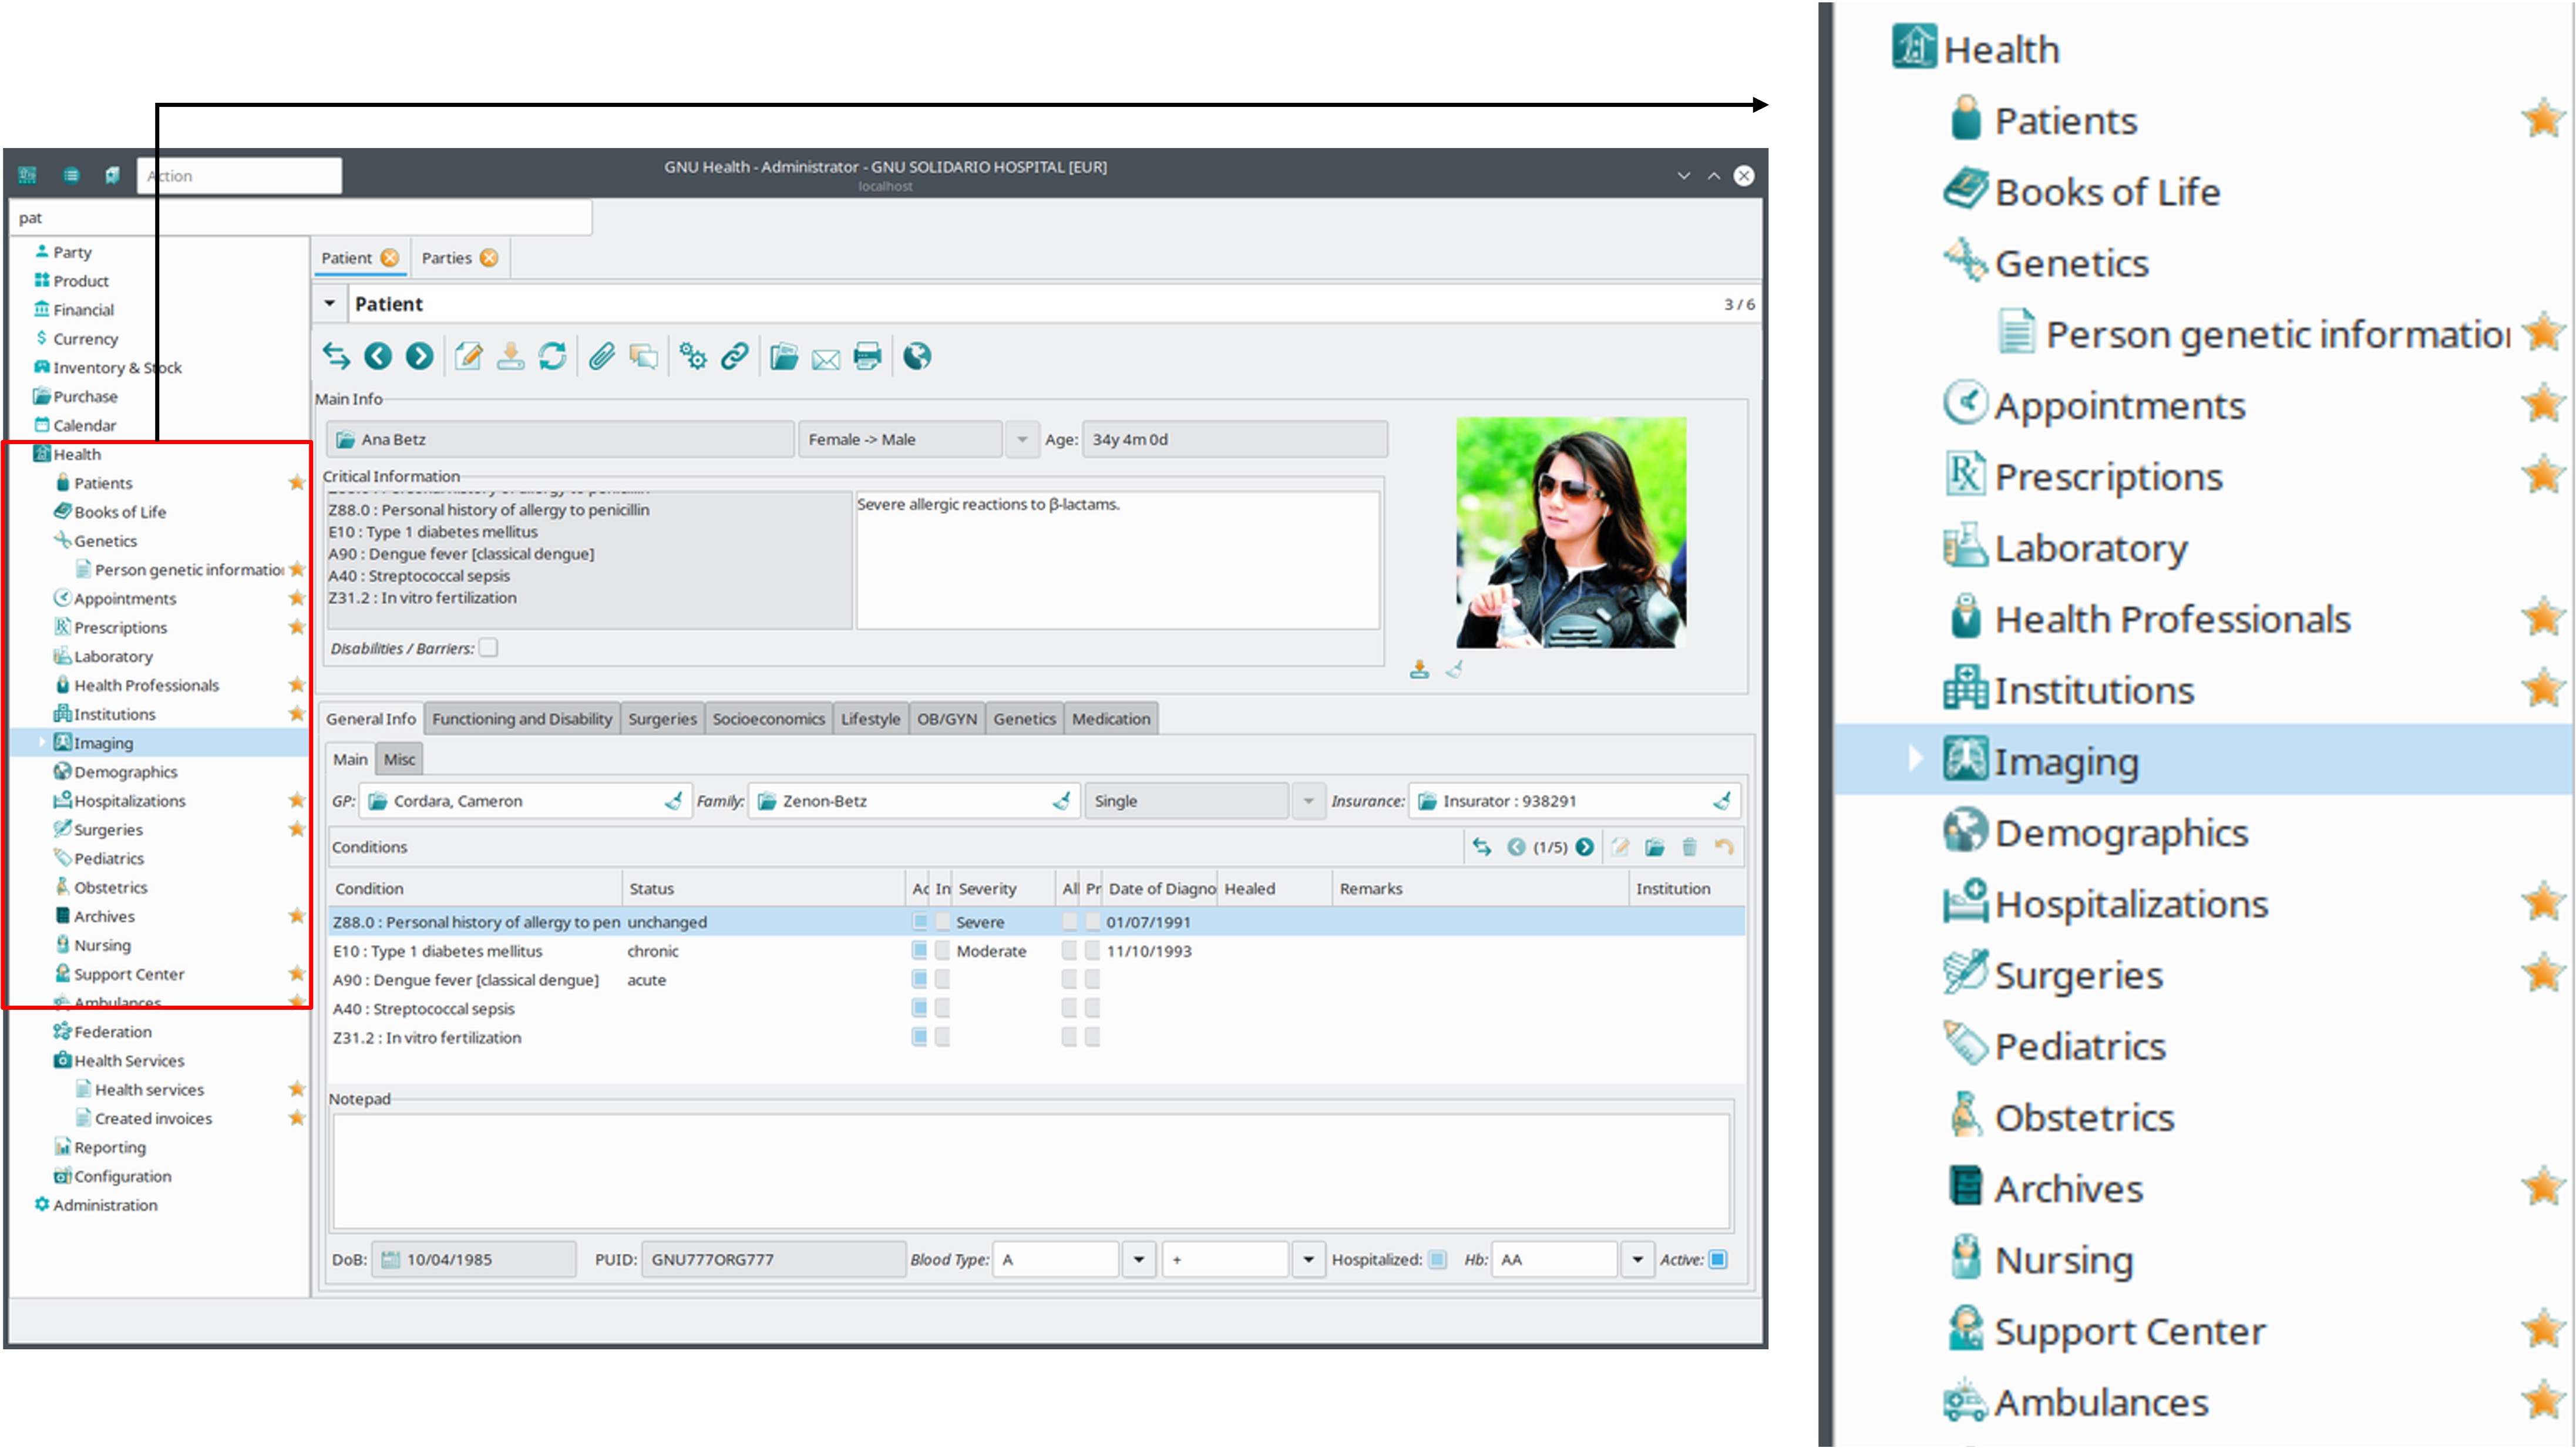
To overcome these limitations, we envision an alternative spatial representation of electronic health records and other biomedical data, which we call Atlas-EHR. Our vision, Atlas-EHR, will enable healthcare professionals and potentially other end-users to explore the human body by overlaying their medical records, using an interactive 3-dimensional anatomy-based display, over multiple levels of detail (e.g., from associations at the organs level to interactions at the sub-cellular level). This representation is analogous to digital maps such as Google Maps, which allow users a global, national, regional, and local view of the earth. In addition, Atlas-EHR will also use thoughtful cartography (e.g., urgency color, disease icons, and symbols) to highlight critical information for improving task efficiency and decision quality, similar to how it is used in designing task-specific maps. For example, BioRender (Biorender, 2023) is a web-based software that allows scientists and researchers to create diagrams and illustrations with pre-made scientific icons, templates, and tools to create high-quality, customizable visuals for biological and biomedical concepts. Figure 2(a) shows icons for cells of different types, including antibodies and other relevant subcomponents. These combined could be used to illustrate immunotherapy concepts in cancer (See Figure 2(b) for illustration 111We are in the process of obtaining the copyright.). National and global agencies (e.g., the world health organization, centers for disease control and prevention) have also developed several standard icons for disease and healthcare that can be used widely. These icons can help convey complex information quickly and effectively. Some examples of healthcare icons, including those for hospitals, are illustrated in Figure 3.
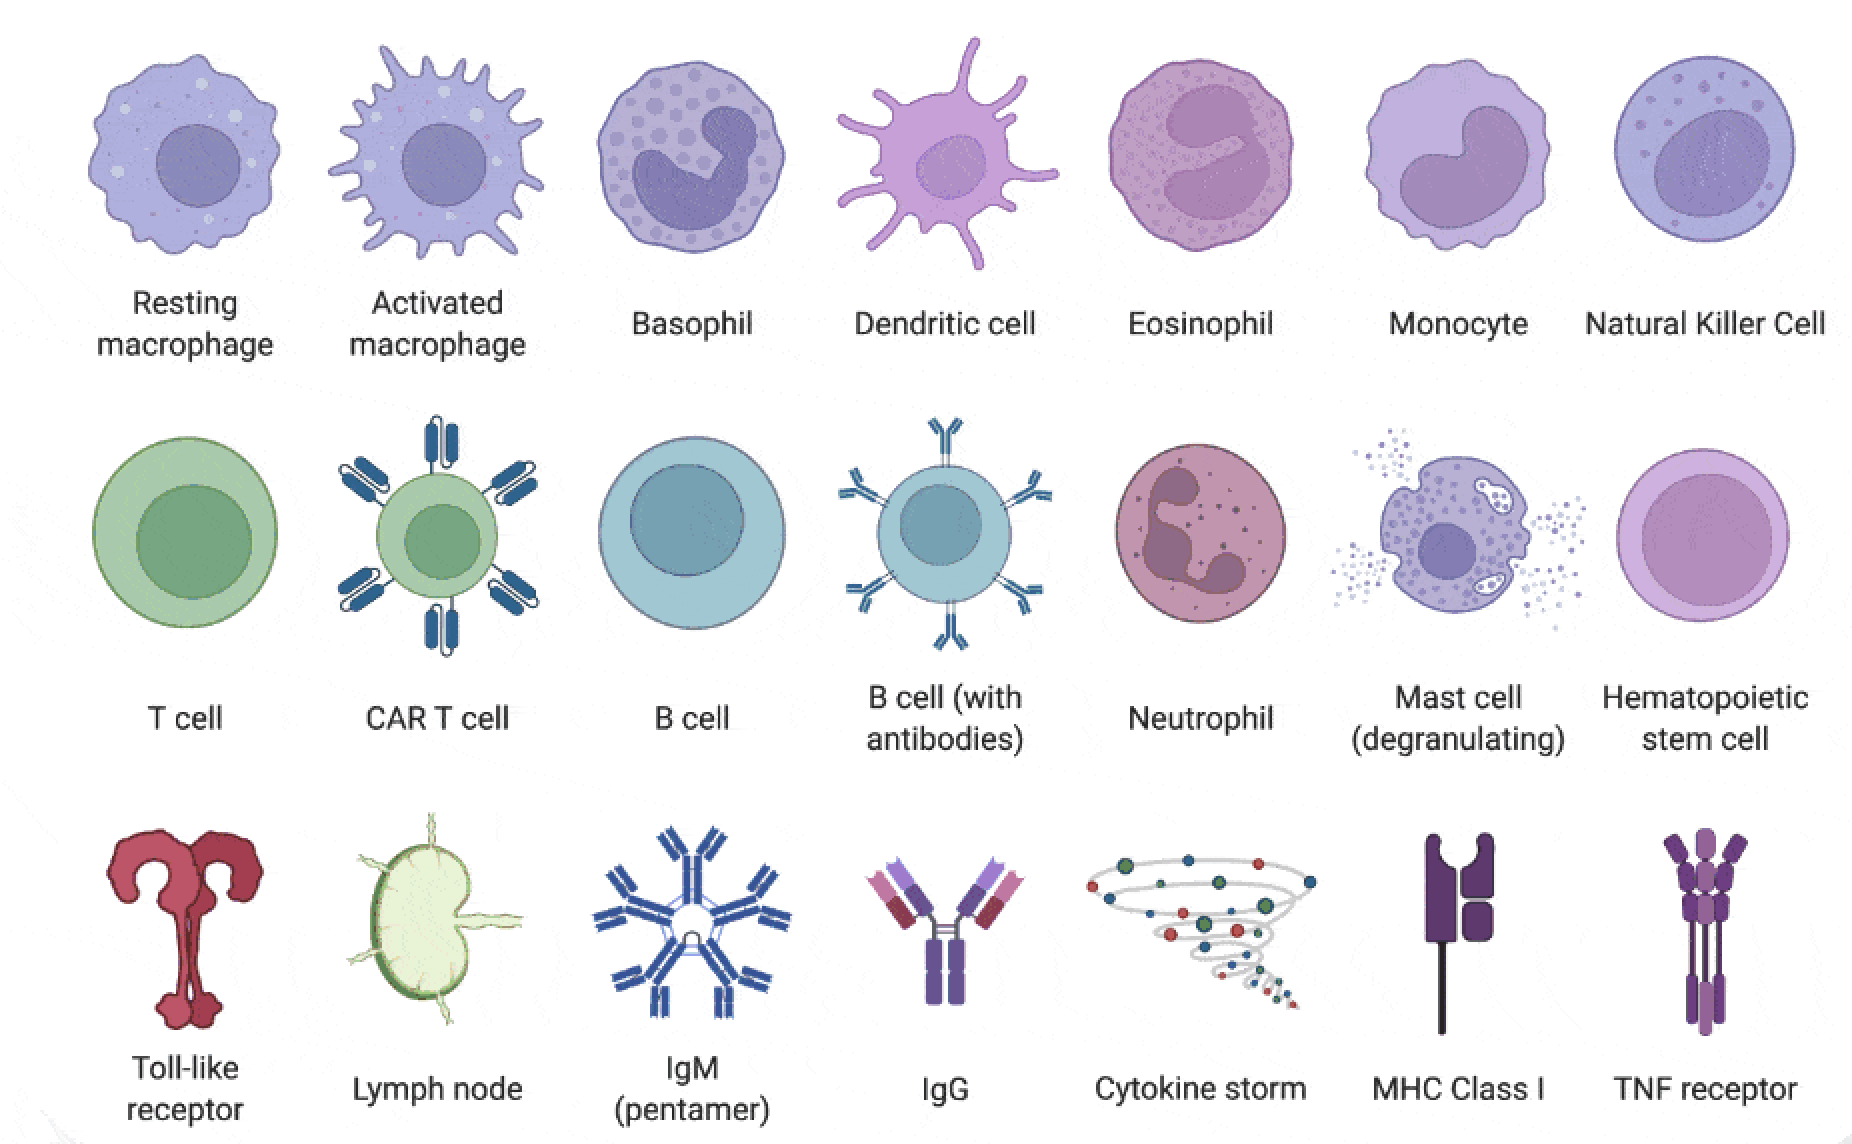
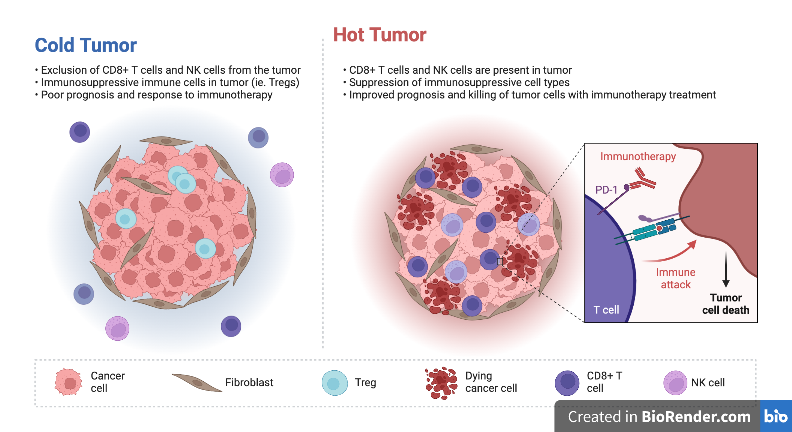
Figure 1(b) illustrates the proposed vision of Atlas-EHR, where a patient’s medical records can be spatially organized and maintained based on their anatomy, which may include various anatomical structures from organs to tissues to cells. For example, it shows that medical imaging (e.g., time series data such as heart electrocardiogram) and clinical notes (e.g., text data such as medical prescription) are all spatially grouped based on relevant organs (e.g., heart). This innovative approach will enable biomedical informatics and healthcare professionals to benefit from large-scale EHRs and better comprehend the complexities and dynamics of various biomedical processes over different spatiotemporal hierarchies in health and disease. Of course, building an accurate model of every patient’s body is very difficult. Atlas-EHR is an attempt that has the potential to bridge the gap between the spatial computing research community and the biomedical domain. It enables medical professionals to easily navigate EHRs and other biomedical data using a spatial approach. This spatial representation offered by Atlas-EHR may facilitate the identification of the most probable locations and causes of health issues. However, Atlas-EHR poses many challenges and research opportunities for current spatial computing, which is traditionally designed for geographic use cases (e.g., navigation, land-survey, mapping).
A few hurdles of Atlas-EHR are as follows. First, the human body and its inner organs affected by diseases are non-rigid and can vary significantly in size, shape, texture, and function. This variability can make it difficult to represent and analyze EHR data accurately. Second, unlike geographic space, the human body lacks a reference system analogous to latitude/longitude, which is a challenge for spatial computing. The current earth-centric view may not be efficient or convenient for representing spatial data related to the human body. For example, how do we define boundaries (e.g., minimum orthogonal boundary rectangles (MOBRs)) for spatial indexing techniques (e.g., R, R+ tress) given their non-rigid and soft shapes of the human body and its organs? How do we incorporate spatial concepts such as ”touch” or ”inside” to build spatially-explainable classifiers for describing co-location patterns (e.g., immune and tumor cells)?
This paper makes the following contributions:
-
•
It envisions, Atlas-EHR, a spatially-organized EHRs data for reducing the time needed by healthcare to understand patient history via the next generation of biomedical decision support. Our vision is more comprehensive (e.g., EHR) than related works (e.g., inner space (Oliver and Steinberger, 2011)).
-
•
It lists a few challenges and opportunities for five broad areas of spatial computing research to explore the human body.
Scope: This paper focuses on a vision; hence prototyping, implementation, and experimental studies fall outside the scope of this article. A detailed description of spatial computing research in geographic space is also outside the scope of this paper. Interested audiences can refer to available books and surveys (Shekhar and Vold, 2020; Shekhar et al., 2011; Golmohammadi et al., 2020; Xie et al., 2017). This paper also does not address biological interpretation or mechanisms of domain-related applications in clinical trials. We list concrete examples of current accomplishments for each of the five broad areas at the geographic scale, followed by a detailed description of future research needs of spatial computing in the inner space 222Innerspace (Wikipedia, 1987) is a sci-fi movie directed by Spielberg that retells the story of Fantastic Voyage (fan, 1966), in which a miniature submarine traverses the human body to examine the brain, blood arteries, eyes, and ears.. We use the ”inner space” term to refer to the human body and its inner parts as a fine biomedical scale for distinguishing from the geographic data used in traditional spatial computing (e.g., GPS, location-based services). Table 1 provides the taxonomy of spatial computing methods discussed in this paper.
Outline: The rest of the paper is organized as follows: Section 2 provides background on electronic health records and on emerging spatial datasets at a cellular level. Section 3 and Section 4 describe the accomplishments and research needs of five broad areas of spatial computing research. Section 5 concludes this paper and outlines future research.
|
|
|
|
Sensing |
|
|||||||||||
|---|---|---|---|---|---|---|---|---|---|---|---|---|---|---|---|---|
| Geographic Space |
|
|
GPS, WiFi |
|
GIS (e.g., ArcGIS) | |||||||||||
| Inner Space |
|
|
|
IonPath (McCaffrey et al., 2020) | ||||||||||||
| Outer Space |
2. Emerging Spatial Data from Inner Space
2.1. Electronic Health Record
Electronic health records (EHRs) are digital systems designed to capture, store and manage patient medical information, including demographic data, medical conditions, treatments, test results, and medications. EHRs are intended to provide an up-to-date and comprehensive view of a patient’s health information that can be accessed and shared by authorized healthcare providers. In the United States, the American Recovery and Reinvestment Act of 2009 (Congress, 2009) provided incentives for healthcare providers to adopt EHRs, and their use has increased significantly since then.
The management and maintenance of EHRs depend on various factors, including the specific platform (e.g., Epic) and the type of data being stored. For example, clinical data, such as laboratory test results, medication lists, and visit notes, are often structured based on patient information, such as demographic data, medical history, and contact information, with specific fields for each data point. This data can be retrieved by date, type of data, and other relevant criteria. On the other hand, multimedia data, such as radiology images or time series, are frequently stored separately. Structured query language (SQL) is widely used in healthcare to extract information from electronic health records and other health information systems, allowing healthcare providers to access patient information quickly and easily.
However, current EHR packages and software are managed using a non-spatial taxonomy, meaning that data is stored without reference to its spatial basis in the human anatomy. This representation restricts the use of spatial computing methods to explore the human body as a complex system of systems (e.g., organs) (Ackoff, 1971; Jackson and Keys, 1984).
2.2. Spatial Data at the Scale of Inner Space
The biomedical scale data becoming available to researchers comes from transcriptomics. It studies analyzing and characterizing ribonucleic acid (RNA) molecules within cells. Under varying conditions, RNA transcripts take the cellular genetic blueprint of DNA and translate it into a constellation of newly synthesized proteins in response to physiologic or pathologic conditions critical to cellular/tissue function and survival.
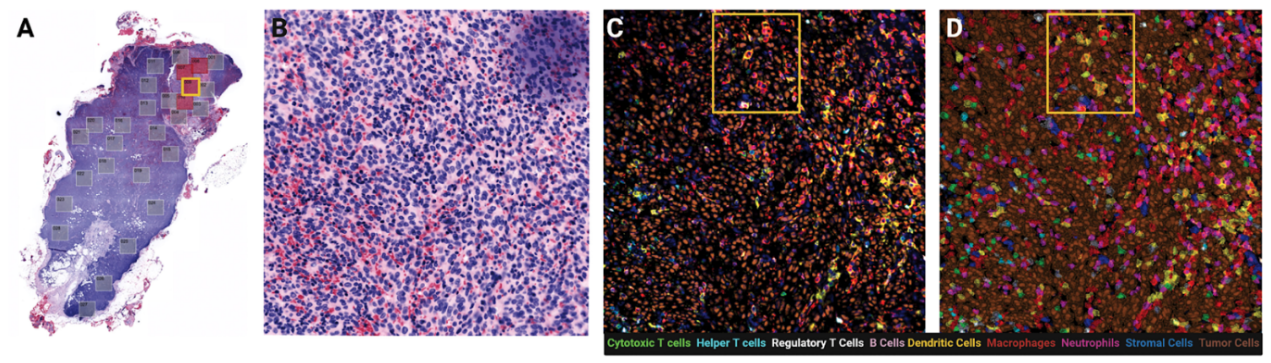
One of the most widely used of these techniques is multiplexed immunofluorescence (MxIF, See Figure 4). Its development has made it possible to simultaneously visualize and identify many cell subtypes (immune, stromal, and malignant) in tissue biopsy-based cellular proteins. This process involves cyclic rounds of antibody staining, imaging, and dye inactivation of formalin-fixed paraffin-embedded (FFPE) tissue sections of metastatic melanoma involving human lymph nodes. With the continuous refinement of these techniques, it is currently possible to identify over 100 cellular phenotypic markers (e.g., CD3, FoxP3, CD14) and their corresponding cellular phenotypic and functional characteristics within a single tissue section. More importantly, this technology is enabling exploration into the complexity of tumor-immune microenvironments in the context of immune checkpoint inhibitors (ICI) therapy (Maus et al., 2022; Hoch et al., 2022). ICI therapy works by activating pre-existing tumor-specific cytotoxic T lymphocytes (CTLs) and enabling them to infiltrate tumor masses and destroy cancer cells. Oncologists are interested in understanding the spatial interactions among immune and cancer cells in situ within the tumor microenvironment in order to gain insights into the mechanism of immune therapies and inform the development of new and more effective treatments (Gide et al., 2020). The spatial arrangements of particular cells in close proximity, known as the ”immunological synapse,” is emerging as a crucial factor in the effectiveness of ICI treatment.
Developing research in this field highlights the need for an automated process to analyze the complex spatial relationships among different cellular subsets and functional states within the tumor microenvironment (TME) in the context of ICI therapy. Furthermore, it is clinically crucial to examine the importance of cell species along with their functional status in a spatially informed manner due to the clinical implications of interactions in close spatial proximity. For example, the impact of one type of immune cell (e.g., cytotoxic T lymphocytes (CTLs)) on nearby cancer cells may be affected by other immune cells (e.g., T regulatory cells). Therefore, in designing a mathematical representation of the arrangements of cells, it is imperative to account for direct spatial contact, which is necessary for biochemical interactions among tumor and immune cells. Many other malignancies where immune therapy exhibits clinical benefit (e.g., lung, breast, and prostate cancers) could similarly benefit from a spatially informed analysis to reveal new insights.
3. Spatial Computing in Geographic Space
This section provides an overview of some state-of-the-art techniques in five broad areas of spatial computing as they have been applied to geographic space. At the end of each discussion, we note a corresponding challenge that will need to be addressed at the scale of inner space. A full discussion of these challenges and the research needed to meet them follows in Section 4.
Spatial Database Management: A database management system (DBMS) is a computerized platform that serves as an interface between a database and its end users, allowing users to retrieve, update, and manage how the information is organized and optimized. The traditional database provides persistence, concurrency control, and scalability. Persistency is achieved by storing data on disk, allowing it to survive system failures, and ensuring data integrity and consistency. Concurrency control is achieved by ensuring that multiple transactions simultaneously executing do not interfere with each other and maintain data consistency. Lastly, scalability is the ability to handle big data without a decrease in performance through techniques such as indexing, partitioning, and sharding. While a traditional DBMS is efficient for non-spatial queries, such as student summary statistics, it is not efficient for spatial queries, like listing the name of cells in a spatial neighborhood (e.g., 50 pixels distance) of a tumor cell. In order to facilitate the use of spatial data (e.g., spatial transcriptomics data and cellular maps), we need spatial DBMS.
A spatial database management system is specifically designed to store, manage, and analyze geographical or spatial data. This data includes geographic coordinates, shapes, and locations, and is used to represent real-world objects such as roads, buildings, and geographical features. A spatial DBMS provides spatial data models (e.g., OGC’s simple features), spatial abstract data types (ADTs), and a query language from which these ADTs are callable. It supports spatial indexing (e.g., space-filling curves such as Z-curve), and provides efficient algorithms (e.g., R, R+, R* trees) for spatial operations and ad-hoc queries.
The input to these spatial indexing algorithms is mainly spatial objects (e.g., city boundaries and counties) that are rigid and pre-defined in geographic space. However, spatial objects in inner space, including human organs if affected by diseases, are non-rigid and change in shape, size, texture, and function. Thus, an important question is how one defines the input MOBRs to spatial indexing techniques (e.g., R, R+, R* trees). We elaborated more in Section 4.
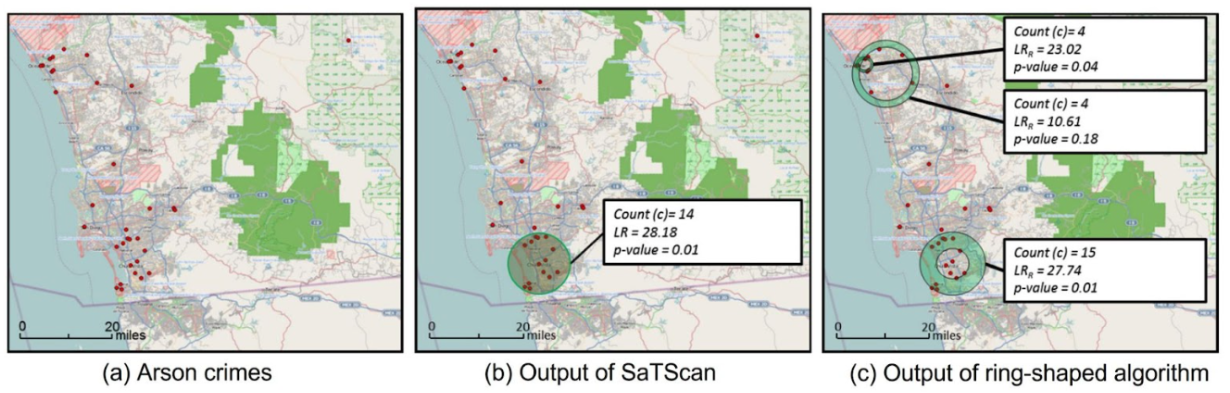
Spatial Pattern Mining : Spatial pattern mining aims to discover potentially useful, interesting, and non-trivial patterns from spatial datasets. One of the most common pattern families is geospatial hotspot detection. The goal is to identify often pre-defined regions (e.g., circular, rectangular) that are denser than surrounding areas. However, in some domains, activities may occur in a ring-shaped pattern. A recent effort to model such behaviors is ring-shaped hotspot detection (Eftelioglu et al., 2014), in which the intuition is serial criminals who often commit crimes neither too close to their home nor too far away. For example, Figure 5 (a) shows 33 arson crimes in San Diego in 2013. Ring-shaped hotspot detection outputs several ring patterns (Figure 5 (c)), whereas SaTScan outputs one large circular area (Figure 5 (b)). More recent approaches have also explored geospatial hotspot detection over a spatial network (e.g., linear hotspot detection (Tang et al., 2017)) as well as statistically arbitrary shape hotspots (e.g., sig-DBSCAN (Xie and Shekhar, 2019)).
Another common pattern family is spatial co-location pattern detection. Spatial co-location patterns represent spatial features whose instances are located near one another given a neighbor relation . The most commonly used interest measure in co-location analysis is the participation index. A participation index is defined as the minimum participation ratio (PR) of the features in a co-location pattern. The participation ratio of a feature in a co-location pattern under input distance threshold , , is the fraction of objects of the feature participating in instances of the pattern. While many studies focus on global co-location patterns, some patterns may only exist at a regional level, and more recent approaches (Li and Shekhar, 2018; Ghosh et al., 2022) aim to explore such behaviors. Table 2 lists a few regional co-location application domains and their example use cases.
A spatially-explainable classifier representing the interactions between immune and tumor cells can be created using a hand-crafted measure derived from co-location analysis, specifically the participation index. However, this measure is used in isotropic space, with the same intensity regardless of measurement direction, which may not be enough to capture relevant spatial interactions, such as surrounded by, which could be biologically significant. Thus, an important question is how one defines new spatial concepts beyond open geospatial consortium’s (OGC) simple features to describe co-location patterns of cells. We elaborate on this issue and similar challenges in Section 4.
| Application Domain | Example Use Cases |
|---|---|
| Oncology | ¡Reponsder, Cytotoxic T-cell and Cancer cell¿, ¡Non-responder, Regulatory T-cell, Tumor cells¿ |
| Retail | ¡China, McDonald’s and KFC¿, ¡USA, McDonald’s and Jimmy John’s¿ |
| Public Safety | ¡Region around bars, Assault crimes, and drunk driving¿ |
| Transportation | ¡Near bus depots, High concentrations, and buses¿ |
Positioning, Navigation, Location-based Services: Positioning is the process of determining an object’s orientation and location in space using global navigation satellite systems (GNSS), such as the global positioning system (GPS), which accurately calculates an object’s location, velocity, and time. In this context, triangulation (Hartley and Sturm, 1997) by measuring the angles between three points and trilateration (Thomas and Ros, 2005) by measuring the distances to three or more points are well-established techniques to determine the unknown location of an object. The widespread availability of GPS systems is primarily due to their low-cost and compact design, which is facilitated by their use of very-large-scale integrated (VLSI) circuit implementations. This has further led to GPS systems being easily incorporated into mobile phones and tablets, followed by ubiquitous location-based services and numerous applications, including routing and navigation, ride-sharing, surveillance, and context advertising.
Even with worldwide availability, GPS signals are largely unavailable indoors due to being blocked by buildings and other structures, where we humans spend 80% to 90% of our time (Greed et al., 2004). Hence, indoor navigation within enclosed structures such as buildings, alleys, or other closed underground locations (e.g., basements) has become an emerging research field. The WiFi positioning system (WPS) uses hotspots and other access points to determine device location. It is often used in conjunction with GPS for better accuracy. Time geography (Miller, 2005) is also used with WiFi traces to quantify space-time uncertainty where WiFi hotspots are in low capacity resulting in very low location precision. Other positioning systems such as Bluetooth Low Energy (BLE) beacons, and ultrasound or infrared sensors are also emerging and current research trends.
Although various studies (Grood and Suntay, 1983; Morosan et al., 2001) have attempted to develop a coordinate system for specific areas of the human body, such as the brain, relatively little effort (Rood et al., 2019) has been devoted to creating a comprehensive spatial reference system for the entire body akin to the latitude/longitude system used in geographic space. These studies have employed a range of techniques, including anatomical landmarks, motion capture, and imaging (e.g., MRI data), to establish coordinate systems for localized regions of the body. Nevertheless, the fundamental question remains: how can a stable and standardized spatial reference system be defined given the intricate and dynamic nature of the human body, with its thousands of anatomical structures that can shift and change over time? We will elaborate on this more in Section 4.
Sensing: An important question in geography is what has been the impact of climate change, urbanization, and population growth on forest cover in recent decades? Geographers traditionally answered this question through labor-intensive manual surveys, which were limited to small geographic areas. Now, remote sensing satellites (e.g., Landsat) allow global monitoring and exploration of land cover and spatial patterns such as drought and weather forecasts. With unmanned aerial vehicles (UAVs), multispectral and hyperspectral sensors, remote sensing data is collected at even higher resolutions to study plant diseases, physiology, and crop growth under extreme weather conditions.
In recent years, many societally important applications in the remote sensing field, including but not limited to detecting land use and land cover, controlling forest fires, wetland management, and observing climate changes, have gained full attention with the rise of deep neural networks (DNNs) for tasks ranging from image classification to semantic segmentation (Cecotti et al., 2020; Yuan et al., 2020). DNN techniques have addressed the limitations of timely and expensive hand-crafted feature construction while providing better performance on selected metrics (e.g., accuracy). However, post-classification processing via rule-based software (e.g., e-cognition) may be often required to provide more interpretable results and reduce noise due to the probabilistic nature of these techniques.
In addition to deep neural network (DNN) techniques, several other data-driven approaches have been developed to address issues such as salt and noise errors due to the self-correlated nature of spatial data. One recent technique is the spatial decision tree (Jiang et al., 2013), which reduces classification error by considering both local and focal (i.e., neighborhood) information to determine the traversal direction of a sample point. These models are typically designed to handle well-structured data, such as raster data representing phenomena over a continuous space. However, they are inadequate for dealing with simple yet critical geometric structures, such as cellular maps derived from MxIF imagery. DNN-based techniques (e.g., PointNet++ (Qi et al., 2017), DGCNN (Wang et al., 2019)) have been proposed to address these limitations. However, these models are not specifically designed to handle multi-categorical point sets (e.g., cellular maps with different types), which do not take full advantage of the spatial relationships between different categories of points.
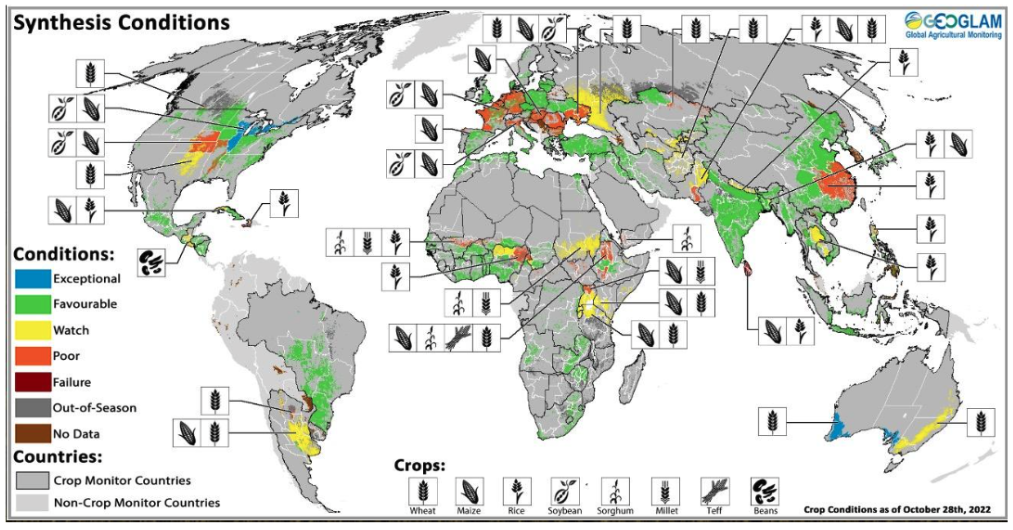
Cartography and Visualization: A geographic information system (GIS) is an integrated platform to collect, manage, analyze, and visualize spatiotemporal information. Many such systems, including ArcGIS and QGIS, are widely used in application areas such as public health, public safety, and agriculture. These applications provide a user-friendly interface to import data from third parties (e.g., the US Census), use spatial statistics techniques (e.g., inverse distance weighted, Kriging, etc.) for interpolation, and visualize derived patterns (e.g., air quality interpolation) in maps. In this context, GEOGLAM (Becker-Reshef et al., 2018), the Group on Earth Observations Global Agricultural Monitoring, with an inherently synthetic focus, is a collaborative initiative to leverage and build upon existing programs and activities through coordinated Earth observation, capacity development, monitoring, and research and development activities. A critical research outcome from GEOGALM is crop monitoring for AMIS (wheat, maize, rice, and soybean) for early warning systems based on multi-source, consensus assessments of the crop growing conditions, status, and agro-climatic conditions (See Figure 6).
To further improve the functionality and capacities of GIS software, much research has been conducted on integrating query processing, indexing, and optimization techniques to deal with ever-increasing volumes of spatial big data along with enhancing classification/detection performance by incorporating deep learning techniques (e.g., CNNs). One example is the integration of spatial modeling techniques, such as network analysis, into GIS software. This type of integration allows for the analysis and simulation of spatial relationships, such as the movement of goods and people along transportation networks, in order to make informed decisions about the design and operation of these networks.
As with GIS software, the recent explosion in spatial pathology data has led to the development of many multiplexed commercial software tools (e.g., IonPath, NanoString) that incorporate machine learning and image processing techniques for identifying multiple biomarkers and their corresponding locations. Interested readers can refer to a comprehensive survey of these technologies for further details (Tan et al., 2020). However, while existing morphologic or count-based approaches have shown some success, limited efforts have been made towards integrating advanced spatial data science techniques, such as spatially-explainable models and spatially generative artificial intelligence, to visualize co-localized biomarkers and discovering complex spatial relationships beyond co-location. We elaborate on this issue further in Section 4.
4. Research Needs in Inner Space
This section lists a few challenges and open research questions related to spatial computing in inner space into five broad areas. We highlight concrete examples and challenges within each sub-area, such as generating and analyzing large-scale cellular maps, developing spatially-explainable models, handling spatial and patient variability, and constructing spatially generative AI approaches for visualizing cellular maps and modeling biological behaviors. Additionally, we present preliminary results and visualizations of the limitations of existing techniques in some sub-areas.
Spatial Database Management: The fundamental inquiry pertains to how spatial entities (e.g., organs, tissues, cells) interact with each other in inner space and is reliant upon the underlying spatial framework that determines the relationships among them. In particular, understanding the spatial interaction of cells of different types is essential for gaining insights into various biological processes.
While OGC’s simple features (e.g., multi-points, multi-lines, multi-polygons) offer a solid foundation for representing common shapes on a map through a spatial reference system, accurately representing and analyzing spatial relationships in inner space can be challenging. These challenges include the non-rigid and flexible structure of cell tissues and organs, the spatial distortion inherent in projecting three-dimensional organs onto two-dimensional maps, and the absence of a spatial reference system. Overcoming these challenges necessitates surpassing the conventional data models and operations applied to spatial entities at the geographic level. To illustrate, a combination of topological and non-topological relationships, such as beyond the existing 9-DEM intersection model and the queen-based-neighborhood directional model, which extend past pairs, may be needed to signify non-distance-based spatial associations (e.g., surrounded by) which are invariant to elastic deformation.
In addition, many current studies on cellular maps derived from MxIF and MxIF-like imagery are often limited to five to ten sampled pathology-driven fields of view (FOVs). By contrast, the entire TME is approximately 300 FOVs, and all tissue on a slide is roughly 1300 FOVs. A recent study (Berry et al., 2021) captured an entire slide image resulting in five terabytes of data volume. This volume may potentially reach thousands of terabytes since many tissue slides from hundreds of patients need to be analyzed. This demonstrates the potential and need to design new spatial data models and modify existing spatial indexing, query processing, and optimization for effectively handling massive spatial data at scale. For example, is it necessary to capture the whole slide image? To reduce the expense of storing thousands of terabytes of data, would it be possible to consider a range query or a nearest neighbor algorithm to estimate the spatial distribution of the whole slide image, perhaps followed by imposing a non-uniform spatial grid index to sample FOVs? With an estimate of the spatial distribution of the whole slide image, is it possible to define the cost and route over a spatial network of FOVs to reach areas associated with the high proliferation of tumor cells?
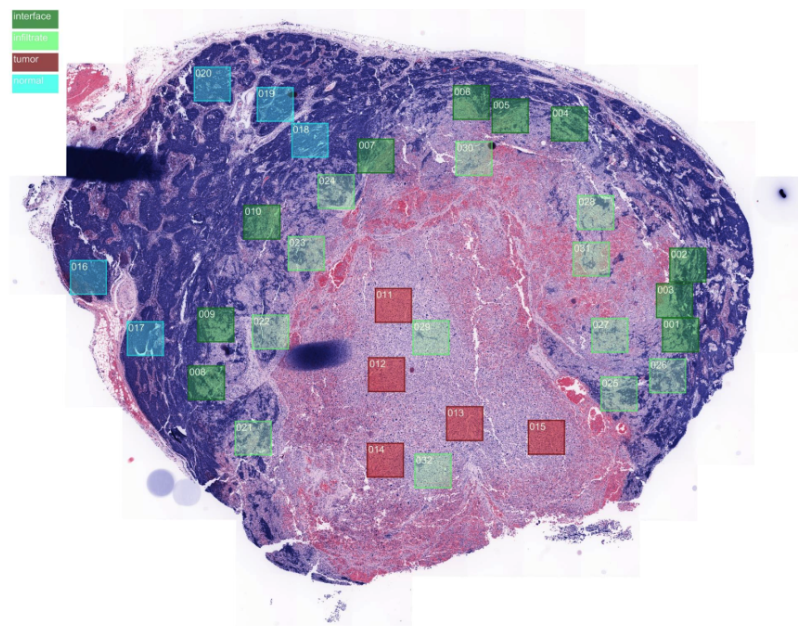
Figure 7 shows pathology-driven FOVs from a virtual H&E tissue slide, which includes tumor, infiltrate, interface, and normal FOVs. The current inspection process is expensive and time-intensive due to the need for domain experts (e.g., pathologists) to manually analyze tissue slides and label them according to response to antibody staining. The current solution is to capture the whole slide image by imposing an overlapping grid structure; however, the associated data storage cost is high. We envision an algorithm that begins with a stochastic approach to generate random FOVs over the whole slide image. This is followed by a spatial network, where nodes are individual FOVs and edges describe the similarity between FOVs based on a summary statistic to estimate the spatial distribution at the FOV-level. This process can be repeated until an optimal spatial distribution is reached, meaning when adequate FOV group samples are generated with high intra-similarity and minimum inter-similarity between groups. However, additional complexities may arise due to the impact of the edge effect and signal-to-noise ratio in estimating spatial distribution.
The following research questions highlight the lack of spatial components in recent machine learning algorithms, including multi-task and federated learning. Is it possible to model the underlying spatial distribution of sampled FOVs from specific tissues (e.g., skin, kidney, lungs) to define spatial indices over regions that share similar spatial configurations? If successful, this may result in thousands to millions of pre-trained models related to specific tasks on cellular maps. This then raises the question of whether pre-trained models need to be stored on disk or memory. Do we need to define intermediate stages on the database that save some parameters, which can then be fine-tuned for other specific tasks? How do we define a standard spatial projection and reference system to leverage large data samples with different formats across multiple sources?
Multi-task learning aims to improve the performance of individual tasks, where a model is trained on multiple tasks simultaneously by leveraging the shared representations learned across all of them. Federated learning has also gained attention in past years. Federated learning is a distributed ML technique where a model is trained across multiple decentralized devices without sharing the raw data with a central server. This becomes important since patient privacy and the propriety nature of medical data prevent many organizations (e.g., hospitals and medical research establishments) from publishing their datasets. Federated learning is an effort to address this issue by only transferring model parameters while training the model on locally stored data. Such algorithms, however, may not be generalizable across all domains since recent works (Palla et al., 2022; Lewis et al., 2021) have highlighted that analyzing cellular maps is tissue-specific (e.g., skin, kidney, lungs), and separate training models are needed to better understand the structure, composition, and underlying spatial patterns. This demonstrates the critical role of spatial database management and relevant techniques (e.g., spatial indexing) for preparing these data at scale to be used by machine learning models on related downstream tasks (e.g., classification, segmentation).
Inner space Pattern Mining: Oncologists are interested in understanding why patients do or do not respond to a particular treatment. Successful therapy is determined by interactions between cancer and immune cells in TME that are extremely difficult to study manually due to the growing richness and volume of cellular maps produced by modern imaging. A possible research direction is directly using state-of-the-art deep neural networks (DNNs) for downstream tasks. However, these models do not provide spatial explainability. Hence, is it possible to describe the clinical outcomes of an intervention using spatial concepts (e.g., touch, inside, surrounded by) and patterns (e.g., colocations, spatial outlier, hotspot-colocations)?
Explainable artificial intelligence (XAI) is a suite of machine learning algorithms that seek to provide increased transparency and trustworthiness by enabling human-understandable explanations for their decisions and actions while maintaining acceptable performance. However, when analyzing spatial patterns among immune and tumor cells in cellular maps, spatially explainable AI plays a substantially more critical role in data-driven hypothesis generation due to important societal use cases, such as designing new immunotherapies for cancer. Our recent work (Farhadloo et al., 2022) has shown promise for machine-constructed spatial cell interactions in modeling non-distance-based spatial relationships, outperforming state-of-the-art methods in separating responder from non-responder cell tissues. This work is an attempt toward a spatially explainable AI-based approach, which involves classifying data into a given number of classes and determining the most discriminative features based on their spatial arrangement. However, this is only the beginning, as many other opportunities remain, including the development of spatially explainable AI methods for other pattern families, such as hotspots and anomalies. In addition, is it possible to detect even more complex spatial interactions using spatially explainable data mining, not only in cellular maps but other kinds of maps?
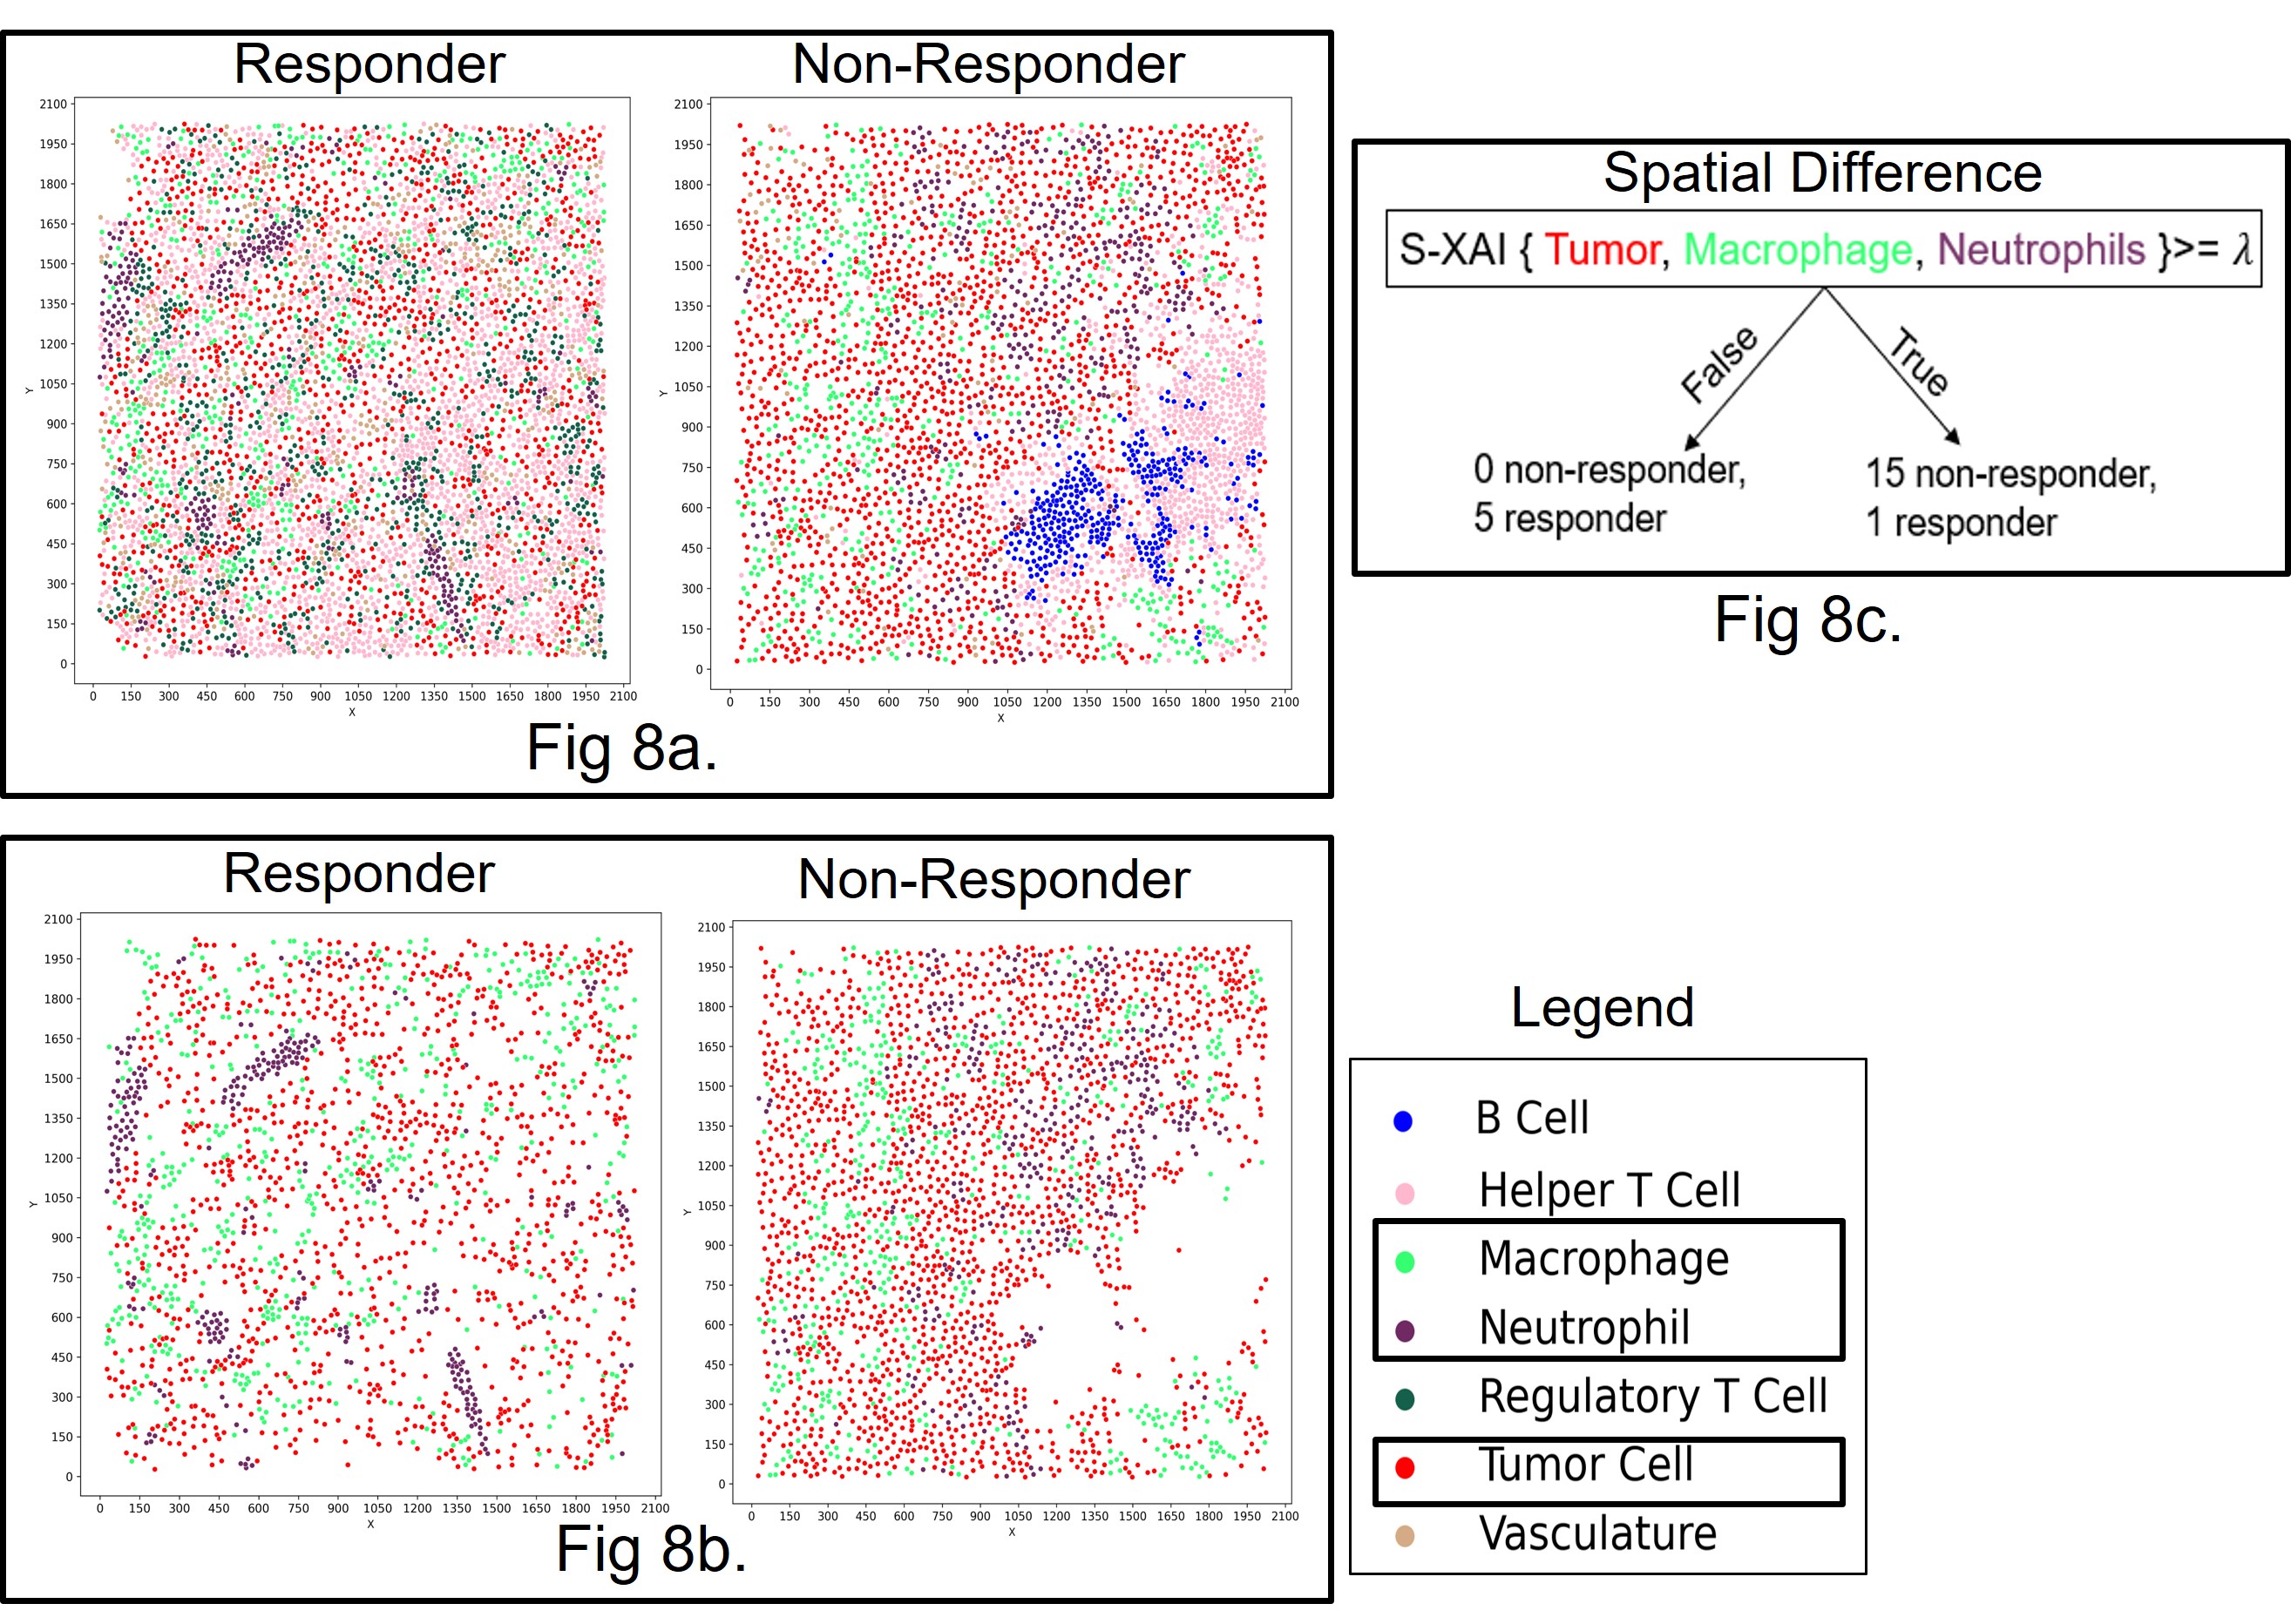
Our preliminary work (Farhadloo et al., 2022) sought to identify the spatial differences that distinguish responders and non-responders at the tumor core. Figure 8 (a) shows the point patterns for all cell species in a responder’s cell tissue compared to a non-responder’s cell tissue. A novel neural network architecture was designed for the cellular map data to discover any significant spatially-explainable patterns that could not be captured by traditional spatial data mining or state-of-the-art DNN techniques. The significance of the identified spatial cell interactions, namely, the machine-constructed spatial cell interactions for different category subsets, was evaluated by feature permutation importance. The top important feature was identified as spatial cell interactions among ¡tumor, macrophage, and neutrophils¿, where macrophage is a type of immune cell, and neutrophil is a type of immune cell. This analysis revealed (Figure 8 (b)) that macrophages were associated with tumor cells in both the responder and non-responder tissue samples. In addition, it showed that neutrophils formed small sub-clusters in the responder tissue sample, while in the non-responder tissue sample, they surrounded the tumor-associated macrophage. Hence, a spatially-explainable AI classifier (Figure 8 (c)) uses the spatial differences between these cells as explanatory features to distinguish between responder and non-responder tissue.
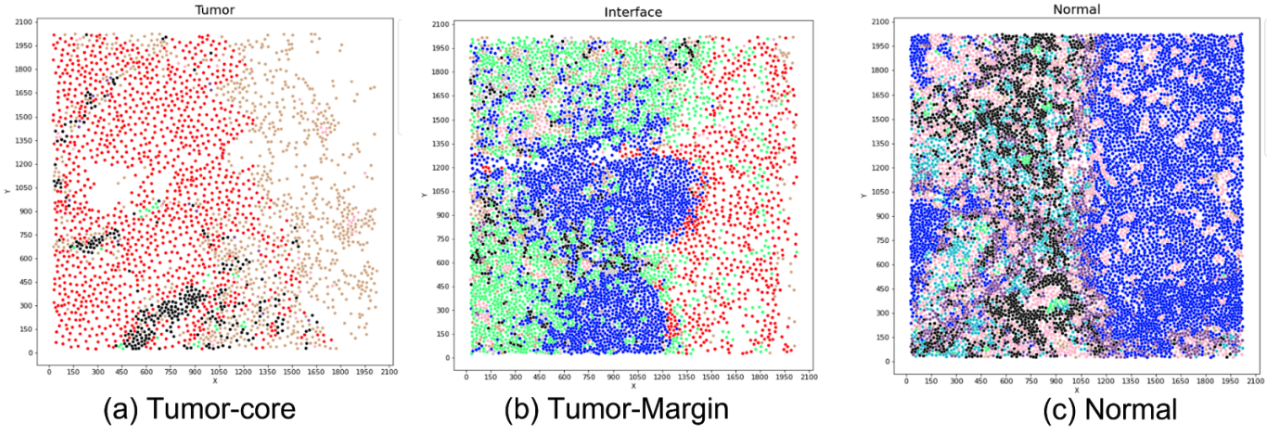
Spatial variability introduces additional complexities to the analysis of cellular maps. These maps are classifications of pathology-driven FOVs in cellular imaging and are categorized into three types: tumor-core, tumor-margin, and normal tissue. Figure 9 highlights the significance of spatial variability in different regions within a single tissue slide. In addition to variability across different FOVs, further intricacies arise within the sub-categories of a FOV. For example, tumor-margin FOVs can be classified into intact and infiltrated regions based on tumor boundary properties. Spatial variability can also extend to sub-regions at the FOV level, where specific spatial patterns, such as hotspots, may be more dominant than others, such as co-location and anomalies. Such complexities demonstrate the need for spatial pattern mining in analyzing cellular maps in inner space. For example, can we have a spatially aware hierarchical clustering technique (e.g., top-down and bottom-up) that defines partitions by considering spatial variability? Is it possible to define a spatial network at the level of the whole slide image based on the spatial variability across FOVs? Such techniques may be useful in predicting the trajectories and related spatial context of a particular immunotherapy to malignant cells by concentrating on tumor-infiltrated regions.
Positioning, Navigation, Location-based services: Computer-vision positioning is a technique that aims to determine the position and orientation of objects by analyzing visual data, such as images. This technique also can provide coordinates and descriptive text corresponding to the scene being analyzed. However, directly applying this technique to cellular maps in inner space may not work correctly due to patient variability and the non-rigid structure of human organs, muscles, blood vessels, etc. Patient variability could be classified based on a hierarchy of demographic, health, and physical fitness information. From a high-level view, patients may be classified by their age, race, ethnicity, and gender, factors that have a high impact on the inner space of human physiology. Additional complexities may arise due to the patient’s medical history (e.g., past injuries, chronic illness, etc.) and physical fitness. At this level, computer-vision-positioning faces a great challenge due to the data heterogeneity at multiple phases. A possible solution may be defining a heterogenous data-aware hierarchy to split the data to account for patient variability. Such a hierarchy could be specified as a procedure to characterize a social/fair/mathematical norm such that in-depth features (e.g., detailed physical or health history) impact how the dataset is partitioned.
Beyond patient variability, the non-rigid structure of human organs could highly impact how computer-vision-positioning technology should be modified and adapted to inner space. Human organs and muscles, including the heart, kidneys, liver, and cardiac and smooth muscles, can change shape and size in response to various physiological and pathological processes, and the frequency of these changes can vary widely depending on the specific organ/muscle and the conditions it is subjected to. For example, the heart expands, and contracts with each beat, and the size of the ventricles can change in response to changes in fluid volume. The lungs can expand and contract with each breath, and the size of the air spaces can change in breathing rate or lung volume. This elastic deformation of human organs with high temporal variability calls into question the generalizability of computer-vision-positioning. Is it possible to train a learning algorithm on images of a certain physical structure of some organ and use those images to determine the elastic deformation of the same organ at the next temporal step?
Sensing: Medical imaging falls within the broader definition of remote sensing where electromagnetic radiation photons or sonic wave trains are generated and coupled to the body and then detected as transmitted, absorbed, or reflected signals to an external detector a short distance away. In addition, medical imaging utilizes remote sensors or cameras to obtain pictures or information concerning a patient’s body or surroundings. Current medical diagnostics involve the extraction of a sampling tissue which is difficult for more sensitive areas, such as the brain. Can we generate some minimally invasive methods for such sensitive areas which can provide more value in early-stage diagnosis?
Recently, nanoparticles (Nguyen et al., 2021) have found wide application in biomedical imaging, where the particles can be used as a contrasting agent for magnetic resonance imaging (MRI) and provide an early-stage diagnosis in sensitive areas (e.g., brain) with minimum invasion. nanoparticles have wide potential applications in cancer therapy due to their superior electronic conductivity, biocompatibility, and magnetic properties, which can be directed to specific sites in the body and used to heat tissues. The magnetic properties of the particles can then be used to apply a magnetic field-mediated heating effect, which can result in the destruction of the targeted cancer cells. Additionally, nanoparticles can also be used to improve the imaging of cancer cells, allowing for more effective diagnosis and monitoring of the disease. Other emerging applications are shown in Figure 10.
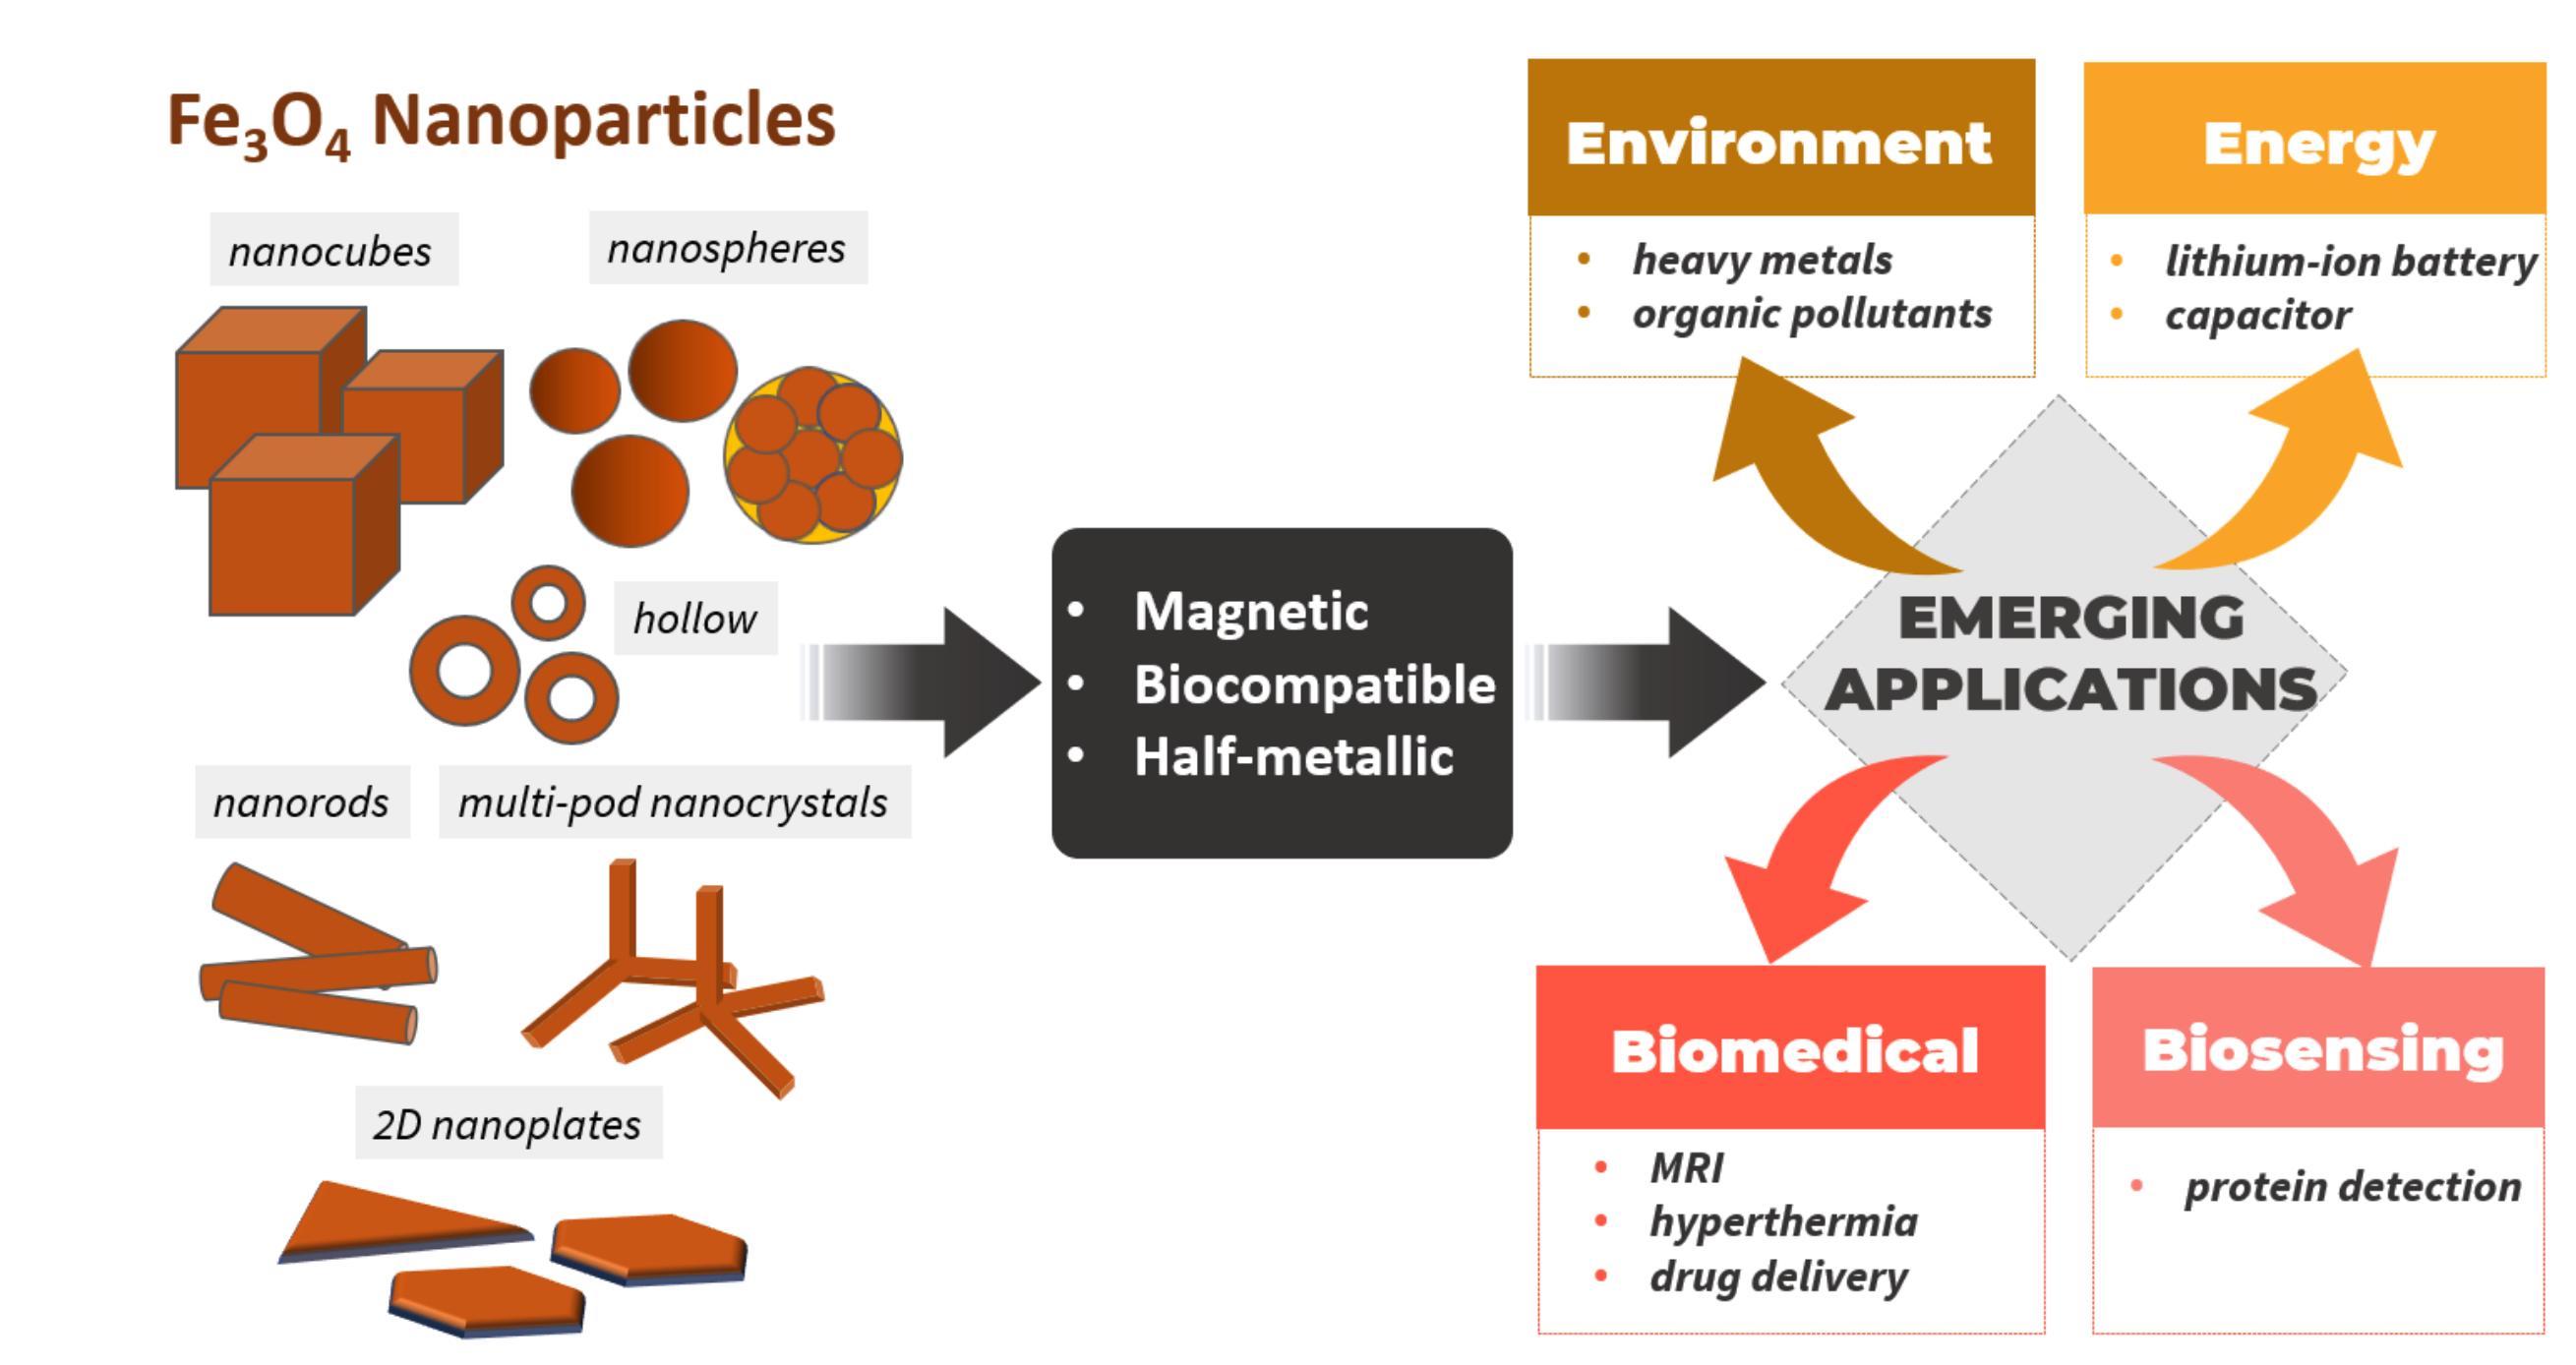
However, further research is needed to fully understand the risks. For instance, the use of nanoparticles as a means of delivering drugs comes with the risk of toxicity caused by the release of therapeutic agents contained within the particles. The magnetic properties of nanoparticles can also cause localized heating, potentially leading to tissue damage in the surrounding area. Is it possible for AI models to minimize such adverse side effects by predicting some immune responses related to a specific subject (e.g., formation of antibodies, inflammation, etc.) during the administration of the dose? More generally, might there be other such nanoparticles that can be harnessed by materials science toward the early stages of cancer?
Cartography and Visualization: Existing GIS software has limited capabilities to automate the visualization of cells of different classes. As a result, extensive manual efforts are required to select contrasting colors, sizes, and other visualization components to emphasize certain spatial patterns. Considering the increasing number of identified cell types, their functional characteristics, and the thousands of samples derived from specific tissues, the cost of manual visualization can increase exponentially. Can we improve the capabilities of existing GIS software with the recent innovation of generative AI algorithms? Specifically, can we implement a spatially-aware generative AI model that allows end-users to visualize cellular maps with only a few commands and contrast specific spatial patterns?
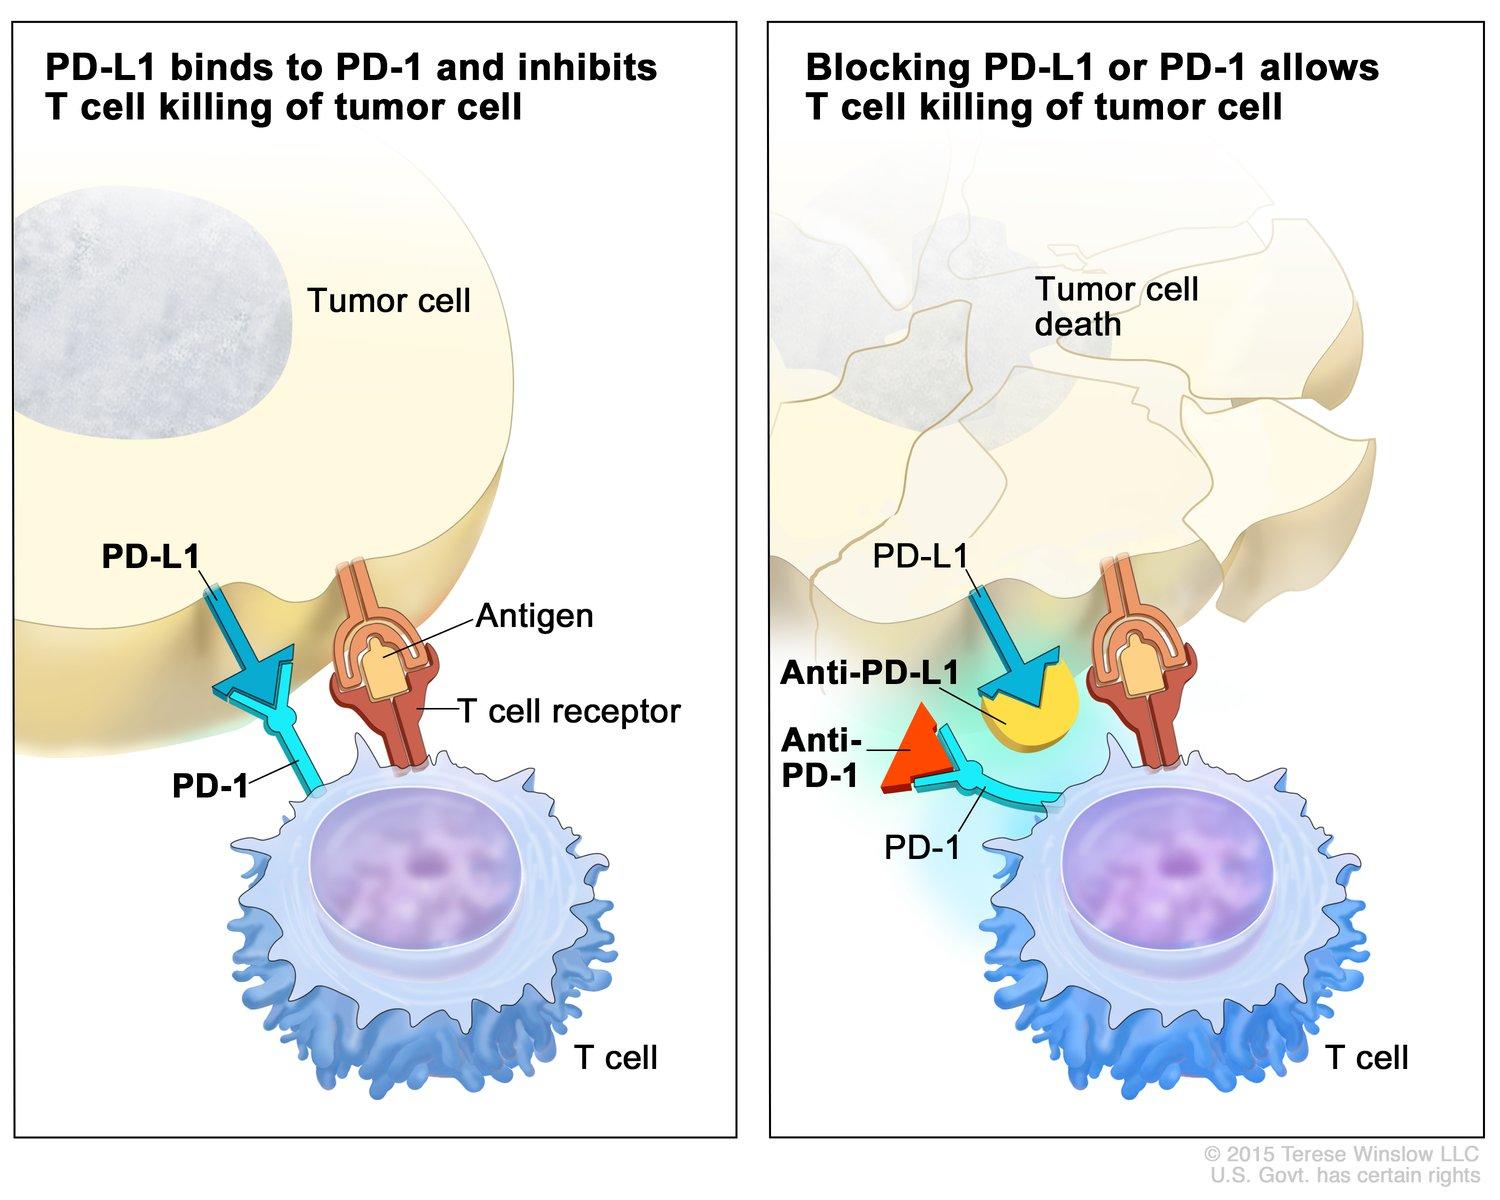
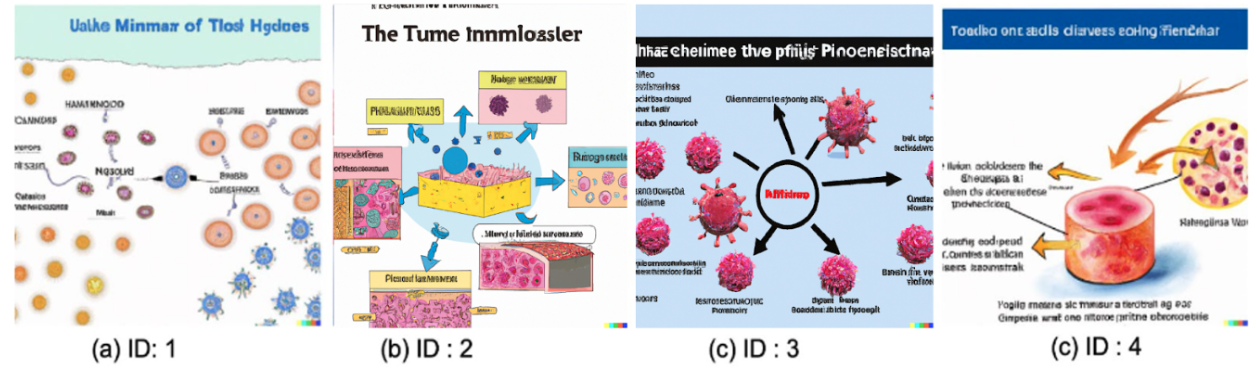
This functionality can be further expanded to generate illustrations representing biological behaviors across various scales in the human body, encompassing interactions between organs and even at the cellular level. For example, Figure 11 shows two diagrams contrasting the importance of immune ICI therapy in two spatial contexts. The left diagram shows a T cell that cannot destroy the cancer cell due to the spatial association between the tumor and the immune cell. The diagram on the right illustrates a killer T cell that can kill cancer cells due to a blockade (such as anti-PD-L1) at the checkpoint gate (between PD-1 and PD-L1). Existing visualization requires individuals with a biological background, who may need extensive manual efforts to emphasize the proper biological processes while delivering an easy-to-understand message. Therefore, it is worth investigating whether spatially-aware AI models can represent similar biological behaviors for creating diagrams and examples that are more accessible and interpretable to a broader audience.
| ImageID | Text Prompt |
|---|---|
| 1 | A map of interaction between immune and tumor cells. |
| 2 | What are tumor-infiltrated immune cells? |
| 3 | Different types of cancer treatment, including immunotherapy and immune checkpoint inhibitors. |
| 4 | Deactivation of killer cells based on interacting with tumor cells in close geographic regions. |
To assess the limitations of existing image-based generative AI, we conducted a study using DALL.E-2 to produce diagrams based on a series of questions related to ICI, as illustrated in Figure 12. DALL-E is a generative AI model that uses a combination of GPT-3 language and image generation models to produce unique, high-quality images that match the input text description (Radford et al., 2021). Despite several attempts to simplify or provide more detailed descriptions, the model failed to generate the correct context for the given prompts. Another related work has shown the incapability of DALL.E-2 in simpler cases (Marcus et al., 2022).
The generated images were often hard to interpret and understand, with many cases including gibberish texts and incomprehensible features. Table 3 presents a list of the prompts, and Figure 12 displays the corresponding images. As indicated in Figure 12, the output images failed to capture the correct context or environment, despite the detailed text prompts.
Our findings demonstrate the lack of generalizability of these models to specific domains and their inadequate understanding of the spatial concepts and biochemical interactions that underlie many biological behaviors in cancer therapies. In the context of existing generative AI and avoiding the need to train them, a possible solution is to define geometries and related counterparts and enforce biological behaviors to connect these sub-modules. However, this process still involves manual processing. More importantly, the end-user should have background information on cancer biology and related immunotherapy treatments.
5. Conclusion And Future Work
This paper argues that spatial computing has the potential to help healthcare professionals quickly browse patient’s medical history and other biomedical data since their successful applications (e.g., Google Maps, Google Earth) are already used to communicate big data (e.g., satellite imagery, census) to a broad audience expeditiously. To this end, we envision, Atlas-EHR, a spatially-organized EHRs data for reducing the time needed by healthcare to understand patient history via the next generation of biomedical decision support. We list a few challenges and opportunities for five broad areas of spatial computing research to explore the human body. For each domain, we illustrated the successful use of related spatial computing techniques in geographic space and then highlighted research needs to better solve challenging problems in inner space.
The field of spatial computing has been pushing the boundaries of what is possible, but the next frontier lies within the human body itself. Exploring inner space computationally will require new thinking and new approaches. ERHs contain a wealth of data that is invaluable to biomedical research, but we need to rethink how we store and extract this data to its full potential. The concept of Atlas-EHR provides a roadmap for the future of spatial computing within the healthcare industry, enabling us to store and analyze EHR data using spatial computing principles. By doing so, we can unlock new insights into complex diseases and develop tailored treatment plans that will maximize patient outcomes.
The successful results of research on Atlas-EHR hold enormous potential for various applications. Advanced spatial computing techniques might be used in precision medicine to fight complex diseases (e.g., cancer) by combining genomic data (at a fine biomedical scale) with other EHR data of patients to create customized treatment plans (e.g., targeting particular genetic mutations) and enhance informed decision-making to maximize clinical outcomes for each individual. Spatial computing methods could support real-time monitoring of the body’s inner space to manage chronic disease (e.g., diabetes and heart disease) and predict abnormal events (e.g., high blood pressure, blood clots), enabling doctors to respond quickly to changes in patient’s conditions. Spatially organized 3D map-based-simulation could enhance the existing EHR platform for grouping and managing patients’ medical history (e.g., lab results, medications, radiology images) based on spatial information in inner spaces such as the human body (e.g., organs) to facilitate more efficient and effective querying and visualizing of relevant information to improve prognostics and treatment planning. Spatially-aware surgery could provide surgeons more in-depth understanding of patient-specific anatomy and physiology, in which inner space, together with a simulation system, would allow them to plan and visualize complex surgeries with greater precision, reducing the need for invasive procedures and minimizing the risk of surgical complications. These are but a few examples of our vision. In short, Atlas-EHR has the potential to revolutionize the healthcare industry.
Acknowledgments.
This material is based upon work supported by the NSF under Grants No. 1901099, and 1916518. We also thank Kim Koffolt and the Spatial Computing Research Group for their valuable comments and refinements.
References
- (1)
- fan (1966) 1966. Fantastic Voyage Movie. https://www.imdb.com/title/tt0060397/ [Accessed: March 20, 2023].
- Ackoff (1971) Russell L Ackoff. 1971. Towards a system of systems concepts. Management science 17, 11 (1971), 661–671.
- Becker-Reshef et al. (2018) Inbal Becker-Reshef, Christopher Justice, Alyssa K. Whitcraft, and Ian Jarvis. 2018. Geoglam: A Geo Initiative on Global Agricultural Monitoring. In 2018 IEEE International Geoscience and Remote Sensing Symposium, IGARSS 2018, Valencia, Spain, July 22-27, 2018. IEEE, 8155–8157. https://doi.org/10.1109/IGARSS.2018.8517575
- Bengio et al. (2021) Yoshua Bengio, Yann LeCun, and Geoffrey E. Hinton. 2021. Deep learning for AI. Commun. ACM 64, 7 (2021), 58–65. https://doi.org/10.1145/3448250
- Berry et al. (2021) Sneha Berry, Nicolas A Giraldo, Benjamin F Green, Tricia R Cottrell, Julie E Stein, Elizabeth L Engle, Haiying Xu, Aleksandra Ogurtsova, Charles Roberts, Daphne Wang, et al. 2021. Analysis of multispectral imaging with the AstroPath platform informs efficacy of PD-1 blockade. Science 372, 6547 (2021), eaba2609.
- BioDigital (2023) BioDigital. 2023. The BioDigital Human, An interactive 3D software platform for visualizing anatomy, disease, and treatments within the human body. https://www.biodigital.com/product/the-biodigital-human [Accessed: March 20, 2023].
- Biorender (2023) Biorender. 2023. BioRender Library. https://www.biorender.com/library [Accessed: March 30, 2023].
- Brunsdon et al. (1998) Chris Brunsdon, Stewart Fotheringham, and Martin Charlton. 1998. Geographically weighted regression. Journal of the Royal Statistical Society: Series D (The Statistician) 47, 3 (1998), 431–443.
- Cecotti et al. (2020) Hubert Cecotti, Agustin Rivera, Majid Farhadloo, and Miguel A Pedroza. 2020. Grape detection with convolutional neural networks. Expert Systems with Applications 159 (2020), 113588.
- Congress (2009) US Congress. 2009. American recovery and reinvestment act of 2009. Public Law 755 (2009), 111–5.
- Corporation (2023) Epic Systems Corporation. 2023. About Epic. https://www.epic.com/about [Accessed: March 20, 2023].
- Eftelioglu et al. (2014) Emre Eftelioglu, Shashi Shekhar, Dev Oliver, Xun Zhou, Michael R Evans, Yiqun Xie, James M Kang, Renee Laubscher, and Christopher Farah. 2014. Ring-shaped hotspot detection: A summary of results. In 2014 IEEE International Conference on Data Mining. IEEE, 815–820.
- Farhadloo et al. (2022) Majid Farhadloo, Carl Molnar, Gaoxiang Luo, Yan Li, Shashi Shekhar, Rachel L. Maus, Svetomir N. Markovic, Alexey A. Leontovich, and Raymond Moore. 2022. SAMCNet: Towards a Spatially Explainable AI Approach for Classifying MxIF Oncology Data. In KDD ’22: The 28th ACM SIGKDD Conference on Knowledge Discovery and Data Mining, Washington, DC, USA, August 14 - 18, 2022, Aidong Zhang and Huzefa Rangwala (Eds.). ACM, 2860–2870. https://doi.org/10.1145/3534678.3539168
- Fischl et al. (1999) Bruce Fischl, Martin I Sereno, Roger BH Tootell, and Anders M Dale. 1999. High-resolution intersubject averaging and a coordinate system for the cortical surface. Human brain mapping 8, 4 (1999), 272–284.
- Gardels (1996) Ken Gardels. 1996. The Open GIS approach to distributed geodata and geoprocessing. In Third International Conference/Workshop on Integrating GIS and Environmental Modeling, Santa Fe, NM. 21–25.
- Gavrila (1994) DM Gavrila. 1994. R-tree index optimization. University of Maryland, Center for Automation Research, Computer Vision ….
- Ghosh et al. (2022) Subhankar Ghosh, Jayant Gupta, Arun Sharma, Shuai An, and Shashi Shekhar. 2022. Towards geographically robust statistically significant regional colocation pattern detection. In Proceedings of the 5th ACM SIGSPATIAL International Workshop on GeoSpatial Simulation, GeoSim 2022, Seattle, Washington, 1 November 2022, Taylor Anderson, Alexander Hohl, Joon-Seok Kim, and Ashwin Shashidharan (Eds.). ACM, 11–20. https://doi.org/10.1145/3557989.3566158
- Gide et al. (2020) Tuba N Gide, Ines P Silva, Camelia Quek, Tasnia Ahmed, Alexander M Menzies, Matteo S Carlino, Robyn PM Saw, John F Thompson, Marcel Batten, Georgina V Long, et al. 2020. Close proximity of immune and tumor cells underlies response to anti-PD-1 based therapies in metastatic melanoma patients. Oncoimmunology 9, 1 (2020), 1659093.
- Golmohammadi et al. (2020) Jamal Golmohammadi, Yiqun Xie, Jayant Gupta, Majid Farhadloo, Yan Li, Jiannan Cai, Samantha Detor, Abigail Roh, and Shashi Shekhar. 2020. An introduction to spatial data mining. UCGIS. (2020).
- Greed et al. (2004) Zakevia Greed, Samir Elmir, and Gary Miller. 2004. Inside Story: Indoor Air Quality. (2004).
- Grood and Suntay (1983) Edward S Grood and Wilfredo J Suntay. 1983. A joint coordinate system for the clinical description of three-dimensional motions: application to the knee. (1983).
- Gupta et al. (2020) Jayant Gupta, Yiqun Xie, and Shashi Shekhar. 2020. Towards Spatial Variability Aware Deep Neural Networks (SVANN): A Summary of Results. CoRR abs/2011.08992 (2020). arXiv:2011.08992 https://arxiv.org/abs/2011.08992
- Hartley and Sturm (1997) Richard I Hartley and Peter Sturm. 1997. Triangulation. Computer vision and image understanding 68, 2 (1997), 146–157.
- Hoch et al. (2022) Tobias Hoch, Daniel Schulz, Nils Eling, Julia Martínez Gómez, Mitchell P Levesque, and Bernd Bodenmiller. 2022. Multiplexed imaging mass cytometry of the chemokine milieus in melanoma characterizes features of the response to immunotherapy. Science immunology 7, 70 (2022), eabk1692.
- Institute (2015) National Cancer Institute. 2015. Immune checkpoint inhibitors. https://www.cancer.gov/about-cancer/treatment/types/immunotherapy/checkpoint-inhibitors. Immuno-Oncology 42 (2015), 55–66.
- Jackson and Keys (1984) Michael C Jackson and Paul Keys. 1984. Towards a system of systems methodologies. Journal of the operational research society 35, 6 (1984), 473–486.
- Jiang et al. (2013) Zhe Jiang, Shashi Shekhar, Xun Zhou, Joseph F. Knight, and Jennifer Corcoran. 2013. Focal-Test-Based Spatial Decision Tree Learning: A Summary of Results. In 2013 IEEE 13th International Conference on Data Mining, Dallas, TX, USA, December 7-10, 2013, Hui Xiong, George Karypis, Bhavani Thuraisingham, Diane J. Cook, and Xindong Wu (Eds.). IEEE Computer Society, 320–329. https://doi.org/10.1109/ICDM.2013.96
- Lewis et al. (2021) Sabrina M Lewis, Marie-Liesse Asselin-Labat, Quan Nguyen, Jean Berthelet, Xiao Tan, Verena C Wimmer, Delphine Merino, Kelly L Rogers, and Shalin H Naik. 2021. Spatial omics and multiplexed imaging to explore cancer biology. Nature methods 18, 9 (2021), 997–1012.
- Li (2021) Yan Li. 2021. SRNet: A spatial-relationship aware point-set classification method for multiplexed pathology images.. In In Proceedings of DeepSpatial’21: 2nd ACM SIGKDD Workshop on Deep Learning for Spatiotemporal Data, Applications, and Systems, Vol. 10.
- Li et al. (2022) Yan Li, Majid Farhadloo, Santhoshi Krishnan, Yiqun Xie, Timothy L Frankel, Shashi Shekhar, and Arvind Rao. 2022. CSCD: towards spatially resolving the heterogeneous landscape of MxIF oncology data. In Proceedings of the 10th ACM SIGSPATIAL International Workshop on Analytics for Big Geospatial Data. 36–46.
- Li and Shekhar (2018) Yan Li and Shashi Shekhar. 2018. Local Co-location Pattern Detection: A Summary of Results. In 10th International Conference on Geographic Information Science, GIScience 2018, August 28-31, 2018, Melbourne, Australia (LIPIcs, Vol. 114). Schloss Dagstuhl - Leibniz-Zentrum für Informatik, 10:1–10:15. https://doi.org/10.4230/LIPIcs.GISCIENCE.2018.10
- Lin et al. (2015) Jia-Ren Lin, Mohammad Fallahi-Sichani, and Peter K Sorger. 2015. Highly multiplexed imaging of single cells using a high-throughput cyclic immunofluorescence method. Nature communications 6, 1 (2015), 8390.
- Lozano et al. (2017) Maria Teresa Ugidos Lozano, Fernando Blaya Haro, Carlos Molino Diaz, Sadia Manzoor, Gonzalo Ferrer Ugidos, and Juan Antonio Juanes Mendez. 2017. 3D digitization and prototyping of the skull for practical use in the teaching of human anatomy. Journal of medical systems 41 (2017), 1–5.
- Marcus et al. (2022) Gary Marcus, Ernest Davis, and Scott Aaronson. 2022. A very preliminary analysis of dall-e 2. arXiv preprint arXiv:2204.13807 (2022).
- Maus et al. (2022) Rachel LG Maus, Alexey A Leontovich, Raymond M Moore, Laura Becher, Wendy K Nevala, Thomas J Flotte, Ruifeng Guo, Jill M Schimke, Betty A Dicke, Yiyi Yan, et al. 2022. Resolving the heterogeneous tumor-centric cellular neighborhood through multiplexed, spatial paracrine interactions in the setting of immune checkpoint blockade. Cancer research communications 2, 2 (2022), 78–89.
- McCaffrey et al. (2020) Erin F McCaffrey, Michele Donato, Leeat Keren, Zhenghao Chen, Megan Fitzpatrick, Vladimir Jojic, Alea Delmastro, Noah F Greenwald, Alex Baranski, William Graf, et al. 2020. Multiplexed imaging of human tuberculosis granulomas uncovers immunoregulatory features conserved across tissue and blood. Biorxiv (2020), 2020–06.
- Miller (2005) Harvey J Miller. 2005. A measurement theory for time geography. Geographical analysis 37, 1 (2005), 17–45.
- Morosan et al. (2001) Patricia Morosan, Jorg Rademacher, Axel Schleicher, Katrin Amunts, Thorsten Schormann, and Karl Zilles. 2001. Human primary auditory cortex: cytoarchitectonic subdivisions and mapping into a spatial reference system. Neuroimage 13, 4 (2001), 684–701.
- Newman (2018) Cathy Newman. 2018. Digital cadavers are replacing real ones. But should they? https://www.nationalgeographic.com/science/article/digital-cadavers-are-replacing-real-ones-but-should-they-future-medicine [Accessed: March 20, 2023].
- Nguyen et al. (2021) Minh Dang Nguyen, Hung-Vu Tran, Shoujun Xu, and T. Randall Lee. 2021. Fe3O4 Nanoparticles: Structures, Synthesis, Magnetic Properties, Surface Functionalization, and Emerging Applications. Applied Sciences 11, 23 (Nov 2021), 11301. https://doi.org/10.3390/app112311301
- Oliver and Steinberger (2011) Dev Oliver and Daniel J Steinberger. 2011. From geography to medicine: exploring innerspace via spatial and temporal databases. In Advances in Spatial and Temporal Databases: 12th International Symposium, SSTD 2011, Minneapolis, MN, USA, August 24-26, 2011, Proceedings 12. Springer, 467–470.
- Palla et al. (2022) Giovanni Palla, David S Fischer, Aviv Regev, and Fabian J Theis. 2022. Spatial components of molecular tissue biology. Nature Biotechnology 40, 3 (2022), 308–318.
- Qi et al. (2017) Charles Ruizhongtai Qi, Li Yi, Hao Su, and Leonidas J Guibas. 2017. Pointnet++: Deep hierarchical feature learning on point sets in a metric space. Advances in neural information processing systems 30 (2017).
- Radford et al. (2021) Alec Radford, Jong Wook Kim, Chris Hallacy, Aditya Ramesh, Gabriel Goh, Sandhini Agarwal, Girish Sastry, Amanda Askell, Pamela Mishkin, Jack Clark, et al. 2021. Learning transferable visual models from natural language supervision. In International conference on machine learning. PMLR, 8748–8763.
- Regev et al. (2017) Aviv Regev, Sarah A Teichmann, Eric S Lander, Ido Amit, Christophe Benoist, Ewan Birney, Bernd Bodenmiller, Peter Campbell, Piero Carninci, Menna Clatworthy, et al. 2017. The human cell atlas. elife 6 (2017), e27041.
- Rood et al. (2019) Jennifer E Rood, Tim Stuart, Shila Ghazanfar, Tommaso Biancalani, Eyal Fisher, Andrew Butler, Anna Hupalowska, Leslie Gaffney, William Mauck, Gökçen Eraslan, et al. 2019. Toward a common coordinate framework for the human body. Cell 179, 7 (2019), 1455–1467.
- Rozenblatt-Rosen et al. (2017) Orit Rozenblatt-Rosen, Michael JT Stubbington, Aviv Regev, and Sarah A Teichmann. 2017. The Human Cell Atlas: from vision to reality. Nature 550, 7677 (2017), 451–453.
- Shekhar et al. (2011) Shashi Shekhar, Michael R Evans, James M Kang, and Pradeep Mohan. 2011. Identifying patterns in spatial information: A survey of methods. Wiley Interdisciplinary Reviews: Data Mining and Knowledge Discovery 1, 3 (2011), 193–214.
- Shekhar and Vold (2020) Shashi Shekhar and Pamela Vold. 2020. Spatial computing. Mit Press.
- Tan et al. (2020) Wei Chang Colin Tan, Sanjna Nilesh Nerurkar, Hai Yun Cai, Harry Ho Man Ng, Duoduo Wu, Yu Ting Felicia Wee, Jeffrey Chun Tatt Lim, Joe Yeong, and Tony Kiat Hon Lim. 2020. Overview of multiplex immunohistochemistry/immunofluorescence techniques in the era of cancer immunotherapy. Cancer Communications 40, 4 (2020), 135–153.
- Tang et al. (2017) Xun Tang, Emre Eftelioglu, Dev Oliver, and Shashi Shekhar. 2017. Significant Linear Hotspot Discovery. IEEE Trans. Big Data 3, 2 (2017), 140–153. https://doi.org/10.1109/TBDATA.2016.2631518
- Thomas and Ros (2005) Federico Thomas and Lluís Ros. 2005. Revisiting trilateration for robot localization. IEEE Transactions on robotics 21, 1 (2005), 93–101.
- Wang et al. (2019) Yue Wang, Yongbin Sun, Ziwei Liu, Sanjay E Sarma, Michael M Bronstein, and Justin M Solomon. 2019. Dynamic graph cnn for learning on point clouds. Acm Transactions On Graphics (tog) 38, 5 (2019), 1–12.
- Wikipedia (1987) Wikipedia. 1987. Inner space. https://en.wikipedia.org/wiki/Innerspace [Accessed: March 20, 2023].
- Wolfson (2018) Ouri Wolfson. 2018. Understanding the human brain via its spatio-temporal properties (vision paper). In Proceedings of the 26th ACM SIGSPATIAL International Conference on Advances in Geographic Information Systems. 85–88.
- Xie et al. (2017) Yiqun Xie, Emre Eftelioglu, Reem Y Ali, Xun Tang, Yan Li, Ruhi Doshi, and Shashi Shekhar. 2017. Transdisciplinary foundations of geospatial data science. ISPRS International Journal of Geo-Information 6, 12 (2017), 395.
- Xie and Shekhar (2019) Yiqun Xie and Shashi Shekhar. 2019. Significant DBSCAN towards Statistically Robust Clustering. In Proceedings of the 16th International Symposium on Spatial and Temporal Databases, SSTD 2019, Vienna, Austria, August 19-21, 2019, Walid G. Aref, Michela Bertolotto, Panagiotis Bouros, Christian S. Jensen, Ahmed R. Mahmood, Kjetil Nørvåg, Dimitris Sacharidis, and Mohamed Sarwat (Eds.). ACM, 31–40. https://doi.org/10.1145/3340964.3340968
- Yuan et al. (2020) Qiangqiang Yuan, Huanfeng Shen, Tongwen Li, Zhiwei Li, Shuwen Li, Yun Jiang, Hongzhang Xu, Weiwei Tan, Qianqian Yang, Jiwen Wang, et al. 2020. Deep learning in environmental remote sensing: Achievements and challenges. Remote Sensing of Environment 241 (2020), 111716.