Separation of Infrared and Bulk in Thermal QCD
![[Uncaptioned image]](/html/2305.09459/assets/chiqcd.png)
Abstract
New thermal phase of QCD, featuring scale invariance in the infrared (IR), was proposed to exist both in the pure-glue (Nf=0) and the “real-world” (Nf=2+1) settings. Among key aspects of the proposal is that the system in this IR phase separates into two independent components: the scale-invariant IR part and the non-invariant bulk. Such scenario requires non-analyticities in the theory and, in case of pure-glue QCD, they were found to arise via Anderson-like mobility edges in Dirac spectra (, ) manifested in dimension function . Here we present first evidence that this mechanism is also at work in “real-world QCD” (Nf=2+1 theory at physical quark masses and fm), supporting the existence of the proposed IR regime. Dimensional jump between zero-modes and lowest near-zero modes very close to unity ( vs ) was found.
1. Introduction: Starting with the pre-QCD times of Hagedorn Hagedorn (1965, 1971) and early lattice QCD calculations in the pure-glue setting McLerran and Svetitsky (1981); Kuti et al. (1981); Engels et al. (1981), the question of thermal transition in strongly-interacting matter has become one of the highly researched topics in nuclear and particle physics. Apart from well-motivated need to understand strong interactions, the interest in the issue was fueled, to a large extent, by the potential significance of its resolution to the physics of early universe.
Hagedorn in fact set the basic scenario, wherein the thermal transformation process in strong interactions boils down to a single “instability temperature” which, nowadays in QCD, is commonly referred as the critical temperature (). Due to the non-perturbative nature of the problem, lattice QCD became the workhorse for investigations in this area. Advances in lattice QCD techniques and computational resources led to a major conclusion, namely that true phase transition does not occur in “real-world” QCD. Rather, an analytic crossover takes place in the temperature range 150-200 MeV, with MeV for the case of chiral crossover Aoki et al. (2006).
Transitionless outlook meant a setback to QCD’s role in cosmology, but an important new twist appeared around the same time. Experiments at RHIC and LHC concluded that the state of strongly interacting matter with properties akin to near-perfect fluid exists in certain range of temperatures Arsene et al. (2005); Back et al. (2005); Adams et al. (2005); Adcox et al. (2005); Muller et al. (2012). Among other things, this invites questions about how can such an exotic state of matter arise without a true phase transition.
To this end, some of us presented evidence of an unusual change in QCD Dirac spectra at temperatures well above the chiral crossover Alexandru and Horváth (2019): the anomalous accumulation of infrared (IR) Dirac modes, first seen in high- phase of pure-glue QCD Edwards et al. (2000) and shown to persist into the continuum and infinite-volume limits Alexandru and Horváth (2015), dramatically increases and starts to exhibit signs of scale-invariant behavior. This sharp change was found in both the pure-glue and real-world ( = 2+1 at physical masses) QCD Alexandru and Horváth (2019). It was proposed that, at the associated temperature , thermal state of strong interactions reconfigures by forming two independent components separated by new scale : the bulk governing distances and the IR part describing via scale-invariant glue Alexandru and Horváth (2019). In pure-glue case, coincides with of Polyakov-line phase transition. In real-world QCD, it was also proposed to be a true phase transformation occurring at MeV Alexandru and Horváth (2019). Its presence may clarify the physics of near-perfect fluid and enhance the role of “QCD transition” in cosmology.
The 2-component scenario was first evoked by a clean IR-bulk separation in Dirac spectra (bimodality of mode density ), which is very suggestive of decoupling Alexandru and Horváth (2019). But more detail was needed. Indeed, how would the scale invariant and non-invariant physics coexist and would it imply a non-analytic running of the coupling constant at ? Concrete proposal was presented in Refs. Alexandru and Horváth (2021, 2022), ascribing the origin of non-analyticity to two Anderson-like mobility edges (critical points) in Dirac spectra. The first one at was found previously Garcia-Garcia and Osborn (2006, 2007); Kovacs and Pittler (2010); Giordano et al. (2014); Ujfalusi et al. (2015), and its purpose here is to shield the IR component from the influence of the bulk. Indeed, bulk fluctuations (including UV) will not affect the IR component owing to the intervening non-analyticity. The second mobility edge was found recently Alexandru and Horváth (2022), and is strictly IR (). Its role is to facilitate the long-range physics of the IR component.
A suitable tool to express this scenario is the function , namely the spatial IR dimension of Dirac modes at eigenvalue Alexandru and Horváth (2021). Indeed, is a proper dimensional construct to probe the infrared Horváth et al. (2023). The key conceptual step granting its uses in quantum theory is the assignment of a meaningful measure-based dimension to a region effectively selected by probabilities. This has recently become possible via effective number theory Horváth and Mendris (2020); Horváth (2021); Horváth and Mendris (2019): replacing ordinary counting in definition of box-counting dimension for fixed sets by effective counting for probability distributions leads to such measure-based dimension Horváth et al. (2023). For Dirac modes in thermal QCD the prescription is as follows. In lattice-regularized Euclidean setup the number of sites (UV cutoff , IR cutoff , temperature ) grows as at fixed , conveying that IR dimension of space is . But Dirac eigenmode entails probabilities , , and sites have to be counted effectively in order to quantify the volume actually extends into, namely Horváth and Mendris (2020)
| (1) |
The IR scaling of QCD-averaged effective volume at given then determines at UV cutoff , namely Alexandru and Horváth (2021); Horváth et al. (2023)
| (2) |
Using the overlap Dirac operator Neuberger (1998) due to its superior chiral and topological properties, an unusual was found in IR phase of pure-glue QCD Alexandru and Horváth (2019). Indeed, the function is non-analytic at both and , with spectral region of low- () modes between them Alexandru and Horváth (2021). Moreover, in contrast to exact zero modes, which are , the lowest near-zero modes are close to other topological value . Such jump at is surprising since the proposed origin of anomalous IR mode accumulation is the conventional mixing of topological lumps Edwards et al. (2000); Vig and Kovacs (2021) which, in absence of additional (unknown) effects, leads to in both cases. The jump could thus offer valuable clues on IR phase dynamics, and could be used to detect the transition into IR phase.
In this work, we make a key step toward this proposal becoming a reality: we present evidence supporting the existence of the above unusual pattern also in “real-world QCD”. In particular, in theory at physical quark masses (see setup below) we obtain
| (3) |
This finding lends support to topological origin of exotic IR-phase dynamics Alexandru and Horváth (2021, 2022) (see also Edwards et al. (2000); Vig and Kovacs (2021); Cardinali et al. (2021)), and significantly strenghtens its connection to non-analyticities of Anderson-like origin Alexandru and Horváth (2022). Regarding the latter, the observed topology aspects may have close ties to critical Anderson dynamics Horváth and Markoš (2022a, 2023, b) which is entirely unexpected.
2. Simulation Setup: We lattice-regularize QCD using tadpole-improved clover fermion action (1-step stout link smearing with parameter 0.125) and tadpole-improved Symanzik gauge action at and MeV. At temperature MeV, numerous spatial volumes (up to fm) were simulated by CLQCD collaboration (see Table 1), allowing for reliable calculations. More detailed ensemble description is given in ref . We note in passing that ensembles with similar quark and gauge actions were already used in previous zero-temperature calculations Zhang et al. (2021); Liu et al. (2022); Xing et al. (2022); Liu et al. (2023).
| (fm) | (MeV) | (MeV) | ||
|---|---|---|---|---|
| 0.105 | 135 | 24/28/32/40/48/64/96 | 8 | 234 |
Glue fields of this theory will be studied via their effect on the overlap Dirac operator . We construct using the original square-root prescription Neuberger (1998) at with 1-step HYP smearing of . To determine the low-lying eigensystem, we select the chiral sector containing zero mode(s), calculate the eigenvectors of in it using Arnoldi method, and then construct non-zero modes Sorensen (1992); Lehoucq and Sorensen (1996); Giusti et al. (2003); Alexandru et al. (2011); ref . Transformation Chiu and Zenkin (1999) yields purely imaginary eigenvalues () and the associated spectral density is . Further technical details can be found in the supplemenatary material ref .
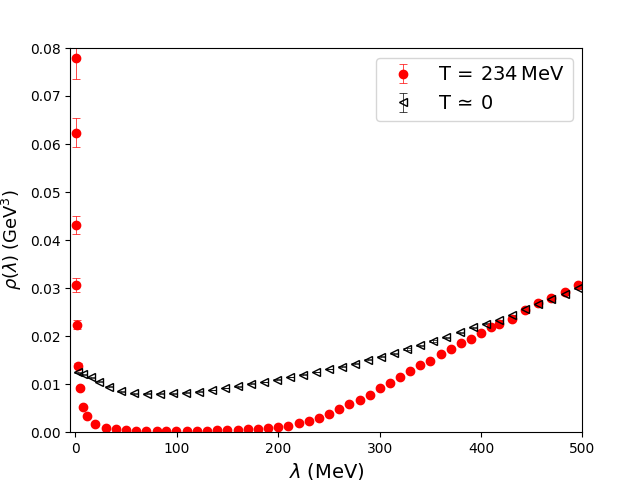
Eigenmodes with up to MeV were computed for all in Table 1. Densities were renormalized in at 2 GeV, using obtained by interpolating the results at 11 UV cutoffs He et al. (2022). We wish to focus on a temperature in the range MeV, where the system was originally predicted to reach the IR phase at certain . In Fig. 1 we show at MeV. The striking bimodal structure exhibits features previously associated with IR phase Alexandru and Horváth (2019), including a fully-formed region of severe depletion. We also include the result from identical simulation setup on lattice and obtained using stochastic estimator Cossu et al. (2016). The difference is indeed quite remarkable. Note that, for large enough , the two densities come together which is expected for all .
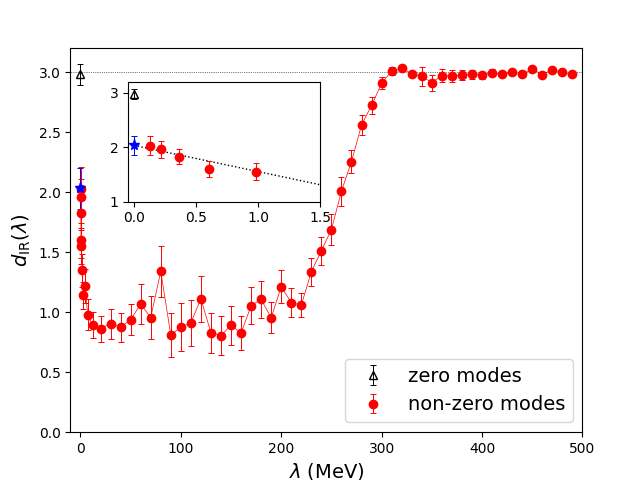
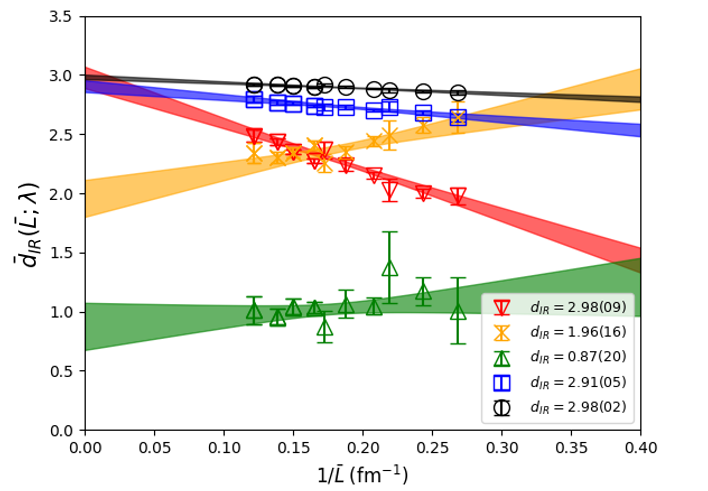
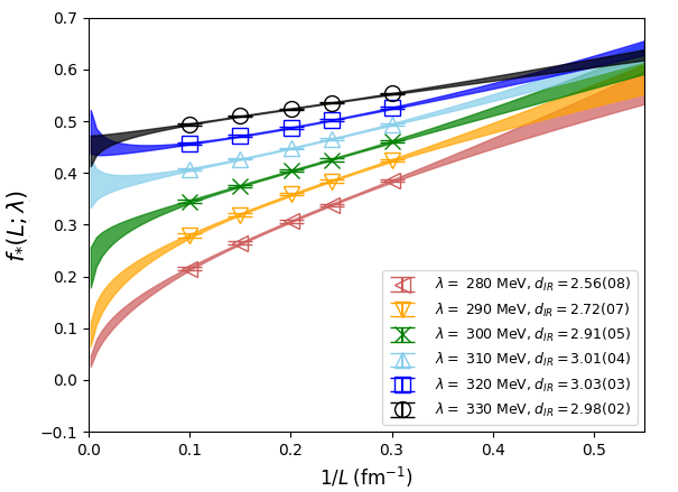
3. The Results: We now examine in detail whether the unusual in IR phase of pure-glue QCD Alexandru and Horváth (2021) is also present in real-world QCD at MeV. To that end, we utilize and extend the techniques of early studies. A useful concept is the “finite-volume” , namely Alexandru and Horváth (2021)
| (4) |
since then independently of . Estimating the limit from linear extrapolations in work well in Anderson models, at least for extended states and at criticality Horváth and Markoš (2022a). Here we utilize this, and point out that the procedure is equivalent to direct fitting of to the form ref , which is technically more convenient. Using the data from our five largest systems in such fits, we obtained shown in Fig. 2. Despite some differences (see below), its behavior is strikingly similar to pure-glue case (Fig. 1 of Ref. Alexandru and Horváth (2021)).
Important commonality is the discontinuity feature at , suggesting that exact zero-modes () differ from lowest near-zero modes () in a robust qualitative manner. This is made explicit by the inset of Fig. 2 focusing on very deep IR, and yielding linearly extrapolated , which is more than smaller than 3. Explaining this difference in terms of the underlying IR glue may prove important for deciphering the nature of IR phase.
Like in pure-glue case, we find a clear low- () plateau, here in the range of about MeV. This roughly coincides with the region of strongly suppressed (Fig. 1 vs Fig. 2). Dimensional structure of plateaus will be further clarified using the multidimensionality technique of Ref. Horváth and Markoš (2022b). Such studies are forthcoming.
The onset of rise toward dimension 3 past MeV confirms the viability of our scenario with mobility edges and . However, the discontinuity of at presumed is not apparent in our data, contrary to both the pure-glue case Alexandru and Horváth (2021) and the situation in Anderson models Horváth and Markoš (2022a). Resolution of this difference may provide an additional new insight into the IR-phase dynamics.
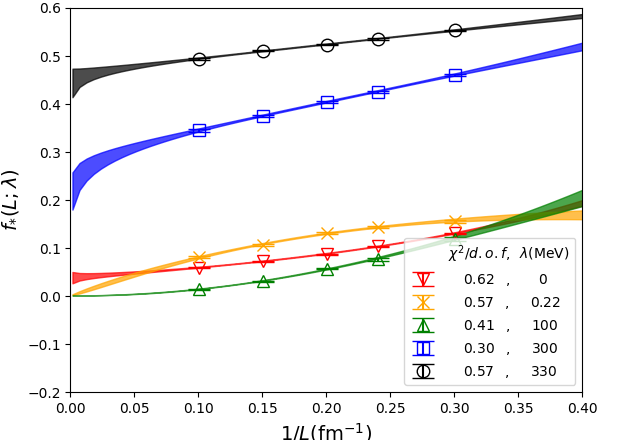
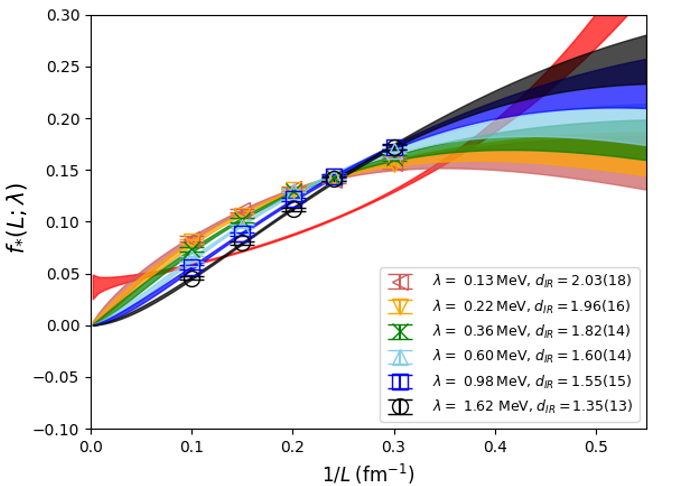
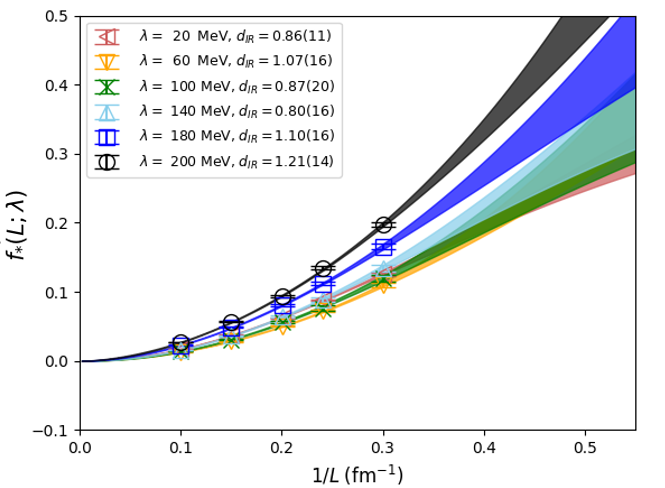
To illustrate the quality of scaling in various -regimes shown in Fig. 2, we plot in Fig. 3 the fraction of volume occupied by the effective support of the state, namely . Since is used to extract , we have and these fits are shown in Fig. 3. The displayed /dof for modes in different regimes do indeed confirm very good scaling behavior. Note how functions in Fig. 3 visually separate the bulk modes and near-bulk modes from IR modes. Indeed, although zero-modes are , and hence occupy a finite fraction of volume in thermodynamic limit (), its magnitude is much smaller than that of typical bulk modes. At the same time, for modes of IR component the fraction vanishes ().
Fig. 3 reveals that the lowest near-zero modes we studied (MeV, ) have larger at studied volumes than those of zero modes (, . But given their , this order has to reverse at sufficiently large volume. We can read off the graphs in Fig. 3 that this happens at fm. Such deep IR thresholds simply do not appear in other QCD regimes. Only at larger will modes at MeV become “sparser” than zero modes. Note that the qualitative difference between zero and near-zero modes is expressed here by the opposite convexity properties of their .
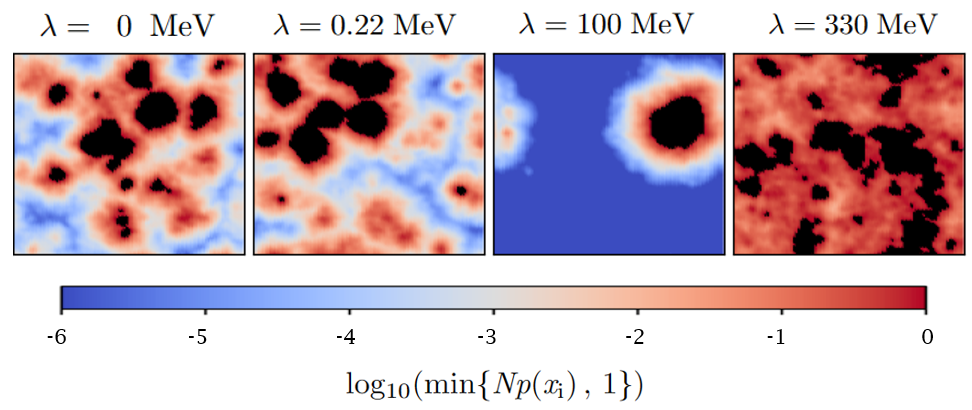
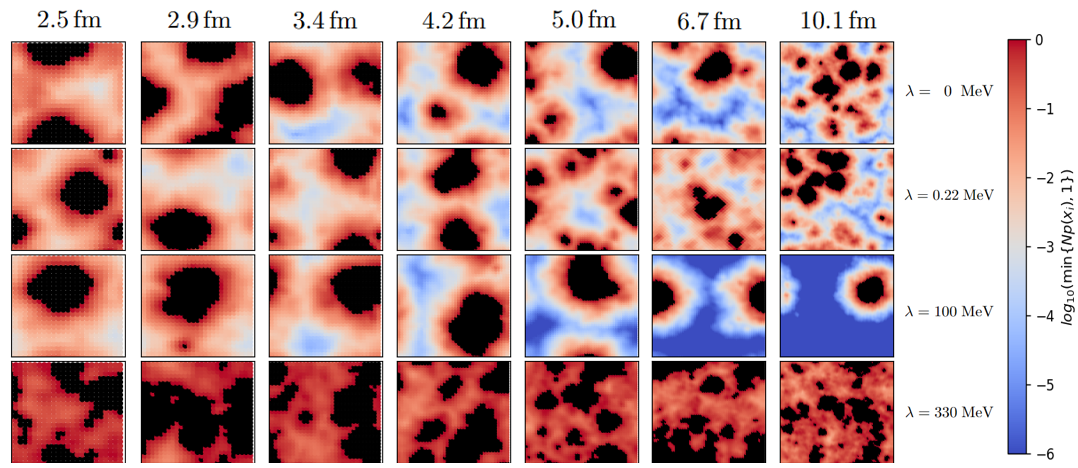
Finally, we wish to gain some visual insight into the spatial geometry of modes. In definition (1) of , uniform probability enters as a reference value: points with are guaranteed to be in effective support, and we refer to them as “core”. We wish to set up a sea-level representation that visualizes it sharply. Plotting , namely the contribution of to effective count, accomplishes that. In Fig. 4 we color-code this input (on a logarithmic scale) and show its typical behavior on a plane containing the global probability maximum. The black regions mark the core. The panels represent different -regimes on the same glue background. The bulk mode at MeV (right) resembles to some extent modes at low temperatures. Indeed, its core spreads out contiguously over large distances and its granularity (composition from distinct lumps) is not very obvious. To the contrary, the plateau mode (MeV) is usually dominated by a well-formed lump as shown. The near-zeromodes (MeV) maintain the granularity, but involve multiple lumpy features forming a larger spatial structure. The zero-modes (left) at this volume are in fact quite similar but, due to vs difference, will become infinitely more “space-filling” in thermodynamic limit.
Additional results are described in our supplement ref .
4. Summary and Discussion: Remarkable property of QCD IR phase Alexandru and Horváth (2019) is that it requires the presence of non-analyticities not only at the transition point , but at any temperature within the phase. It was proposed and verified Alexandru and Horváth (2021, 2022) that in pure-glue QCD the system arranges for this by reconfiguring itself into two independent components (IR & bulk), sharply separated in Dirac spectrum. The needed non-analyticity enters via Anderson-like mobility edges and , encoded by dimension function . Our present results suggest that key elements of this scenario also materialize in “real-world” QCD. Thus, in certain regards, thermal state in IR phase of strong interactions resembles the Tisza-Landau two-fluid model of liquid helium. The proposed 2-component nature of thermal state may in fact be the most essential attribute of IR phase.
We wish to point out certain aspects of our results. (i) The computed dimension of near-zero modes is in close vicinity of “topological” value 2, thus inviting a systematic inquiry into its possible origin in certain topological feature of underlying glue fields. At the same time, recent findings of possible topological behavior in 3d Anderson model Horváth and Markoš (2022b) also involve dimension but no glue fields. (ii) In the existing QCD data there is no clear evidence yet for critical value , which was suggested to be a generic feature of Anderson models Horváth and Markoš (2022a). (iii) Unlike in the case of , in the vicinity of we did not find an obviuous dimension jump. This differs from situation in pure-glue QCD Alexandru and Horváth (2021) and from that at critical points of Anderson models Horváth and Markoš (2022a). Taken together, points (i-iii) constitute an intriguing complex puzzle to be solved by future studies. Indeed, the satisfactory understanding of Anderson-like features in QCD require the resolution of these issues. This resolution will involve control over the usual lattice QCD systematics, which is important given that some of these effects are possibly enhanced in dynamical simulations Zhao et al. (2023).
Recently a number of lattice QCD papers focused on the same temperature range as the one investigated here and in other recent IR phase studies (see e.g. Dick et al. (2015); Ding et al. (2020); Aoki et al. (2021); Kaczmarek et al. (2021); Kotov et al. (2021); Chen et al. (2022); Kaczmarek et al. (2023)). Their physics goals are mostly different and tend to involve the chiral limit, such as in studies of U(1) problem or chiral phase transition. Other related developments include an approximate color-spin symmetry Rohrhofer et al. (2019); Glozman et al. (2022), as well as recent Refs. Liu (2023); Athenodorou et al. (2022); Kehr et al. (2023). Conversely, the present CLQCD data could be used to study these other problems.
Acknowledgments
We thank the CLQCD collaborations for providing their gauge configurations, and also to Ting-Wai Chiu, Heng-Tong Ding and Jian Liang for valuable discussions. This work is supported in part by the Strategic Priority Research Program of Chinese Academy of Sciences, Grant No. XDB34030303 and XDPB15, NSFC grants No. 12293062, 12293065 and 12047503, and also a NSFC-DFG joint grant under Grant No. 12061131006 and SCHA 458/22. This work is also supported in part by the U.S. DOE Grant No. DE-SC0013065, DOE Grant No. DE-FG02-95ER40907, and DOE Grant No. DE-AC05-06OR23177 which is within the framework of the TMD Topical Collaboration. This publication received funding from the French National Research Agency under the contract ANR-20-CE31-0016. The numerical calculation were carried out on the ORISE Supercomputer through HIP programming model Bi et al. (2020), and HPC Cluster of ITP-CAS. This research used resources of the Oak Ridge Leadership Computing Facility at the Oak Ridge National Laboratory, which is supported by the Office of Science of the U.S. Department of Energy under Contract No. DE-AC05-00OR22725. This work used Stampede time under the Extreme Science and Engineering Discovery Environment (XSEDE), which is supported by National Science Foundation Grant No. ACI-1053575. We also thank the National Energy Research Scientific Computing Center (NERSC) for providing HPC resources that have contributed to the research results reported within this paper. We acknowledge the facilities of the USQCD Collaboration used for this research in part, which are funded by the Office of Science of the U.S. Department of Energy.
References
- Hagedorn (1965) R. Hagedorn, Nuovo Cim. Suppl. 3, 147 (1965).
- Hagedorn (1971) R. Hagedorn, CERN report 71-12 (1971), 10.5170/CERN-1971-012.
- McLerran and Svetitsky (1981) L. D. McLerran and B. Svetitsky, Phys. Lett. B 98, 195 (1981).
- Kuti et al. (1981) J. Kuti, J. Polonyi, and K. Szlachanyi, Phys. Lett. B 98, 199 (1981).
- Engels et al. (1981) J. Engels, F. Karsch, H. Satz, and I. Montvay, Phys. Lett. B 101, 89 (1981).
- Aoki et al. (2006) Y. Aoki, G. Endrodi, Z. Fodor, S. Katz, and K. Szabo, Nature 443, 675 (2006), arXiv:hep-lat/0611014 [hep-lat] .
- Arsene et al. (2005) I. Arsene et al. (BRAHMS), Nucl. Phys. A757, 1 (2005), arXiv:nucl-ex/0410020 [nucl-ex] .
- Back et al. (2005) B. B. Back et al., Nucl. Phys. A757, 28 (2005).
- Adams et al. (2005) J. Adams et al. (STAR), Nucl. Phys. A757, 102 (2005), arXiv:nucl-ex/0501009 [nucl-ex] .
- Adcox et al. (2005) K. Adcox et al. (PHENIX), Nucl. Phys. A757, 184 (2005), arXiv:nucl-ex/0410003 [nucl-ex] .
- Muller et al. (2012) B. Muller, J. Schukraft, and B. Wyslouch, Ann. Rev. Nucl. Part. Sci. 62, 361 (2012), arXiv:1202.3233 [hep-ex] .
- Alexandru and Horváth (2019) A. Alexandru and I. Horváth, Phys. Rev. D 100, 094507 (2019), arXiv:1906.08047 [hep-lat] .
- Edwards et al. (2000) R. G. Edwards, U. M. Heller, J. E. Kiskis, and R. Narayanan, Phys.Rev. D61, 074504 (2000), arXiv:hep-lat/9910041 [hep-lat] .
- Alexandru and Horváth (2015) A. Alexandru and I. Horváth, Phys. Rev. D92, 045038 (2015), arXiv:1502.07732 [hep-lat] .
- Alexandru and Horváth (2021) A. Alexandru and I. Horváth, Phys. Rev. Lett. 127, 052303 (2021), arXiv:2103.05607 [hep-lat] .
- Alexandru and Horváth (2022) A. Alexandru and I. Horváth, Phys. Lett. B 833, 137370 (2022), arXiv:2110.04833 [hep-lat] .
- Garcia-Garcia and Osborn (2006) A. M. Garcia-Garcia and J. C. Osborn, Nucl. Phys. A 770, 141 (2006), arXiv:hep-lat/0512025 .
- Garcia-Garcia and Osborn (2007) A. M. Garcia-Garcia and J. C. Osborn, Phys. Rev. D 75, 034503 (2007), arXiv:hep-lat/0611019 .
- Kovacs and Pittler (2010) T. G. Kovacs and F. Pittler, Phys. Rev. Lett. 105, 192001 (2010), arXiv:1006.1205 [hep-lat] .
- Giordano et al. (2014) M. Giordano, T. G. Kovacs, and F. Pittler, Phys. Rev. Lett. 112, 102002 (2014), arXiv:1312.1179 [hep-lat] .
- Ujfalusi et al. (2015) L. Ujfalusi, M. Giordano, F. Pittler, T. G. Kovács, and I. Varga, Phys. Rev. D 92, 094513 (2015), arXiv:1507.02162 [cond-mat.dis-nn] .
- Horváth et al. (2023) I. Horváth, P. Markoš, and R. Mendris, Entropy 25, 482 (2023), arXiv:2205.11520 [hep-lat] .
- Horváth and Mendris (2020) I. Horváth and R. Mendris, Entropy 22, 1273 (2020), arXiv:1807.03995 [quant-ph] .
- Horváth (2021) I. Horváth, Quantum Rep. 3, 534 (2021), arXiv:1809.07249 [quant-ph] .
- Horváth and Mendris (2019) I. Horváth and R. Mendris, MDPI Proc. 13, 8 (2019), arXiv:1907.01606 [quant-ph] .
- Neuberger (1998) H. Neuberger, Phys. Lett. B417, 141 (1998), arXiv:hep-lat/9707022 [hep-lat] .
- Vig and Kovacs (2021) R. A. Vig and T. G. Kovacs, Phys. Rev. D 103, 114510 (2021), arXiv:2101.01498 [hep-lat] .
- Cardinali et al. (2021) M. Cardinali, M. D’Elia, and A. Pasqui, (2021), arXiv:2107.02745 [hep-lat] .
- Horváth and Markoš (2022a) I. Horváth and P. Markoš, Phys. Rev. Lett. 129, 106601 (2022a), arXiv:2110.11266 [cond-mat.dis-nn] .
- Horváth and Markoš (2023) I. Horváth and P. Markoš, Phys. Lett. A 467, 128735 (2023), arXiv:2207.13569 [cond-mat.dis-nn] .
- Horváth and Markoš (2022b) I. Horváth and P. Markoš, (2022b), arXiv:2212.09806 [cond-mat.dis-nn] .
- (32) Supplementary materials .
- Zhang et al. (2021) Q.-A. Zhang, J. Hua, F. Huang, R. Li, Y. Li, C.-D. Lu, P. Sun, W. Sun, W. Wang, and Y.-B. Yang, (2021), arXiv:2103.07064 [hep-lat] .
- Liu et al. (2022) H. Liu, J. He, L. Liu, P. Sun, W. Wang, Y.-B. Yang, and Q.-A. Zhang, (2022), arXiv:2207.00183 [hep-lat] .
- Xing et al. (2022) H. Xing, J. Liang, L. Liu, P. Sun, and Y.-B. Yang, (2022), arXiv:2210.08555 [hep-lat] .
- Liu et al. (2023) H. Liu, L. Liu, P. Sun, W. Sun, J.-X. Tan, W. Wang, Y.-B. Yang, and Q.-A. Zhang, (2023), arXiv:2303.17865 [hep-lat] .
- Sorensen (1992) D. C. Sorensen, SIAM J. on Matrix Analysis and Applications 13, 357 (1992).
- Lehoucq and Sorensen (1996) R. B. Lehoucq and D. C. Sorensen, SIAM J. Matrix Anal. Appl. 17, 789 (1996).
- Giusti et al. (2003) L. Giusti, C. Hoelbling, M. Luscher, and H. Wittig, Comput. Phys. Commun. 153, 31 (2003), arXiv:hep-lat/0212012 [hep-lat] .
- Alexandru et al. (2011) A. Alexandru, M. Lujan, C. Pelissier, B. Gamari, and F. X. Lee, in Proceedings, SAAHPC’11 (2011) pp. 123–130, arXiv:1106.4964 [hep-lat] .
- Chiu and Zenkin (1999) T.-W. Chiu and S. V. Zenkin, Phys. Rev. D59, 074501 (1999), arXiv:hep-lat/9806019 [hep-lat] .
- He et al. (2022) F. He, Y.-J. Bi, T. Draper, K.-F. Liu, Z. Liu, and Y.-B. Yang (QCD), Phys. Rev. D 106, 114506 (2022), arXiv:2204.09246 [hep-lat] .
- Cossu et al. (2016) G. Cossu, H. Fukaya, S. Hashimoto, T. Kaneko, and J.-I. Noaki, PTEP 2016, 093B06 (2016), arXiv:1607.01099 [hep-lat] .
- Zhao et al. (2023) D.-J. Zhao, G. Wang, F. He, L. Jin, P. Sun, Y.-B. Yang, and K. Zhang (QCD), Phys. Rev. D 107, L091501 (2023), arXiv:2207.14132 [hep-lat] .
- Dick et al. (2015) V. Dick, F. Karsch, E. Laermann, S. Mukherjee, and S. Sharma, Phys. Rev. D91, 094504 (2015).
- Ding et al. (2020) H. T. Ding, S. T. Li, S. Mukherjee, A. Tomiya, X. D. Wang, and Y. Zhang, (2020), arXiv:2010.14836 [hep-lat] .
- Aoki et al. (2021) S. Aoki, Y. Aoki, G. Cossu, H. Fukaya, S. Hashimoto, T. Kaneko, C. Rohrhofer, and K. Suzuki (JLQCD), Phys. Rev. D 103, 074506 (2021), arXiv:2011.01499 [hep-lat] .
- Kaczmarek et al. (2021) O. Kaczmarek, L. Mazur, and S. Sharma, Phys. Rev. D 104, 094518 (2021).
- Kotov et al. (2021) A. Y. Kotov, M. P. Lombardo, and A. Trunin, Physics Letters B 823, 136749 (2021).
- Chen et al. (2022) Y.-C. Chen, T.-W. Chiu, and T.-H. Hsieh (TWQCD), Phys. Rev. D 106, 074501 (2022), arXiv:2204.01556 [hep-lat] .
- Kaczmarek et al. (2023) O. Kaczmarek, R. Shanker, and S. Sharma, (2023), arXiv:2301.11610 [hep-lat] .
- Rohrhofer et al. (2019) C. Rohrhofer, Y. Aoki, G. Cossu, H. Fukaya, C. Gattringer, L. Ya. Glozman, S. Hashimoto, C. B. Lang, and S. Prelovsek, Phys. Rev. D100, 014502 (2019).
- Glozman et al. (2022) L. Y. Glozman, O. Philipsen, and R. D. Pisarski, Eur. Phys. J. A 58, 247 (2022), arXiv:2204.05083 [hep-ph] .
- Liu (2023) K.-F. Liu, (2023), arXiv:2302.11600 [hep-ph] .
- Athenodorou et al. (2022) A. Athenodorou, C. Bonanno, C. Bonati, G. Clemente, F. D’Angelo, M. D’Elia, L. Maio, G. Martinelli, F. Sanfilippo, and A. Todaro, JHEP 10, 197 (2022), arXiv:2208.08921 [hep-lat] .
- Kehr et al. (2023) R. Kehr, D. Smith, and L. von Smekal, (2023), arXiv:2304.13617 [hep-lat] .
- Bi et al. (2020) Y.-J. Bi, Y. Xiao, W.-Y. Guo, M. Gong, P. Sun, S. Xu, and Y.-B. Yang, Proceedings, Lattice 2019, PoS LATTICE2019, 286 (2020), arXiv:2001.05706 [hep-lat] .
I Supplemental Materials
I.1 Visualization of Spatial Distributions
In the present subsection we wish to extend our visualization of mode distributions in various -regimes shown in Fig. 4 of the manuscript. In particular, Fig. 5 shows examples of modes at the same four values of , but at all IR cutoffs (sizes of the system) considered in this work. Note that 0, 0.22 and 100 MeV belong to the IR part of the spectrum, while 330 MeV is in near-bottom part of the bulk.
Interesting aspect of observing the typical geometry at fixed for increasing is an evolution in degree of granularity. Indeed, note that for the plateau mode (MeV), increasing confirms the picture of a single solid lump present in the volume. On the other hand, for zero-modes and near-zero modes, the apparent (visually observable) degree of granularity increases with increasing , reflecting that their effective supports keeps spreading out in the volume. In fact, all qualitative aspects we observe agree with metal-to-critical picture of transition to IR phase, put forward in Ref. Alexandru and Horváth (2022). The associated details will be worked out in dedicated follow-up publications.
I.2 Accuracy of Overlap Eigenmodes
In this section we focus on the accuracy of the low-lying eigenvectors used in this study. For efficiency reasons, we compute the low-lying eigenvalues and eigenvectors of in the chiral sector which includes the exact zero mode. The eigenvalues and eigenvectors of are simply related to the eigenvectors of : non-zero modes of come in pairs, , and they span an invariant two-dimensional space for with and for near zero-modes . When computing the spectrum of , zero modes appear as Ritz pairs with eigenvalues of the order of , the precision of the sign-function approximation used to implement . When we have near-zero modes with , it is impossible to distinguish them from zero modes. Using a polynomial approximation for the sign functions, the best precision we are able to achieve is , and consequently we can only confidently resolve eigenvalues with , which in physical units correspond to . For the volumes used in this study, the near-zero eigenmodes satisfy this condition.
Another concern is the mixing between nearly-degenerate eigenvectors. For eigenvector observables (like ) that are smooth as a function of , this is less of a concern. However, at discontinuities mixing could introduce systematic effects. This could potentially be a problem at since the zero modes and near-zero modes behave differently. We argue here that this is not the case.
To see this, consider two eigenvectors of the projected operator with and . A mixed vector has a Ritz “eigenvalue” . The residue for this vector is is going to be . For our case we take and the near-zero have and our residues, even in the worst case, are . This implies that the mixing angle is at most . Given that varies slowly (the difference between zero modes and near-zero modes is less than two), this mixing will have negligible effect given our statistical errors.
I.3 Fitting of Effective Fractions
Our procedure to extract assumes an approximately linear (in ) approach of “finite-volume” dimension in Eq. (4) to its limit. This was suggested by Ref. Horváth and Markoš (2022a) in the context of Anderson models. One can easily check that this is equivalent to direct fits of to the form and for effective volume fraction . Fits shown in the left panel of Fig. 6 support the validity of our approach.
Here we wish to check the nature of finite- correction more directly. Given the above scaling form, -dependence of IR dimension can be expressed as
| (5) |
Introduction of variable thus makes it possible to combine results from all pairs of distinct lattices and follow their trends. Indeed, according to the above, value from each pair should fall on an indicated straight line, at least near . To check this, we show in the left plot of Fig. 6 our data for five largest volumes at selected values of , and in the right plot the associated functions . Note that there are 10 data points for each in the latter case since this is the number of possible lattice pairs. Displayed fits are indeed consistent with linear nature of near . The qualitative difference between exact zero modes and lowest near-zero modes is expressed in the right plot by the crossed lines representing and MeV. Their finite-volume corrections are in fact of opposite sign.
We also provide the data for more values of in Fig. 7. As shown in the left panel, the becomes higher when is smaller, and thus the corresponding is also larger. The tendency converges at 0.2 MeV (orange band), which corresponds to and is consistent with the 0.13 MeV case (dark red band) within the uncertainty. However, this limit is significantly different from as illustrated by the red band. Thus, and also will be discontinued at .
In contrast, the middle panel of Fig. 7 shows that changes smoothly with large for MeV, corresponding to within 2. The changes on is also smooth in the range of MeV where converges to 3 with increasing , as in the right panel. Therefore the discontinuation of would only occurs at , given our statistical precision at fm and =234 MeV.
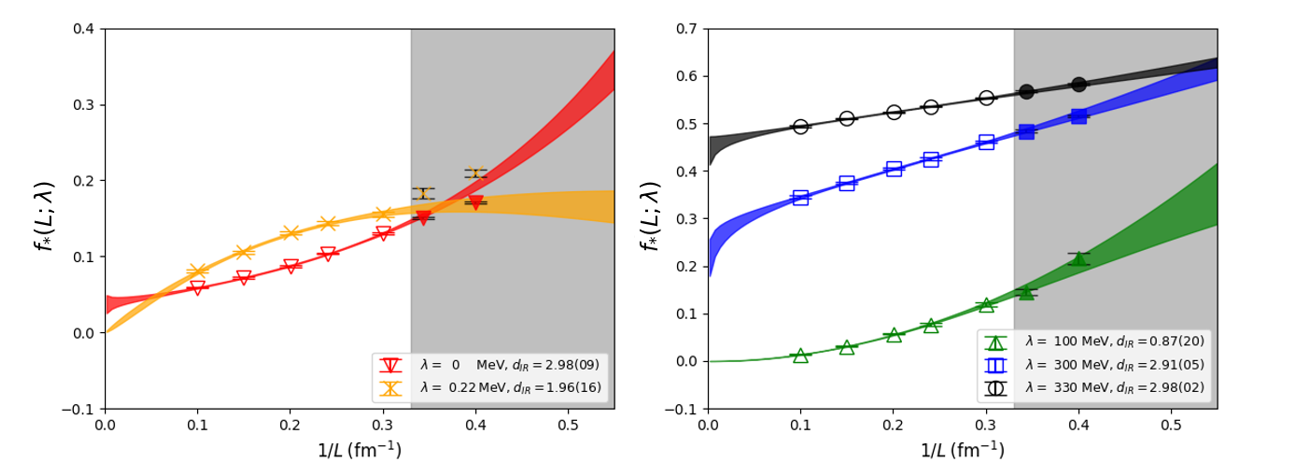
Finally, we give a justification for using the five largest lattices in our fits i.e. systems with fm. To that end, we show in Fig. 8 functions for all simulated volumes, together with previously shown fits. Shaded areas mark the volumes excluded from these fits. One can see that in case of zero modes and near-zero modes (left plot), the systems in shaded region do not follow the fit curves, and were thus excluded from fits in all spectral regions.