Influence of amorphous phase on coercivity in \ceSmCo_5-Cu nanocomposites
Abstract
Severe plastic deformation of powder blends consisting of \ceSmCo_5-Cu results in magnetically hardened nanocomposite bulk materials. The microstructure is continuously refined with increasing torsional deformation, yet, coercivity saturates at a certain level of strain. Transmission electron microscopy (TEM) investigation of the microstructure reveals a partial amorphization of the \ceSmCo_5 phase due to high-pressure torsion by 20 applied rotations. In this amorphous matrix nanocrystals are embedded. The effect of these experimentally observed microstructural features on the magnetic properties are investigated by micromagnetic simulations, which show that an increasing volume fraction of nanocrystals is beneficial for higher coercivities. For a fixed volume fraction of nanocrystals the simulations reveal an increasing coercivity with decreasing the size of the nanocrystals due to increasing number of interfaces acting as pinning sites. Furthermore, our micromagnetic simulations disclose the mechanisms of the saturation and decline of magnetic hardening due to the strain induced by high-pressure torsion. The calculated coercivity fits very well to the experimentally observed coercivity of . The knowledge can also be used to develop and provide optimization strategies from the microstructure perspective.
keywords:
\ceSmCo_5-Cu nanocomposites; severe plastic deformation, high-pressure torsion, micromagnetic simulation, amorphous \ceSmCo_5As the demand for renewable energy sources increases, the demand for high-performance permanent magnets is also rising [1]. In order to fulfill the requirements for suitable hard magnetic materials, good intrinsic magnetic properties need to be combined with optimized extrinsic magnetic properties, notably the remanent magnetization and the coercivity . Therefore, the micro- or nanostructure need to be adjusted accordingly. The conventional processing techniques for permanent magnets are based on a powder-metallurgical sintering route [2]. It has been shown that the coercivity of such magnets usually does not exceed of the theoretical prediction of ( as the 1st magnetocrystalline uniaxial anisotropy constant, as the vacuum permeability, and as the saturated magnetization) given by the Stoner-Wohlfarth model for a magnetic field applied along the easy direction [3, 2]. Hence, it is challenging to develop a technology to adjust the nano- or microstructure of bulk magnetic materials.
Severe plastic deformation by high pressure torsion (HPT) being applied to powder blends has recently been shown as a promising approach for the production of textured nanocomposite hard magnetic materials [4, 5, 6, 7]. Applying the HPT process to powder blends allows the free selection of the magnetic phase and the grain boundary phase, without limitation of phase formations as in the case of the powder-metallurgical sintering route. In addition, HPT enables the adjustment of the microstructure by parameter variation such as the applied strain, pressure and temperature [4, 5, 7]. However, examination the microstructural effects on the magnetization reversal behavior on small length scales, is very difficult to access experimentally.
Recently, micromagnetic modeling has been very successful in simulating magnetization dynamics under various stimuli such as magnetic, elastic, and thermal fields. It has been widely employed in examining the role of microstructural features on magnetic reversal mechanisms, that is domain nucleation and domain wall pinning [8, 9]. Up to date, micromagnetic simulations have been successfully performed on various microstructures of permanent magnets, notably, the nanoscopic granular [10, 11, 12] and cellular structures [9], in which various structural features, such as the grain shape [8, 13, 14], aspect ratio [15], and misalignment [10] have been examined and discussed. However, the microstructural evolution of nanocomposites, produced by severe plastic deformation via HPT, has been rarely modeled. Here we will show that with the help of our micromagnetic simulations using the experimentally observed microstructure, we can explain the increase and subsequent decrease of the coercivity in HPT processed \ceSmCo_5-Cu powder blends.
In this work, the nanocomposite of \ceSmCo_5 and Cu was produced by high-pressure torsion of a powder blend consisting of 80 wt.% intermetallic fine-grained powder of \ceSmCo_5 (Alfa Aesar) and 20 wt.% of Cu powder (99.9 %, Alfa Aesar). First the powder was precompacted by HPT by the aid of a Cu-ring, placed on the lower anvil. For this the powder was filled into the Cu-ring and compacted at room temperature at a nominal pressure of 4.5 by ten oscillations of ±5° each. In a second HPT step the consolidated discs with a diameter of 10 and an initial height of 1.4 were deformed by 1, 20 and 100 rotations, respectively, with a rate of 2 rpm at a nominal pressure of 7.6 .
For microstructural analyses the cross section of the discs were investigated using a high-resolution scanning electron microscope (TESCAN Mira 3) by backscattered electrons (BSE). A line interception method was applied for quantitative evaluation of the \ceSmCo_5-particle size following the same approach as described in [4]. In a region showing strong refinement of the microstructure, TEM analyses were performed on the sample subjected to 20 rotations on a JEM 2100F TEM operated at 200 . The magnetic hysteresis curve was measured in a magnetic field up to ±5 applied along the axial direction (height of the disc) by a Physical Property Measurement System (PPMS, Quantum Design) with a Vibrating Sample Magnetometer (VSM) at 300 .
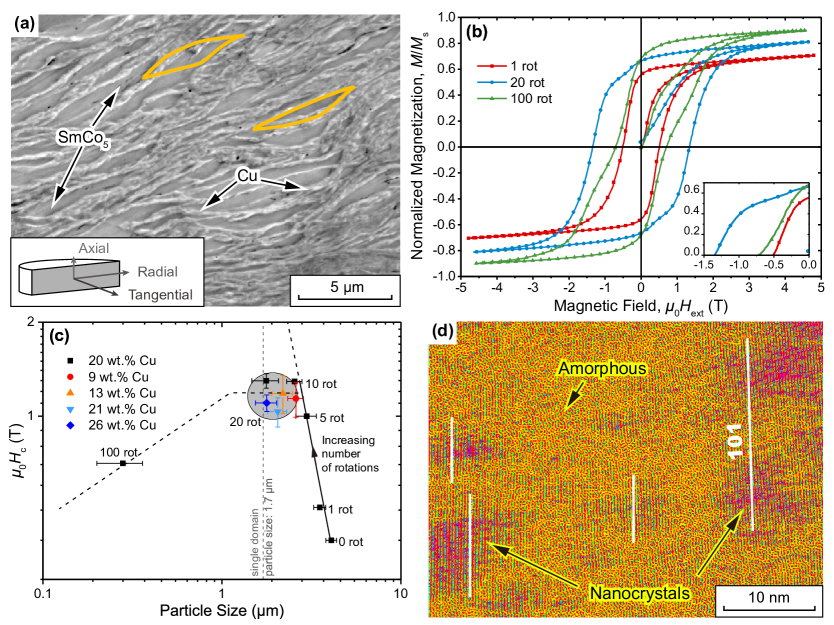
Fig. 1a shows the microstructure of the \ceSmCo_5-Cu nano-composite subjected to 20 rotations obtained by backscatterd electron (BSE) imaging. The \ceSmCo_5 particles show a strong elongation perpendicular to the direction of the applied pressure and the particles are surrounded by the diamagnetic fcc Cu-phase. In Fig. 1b the demagnetization corrected hysteresis curves measured in axial direction of the samples subjected to 1, 20 and 100 rotations are depicted. For the calculation of the internal magnetic field a density of 8.584 g/cm3 for 20 wt.% of Cu was assumed. Comparing the samples subjected to 1 and 20 rotations a strong increase of the coercivity and of the saturation magnetization can be seen. The saturation magnetization continues to increase for the sample subjected up to 100 rotations, while the coercivity decreases from 1.34 after 20 rotations to 0.51 .
In Fig. 1c the coercivity is plotted as a function of the grain size. In addition to of the samples subjected to 1, 20 and 100 rotations, the diagram also contains of other samples prepared in [4]. increases with a reduction in particle size for the samples subjected to up to 10 rotations. This increase is related predominantly to the particle refinement in combination with thin Cu-layers in between the ferromagnetic particles with a sufficient thickness for magnetic decoupling [4, 16]. With further increase of strain remains nearly constant even though the particle size further decreases and reaches the single domain size of [17] for the sample subjected to 20 rotations. Therefore, a further increase of the coercivity is expected, indicated by the dashed line. After 100 rotations the particle size is further diminished and the coercivity strongly decreases as already seen in Fig. 1b.
TEM investigations by inverse fast Fourier transform analyses (Fig. 1d) reveal a partial amorphization of the \ceSmCo_5 phase, whereas nanocrystals of 10 to 50 nm in size are embedded in an amorphous matrix. The volume fraction of the nanocrystals was determined to for the sample subjected to 20 rotations. In addition to the selective TEM observation, XRD data, shown for as-HPT deformed samples up to 20 rotations in [4], indicate a partial amorphization on a macroscopic length scale by a clear broadening of the reflexes with increasing number of rotations. The amorphous phase is believed to play a crucial role in the saturation behavior of coercivity and possibly also in the further decrease in magnetic hardening with straining.
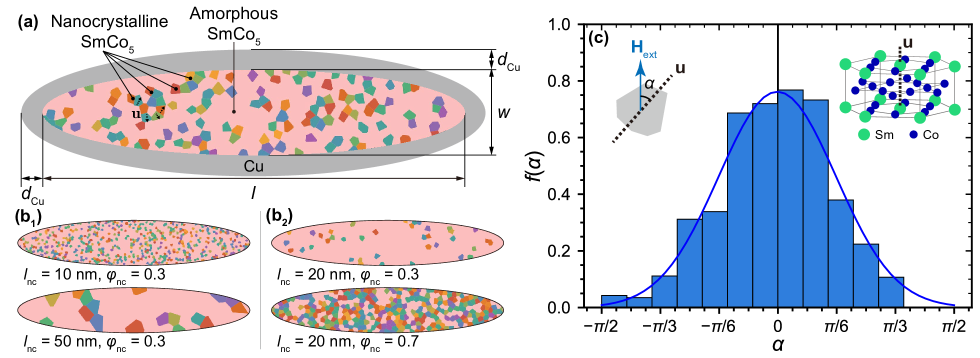
To understand the saturation of coercivity for the sample after 20 rotations (whereas the \ceSmCo_5 phase is within the single domain particle size), the role of the amorphous phase and the embedded nanocrystals is studied by micromagnetic simulation based on experimental characterization. In this regard, we consider the simulation domains containing an elliptical nanocomposite region with the major axis and minor axis (aspect ratio of 5:1), and a Cu-coated region with the thickness , as shown in Fig. 2a. This is based on the experimental characterization results shown in Fig. 1. Nanocrystalline and amorphous \ceSmCo_5 inside the nanocomposite region were created via the Voronoi tessellation on the randomly-labeled seeds. To control the size and volume fraction of generated nanocrystals, seeds with a uniform-controlled diameter were sampled based on the fast Poisson disk sampling [18]. The amount of the seeds labeled as nanocrystals was further constrained according to the imposed seed fraction. When the seeding amount is sufficiently large, the average nanocrystal size and nanocrystal volume fraction can be then approximated by the seed diameter and the seed fraction. To investigate the effects of the nanocrystal size and of the volume fraction separately and quantitatively, was fixed at 0.3 for varying from 10 to 50 with an increment of 10 . For varying from 0.1 to 0.7 with an increment of 0.2, was fixed at 20 . In Fig. 2b we demonstrate the generated nanocomposite with either fixed or fixed . For reference, a fully packed nanocomposite (i.e., ) with a nanocrystal size of was also examined. The easy axes of the nanocrystals were also assigned by random sampling from a Gaussian distribution of the misorientation angle to the applied field, as shown in Fig. 2c. The mean and the standard deviation of are and , respectively, which can guarantee of the sampled in-between and .
The free energy of the system with volume was formulated as the functional of following the scenario of micromagnetics, i.e.,
| (1) |
Here, is the exchange contribution, taking into account the parallel-aligning tendency between neighbouring magnetic moments due to the Heisenberg exchange interaction. represents the contribution of the magnetocrystalline anisotropy. The magnetostatic term counts the energy of each local magnetization under the demagnetizing field created by the surrounding magnetization. The Zeeman term counts the energy of each local magnetization under an extrinsic magnetic field . Those terms are assigned to the distinctive phases, as shown in Table. 1. The magnetic properties of nanocrystalline \ceSmCo_5 employed in the simulation are , , and [19, 20]. Due to the lack of experimental investigations, the amorphous \ceSmCo5 phase is assumed to have the identical exchange stiffness and saturation magnetization as the nanocrystalline phase, while its magnetocrystalline anisotropy is assumed to be uniaxial with . This is based on the experimental observations on similar hard magnetic systems, notably amorphous Nd-Fe-B [21, 22, 23], where the amorphous phase is treated as a soft magnetic matrix and is generally known to have negligible magnetocrystalline anisotropy [23, 24, 25]. The appearence of uniaxial magnetocrystalline anisotropy is due to local internal stresses or induced anisotropy by applied fields, which explains the non-zero for the amorphous phase. The exchange length is evaluated as in the nanocrystalline phase and in the amorphous phase. As for the diamagnetic Cu-phase, magnetic susceptibility is utilized for physical consistency, though the Cu-phase has a negligible contribution to the magnetization reversal of the whole nanostructures. As unveiled by microstructure analyses in Fig. 1a, \ceSmCo_5 particles are surrounded by the Cu-phase, implying a magnetic decoupling among particles.
| \ceSmCo_5 (nanocrystal) | ||||
| \ceSmCo_5 (amorphous) | ||||
| \ceCu | 0 | 0 |
The magnetization reversal under an imposed cycling magnetic field was generally described by the Landau-Lifshitz-Gilbert (LLG) equation. However, due to the incomparable time scale of LLG-described magnetization dynamics (around nanoseconds) with respect to the one of hysteresis measurement (around seconds), constrained optimization of the free energy functional has been widely employed as a computationally efficient alternative to the time-dependent calculation in evaluating the hysteresis behavior of permanent magnets, where the magnetization configuration is regarded as the quasi-equilibrium one [26, 27, 28]. Based on the steepest conjugate gradient (SCG) method, it has been shown that the evolving direction of to optimize is in accordance with the exact damping term of LLG equation [26, 28], i.e.,
| (2) |
The micromagnetic simulations were carried out by the FDM-based SCG minimizer in the open-sourced package MuMax3 [29] with numerical details elaborated in Refs. [26, 30]. The simulation domains were constructed with the finite difference grids and a grid size of . Periodic boundary condition (PBC) was applied on the boundaries perpendicular to -direction by macro geometry approach [31], while Neumann boundary condition was applied on other boundaries [29]. It should be notified that the simulation domain is equivalent to a long elliptic cylindrical structure with columnar nanocrystals due to the applied PBC. In order to take numerical fluctuations into account, five cycles of the hysteresis were examined for each nonstructure/reference, with the averaged one presented in the following contents.
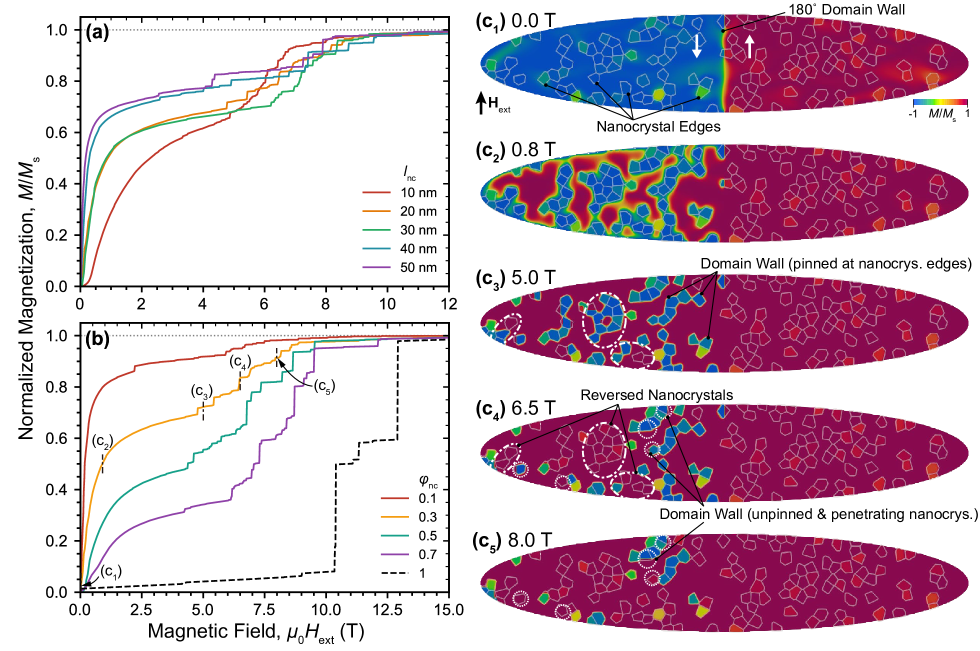
Fig. 3a shows the initial magnetization curves for varying nanocrystal size with a constant volume fraction of whereas Fig. 3b shows it for varying volume fraction with the constant size of the nanocrystals of . To get a precise understanding how the initial magnetization occurs in this microstructure exhibiting an amorphous matrix with embedded nanocrystals, when applying a field, the micromagnetic simulation of the magnetization processes at different external fields are plotted. The micromagnetic model for one specific case of and can be seen in Fig. 3c. In the initial state half of the particle is magnetized upwards and half of the particle is magnetized downwards (Fig. 3c).
Fig. 3a and b show that the saturation for all different cases is achieved at . From the microstructure (Fig. 3c) it is evident that first the amorphous phase turns its magnetization direction towards the external field at very small applied fields before the magnetization of the nanocrystals reverses. The continuous magnetization of the initial curve in the beginning stems from the amorphous phase. At the boundaries of nanocrystals the domain wall gets pinned, which causes the jumps of the magnetization curve. With increasing external field, the domain wall gets unpinned at the boundaries of the nanocrystals and penetrates those. If the magnetization of a nanocrystal points in the direction of the external field the domain grows within a group of neighbouring crystallites. The jumps originate from single nanocrystals or groups of neighbouring nanocrystals which change their magnetization with increasing field.
Fig. 3a indicates a change of the coercivity mechanism with decreasing size of the nanocrystals from nucleation to pinning dominant for . The same can be seen in Fig. 3b for a constant size of the nanocrystal , when having a fully crystallite particle without an amorphous phase. For small volume fractions of nanocrystals the coercivity mechanism is nucleation controlled and changes to pinning for . With increasing volume fraction of the crystallites it is also obvious that higher fields are necessary to reach magnetization saturation.
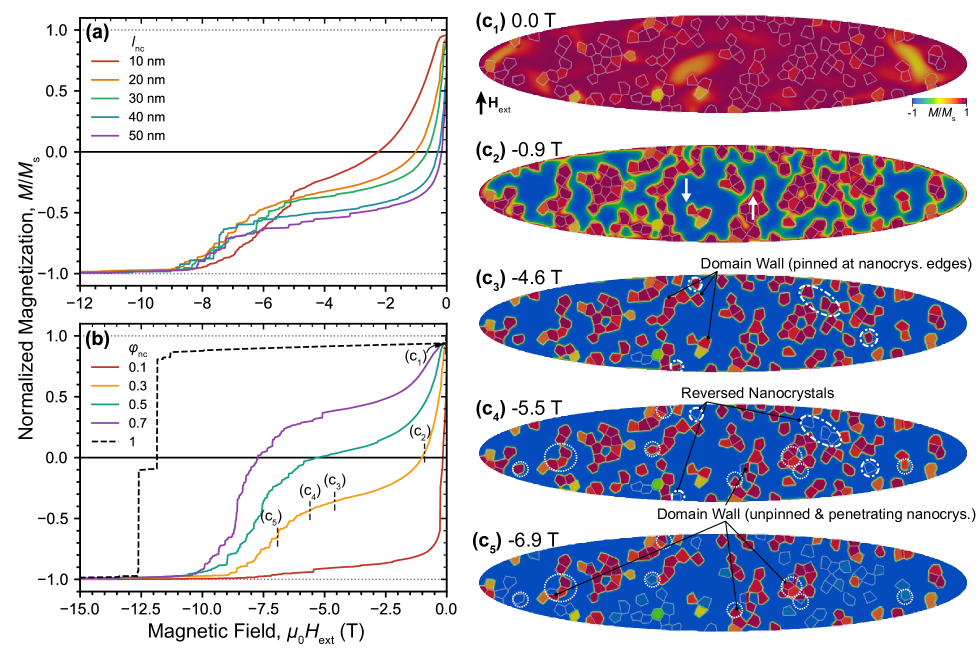
When applying a negative field after saturation, the second and third quadrant of the hysteresis curve is depicted in Fig. 4a for varying nanocrystal size with a constant volume fraction of . Fig. 4b shows it for varying volume fraction with constant size of the nanocrystals of . The micromagnetic model can be seen again for different applied external field strengths for one specific case of and in Fig. 4c. Fig. 4a shows that a decreasing size of the nanocrystals leads to an increasing coercivity for a constant volume fraction of nanocrystals, since the number of crystal boundaries increases and hence pinning sites with decreasing size of nanocrystals.
By the aid of the micromagnetic model, it is obvious that when applying a negative field after magnetization of the particles (Fig. 4c1) first the magnetization of the amorphous phase rotates at very small negative fields starting at (Fig. 4c2 for ), which corresponds to the smooth decrease of Magnetization (Fig. 4a). For the case of and the nanocrystals do not change their magnetization until a field of -5.2 is reached, which is already much higher than its coercivity. Until this field, the domain wall is pinned at the nanocrystal boundaries. With further increasing negative field, first nanocrystals change their magnetization, domain walls are unpinned and penetrate into the nanocrystals and align them with the external field. The jumps originate again from single nanocrystals or groups of neighbouring nanocrystals which change their magnetization with increasing field in opposite direction. For a constant volume fraction of a decreasing size of the nanocrystals leads to higher coercivities, but for all cases magnetization reversal of the nanocrystals starts at negative fields which are larger than the coercivity, meaning that the pinning effects on the nanocrystals edges have no influence on the coercivity (Fig. 4a). For a constant size of the nanocrystals an increasing volume fraction of the nanocrystals leads to an increasing coercivity (Fig. 4b, Fig. 5). Especially for the case of the pinning effects on the nanocrystal edges lead to increased . The highest coercivity is reached if the particle does not contain amorphous phase , which means that the amorphous phase is disadvantageous for the increasing coercivity. This can be explained by the magnetocrystalline anisotropy, which is significantly lower than for nanocrystals due to the lack of crystallinity of the amorphous phase.
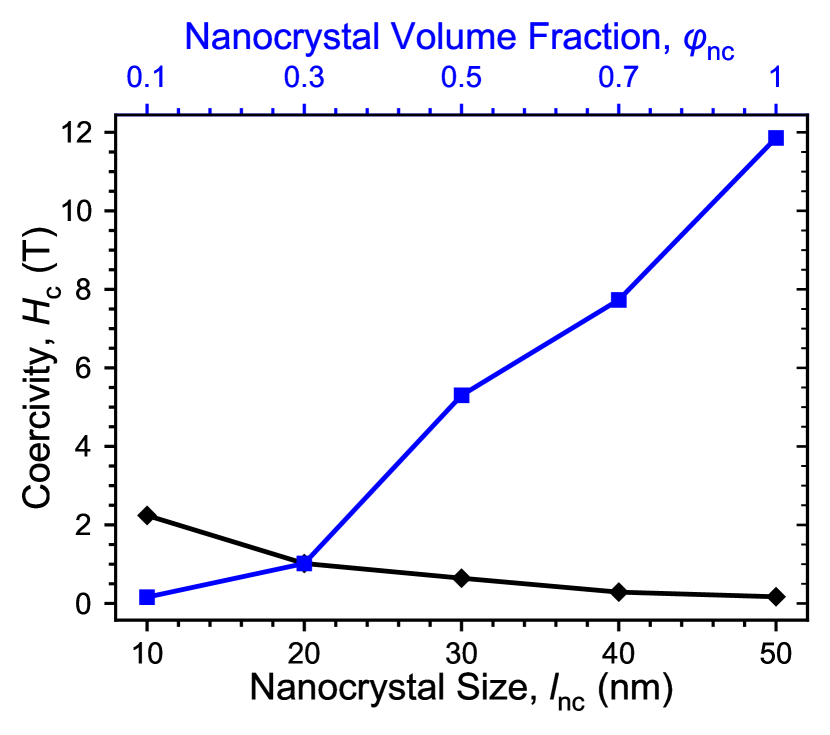
In Fig. 5 the coercivity is depicted as a function of the volume fraction of the nanocrystals (for constant ) and as a function of the nanocrystallite size (for constant ). It is obvious that the influence of the volume fraction of nanocrystals is much more distinct compared to the influence of the nanocrystallite size. This is due to the fact that the pinning effects of the nanocrystal boundaries for the small volume fractions of nanocrystals only start at external field strengths which are higher than the coercivity.
Comparing the simulated coercivities with the experimental observations, they fit very well. Especially for the nanocrystalline volume fraction of and a size of the nanocrystals between and which is in good agreement with the microstructural observations for the small particles made by TEM (Fig. 1d). By the aid of the micromagnetic simulations the effect of the amorphous phase and the embedded nanocrystals can be understood on a length scale at which an experimental investigation is very difficult. The simulations show that to obtain a high coercivity the amorphous phase is disadvantageous and domain wall pinning occurs at the boundaries of the nanocrystals. Except the particle containing large volume fractions of nanocrystals , the pinning at nanocrystal boundaries has no effect on the coercivity since pinning occurs at negative external fields which are larger than the coercivity. Hence, the negative effect of the amorphous phase predominates. The formation of amorphous phase can also explain the strong decrease of the coercivity even though the microstructure gets refined further, when subjecting the sample to 100 rotations.
The results of the simulations, revealing the negative effect of the amorphous phase, show that the HPT process needs to be adjusted in such a way that the particle size of \ceSmCo_5 is reduced to the single domain region while simultaneously the formation of amorphous phase is suppressed. One possible process parameter which can be used to adjust the microstructure is the process-temperature which may lead to dynamic crystallization during the process and can thus suppress the formation of amorphous phase. Our micromagnetic simulations provide an understanding of the mechanisms of the saturation behavior of magnetic hardening due to the induced strain by HPT of \ceSmCo_5-Cu nanocomposites on a length scale that is hard to analyse by experimental investigations and can be used for optimization strategies.
Acknowledgements
Authors acknowledge the financial support of German Science Foundation (DFG) in the framework of the Collaborative Research Centre Transregio 270 (CRC-TRR 270, project number 405553726, sub-projects A01, A06, A08, Z01, Z02, Z-INF). Authors Y.Y., E.F. and B.-X.X. appreciate their access to the Lichtenberg High-Performance Computer and the technique supports from the HHLR, Technical University of Darmstadt, and the GPU Cluster from the sub-project Z-INF of SFB/TRR 270. Y. Y. also highly thanks Jiajun Sun, Zhejiang University, for his help in the technical check of the micromagnetic simulations.
Data Availability
The authors declare that the data supporting the findings of this study are available within the paper. The microstructure generation scripts, micromagnetic input files, and utilities are cured in the online dataset (DOI: xx.xxxx/zenodo.xxxxxxxx).
Declaration of Competing Interest
The authors declare that they have no known competing financial interests of personal relationships that could have appeared to influence the work reported in this paper.
References
- Gutfleisch et al. [2011] O. Gutfleisch, M. A. Willard, E. Brück, C. H. Chen, S. G. Sankar, J. P. Liu, Advanced materials (Deerfield Beach, Fla.) 23 (2011) 821–842. doi:10.1002/adma.201002180.
- Skokov and Gutfleisch [2018] K. P. Skokov, O. Gutfleisch, Scripta Materialia 154 (2018) 289–294. doi:10.1016/j.scriptamat.2018.01.032.
- Stoner and Wohlfarth [1948] E. C. Stoner, E. P. Wohlfarth, Philosophical Transactions of the Royal Society of London. Series A, Mathematical and Physical Sciences 240 (1948) 599–642. doi:10.1098/rsta.1948.0007.
- Staab et al. [2023] F. Staab, E. Bruder, L. Schäfer, K. Skokov, D. Koch, B. Zingsem, E. Adabifiroozjaei, L. Molina-Luna, O. Gutfleisch, K. Durst, Acta Materialia 246 (2023) 118709. doi:10.1016/j.actamat.2023.118709.
- Weissitsch et al. [2020] L. Weissitsch, M. Stückler, S. Wurster, P. Knoll, H. Krenn, R. Pippan, A. Bachmaier, Crystals 10 (2020) 1026. doi:10.3390/cryst10111026.
- Weissitsch et al. [2022] L. Weissitsch, M. Stückler, S. Wurster, J. Todt, P. Knoll, H. Krenn, R. Pippan, A. Bachmaier, Nanomaterials (Basel, Switzerland) 12 (2022). doi:10.3390/nano12060963.
- Weissitsch et al. [2023] L. Weissitsch, F. Staab, K. Durst, A. Bachmaier, Materials Transactions (under review, März 2023).
- Yi et al. [2016] M. Yi, O. Gutfleisch, B.-X. Xu, Journal of Applied Physics 120 (2016) 033903.
- Duerrschnabel et al. [2017] M. Duerrschnabel, M. Yi, K. Uestuener, M. Liesegang, M. Katter, H.-J. Kleebe, B. Xu, O. Gutfleisch, L. Molina-Luna, Nature communications 8 (2017) 54.
- Kim et al. [2019] S.-K. Kim, S. Hwang, J.-H. Lee, Journal of Magnetism and Magnetic Materials 486 (2019) 165257.
- Bautin et al. [2017] V. Bautin, A. Seferyan, M. Nesmeyanov, N. Usov, AIP Advances 7 (2017) 045103.
- Hono and Sepehri-Amin [2018] K. Hono, H. Sepehri-Amin, Scripta Materialia 151 (2018) 6–13. URL: https://www.sciencedirect.com/science/article/pii/S1359646218301647. doi:https://doi.org/10.1016/j.scriptamat.2018.03.012.
- Kovacs et al. [2020] A. Kovacs, J. Fischbacher, M. Gusenbauer, H. Oezelt, H. C. Herper, O. Y. Vekilova, P. Nieves, S. Arapan, T. Schrefl, Engineering 6 (2020) 148–153.
- Fuentes et al. [2017] G. Fuentes, J. Holanda, Y. Guerra, D. Silva, B. Farias, E. Padrón-Hernández, Journal of Magnetism and Magnetic Materials 423 (2017) 262–266.
- Tang et al. [2020] X. Tang, J. Li, Y. Miyazaki, H. Sepehri-Amin, T. Ohkubo, T. Schrefl, K. Hono, Acta Materialia 183 (2020) 408–417.
- Ney et al. [1999] A. Ney, F. Wilhelm, M. Farle, P. Poulopoulos, P. Srivastava, K. Baberschke, Physical Review B 59 (1999) R3938–R3940. doi:10.1103/PhysRevB.59.R3938.
- Gutfleisch [2000] O. Gutfleisch, Journal of Physics D: Applied Physics 33 (2000) R157–R172. doi:10.1088/0022-3727/33/17/201.
- Bridson [2007] R. Bridson, SIGGRAPH sketches 10 (2007) 1.
- Lectard et al. [1994] E. Lectard, C. Allibert, R. Ballou, Journal of Applied Physics 75 (1994) 6277–6279.
- Coey [2010] J. M. Coey, Magnetism and magnetic materials, Cambridge university press, 2010.
- Zhang et al. [2013] Y. Zhang, W. Li, H. Li, X. Zhang, Journal of Physics D: Applied Physics 47 (2013) 015002.
- Harada et al. [1993] T. Harada, T. Kuji, K. Fukuoka, Y. Syono, Journal of alloys and compounds 191 (1993) 255–261.
- Kronmüller and Gröger [1981] H. Kronmüller, B. Gröger, Journal de Physique 42 (1981) 1285–1292.
- Kronmüller et al. [2003] H. Kronmüller, et al., Micromagnetism and the microstructure of ferromagnetic solids, Cambridge university press, 2003.
- Fujimori et al. [1976] H. Fujimori, Y. Obi, T. Masumoto, H. Saito, Materials Science and Engineering 23 (1976) 281–284.
- Exl et al. [2014] L. Exl, S. Bance, F. Reichel, T. Schrefl, H. Peter Stimming, N. J. Mauser, J. Appl. Phys. 115 (2014) 17D118.
- Schabes and Bertram [1988] M. E. Schabes, H. N. Bertram, Journal of Applied Physics 64 (1988) 1347–1357.
- Furuya et al. [2015] A. Furuya, J. Fujisaki, K. Shimizu, Y. Uehara, T. Ataka, T. Tanaka, H. Oshima, IEEE Transactions on Magnetics 51 (2015) 1–4.
- Vansteenkiste et al. [2014] A. Vansteenkiste, J. Leliaert, M. Dvornik, M. Helsen, F. Garcia-Sanchez, B. Van Waeyenberge, AIP Adv. 4 (2014) 107133.
- Berkov et al. [1993] D. Berkov, K. Ramstöcck, A. Hubert, physica status solidi (a) 137 (1993) 207–225.
- Fangohr et al. [2009] H. Fangohr, G. Bordignon, M. Franchin, A. Knittel, P. A. de Groot, T. Fischbacher, J. Appl. Phys. 105 (2009) 07D529.
- Gutfleisch [2009] O. Gutfleisch, Nanoscale magnetic materials and applications (2009) 337–372.