Distinguishing Magnetized Disc Winds from Turbulent Viscosity through Substructure Morphology in Planet-forming Discs
Abstract
The traditional paradigm of viscosity-dominated evolution of protoplanetary discs has been recently challenged by existence of magnetised disc winds. However, distinguishing wind-driven and turbulence-driven accretion through observations has been difficult. In this study, we present a novel approach to identifying their separate contribution to angular momentum transport by studying the gap and ring morphology of planet-forming discs in the ALMA continuum. We model the gap-opening process of planets in discs with both viscous evolution and wind-driven accretion by 2D multi-fluid hydrodynamical simulations. Our results show that gap-opening planets in wind-driven accreting discs generate characteristic dust substructures that differ from those in purely viscous discs. Specifically, we demonstrate that discs where wind-driven accretion dominates the production of substructures exhibit significant asymmetries. Based on the diverse outputs of mock images in the ALMA continuum, we roughly divide the planet-induced features into four regimes (moderate-viscosity dominated, moderate-wind dominated, strong-wind dominated, inviscid). The classification of these regimes sets up a potential method to constrain the strength of magnetised disc wind and viscosity based on the observed gap and ring morphology. We discuss the asymmetry feature in our mock images and its potential manifestation in ALMA observations.
keywords:
planet-disc interactions – protoplanetary discs – planets and satellites: formation1 Introduction
The Atacama Large Millimeter/submillimeter Array (ALMA) has discovered a rich catalogue of diverse features in mm/sub-mm observation of protoplanetary discs (PPDs), including cavities, gaps, rings and vortices (e.g., ALMA Partnership et al., 2015; Long et al., 2018; Andrews et al., 2018; Huang et al., 2018; Lodato et al., 2019; Long et al., 2019; Andrews, 2020). Among those substructures, the most ubiquitous features are the bright rings and dark gaps, a classical interpretation for which is the perturbation of gas and dust profiles by an embedded planet (e.g., Paardekooper et al., 2022). Due to excitation and dissipation of density waves launched at resonances, planets carve out deficits in the surrounding gas density profiles (Goldreich & Tremaine, 1980; Lin & Papaloizou, 1986, 1993). In turn, a pressure bump forms at the outer edge of the gas gap, which efficiently traps in-drifting dust particles that have limited coupling to gas (Paardekooper & Mellema, 2006; Zhu et al., 2011), leading to bright dust rings. With suitable parameters for disc viscosity, thickness as well as planet mass, one can reproduce a variety of dust emission features similar to what’s discovered in the sub-mm ALMA catalogue (Rosotti et al., 2016; Zhang et al., 2018).
While the turbulent viscosity parameter (Shakura & Sunyaev, 1973), acting to maintain disc profile and prevent gap opening, have been inferred to be low in planet-forming regions of PPDs (Flaherty et al., 2017; Lodato et al., 2017; Dullemond et al., 2018; Rosotti et al., 2020; Doi & Kataoka, 2021), which corroborates non-ideal magnetohydrodynamics (MHD) simulations (Bai & Stone, 2013), recent theoretical works have proposed that magnetically-driven disc winds might transport the angular momentum of gas at a faster rate than disc turbulence, dominating the PPD accretion (Armitage et al., 2013; Suzuki et al., 2016; Hasegawa et al., 2017; Lesur, 2021; Cui & Bai, 2021, 2022).
However, constraining the disc wind level from the observational side is challenging. A few pioneer works have tried to distinguish the dominant accretion mechanism by studying the protoplanetary disc size evolution from a population view (Trapman et al., 2020; Long et al., 2022; Trapman et al., 2022; Zagaria et al., 2022; Toci et al., 2023), while the results remain unconcluded. On the other hand, current observation results can indeed constrain the upper limit of the disc turbulence coefficient to be as low as to (Flaherty et al., 2017, 2020; Miotello et al., 2022; Rosotti, 2023). If protoplanetary discs are indeed nearly inviscid (e.g., Villenave et al., 2020), this serves as strong evidence for a mechanism other than the gas viscosity to explain how discs accrete and evolve, with MHD winds currently being a promising alternative (Lesur, 2021). Wind-dominated accretion could reconcile the low turbulent velocities with a moderate accretion rate onto the host star.
Under this context, Elbakyan et al. (2022) applied the torque formula for disc wind with an accretion parameter , introduced by Tabone et al. (2022b), and investigated its effect on planet gap formation, focusing on parametrising the magnitude of gap opening with the gas/dust density contrast between the gap centre and gap edge. They concluded that it is generally harder for MHD winds to close up a planetary gap than viscosity for the same accretion rate, requiring to be much larger than to maintain the same level of density depletion in the planetary gap. This implies for moderate values of , we can expect co-existence of low- controlled dust observational structure with high- controlled accretion rate. When , disc wind may dominate both gap opening and accretion rates.
The majority of simulations from Elbakyan et al. (2022) are in 1D and serve the purpose of parameter space exploration, supplemented by 2D two-fluid simulations for cross-validation, which contains gas and one dust species with a fixed Stokes number. In this work, we perform more realistic multi-fluid simulations with a physical dust size distribution, and post-process hydrodynamic simulation results to produce synthetic observations at ALMA wavelength and resolution. We focus on the full 2D shapes of dust brightness maps instead of only a hydrodynamic density contrast, and identify several characteristic features which demonstrate the intrinsic differences in two kinds of accretion mechanisms.
The paper is organized as follows: In §2, we introduce the numerical setup for performing hydrodynamic simulations and constructing synthetic images. In §3 we describe the disc morphology in characteristic regimes of the parameter space. We summarise our findings and discuss the implications of our results in §4.
2 Numerical Setup
2.1 Equations Solved
In this work, we consider a 2D (, ), locally isothermal protoplanetary disc composed of gas and dust with an embedded planet. Disc self-gravity, realistic magnetic fields, planet orbital migration and accretion are not included in our simulations. The disc model is described by the Navier-Stokes equations in the cylindrical polar coordinate, in a corotating frame of reference centred on the central star:
| (1) |
| (2) |
| (3) |
| (4) |
where is the gravitational potential from the star and the planet, , V and are the surface density, velocity and pressure of the gas, respectively. is the surface density for the -th dust species, is dust velocity, is the drag force from gas acting on the dust of unit mass. is the source term from wind accretion (parametrisation see below).
The viscous stress tensor is given by
| (5) |
where is the identity matrix, and the kinematic viscosity is specifically expressed as a function of a dimensionless constant (Shakura & Sunyaev, 1973):
| (6) |
where is the sound speed, is the scale height, with being the radial distance and is the disc aspect ratio.
Dust is treated as multiple pressure-less fluids. The drag force per mass for each species, , is given by
| (7) |
where is the Keplerian frequency, and the Stokes number (Epstein regime) for each species (Birnstiel et al., 2010) proportional to the dust size is given by
| (8) |
where is grains size for different dust and is the internal dust density.
For each species of dust , our simulations also include dust diffusion flux :
| (9) |
Where is the dust diffusion coefficient (Youdin & Lithwick, 2007):
| (10) |
see Weber et al. (2019) for details on numerical implementation.
To model the interplay between MHD wind and viscosity in our 2D hydrodynamic simulation, we modified the public code FARGO3D (Benítez-Llambay & Masset, 2016) in its multi-fluid version (Benítez-Llambay et al., 2019), see Elbakyan et al. (2022). To summarise, we regard MHD disc winds as a specific torque acting to decrease the gas rotational angular momentum:
| (11) |
where is the unit mass of the host star, and is the characteristic radial infall velocity of gas due to disc winds corresponding to this torque (Tabone et al., 2022b):
| (12) |
is a dimensionless parameter related to the strength of the wind, defined similarly as the turbulent viscosity parameter, and is the Keplerian velocity at . It follows that the source term in Equation 2 would be
| (13) |
where is the unit vector for radial direction. Previous works used similar torque formulae to mimic wind-driven disc accretion in 2D hydrodynamic simulation, for example, Kimmig et al. (2020) defined the inward velocity with a parameter , roughly equivalent to in our setup. There is no dust diffusion associated with the disc wind.
2.2 Disc Parameters
The computational domain of our simulation ranges from to , where the code unit length and planet orbital radius. Although the hydrodynamic simulation is scale-free, we set 20 au for the purpose of synthetic map calculation, similar to Zhang et al. (2018). The simulation domain is resolved by 512 cells in the radial direction and 656 cells in the azimuthal direction. We apply the wave-damping boundary conditions as in the 2D simulations of Elbakyan et al. (2022).
The initial gas surface density profile is given by
| (14) |
where in code units or in physical units. For our local isothermal temperature profile, the aspect ratio is given by
| (15) |
where we adopt at , corresponding to K at 20 au for molecular hydrogen gas in physical units.
We put 5 dust fluids with size spaced logarithmically uniformly between 30 m and 3 mm. We choose an initial size distribution as (Mathis et al., 1977), an initial total dust-to-gas mass ratio and the internal grain density . This gives us the Stokes number of mm-size dust for characteristic background density .
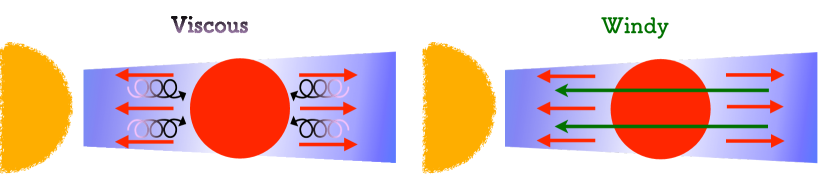
For a direct comparison, we illustrate the mass flux of pebbles transported by different processes in Figure 1. In both MHD windy discs and viscous discs, the planet tends to push the gas away from its vicinity (Lin & Papaloizou, 1993). The local pressure minimum at the gas gap, therefore, drives the dust to drift away from the planet by gas drag (the second term of the equation below, Nakagawa et al., 1986),
| (16) |
opening a dust gap as well (the red arrows in Figure 1). In the viscous discs, the turbulent diffusion of dust, whose net mass flux is along with the gas density gradient, aims to refill the gap (the purple arrows in Figure 1). However, in the MHD windy disc, wind only removes angular momentum thus gas velocity induced is always inward. In other words, the wind torque effect (Equation 11) is equivalent to an additional gas radial velocity (Equation 12), being always towards the host star. This gas radial velocity induced by wind can be comparable to or even larger than the gas viscous velocity depending on the value of , which directly influences the dust radial drift velocity (the first term of Equation 16), blowing the pebble drift across the gap.
In this work, we perform extensive simulations to explore the and parameter space, while fixing the planet mass ratio (Saturn mass corresponding to a solar-mass host star) to isolate the effects of viscosity and wind on dust signatures. We choose this mass because it’s massive enough to produce ALMA-like dusty gap signatures over a wide range of accretion parameters, and meanwhile consistent with the non-detection of super-Jupiter planets in ALMA sources by direct imaging campaigns (Jorquera et al., 2021; Huélamo et al., 2022; Follette et al., 2022). See Figure 2 for all our choices of accretion parameters. Certain reference simulations have only the wind or the viscosity parameter. Our simulations were run for 1000 orbital periods at ( corresponding to Myr for physical units), which is comparable to the typical disc ages of the DSHARP sources (Zhang et al., 2018). All of the synthetic maps shown in this work refer to the configuration derived at this time.
2.3 Radiative transfer
To generate synthetic maps for the dust continuum emission at sub-millimetre wavelength observable with ALMA, hydrodynamic results from FARGO3D multi-fluid simulations are post-processed with the ray-tracing algorithm in public code RADMC-3D (Dullemond et al., 2012). To extrapolate the 2D dust density map into 3D, we assume that all dust densities follow a Gaussian distribution in the vertical direction
| (17) |
Usually in the post-processing of images, one assumes (Dubrulle et al., 1995; Youdin & Lithwick, 2007), where is the vertical turbulent diffusion coefficient at the midplane. One can relate for isotropic turbulence (Birnstiel et al., 2016; Baruteau et al., 2021) 111Note that in the FARGO3D treatment of radial diffusion, Eqn 10 has also implicitly made this assumption since is put in place of in the original expression of Youdin & Lithwick (2007).. However, MHD simulation results show this assumption is subject to many uncertainties (Zhu et al., 2015; Bai et al., 2016). The existence of wind may also bring dust to high altitudes, but that is usually for micron dust with very small Stokes number that already have intrinsically reaching the wind base at (Armitage et al., 2013), not for millimeter size dust. Since by testing we found that for face-on disc, different vertical diffusion coefficient do not affect the final observation results, for simplicity and to focus on relatively face-on data analysis, the dust scale height is fixed to for dust components similar to Miranda et al. (2017), which is equivalent to a diffusivity coefficient for pebbles with stokes number of . Such a dust scale height matches the ALMA observation in several discs (Pinte et al., 2016; Villenave et al., 2020), possibly implying different diffusivities of dust in the vertical and radial directions, bf as found in simulation with ideal or non-ideal MHD effects (Bai & Stone, 2014; Baehr & Zhu, 2021; Zhou et al., 2022).
To compute realistic temperature structure of the disc based on dust density, we perform iterative thermal Monte Carlo simulations. Details of our procedure are essentially the same as described in Baruteau et al. (2021), although we apply opacities assuming compact dust species comprised of 70% water ices and 30% astro-silicates, with internal density consistent with our simulations, different from the porous dust () as assumed in Baruteau et al. (2019).
To calculate the final beam-convolved synthetic images of dust continuum emission, we use the public python program fargo2radmc3d (Baruteau et al., 2019). We assume the disc distance is 100 parsecs, and the stellar radius is 1.2 solar radii with a star effective temperature of 6000 K.
We then compute the location-dependent emission flux of the disc at the wavelength of 1.25 mm (ALMA band 6). The brightness map roughly reflects the density distribution of dust with sizes close to this wavelength when the dust disc is generally optically thin. The final synthetic maps of the disc are then constructed by convolving the continuum intensity with a beam size of arcsec (C9C6 configuration pair) with an rms noise (about hr on source time).
3 Results
We summarised all simulation parameters and results in Table 1. For the naming of our models, for example, “v4dw1” means that there are both and in this model.
In the centre of Figure 2 we plot all our simulations as points in the parameter space. Simulations with only the wind or viscosity parameter being non-zero are plotted on the horizontal/vertical axes. The panels a-g of Figure 2 show selected synthetic emission maps for characteristic runs residing in different regions of the parameter space. As we will elaborate below, we find that asymmetry from the persistence of vortices is a significant feature that could differentiate a viscosity-dominated disc from a wind-dominated disc when the gap-ring profile in the emission map is quite similar 222Here “dominated” refers their relative control over characteristic features, not in terms of accretion rate. We use different colours in the middle panel in Figure 2 to represent the time vortices appear in our simulations. All symbols except black ones represent a run with vortices persisting to the end of the simulation.
Hydrodynamical simulations models: parameters and results Model (orbits) Inner gap (Yes/No) Synthetic maps (in Figure 2) (1) (2) (3) (4) (5) (6) Strong-viscosity dominated v3dw0 0 No a v3dw(3.e-3) No Moderate-viscosity dominated v3dw2 No c v(3.e-4)dw(3.e-3) No Moderate-wind dominated v0dw2 0 410 No b v0dw(3.e-2) 0 290 No v4dw2 490 No d v(3.e-4)dw2 550 No v(3.e-4)dw(3.e-2) 440 No v3dw(3.e-2) No v0dw1 0 70 No e v4dw1 90 No v3dw1 210 No f v0dw(3.e-3) 0 470 No v0dw(5.e-3) 0 440 No v0dw(7.e-3) 0 420 No v4dw(3.e-3) 620 No v4dw(5.e-3) 650 No Inviscid disc v5dw0 0 550 Yes v5dw3 620 Yes v4dw0 0 500 Yes g v4dw3 600 Yes v0dw3 0 470 Yes

3.1 Moderate viscosity v.s. moderate wind accretion
We first draw attention to one of our benchmark simulations with moderate viscosity and no wind v3dw0 (Figure 2a and blue line in Figure 2h), in which we observe strongly symmetric gap+ring structures with no vortices. The bright dust ring is extended and its transition to the planetary gap is very smooth. Similar results are found in numerous previous works for discs with similar parameters (Rosotti et al., 2016; Zhang et al., 2018; Facchini et al., 2018; Chen et al., 2021).
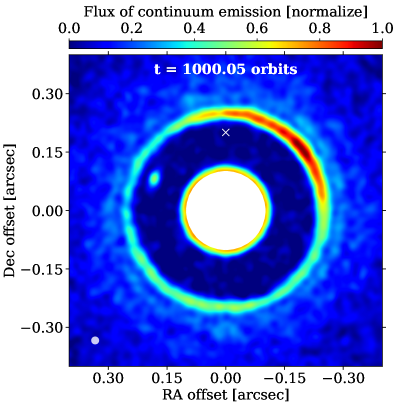
This is in contrast with wind-only simulations, all of which demonstrate visible asymmetries. In another benchmark simulation with moderate wind accretion parameter v0dw2 (Figure 2b), the planet is also able to open a deep gap in the dust profile, and with a gap width as v3dw0 (Figure 2a). However, the obvious clumps around ring for v0dw2 (Figure 2b) can help to easily distinguish the two models.
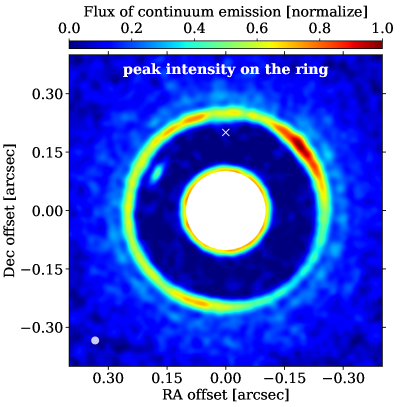
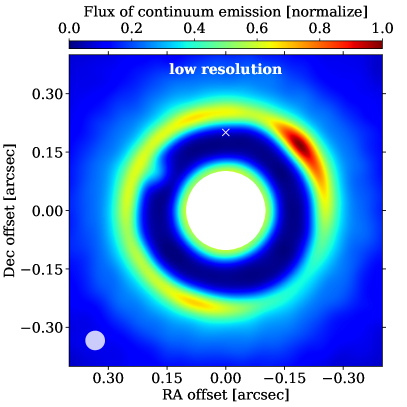
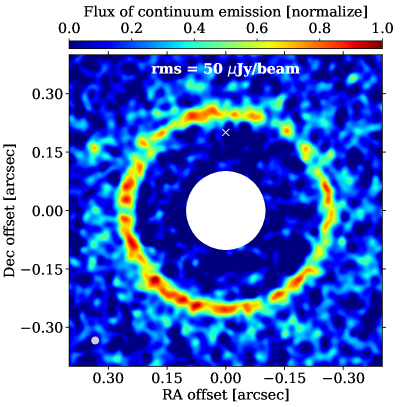
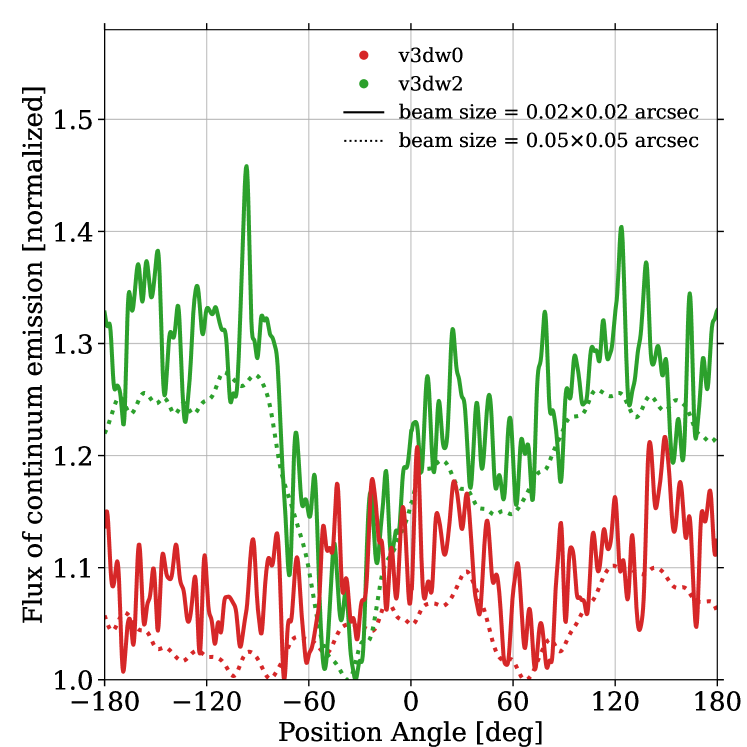
To briefly investigate the influence of ALMA observation setups on our conclusions, we relax the spatial resolution and sensitivity requirement of the default setups in upper right and lower left panels in Figure 3. Due to the azimuthal elongated shape (), the “detection" of the clump-like structures in v0dw2 (Figure 2b) is hardly affected when choosing the lower spatial resolution down to 5050 mas (upper right panel of Figure 3) as long as the ring feature can be resolved. However, the sensitivity of the simulated images plays a crucial role in the results. In the default setup, the signal-to-noise ratio of the clump peak is approximately 40. Increasing the rms noise from to causes the asymmetric feature to become indistinguishable. This, in turn, suggests that clump-like features may be more commonly present on the pebble rings, as discussed in §4. Additionally, the clump-like feature is highly dynamic. In the lower right panel of Figure 3, visible changes are apparent in the corotating frame when comparing the snapshot taken 5 years after the default image (approximately 0.05 orbits later).
Where moderate wind and viscosity coexist, we find there is a transition between viscosity-dominated runs and wind-dominated runs. For example, when mild wind accretion is added on top of v3dw0 (run v3dw2, Figure 2c), the disc is viscosity-dominated and the dust signature is still considerably symmetric. If we now lower the viscosity to (e.g., run v4dw2, Figure 2d), the brightness asymmetry would appear at around a few hundred orbits and persists for the rest of the simulation, similar to run v0dw2. Although it is hard to distinguish the v3dw2 (Figure 2c) from v3dw0 (Figure 2a) visually in the synthetic emission maps, their difference is still significant in terms of the azimuthal intensity variation. In Figure 4, we normalize the intensity by the peak flux at the ring location. Whereas the ring in run v3dw0 (Figure 2a) shows fairly uniform distribution (red line) with fluctuation, up to 30% variation is found in run v3dw2 (Figure 2b). Such a high contrast asymmetry on the ring could be easily tracked by ALMA observation.

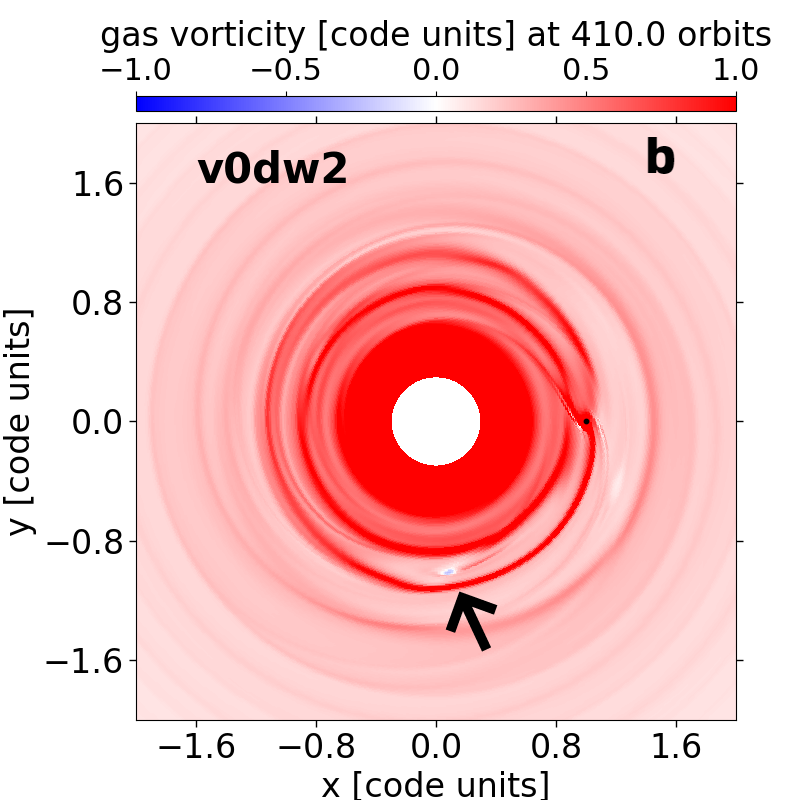
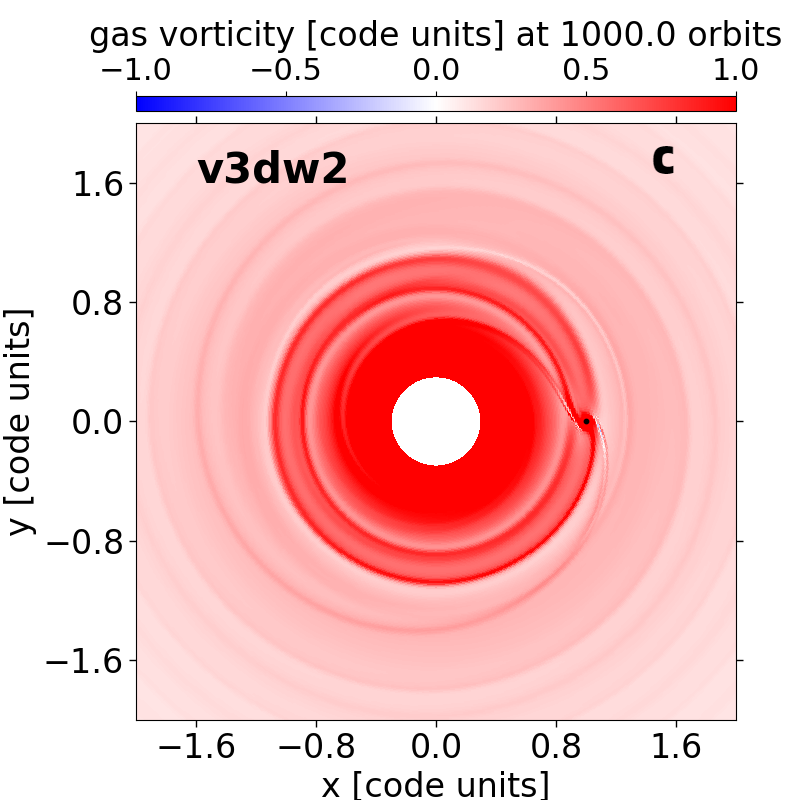
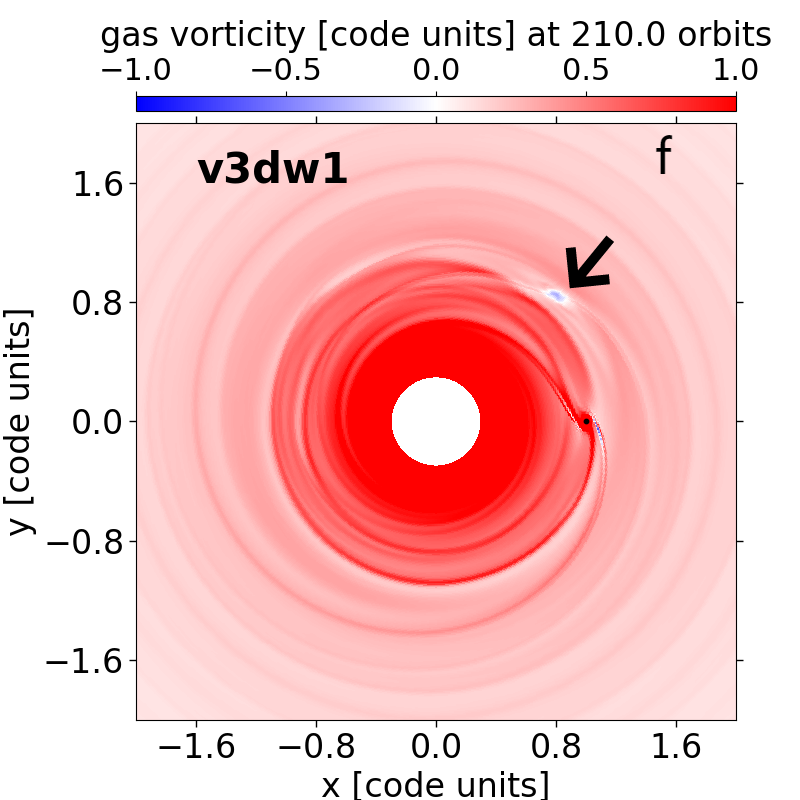
This dichotomy is primarily associated with gas vortices on the gap outer edges being the source of asymmetries in wind-dominated runs. Vortices are generated from Rossby Wave Instability (RWI) (Lovelace et al., 1999; Li et al., 2001), which results from steep gas surface density gradients at the edge of the planetary gaps. Subsequently, they trap dust in clumps and lead to asymmetry in brightness maps. To better quantify the production of the vortex, we define the appearing time of vortices in each model as . The vortex is clearly visible in the 2D snapshots of the vorticity in our hydrodynamic simulation, in this way, the appearance of the vortex can be easily tracked. In Figure 5, we select snapshots of the vorticity of several models (v3dw0, v0dw2, v3dw2, and v3dw1), the black arrows point to the gas vortensity minimal points, i.e., the newly generated vortices. We plot for all models in the central panel of Figure 2 in colours, which helps us to identify a transition from the wind-dominated parameter space towards the viscosity-dominated parameter space (Complete simulation parameters and results for all models are presented in Table 1). Among them, black dots represent the models in which the vortex never disappears (). In general, increases from the bottom right to the upper left in the central panel of Figure 2, which is closely related to the competition between and . The steep change in in the moderate parameter space sets up a natural boundary between wind-dominated (asymmetric) and viscosity-dominated regimes (symmetric).
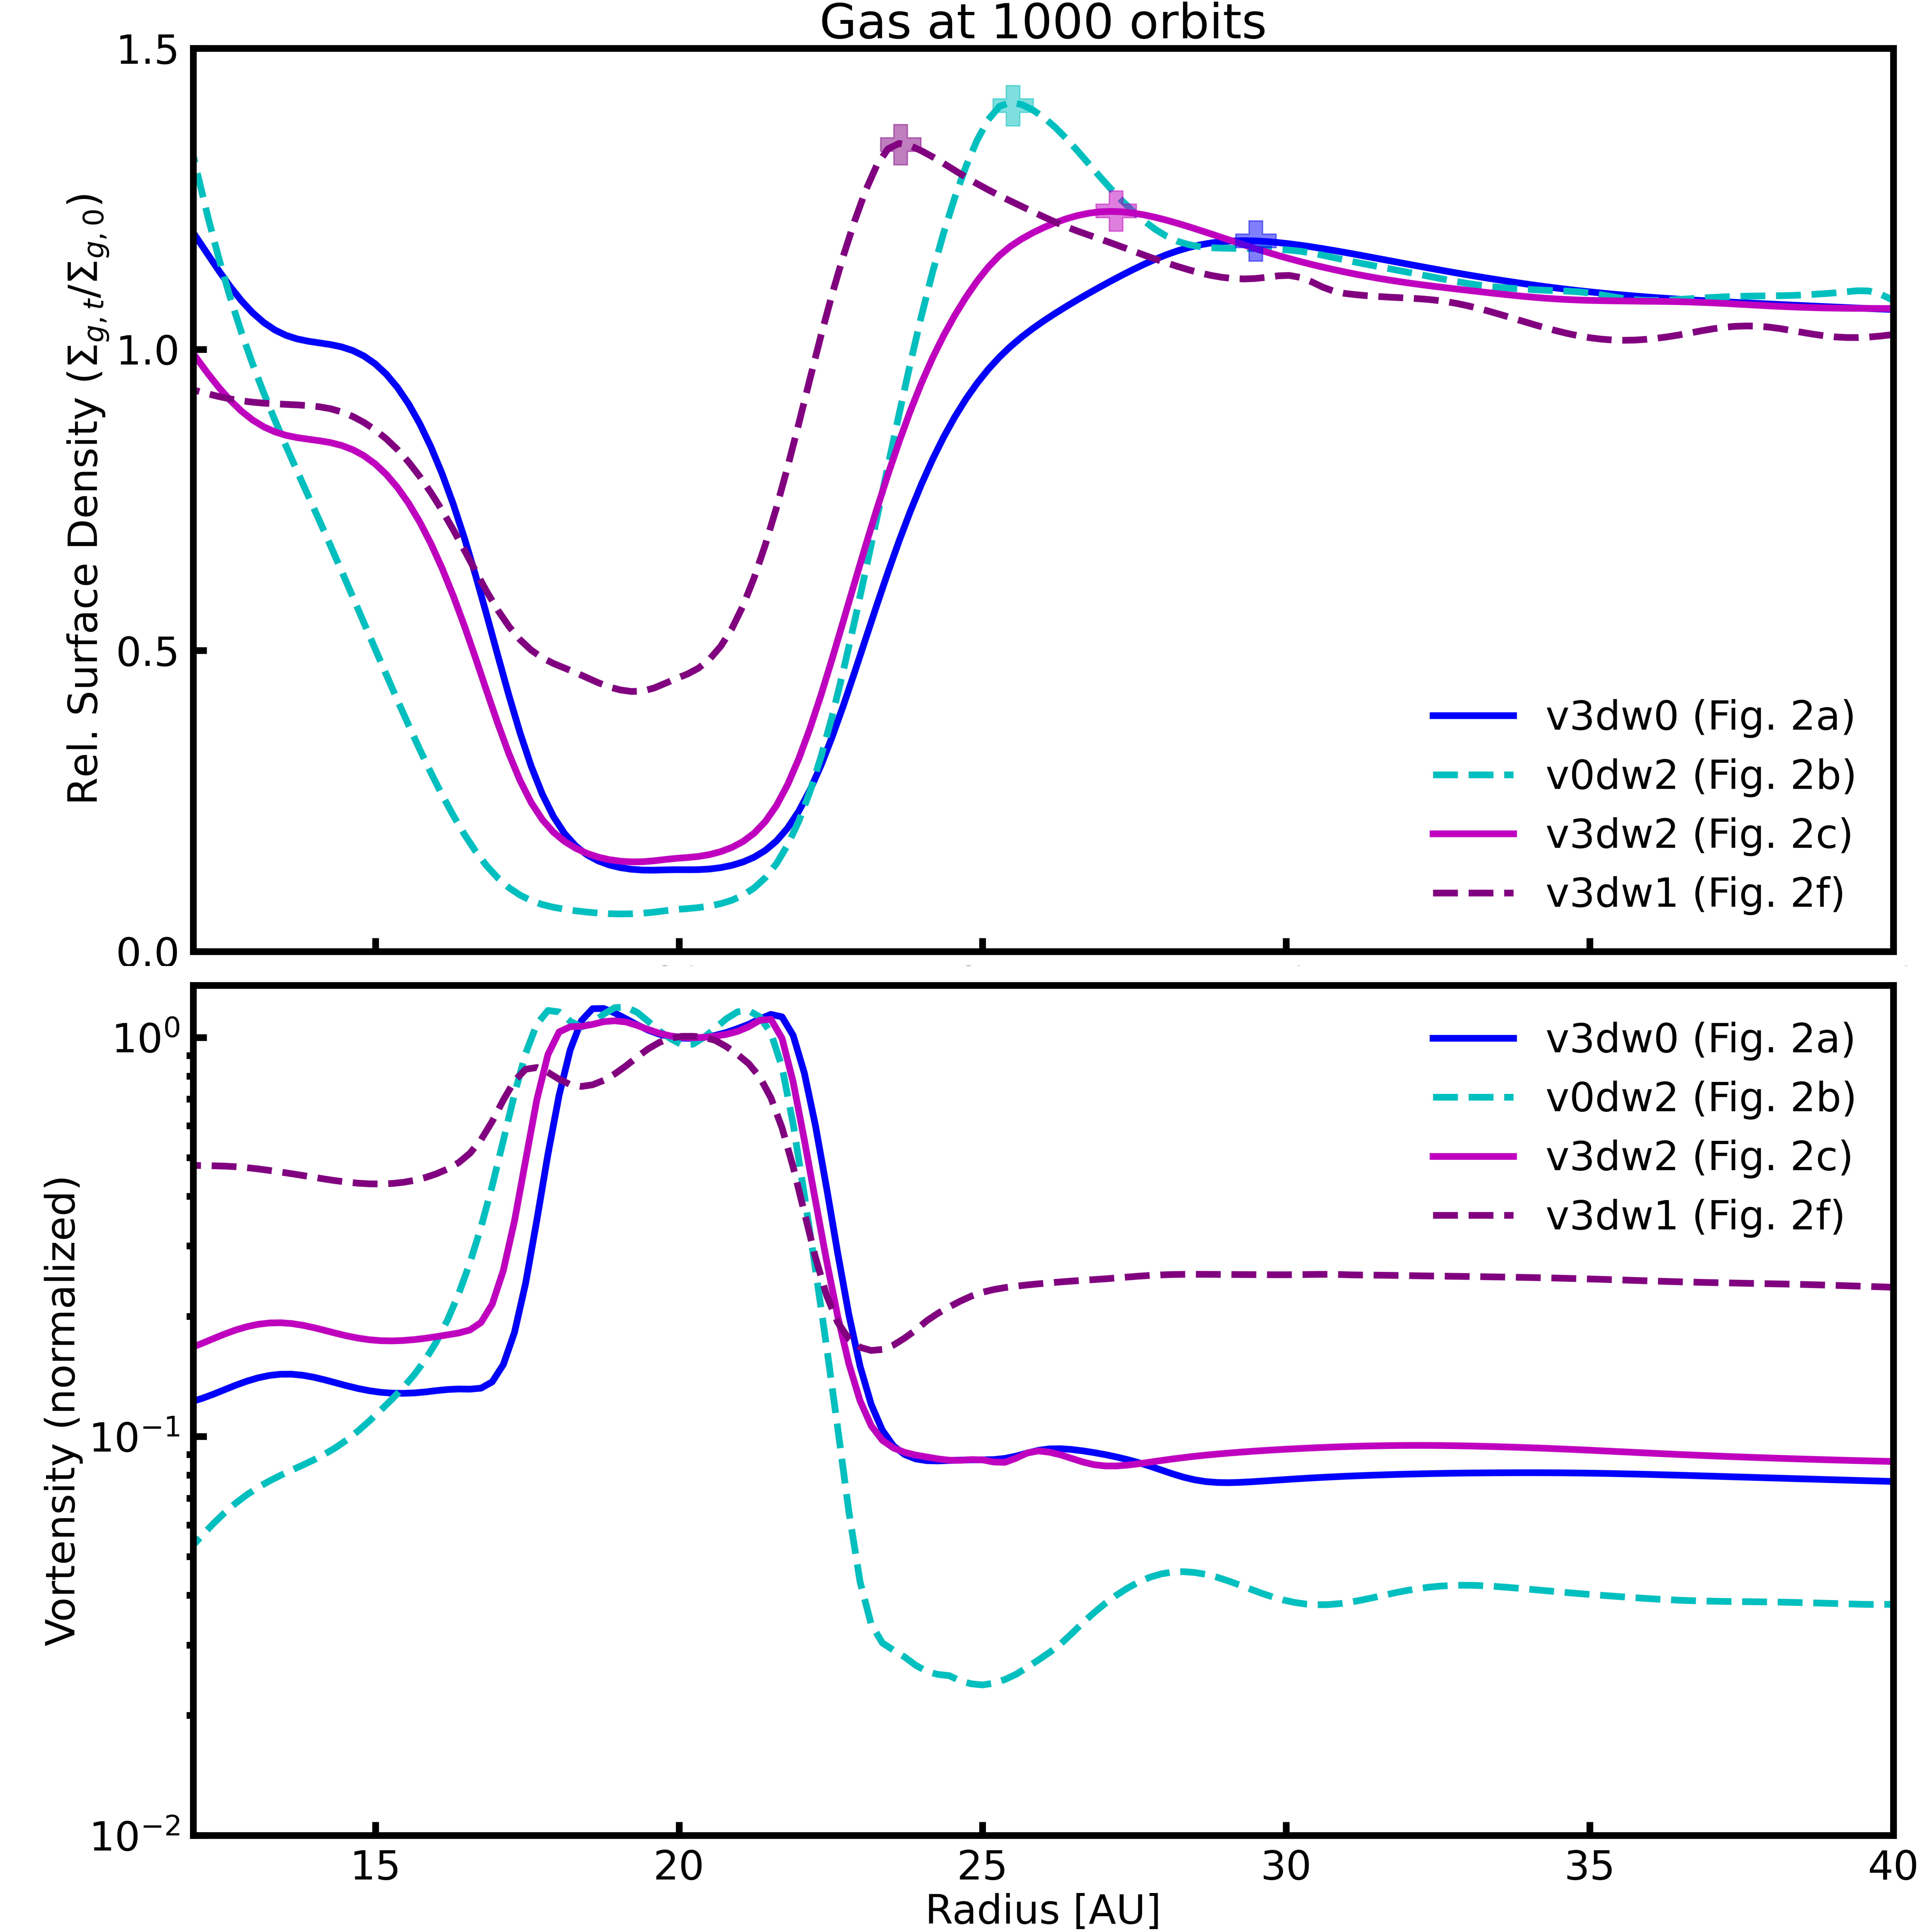
Why is disc wind constructive to vortex formation at the gap edges? Generally, steeper gas surface density gradients favour the onset of RWI. While both wind and viscosity tend to diminish the overall gas surface density contrast of a planetary gap (Elbakyan et al., 2022), they seem to have competing effects on the maintenance of vortices. By looking into the radial gas distribution, we note that the existence of a local vortensity minima (condition for RWI) is more relevant to the smoothness of the density peak at the outer edge of the gap, rather than the overall density depletion at the planet’s location. For example, we plot the steady-state gas surface density profile (normalized by the initial unperturbed gas surface density) of v3dw0, v0dw2, v3dw2, and v3dw1 (same as the models selected in Figure 5) in the upper panel of Figure 6, with crosses indicating the closest density maxima outside the gap. The corresponding gas vortensity profiles are shown in the bottom panel. The transition from the outer disc to the gap region in viscosity-only run v3dw0 is very smooth, with a mild pressure maxima far away from the planet. This is because strong viscous diffusion smears out the vortensity gradient (Li et al., 2001; Fu et al., 2014). The wind-only run v0dw2 has a similar minimum density compared to v3dw0 in the gap center, but the density bump outside the gap is much narrower and sharper, forming a conspicuous vortensity minimum. This may be associated with disc winds providing an extra radial velocity to compress the planet-induced pressure bump, forming a more peaked density profile at distances closer to the planet (thinner ring width and higher amplitude of the ring, both are preferred by the onset of RWI (Ono et al., 2016)). Meanwhile, it does not contribute to the vortensity diffusion of gas or the concentration diffusion of dust. This is why even for the intermediate case v3dw2, while the gap centre is shallower than both v3dw0 and v0dw2, the density bump is still more conspicuous compared to v3dw0, with a vortensity profile less monotonic (albeit the transition is not steep enough to generate RWI). Further increasing the to in v3dw1, will compress the gas ring even more and eventually lead to the onset of RWI and the prominent asymmetry as seen in panel f of Figure 2, despite the gap center being filled. Consistently, the location of density bumps in the dust profiles (Figure 2h) show very similar trends. This demonstrates that wind and viscosity have opposite effects on the vortensity profile in the vicinity of the gap outer edge, leading to the symmetry dichotomy we observe in Figure 2. It is intriguing to further scrutinize the time evolution of vortensity in these cases, but since this paper is more focused on presenting results of a parameter survey and emphasising observable dichotomies, we will investigate the detailed mechanisms of wind compression in separate works.
To provide an order-of-magnitude description of wind-viscosity tension, suppose the pressure bump has a typical width of , the timescale of viscous diffusion across the gap would be
| (18) |
while the timescale of wind transport has a different dependence:
| (19) |
For viscous diffusion to be as effective as wind transport, we have . If is proportional to the dust gap width, usually determined by the planet Hill radius (Rosotti et al., 2016; Chen et al., 2021), then ; Alternatively, it could be determined by the pressure scale height , both of which do not depend on viscosity. In that case, we crudely expect the wind compression to out-balance the smoothing of vortensity by viscosity at , when .
To conclude, wind-dominated discs with show detectable asymmetry in their dust signatures due to the onset of RWI, which can be distinguished from viscosity-dominated symmetric discs with , where the viscosity is large enough to damp vortices by itself. In Figure 2 the separatrix on the wind viscosity plane between these regimes can be roughly fitted by , in line with analytical predictions, since in our setup .
3.2 Strong wind regime
When the wind is relatively strong, e.g., v0dw1 (Figure 2e), profound asymmetry can be observed at the edge of a shallow and narrow gap. Shallow gaps in the traditional viscosity-dominated regime usually indicate either a small planet mass or higher viscosity. In such cases, the disc tends to exhibit more azimuthal symmetric features, as reported by Rosotti et al. (2016). We note that shallow & non-axisymmetric gaps may also be opened by eccentric planets (Chen et al., 2021), yet, the gap is usually wider in such a case. Since disc wind tends to fill up the planetary gap but also enhance asymmetry, strong wind leads to a distinct feature consisting of a shallow and narrow gap within a non-axisymmetric dust ring, and even a coexisting moderate viscosity cannot damp the asymmetry features in run v3dw1 (Figure 2f). It is worth noting that a higher viscosity parameter of could potentially dominate over wind and damp the asymmetry, resulting in a shallow and symmetric dust profile (Zhang et al., 2018). However, such a level of viscosity is inconsistent with neither theoretical predictions nor ALMA observation constraints in protoplanetary discs (Bai & Stone, 2013; Flaherty et al., 2017, 2020).
A notable consequence of a stronger wind is its impact on the dust trapping at the ring, leading to leakier traps and ultimately resulting in the centre of the dust gap becoming shallower at higher . This effect is evident from the comparison of the radial profiles of v3dw0, v3dw1, and v3dw2, as well as v4dw2 shown in Figure 2h. The pebble leakage exacerbates the challenge of reconciling the dichotomy between carbonaceous (CC) and non-carbonaceous (NC) by giant planet gap opening (e.g., Stammler et al., 2023). However, the leaked pebbles can potentially contribute to planet growth in the inner region, offering a possible explanation for the tentative correlation observed between super earth and exterior cold giant planet (Zhu & Wu, 2018).
Furthermore, the mass flux leaked by the strong wind can also alter the radial profile of the ring morphology (see Figure 2h), leading to a ring steeper on the outer edge than the inner edge. This ring morphology is similar to the pebble ring held by traffic jams without significant gas substructures (Jiang & Ormel, 2021), but differs qualitatively from the planet-induced pebble ring in purely viscous discs, which has a steeper inner edge and flatter outer edge (see Bi et al., 2023, for a recent study), or see the profile of v3dw0 in Figure 2h for a comparison.
3.3 Low viscosity v.s. Weak wind
Our simulations focus on a range of viscosity parameters , which lie below the upper limit consistent with the dust diffusivity from theory and ALMA observation. For lower viscosity, , the performance of the gas is nearly inviscid. Multiple rings and gaps can be present as demonstrated by Dong et al. (2017). The detailed investigation on the inviscid regime ( or ) is not the main focus of this work, but the fact that low diffusivity prevents the destruction of the planet-induced vortex will help the understanding of our results.
For lower values of viscosity, the gaps are much deeper and the density contrasts much higher. Another important feature of gaps carved out by circular planets in low-viscosity environments is a secondary inner gap (Dong et al., 2017; Huang et al., 2018), appearing at . We verify that we have also observed this in our low-viscosity runs, see and the central panel of Figure 2 where we label an extra black circle on top of the symbol representing runs with inner rings in the lower-left parameter space (e.g., Figure 2g, run v4dw0, as an example for synthetic maps). Since viscosity is low, the vortensity gradient cannot be smoothed even without MHD wind, and the vortex and asymmetry persist towards the end of simulations, as shown in Hammer et al. (2021); Rometsch et al. (2021) for . Eventually, we find that all cases in our simulations at low viscosity and weak wind regimes have inner gaps and asymmetries, this is consistent with the low viscosity simulations performed by previous authors (Bae et al., 2017). In this context, the vortex cannot be a distinguishing factor between wind-dominated runs or viscosity-dominated runs, but these runs may still be separable from the rest of the parameter space by the inner ring feature. We note that the dust concentration at Lagrangian points L4 or L5 in certain Moderate-wind dominate cases or Inviscid cases seem to be a minor source for asymmetry, but since they are not maintained by gas vortices, they eventually disappear when we extend these runs to timescales longer by a few hundred orbits, as found in Zhang et al. (2018); Long2022LkCa15disc. Meanwhile, vortices in the outer rings are unaffected and remain to be the most essential source of asymmetry.
4 Discussions & Conclusions
We propose a method to constrain the relative strength of the two angular momentum transfer mechanisms — turbulent viscosity and magnetised disc wind — in the planet-forming disc, by planet-induced dust continuum emission morphology. With a newly added parameterised MHD wind torque in FARGO3D (Tabone et al., 2022b; Elbakyan et al., 2022), we perform a series of hydrodynamic simulations on planet gap opening with different levels of turbulent viscosity and disc wind, create mock ALMA images at 1.25mm, and test different sensitivity and spatial resolutions with radiation transfer code RADMC-3D. Our main conclusions are summarised as follows:
-
•
We divide the different observations that may be generated by the wind-viscosity interaction into four regimes (moderate-viscosity dominated, moderate-wind dominated, strong-wind dominated, inviscid), characterised by the vortex appearance time and the disc morphology in the mock images of the ALMA continuum.
-
•
We found that when strong wind dominates , the gap-opening planet produces a distinctive shallow gap and prominent asymmetric structure (vortex), so we can directly distinguish it from the gap and ring morphology in the ALMA continuum. Wind serves as an additional radial transport for both gas and dust, making the gap shallower and altering the ring morphology.
-
•
When moderate wind dominates (where is the normalized width of the pressure bump at the outer edge of the planetary gap), the high-contrast gap and ring feature it produces are similar to those of a traditional high-viscosity disc. However, there are obvious differences between the two cases in terms of the azimuthal intensity variation along the ring, as the wind dominated case is considerably more asymmetric.
-
•
In the two fore-mentioned regimes where wind transport is dominant, vortices are easier to produce and can survive for a longer time, even in the presence of viscosity damping. We speculate this is because disc wind compression narrows the planet-generated gas surface density bump, which results in a steeper vortensity transition close to the outer edge of the gap and favours the generation of RWI.
-
•
When viscosity dominates , RWI can be damped and the disc will be highly symmetric, separable from the wind dominated discs. However, for very low viscosity , even viscous diffusion would become too weak to damp RWI, and asymmetry will be ubiquitous in inviscid discs regardless of the wind strength. Nevertheless, such discs may be distinguishable from the rest of the parameter space with the presence of an inner secondary ring.
As the major novelty of this work, we highlight the enhancement of asymmetries by the wind. However, it is to be noted that our hydrodynamic simulations are limited by the 2D geometry, and MHD wind is simply added as a torque term that drives gas radial inflow. Such an approximation fails to capture the feedback effect of gap-opening process on the initial magnetic field structure or wind profile. In a recent work by Aoyama & Bai (2023), a detailed investigation of planet-disc interaction was conducted using 3D MHD simulations. They studied the process of MHD wind transporting gas across the planetary gap, and examined the migration torque that the disc exerts on the embedded planet. It is concluded that due to the concentration of magnetic flux in the planet vicinity, the wind torque within the gap is enhanced by a factor of 3-5. While these 3D MHD simulations are sophisticated and capture additional physics, they are computationally expensive and thus cannot be run for a long timescale that is relevant to ALMA disc ages. Furthermore, dust is not incorporated into the simulations to examine sub-mm emission. In comparison, our simulations are still capable of capturing the fundamental effects of viscosity and wind on the radial flow structure to first-order: while viscosity acts to close the gap on both sides, the wind compresses the gap from outer direction. Resorting to torque prescription and 2D geometry, we have the advantage of being able to run for much longer and across a broader range of parameters. We note that Aoyama & Bai (2023, see Appendix C) also conclude that Rossby wave instability persists for longer duration than typical viscous discs, albeit they did not explore whether pressure bump compression could occur when wind is introduced into a viscous simulation. In future studies, it would be useful to incorporate more realistic prescriptions derived from sophisticated MHD simulations, such as an enhanced in the gap center, into long-term and more efficient parameter surveys such as our own. Another caveat of our study is that we focused solely on face-on detection, which is insensitive to the vertical distribution of dust. In order to generate edge-on observations of planet-induced structures in wind-dominated discs, it may be necessary to conduct additional MHD disc wind simulations that incorporate dust, to provide a more self-consistent prescription of dust scale heights. However, disc wind launched above may not significantly affect the vertical diffusion of mm-sized dust particles well-embedded in the midplane.
It is also shown by 2D & 3D non-ideal MHD simulations that the large-scale poloidal field, required to launch MHD winds in the first place, may induce gap-like substructures in the absence of an embedded planet (Riols & Lesur, 2019; Suriano et al., 2019; Cui & Bai, 2021). These substructures are also associated with pressure bumps that may act as dust traps. We anticipate that the compression of pressure bumps by wind is not limited to planet-induced pressure bumps, and therefore could lead to prolonged RWI and enhanced asymmetry in dust ring structures produced by other mechanisms as well.
Finally, we briefly discuss the asymmetry feature identified in our simulation in the context of archival ALMA observation. The very high-contrast asymmetry is hard to hide in ALMA observation. Prominent crescents (e.g., IRS 48, MWC 758, HD135344B, HD 143006; van der Marel et al., 2013; Marino et al., 2015; van der Marel et al., 2016; Pérez et al., 2018) may be relevant to the strong wind-dominated regime, albeit they are relatively rare (van der Marel et al., 2021). This fact in turn suggests that might be not common in ALMA systems, which is also expected because their typical disc lifetime would be very short (Tabone et al., 2022a, b).
However, in the moderate wind-dominant regime (§3.1), the wind-driven asymmetry can still appear on top of an overall axisymmetric ring as clump-like features. Due to the relatively limited contrast between the clump peak and bottom, the very robust detection of these clump-like features might be challenging. Meanwhile, depending on the geometry distribution of pebbles, the intensity along the major axis could be large than the minor axis of the ring simply due to the radiation transfer effect (Doi & Kataoka, 2021). More extremely, if the ring is optically thick, the ring could manifest an axisymmetry structure even with asymmetric azimuthal density profiles. We may expect to verify this in future facilities with longer wave band observation capability, e.g., the extended ALMA array (ALMA band 1, Carpenter et al., 2020; Burrill et al., 2022), the next-generation Very Large Array (ngVLA, Ricci et al., 2018) and the Square Kilometre Array (SKA, Ilee et al., 2020; Wu & Liu, 2023).
Yet, even though it is challenging, thanks to the improvement of spatial resolution of ALMA, a group of studies has pioneered identifying these clump-like structures on seemingly axisymmetric rings, e.g., the inner ring of the face-on disc HD 169142 (Macías et al., 2017; Pérez et al., 2019). It has been proposed that the inner edge of a circumbinary disc can feature these clump structures (Poblete et al., 2022). Alternatively, these clump features can also be caused by mesoscale instability triggered by dust feedback in massive rings (Huang et al., 2020). Contradictory results are obtained by Lehmann & Lin (2022), who suggest that a higher-metallicity disc can kill the short-lived vortex more easily, and smear out the asymmetry. Our result suggests it could alternatively be achieved if disc wind dominates over viscosity in the inner disc of HD 169142.
Another potential target of interest is RXJ1604.3–2130 A, where, again, the significant level () of intensity variation is observed in the continuum of the transitional disc rim (Stadler et al., 2023). It is proposed that the variation could be caused by the shadowing of an inclined inner disc, as in the near-infrared counterpart of RXJ1604.3–2130 A (Pinilla et al., 2018), while this assumption largely depends on the uncertain disc cooling.
In the end, the intensity of the continuum ring beyond the orbit of PDS 70 b and c exhibits some moderate asymmetry in the azimuthal directions (Keppler et al., 2019), which might be potentially explained by vortices at the ring location. As there are two planets confirmed in PDS 70, it will be appealing to compare our results with the PDS 70 ALMA continuum, as well as explore detailed dependencies of ring morphology on planet mass, in subsequent works.
Acknowledgements
We thank our referee, Can Cui, for a set of useful comments that improved the presentation of this work. We thank Xue-Ning Bai, Kaitlin Kratter, Sergei Nayakshin, Chris W. Ormel and Martin Pessah for their helpful comments and discussions. This research used the DiRAC Data Intensive service at Leicester, operated by the University of Leicester IT Services, which forms part of the STFC DiRAC HPC Facility (www.dirac.ac.uk).
Y.W. gratefully acknowledges Heising-Simons Foundation for funding his travel in ERES VIII and the support by the DUSTBUSTERS RISE project (grant agreement number 823823) for his secondment at the University of Arizona. M-K.L. acknowledges the funding from the National Science and Technology Council through grants 110-2112-M-001-034-, 111-2112-M-001-062-, 111-2124-M-002-013-, 112-2124-M-002-003- and an Academia Sinica Career Development Award (AS-CDA-110-M06). G.R. acknowledges support from an STFC Ernest Rutherford Fellowship (grant number ST/T003855/1) and is funded by the European Union (ERC DiscEvol, project number 101039651). Views and opinions expressed are however those of the author(s) only and do not necessarily reflect those of the European Union or the European Research Council Executive Agency. Neither the European Union nor the granting authority can be held responsible for them. V.E. acknowledges the funding from the UK Science and Technologies Facilities Council, grant No. ST/S000453/1 and the support of the Ministry of Science and Higher Education of the Russian Federation (State assignment in the field of scientific activity 2023, GZ0110/23-10-IF).
Data availability
The data obtained in our simulations can be made available on reasonable request to the corresponding author.
References
- ALMA Partnership et al. (2015) ALMA Partnership et al., 2015, ApJ, 808, L3
- Andrews (2020) Andrews S. M., 2020, ARA&A, 58, 483
- Andrews et al. (2018) Andrews S. M., et al., 2018, ApJ, 869, L41
- Aoyama & Bai (2023) Aoyama Y., Bai X., 2023, arXiv e-prints, p. arXiv:2302.01514
- Armitage et al. (2013) Armitage P. J., Simon J. B., Martin R. G., 2013, ApJ, 778, L14
- Bae et al. (2017) Bae J., Zhu Z., Hartmann L., 2017, ApJ, 850, 201
- Baehr & Zhu (2021) Baehr H., Zhu Z., 2021, ApJ, 909, 136
- Bai & Stone (2013) Bai X.-N., Stone J. M., 2013, ApJ, 769, 76
- Bai & Stone (2014) Bai X.-N., Stone J. M., 2014, ApJ, 796, 31
- Bai et al. (2016) Bai X.-N., Ye J., Goodman J., Yuan F., 2016, ApJ, 818, 152
- Baruteau et al. (2019) Baruteau C., et al., 2019, MNRAS, 486, 304
- Baruteau et al. (2021) Baruteau C., Wafflard-Fernandez G., Le Gal R., Debras F., Carmona A., Fuente A., Rivière-Marichalar P., 2021, MNRAS, 505, 359
- Benítez-Llambay & Masset (2016) Benítez-Llambay P., Masset F. S., 2016, ApJS, 223, 11
- Benítez-Llambay et al. (2019) Benítez-Llambay P., Krapp L., Pessah M. E., 2019, ApJS, 241, 25
- Bi et al. (2023) Bi J., Lin M.-K., Dong R., 2023, ApJ, 942, 80
- Birnstiel et al. (2010) Birnstiel T., Dullemond C. P., Brauer F., 2010, A&A, 513, A79
- Birnstiel et al. (2016) Birnstiel T., Fang M., Johansen A., 2016, Space Sci. Rev., 205, 41
- Burrill et al. (2022) Burrill B. P., Ricci L., Harter S. K., Zhang S., Zhu Z., 2022, ApJ, 928, 40
- Carpenter et al. (2020) Carpenter J., Iono D., Kemper F., Wootten A., 2020, arXiv e-prints, p. arXiv:2001.11076
- Chen et al. (2021) Chen Y.-X., Wang Z., Li Y.-P., Baruteau C., Lin D. N. C., 2021, ApJ, 922, 184
- Cui & Bai (2021) Cui C., Bai X.-N., 2021, MNRAS, 507, 1106
- Cui & Bai (2022) Cui C., Bai X.-N., 2022, MNRAS, 516, 4660
- Doi & Kataoka (2021) Doi K., Kataoka A., 2021, ApJ, 912, 164
- Dong et al. (2017) Dong R., Li S., Chiang E., Li H., 2017, ApJ, 843, 127
- Dubrulle et al. (1995) Dubrulle B., Morfill G., Sterzik M., 1995, Icarus, 114, 237
- Dullemond et al. (2012) Dullemond C. P., Juhasz A., Pohl A., Sereshti F., Shetty R., Peters T., Commercon B., Flock M., 2012, RADMC-3D: A multi-purpose radiative transfer tool (ascl:1202.015)
- Dullemond et al. (2018) Dullemond C. P., et al., 2018, ApJ, 869, L46
- Elbakyan et al. (2022) Elbakyan V., Wu Y., Nayakshin S., Rosotti G., 2022, MNRAS, 515, 3113
- Facchini et al. (2018) Facchini S., Pinilla P., van Dishoeck E. F., de Juan Ovelar M., 2018, A&A, 612, A104
- Flaherty et al. (2017) Flaherty K. M., et al., 2017, ApJ, 843, 150
- Flaherty et al. (2020) Flaherty K., et al., 2020, ApJ, 895, 109
- Follette et al. (2022) Follette K. B., et al., 2022, arXiv e-prints, p. arXiv:2211.02109
- Fu et al. (2014) Fu W., Li H., Lubow S., Li S., 2014, ApJ, 788, L41
- Goldreich & Tremaine (1980) Goldreich P., Tremaine S., 1980, ApJ, 241, 425
- Hammer et al. (2021) Hammer M., Lin M.-K., Kratter K. M., Pinilla P., 2021, MNRAS, 504, 3963
- Hasegawa et al. (2017) Hasegawa Y., Okuzumi S., Flock M., Turner N. J., 2017, ApJ, 845, 31
- Huang et al. (2018) Huang J., et al., 2018, ApJ, 869, L42
- Huang et al. (2020) Huang P., Li H., Isella A., Miranda R., Li S., Ji J., 2020, ApJ, 893, 89
- Huélamo et al. (2022) Huélamo N., et al., 2022, A&A, 668, A138
- Ilee et al. (2020) Ilee J. D., Hall C., Walsh C., Jiménez-Serra I., Pinte C., Terry J., Bourke T. L., Hoare M., 2020, MNRAS, 498, 5116
- Jiang & Ormel (2021) Jiang H., Ormel C. W., 2021, MNRAS, 505, 1162
- Jorquera et al. (2021) Jorquera S., et al., 2021, AJ, 161, 146
- Keppler et al. (2019) Keppler M., et al., 2019, A&A, 625, A118
- Kimmig et al. (2020) Kimmig C. N., Dullemond C. P., Kley W., 2020, A&A, 633, A4
- Lehmann & Lin (2022) Lehmann M., Lin M. K., 2022, A&A, 658, A156
- Lesur (2021) Lesur G. R. J., 2021, A&A, 650, A35
- Li et al. (2001) Li H., Colgate S. A., Wendroff B., Liska R., 2001, ApJ, 551, 874
- Lin & Papaloizou (1986) Lin D. N. C., Papaloizou J., 1986, ApJ, 307, 395
- Lin & Papaloizou (1993) Lin D. N. C., Papaloizou J. C. B., 1993, in Levy E. H., Lunine J. I., eds, Protostars and Planets III. pp 749–835
- Lodato et al. (2017) Lodato G., Scardoni C. E., Manara C. F., Testi L., 2017, MNRAS, 472, 4700
- Lodato et al. (2019) Lodato G., et al., 2019, MNRAS, 486, 453
- Long et al. (2018) Long F., et al., 2018, ApJ, 869, 17
- Long et al. (2019) Long F., et al., 2019, ApJ, 882, 49
- Long et al. (2022) Long F., et al., 2022, ApJ, 931, 6
- Lovelace et al. (1999) Lovelace R. V. E., Li H., Colgate S. A., Nelson A. F., 1999, ApJ, 513, 805
- Macías et al. (2017) Macías E., Anglada G., Osorio M., Torrelles J. M., Carrasco-González C., Gómez J. F., Rodríguez L. F., Sierra A., 2017, ApJ, 838, 97
- Marino et al. (2015) Marino S., Casassus S., Perez S., Lyra W., Roman P. E., Avenhaus H., Wright C. M., Maddison S. T., 2015, ApJ, 813, 76
- Mathis et al. (1977) Mathis J. S., Rumpl W., Nordsieck K. H., 1977, ApJ, 217, 425
- Miotello et al. (2022) Miotello A., Kamp I., Birnstiel T., Cleeves L. I., Kataoka A., 2022, arXiv e-prints, p. arXiv:2203.09818
- Miranda et al. (2017) Miranda R., Li H., Li S., Jin S., 2017, ApJ, 835, 118
- Nakagawa et al. (1986) Nakagawa Y., Sekiya M., Hayashi C., 1986, Icarus, 67, 375
- Ono et al. (2016) Ono T., Muto T., Takeuchi T., Nomura H., 2016, ApJ, 823, 84
- Paardekooper & Mellema (2006) Paardekooper S. J., Mellema G., 2006, A&A, 453, 1129
- Paardekooper et al. (2022) Paardekooper S.-J., Dong R., Duffell P., Fung J., Masset F. S., Ogilvie G., Tanaka H., 2022, arXiv e-prints, p. arXiv:2203.09595
- Pérez et al. (2018) Pérez L. M., et al., 2018, ApJ, 869, L50
- Pérez et al. (2019) Pérez S., Casassus S., Baruteau C., Dong R., Hales A., Cieza L., 2019, AJ, 158, 15
- Pinilla et al. (2018) Pinilla P., et al., 2018, ApJ, 868, 85
- Pinte et al. (2016) Pinte C., Dent W. R. F., Ménard F., Hales A., Hill T., Cortes P., de Gregorio-Monsalvo I., 2016, ApJ, 816, 25
- Poblete et al. (2022) Poblete P. P., et al., 2022, MNRAS, 510, 205
- Ricci et al. (2018) Ricci L., Liu S.-F., Isella A., Li H., 2018, ApJ, 853, 110
- Riols & Lesur (2019) Riols A., Lesur G., 2019, A&A, 625, A108
- Rometsch et al. (2021) Rometsch T., Ziampras A., Kley W., Béthune W., 2021, A&A, 656, A130
- Rosotti (2023) Rosotti G. P., 2023, New Astron. Rev., 96, 101674
- Rosotti et al. (2016) Rosotti G. P., Juhasz A., Booth R. A., Clarke C. J., 2016, MNRAS, 459, 2790
- Rosotti et al. (2020) Rosotti G. P., Teague R., Dullemond C., Booth R. A., Clarke C. J., 2020, MNRAS, 495, 173
- Shakura & Sunyaev (1973) Shakura N. I., Sunyaev R. A., 1973, A&A, 24, 337
- Stadler et al. (2023) Stadler J., et al., 2023, A&A, 670, L1
- Stammler et al. (2023) Stammler S. M., Lichtenberg T., Drążkowska J., Birnstiel T., 2023, A&A, 670, L5
- Suriano et al. (2019) Suriano S. S., Li Z.-Y., Krasnopolsky R., Suzuki T. K., Shang H., 2019, MNRAS, 484, 107
- Suzuki et al. (2016) Suzuki T. K., Ogihara M., Morbidelli A., Crida A., Guillot T., 2016, A&A, 596, A74
- Tabone et al. (2022a) Tabone B., Rosotti G. P., Lodato G., Armitage P. J., Cridland A. J., van Dishoeck E. F., 2022a, MNRAS, 512, L74
- Tabone et al. (2022b) Tabone B., Rosotti G. P., Cridland A. J., Armitage P. J., Lodato G., 2022b, MNRAS, 512, 2290
- Toci et al. (2023) Toci C., Lodato G., Livio F. G., Rosotti G., Trapman L., 2023, MNRAS, 518, L69
- Trapman et al. (2020) Trapman L., Rosotti G., Bosman A. D., Hogerheijde M. R., van Dishoeck E. F., 2020, A&A, 640, A5
- Trapman et al. (2022) Trapman L., Tabone B., Rosotti G., Zhang K., 2022, ApJ, 926, 61
- Villenave et al. (2020) Villenave M., et al., 2020, A&A, 642, A164
- Weber et al. (2019) Weber P., Pérez S., Benítez-Llambay P., Gressel O., Casassus S., Krapp L., 2019, ApJ, 884, 178
- Wu & Liu (2023) Wu Y., Liu S.-F., 2023, in prep
- Youdin & Lithwick (2007) Youdin A. N., Lithwick Y., 2007, Icarus, 192, 588
- Zagaria et al. (2022) Zagaria F., Rosotti G. P., Clarke C. J., Tabone B., 2022, MNRAS, 514, 1088
- Zhang et al. (2018) Zhang S., et al., 2018, ApJ, 869, L47
- Zhou et al. (2022) Zhou T., Deng H.-P., Chen Y.-X., Lin D. N. C., 2022, ApJ, 940, 117
- Zhu & Wu (2018) Zhu W., Wu Y., 2018, AJ, 156, 92
- Zhu et al. (2011) Zhu Z., Nelson R. P., Hartmann L., Espaillat C., Calvet N., 2011, ApJ, 729, 47
- Zhu et al. (2015) Zhu Z., Stone J. M., Bai X.-N., 2015, ApJ, 801, 81
- van der Marel et al. (2013) van der Marel N., et al., 2013, Science, 340, 1199
- van der Marel et al. (2016) van der Marel N., Cazzoletti P., Pinilla P., Garufi A., 2016, ApJ, 832, 178
- van der Marel et al. (2021) van der Marel N., et al., 2021, AJ, 161, 33