Trillion Dollar Words: A New Financial Dataset, Task & Market Analysis∗
Abstract
Monetary policy pronouncements by Federal Open Market Committee (FOMC) are a major driver of financial market returns. We construct the largest tokenized and annotated dataset of FOMC speeches, meeting minutes, and press conference transcripts in order to understand how monetary policy influences financial markets. In this study, we develop a novel task of hawkish-dovish classification and benchmark various pre-trained language models on the proposed dataset. Using the best-performing model (RoBERTa-large), we construct a measure of monetary policy stance for the FOMC document release days. To evaluate the constructed measure, we study its impact on the treasury market, stock market, and macroeconomic indicators. Our dataset, models, and code are publicly available on Huggingface and GitHub under CC BY-NC 4.0 license111The fine-tuned model and data are available on the Huggingface. The code is available on FinTech Lab GitHub..
1 Introduction
On August 26th, 2022, FOMC Chair Jerome H. Powell gave an 8-minute long speech at Jackson Hole which immediately resulted in an almost $3 Trillion USD decline in U.S. equity market value that day. The speech was followed by more than $6 Trillion USD loss in equity valuation over the next 3 days. Drastic market shifts to the Fed’s pronouncements indicate just how important the FOMC communications have become and highlight the need for a model which can capture the policy stance from Fed-related text.
The Federal Open Market Committee (FOMC) is a federal organization responsible for controlling U.S.’s open market operations and setting interest rates. It tries to achieve its two main objectives of price stability and maximum employment by controlling the money supply in the market. Given the market condition (employment rate and inflation), the Fed either increases (dovish), decreases (hawkish), or maintains the money supply222Fed increases the money supply by lowering interest rates and decreases the money supply by increasing interest rates or by other means necessary. More detail on this can be found in the annotation guide. (neutral). To understand the influence the FOMC has on the different financial markets, we need to extract its monetary policy stance and the corresponding magnitude from official communications.
Utilizing the traditional sentiment analysis model, which classifies text into positive vs negative, one can’t extract policy stance. A sentence that has the word "increase" could either be dovish or hawkish without a clear negative connotation. For example, the word "increase" with the word "employment" means the economy is doing well, but the word "increase" with the word "inflation" is negative for the economy. Current SOTA finance domain-specific language models (Araci, 2019; Shah et al., 2022) trained for sentiment analysis find both cases to be positive, which is inaccurate. The performance analysis for FinBERT (Araci, 2019) model is provided in Appendix A. This problem creates a need to develop a new task for hawkish vs dovish classification accompanied by high-quality annotated data.
Given the lack of annotated data, computational linguistic work related to FOMC text in the literature (Rozkrut et al., 2007; Zirn et al., 2015; Hansen and McMahon, 2016; Rohlfs et al., 2016; Hansen et al., 2018; Nakamura and Steinsson, 2018; Cieslak et al., 2019; Schmeling and Wagner, 2019; Tsukioka and Yamasaki, 2020; Ehrmann and Talmi, 2020; Frunza, 2020; Gorodnichenko et al., 2021; Matsui et al., 2021; Mathur et al., 2022) so far has been limited to unsupervised and rule-based models. These rule-based models don’t perform well on the hawkish-dovish classification task, which we will use as a baseline in performance analysis. Additionally, we conduct a benchmark of the zero-shot ChatGPT model using the annotated dataset to gain insights into the significance of fine-tuning on such data. In this work, we collect text data (speech transcripts, press conference transcripts, and meeting minutes) from the FOMC over the period 1996-2022 and annotate a sample of each data type.
We not only create new datasets and tackle the task of building a hawkish-dovish classifier, but also test the performance of various models starting from rule-based to fine-tuned large PLMs. As sentences presented in FOMC text sometimes have two sub-sentences that have counterfactual information to tone down the stance, we employ a simple sentence-splitting scheme as well. We also construct the aggregate monetary policy stance and show its validity by looking at its performance in predicting various financial market variables.
Through our work, we contribute to the literature in the following way:
-
•
We show that the traditional (rule-based) approach practiced in finance and economic literature is a rudimentary way to measure monetary policy stance from the text document.
-
•
We introduce a new task to classify sentences into hawkish vs dovish as opposed to positive vs negative sentence classification for monetary policy text.
-
•
We build comprehensive, clean, tokenized, and annotated open-source datasets for FOMC meeting minutes, press conferences, and speeches with detailed meta information.
-
•
We develop an aggregate monetary policy stance measure and validate its performance in predicting various economic and financial indicators.
2 Related Work
NLP in Finance
Over the last decade behind the evolution of NLP, there has been a growing literature on the applications of NLP techniques in Finance (Loughran and McDonald, 2011; Sohangir et al., 2018; Xing et al., 2018; Chava et al., 2022). The majority of the research takes advantage of news articles (Vargas et al., 2017; Caldara and Iacoviello, 2022), SEC filings (Loughran and McDonald, 2011; Chava and Paradkar, 2016; Alanis et al., 2022), or earnings conference calls (Bowen et al., 2002; Bushee et al., 2003; Chava et al., 2019; Li et al., 2020). Development of finance domain-specific language models (Araci, 2019; Yang et al., 2020; Liu et al., 2020) have pushed the current benchmarks further. Recent work of Shah et al. (2022) proposes a set of heterogeneous benchmarks for the financial domain and shows SOTA performance using their proposed language model, but it doesn’t include macroeconomics-based tasks.
FOMC and Text Analysis
A study on communications from the central banks of the Czech Republic, Hungary, and Poland by Rozkrut et al. (2007) suggests that words from central banks affect the market but the effect varies based on communication style. Other various studies (Tobback et al., 2017; Hansen et al., 2018; Nakamura and Steinsson, 2018; Cieslak et al., 2019; Schmeling and Wagner, 2019; Tsukioka and Yamasaki, 2020; Ehrmann and Talmi, 2020; Bennani et al., 2020; Gorodnichenko et al., 2021) also point to a similar conclusion that the communication from the central banks moves the market, but they don’t leverage the power of the transformer-based model available at their disposal.
Many articles in the literature use LDA to analyze various texts released by Fed. Rohlfs et al. (2016) uses LDA on the FOMC meeting statements to predict the fed fund rate and long-term treasury rate. Hansen and McMahon (2016) use an LDA-based topic modeling on FOMC-released text to understand how forward guidance affects the market and economic variables. In their study, they only used statements released post-meeting and suggest that the use of meeting minutes and speeches may offer greater insight. Jegadeesh and Wu (2017) also uses LDA to analyze meeting minutes. They suggest that even though meeting minutes are released a few weeks after the actual meeting, the minutes still carry pertinent market-moving information.
In recent work by Mathur et al. (2022), they created a multimodal dataset (MONOPOLY) from video press conferences for multimodal financial forecasting. The MONOPOLY dataset is comprehensive and not only covers text but also utilizes audio and video features. Yet, it misses two critical economic downturn periods of the last two decades: The DotCom Bubble Burst of 2000-2002 and the Global Financial Crises of 2007-2008. Matsui et al. (2021) used word embedding to extract semantic changes in the monetary policy documents. Zirn et al. (2015) used the graph clustering method to generate the hawkish-dovish stance of monetary policy due to the dearth of annotated data. Frunza (2020) developed an unsupervised methodology to extract various information from FOMC post-meeting statements.
3 Dataset
3.1 FOMC Data
The datasets we build are composed of three different types of data: meeting minutes, press conference transcripts, and speeches from the FOMC. Meeting minutes are defined as reports derived from the eight annually scheduled meetings of the FOMC. Press conference transcripts, meanwhile, are transcripts of the prepared remarks, followed by the Q&A session between the Federal Reserve chair and press reporters. Lastly, speeches were defined as any talk given by a Federal Reserve official. We limit our datasets to an end release date of October 15th, 2022, and attempt to collect as far back as possible for each category prior to this date.
The meeting minutes and speeches spanned from a release period of January 1st, 1996 to October 15th, 2022. Press conferences are a more recent phenomenon and the data aggregated stretched from April 27th, 2011 to October 15th, 2022. We obtained the data by leveraging BeautifulSoup, Selenium, and manual downloading from http://www.federalreserve.gov/. Regex tools were used to clean the data, which was stored in CSV or Excel format for processing. Sentence tokenization, using the library NLTK Bird et al. (2009) was done and datasets for each data category were initialized.
FOMC Raw Text Data
The overview of our initial raw text dataset is presented in Panel A of Table 3. Initial observations show that meeting minutes and speeches composed the bulk of our data, due to the recency of press conference transcripts. In addition, we also isolated only sentences where the speaker is designated as the Federal Reserve chair and the sentence was not a question in press conference transcripts, so this also served to reduce the data size. Across all forms of data, we had higher average words per sentence than the typical English language sentence, which averages 15 to 20 words Cutts (2020).
Our initial raw text data encompassed decades worth of crucial FOMC statements, however, a plethora of noise persisted in the data. Unrelated sentences riddled the datasets and a filter was needed to isolate key sentences relevant to changes in the federal reserve’s monetary policy stance. In addition, the number of sentences in the raw dataset was too vast to manually label, so a sampling procedure was needed.
Data & Title Filtration
As a result of data noise, a dictionary filter was developed to isolate sentences that would prove to be meaningful and allow us to determine monetary policy stance. The criteria for the filter was based on the dictionary developed by Gorodnichenko et al. (2021). Any sentence that contained an instance of the words outlined in panel A1 or B1 in Table 1 would be kept, while anything else would be filtered out. The sentences kept were considered "target" sentences or textual data that we consider pertinent and later used to sample from and annotate.
| Panel A1 | Panel B1 |
|---|---|
| inflation expectation, interest rate, bank rate, fund rate, price, economic activity, inflation, employment | unemployment, growth, exchange rate, productivity, deficit, demand, job market, monetary policy |
| Panel A2 | Panel B2 |
| anchor, cut, subdue, decline, decrease, reduce, low, drop, fall, fell, decelerate, slow, pause, pausing, stable, non-accelerating, downward, tighten | ease, easing, rise, rising, increase, expand, improve, strong, upward, raise, high, rapid |
| Panel C | |
| weren’t, were not, wasn’t, was not, did not, didn’t, do not, don’t, will not, won’t |
Our dictionary filter was also applied to speech data. Speech data was the largest dataset derived from web scraping, however, speeches contained the most noise, owing to many non-monetary policy speeches. Unlike the meeting minutes and press conference transcripts, speech data was accompanied with a title, so to isolate only relevant FOMC speeches to sample from, we applied the dictionary filter discussed in Table 1 onto the title of each speech. We justify this procedure in Table 2 as this methodology results in the greatest "target" sentence per file. Overall, the filtration process isolated relevant files and "target" sentences in our raw data and set the stage for later sampling. The filter’s impact on the raw data is presented in Panel B of Table 3.
| Type | # Files | # Sentences | # Target Sentences | # Target Sentences per File |
|---|---|---|---|---|
| All Speech Titles | 1,026 | 108,463 | 27,221 | 26.53 |
| Non-Filtered Speech Titles | 825 | 84,833 | 14,756 | 17.89 |
| Filtered Speech Titles | 201 | 23,630 | 12,465 | 62.01 |
| Event | Years | # Files | # Sentences | # Words | Avg. Words in Sentence |
|---|---|---|---|---|---|
| Panel A: Pre-Filter | |||||
| Meeting Minutes | 1996 - 2022 | 214 | 44,923 | 1,346,674 | 29.98 |
| Meeting Press Conferences | 2011-2022 | 63 | 19,068 | 468,941 | 24.59 |
| Speeches | 1996-2022 | 1,026 | 108,463 | 3,222,285 | 29.71 |
| Panel B: Post-Filter | |||||
| Meeting Minutes | 1996 - 2022 | 214 | 20,618 | 692,759 | 33.60 |
| Meeting Press Conferences | 2011-2022 | 63 | 5,086 | 160,574 | 31.57 |
| Speeches | 1996-2022 | 201 | 12,465 | 447,974 | 37.62 |
Sampling and Manual Annotation
As our data was unlabeled, our analysis necessitated the usage of manual labeling. To efficiently develop a manually labeled dataset, sampling was required. Our sampling procedure was to extract 5 random sentences and compile a larger data set. If fewer than 5 sentences were present in the file, all sentences were added. This sampling procedure resulted in a 1,070-sentence Meeting Minutes dataset, a 315-sentence Press Conference dataset, and a 994-sentence Speech dataset. For the labeling process, sentences were categorized into three classes (0: Dovish, 1: Hawkish, and 2: Neutral). We annotate each category of the data as a model trained on various categories as a model trained on the same category of data does not perform optimally. We provide evidence for this claim in Appendix B.
Dovish sentences were any sentence that indicates future monetary policy easing. Hawkish sentences were any sentence that would indicate a future monetary policy tightening. Meanwhile, neutral sentences were those with mixed sentiment, indicating no change in the monetary policy, or those that were not directly related to monetary policy stance.
The labeling was conducted by two different annotators and done independently to reduce potential labeling bias. Each annotator’s labeling was compared against each other and validated to ensure the consistency of the labeling results. The detail on the annotation agreement is provided in Appendix C.1. The labeling was conducted according to a predefined annotation guide, which is provided in Appendix C.2. The guide is broken down into key sections such as economic status, dollar value change, energy/house prices, future expectations, etc.
Sentence Splitting
A common occurrence in the labeling process was the existence of intentional mixed tone. The Federal Reserve by purpose serves to maintain financial/economic stability and any statement they make is projected in a moderating manner to reduce the chance of excess market reaction. As a result, the Fed is known to project a stance but often accompanies this with a moderating statement that serves as a counterweight to the original stance. This produces a greater occurrence of neutral sentences. To address this possibility, we instituted sentence splitting to separate the differing stances. Initially, we implemented the lexicon-based package SentiBigNomics (Consoli et al., 2022) for sentence splitting, but it resulted in poor performance, causing us to pivot our approach. We developed a custom sentence-splitting method based on keywords. In Fed statements, the counter-statements are produced after a connective contrasting word. We carried sentence splits at the presence of the following keywords in a given statement: "but", "however", "even though", "although", "while", ";". A sentence split was valid if each split segment contained a key word present in Table 1. Statistics on the dataset before and after splitting are provided in Table 4.
| Event | Before split | After split |
|---|---|---|
| Meeting Minutes | 1,070 | 1,132 |
| Meeting Press Conferences | 315 | 322 |
| Speeches | 994 | 1,026 |
| Total | 2,379 | 2,480 |
3.2 Economic Data
CPI and PPI
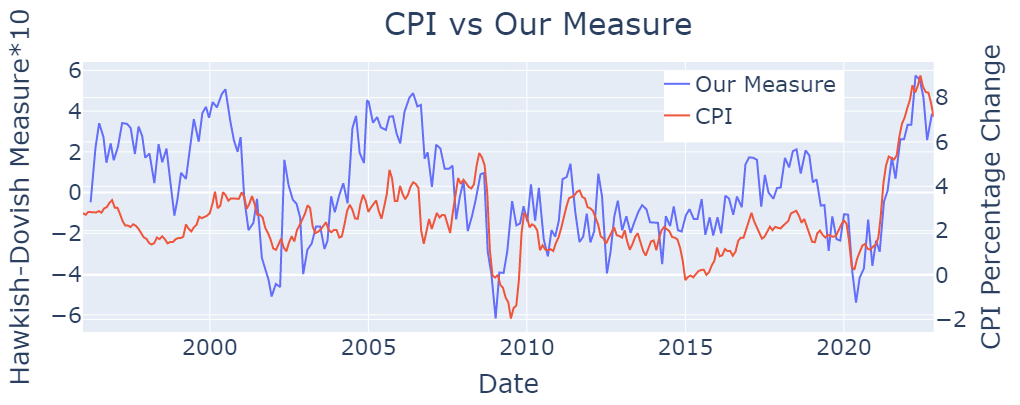
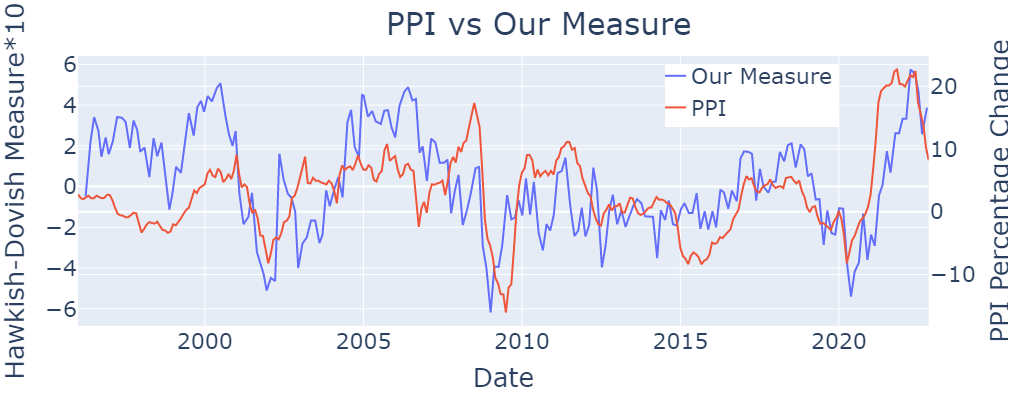
We collect Consumer Price Index (CPI) data, and Producer Price Index (PPI) data from FRED333https://fred.stlouisfed.org. The data is available at the monthly frequency for the first day of each month. Throughout the paper, we use percentage change from last year as CPI and PPI inflation measures.
US Treasury
We collect US treasury yield data for different maturities from the U.S. Department of the Treasury444https://home.treasury.gov. It provides a daily yield of bonds for various maturities.
QQQ Index
We collect the adjusted closing index price of QQQ from Yahoo Finance555https://finance.yahoo.com/quote/QQQ/history?p=QQQ. It contains daily QQQ index data since March 9, 1999.
4 Models
4.1 Rule-Based
In financial literature, rule-based classification has been the norm. Many of these rule-based systems work by classifying based on the presence of a combination of keywords. Gorodnichenko et al. (2021) in particular highlighted the effectiveness of this approach by classifying sentences as dovish or hawkish based on the combination of financial-related nouns and verbs in set panels in a given sentence. We have applied Gorodnichenko et al.’s financial word dictionary rule-based approach to our developed datasets. In Table 1, a sentence is considered dovish if it contains words present in panels A1 and A2 or B1 and B2. Otherwise, if it contains words present in A1 and B2 or A2 and B1 are considered hawkish. If a given sentence contains a word from panel C we reverse our initial classification, so dovish becomes hawkish and vice versa. We aim to capture and measure the effectiveness of the rule-based approach against our dataset to provide a benchmark against the deep learning models we apply later. We apply this rule-based approach on testing datasets that we derive from each dataset on an 80:20 training-test split.
4.2 LSTM & Bi-LSTM
Long short-term memory (LSTM) is a recurrent neural network structure utilized for classification problems. The Bi-LSTM is a variation of an LSTM, which takes input bidirectionally. We apply both an LSTM and a Bi-LSTM to our developed datasets to gauge the effectiveness of RNNs in monetary stance classification. We instituted an 80:20 training-validation split to derive our initial training and validation datasets. A vocabulary was developed for both models against the training dataset for the purpose of vectorization. The encoding process worked by first initializing a tokenizer that eliminated all punctuation, normalized all sentences to lowercase, and splits sentences into word tokens. We limit the vocabulary size to 2,000 and any words outside the vocabulary were replaced with a placeholder token. A vocabulary size of 2,000 covers more than 99% of words in MM and PC text and covers around 91% in SP text. The lower coverage for speeches is due to the wide variety of miscellaneous topics outside of the scope of monetary policy. Our vocabulary allowed us to convert each sentence into a word vector by mapping each word to a corresponding numerical value present in the dictionary. Each word vector size was set to the length of the longest sentence present in the training dataset, and padding was done to meet the required vector size. We applied this encoding process to the training, testing, and validation datasets. Upon the complexion of vectorization, the word vectors were passed into our single-layer LSTM (32,379 parameters) and single-layer Bi-LSTM (32,735 parameters) models. Masking was also configured to true to ignored padded data and dropout was added to reduce potential over-fitting. We ran each model at varying epochs (10, 20, 30) and batch sizes (4, 8, 16, 32). Implementation of models was done using Tensorflow (Abadi et al., 2016) on an NVIDIA RTX A6000 GPU.
4.3 PLMs
To set a benchmark, we include a range of small and large transformer-based models in our study. For small models, we use BERT (Devlin et al., 2018), FinBERT (Yang et al., 2020), FLANG-BERT (Shah et al., 2022), FLANG-RoBERTa (Shah et al., 2022), and RoBERTa (Liu et al., 2019). In the large model category, we include BERT-large (Devlin et al., 2018) and RoBERTa-large (Liu et al., 2019). We do not perform any pre-training on these models before employing them for fine-tuning to avoid overfitting on FOMC text. For each model, we find best hyper-parameters by performing a grid search on four different learning rates (1e-4, 1e-5, 1e-6, 1e-7) and four different batch sizes (32, 16, 8, 4). We conduct all experiments using PyTorch (Paszke et al., 2019) on NVIDIA RTX A6000 GPU. Each model was initialized with the pre-trained version on the Transformers library of Huggingface (Wolf et al., 2020).
4.4 ChatGPT
In order to provide the performance benchmark of the current SOTA generative LLM, we measure the zero-shot performance of ChatGPT. We use the "gpt-3.5-turbo" model with 1000 max tokens for output, and a 0.0 temperature value. All the API calls were made on either May 3rd, 2023, or May 4th, 2023. We use the following zero-shot prompt:
"Discard all the previous instructions. Behave like you are an expert sentence classifier. Classify the following sentence from FOMC into ‘HAWKISH’, ‘DOVISH’, or ‘NEUTRAL’ class. Label ‘HAWKISH’ if it is corresponding to tightening of the monetary policy, ‘DOVISH’ if it is corresponding to easing of the monetary policy, or ‘NEUTRAL’ if the stance is neutral. Provide the label in the first line and provide a short explanation in the second line. The sentence: {sentence}"
| Model | MM | MM-S | PC | PC-S | SP | SP-S | Combined | Combined-S |
|---|---|---|---|---|---|---|---|---|
| Rule-Based | 0.5216 | 0.5200 | 0.4927 | 0.5114 | 0.5449 | 0.5388 | 0.4966 | 0.5165 |
| (0.0432) | (0.0298) | (0.0387) | (0.0661) | (0.0286) | (0.0038) | (0.0041) | (0.0064) | |
| LSTM | 0.4982 | 0.5192 | 0.3373 | 0.2877 | 0.4828 | 0.5352 | 0.4917 | 0.5247 |
| (0.0396) | (0.0315) | (0.0172) | (0.1287) | (0.0564) | (0.045) | (0.027) | (0.0251) | |
| Bi-LSTM | 0.4906 | 0.5175 | 0.3321 | 0.3186 | 0.5296 | 0.5106 | 0.5387 | 0.5089 |
| (0.0679 | (0.0310) | (0.0876) | (0.0853) | (0.0334) | (0.0712) | (0.0213) | (0.0608) | |
| BERT-base-uncased | 0.5889 | 0.6115 | 0.4676 | 0.5227 | 0.6151 | 0.6007 | 0.6310 | 0.6360 |
| (0.0525) | (0.0419) | (0.0883) | (0.0472) | (0.0201) | (0.0524) | (0.0086) | (0.0225) | |
| FinBERT-base | 0.6173 | 0.6486 | 0.4631 | 0.5452 | 0.6595 | 0.6291 | 0.6325 | 0.6304 |
| -uncased | (0.0413) | (0.0126) | (0.0368) | (0.0587) | (0.0053) | (0.0300) | (0.0172) | (0.0217) |
| FLANG-BERT-base | 0.6334 | 0.6360 | 0.4647 | 0.5132 | 0.6412 | 0.6355 | 0.6307 | 0.6443 |
| -uncased | (0.0258) | (0.0201) | (0.0726) | (0.0830) | (0.0308) | (0.0489) | (0.0192) | (0.0117) |
| FLANG-RoBERTa | 0.6446 | 0.6854 | 0.4995 | 0.4666 | 0.6745 | 0.5561 | 0.6618 | 0.6348 |
| -base | (0.0185) | (0.0035) | (0.0413) | (0.0732) | (0.0141) | (0.1559) | (0.0065) | (0.0021) |
| RoBERTa-base | 0.6741 | 0.6752 | 0.5371 | 0.5527 | 0.6885 | 0.6725 | 0.6755 | 0.6981 |
| (0.0096) | (0.0119) | (0.0102) | (0.0589) | (0.0261) | (0.0147) | (0.0267) | (0.0097) | |
| BERT-large-uncased | 0.6843 | 0.6560 | 0.4013 | 0.5231 | 0.6208 | 0.6434 | 0.6579 | 0.6619 |
| (0.0486) | (0.0058) | (0.0752) | (0.0275) | (0.0581) | (0.0076) | (0.0195) | (0.0123) | |
| RoBERTa-large | 0.7150 | 0.7128 | 0.5517 | 0.5346 | 0.7169 | 0.7049 | 0.7171 | 0.7113 |
| (0.0096) | (0.0137) | (0.0526) | 0.0580 | (0.0125) | (0.0298) | (0.0164) | (0.0106) | |
| ChatGPT-3.5-Turbo | 0.5671 | 0.5997 | 0.4869 | 0.5222 | 0.6446 | 0.6120 | 0.5872 | 0.5868 |
| (0.0359) | (0.0186) | (0.0370) | (0.0882) | (0.0377) | (0.0153) | (0.0199) | (0.0131) |
| Chair (Years) | Correlation (CPI) | Correlation (PPI) | Avg. Delay (days) |
| Full Sample (1996-2022) | 0.54(1.2e-17) | 0.45(4.1e-12) | 29.78 |
| Greenspan (1996-2006) | 0.46(2.0e-5) | 0.42(8.4e-5) | 44.15 |
| Bernanke (2006-2014) | 0.51(1.9e-5) | 0.40(1.0e-3) | 20.97 |
| Yellen (2014-2018) | 0.55(1.2e-3) | 0.57(6.2e-4) | 21.00 |
| Powell (2018-2022) | 0.81(8.4e-10) | 0.71(9.9e-7) | 21.13 |
| Speeches (1996-2022) | 0.58(2.6e-19) | 0.39(1.2e-8) | 0 |
| Press Conferences (2011-2022) | 0.78(6.3e-14) | 0.68(8.6e-10) | 0 |
5 Results and Analysis
In this section, we evaluate and benchmark different NLP models on the hawkish vs dovish classification task that we created. For all models and datasets, we used training and testing data based on an 80:20 split. Upon this split, we institute another 80:20 split on the training data to generate our final training and validation data. We use the best-performing model (RoBERTa) to generate a document (event) level measure of hawkish tone. We then validate the generated measure by looking at its relation with the inflation indicators and the US treasury. We also look at the performance of a simple trading strategy based on the generated measure.
5.1 Model Performance
We ran all models listed in the previous section on three different categories and combined data. For each dataset, we train and test each model on both the before-split and after-split versions of sentences. For each model, we use three different seeds (5768, 78516, 944601) and calculate the average weighted F1 scores. The results for best hyper-parameters are listed in Table 5.
Rule-Based
As expected the rule-based model doesn’t perform very well. The rule-based approach optimizes the time needed for classification, but sacrifices the nuance of complex sentences, which necessitate context. It gives an F1 score of around 0.5 for nearly all datasets. The method sets a good baseline for the dataset as it’s still widely used in econ literature.
LSTM & Bi-LSTM
Although the LSTM and Bi-LSTM models are able to utilize greater context for classification, they did not perform significantly better than the initial rule-based approach. As seen across all data categories, the RNN models performed marginally the same. The LSTM and Bi-LSTM performances largely differed between the data categories. They performed worst when applied to the press conference datasets, a discrepancy caused by the small size of the dataset. In fact, in the smaller press conference datasets, the rule-based performed better than the expected RNN approach. Unlike rule-based approaches, neural network classification requires a large database to train from to improve accuracy. Concurrently, the recurrent neural networks worked best when applied to the meeting minutes and speech datasets. When compared against all data categories, the Bi-LSTM did not perform significantly better than the LSTM itself. The RNNs are effective in sentence classification, yet their limited success with FOMC sentences demonstrates the need for a transformer-based model.
PLMs
Finetuned PLMs outperform rule-based model and LSTM models by a significant margin. In base size, RoBERTa-base outperforms all other models on all datasets except after-split meeting minutes data (MM-S). On PC, FLANG-RoBERTa performs best. A future study using ablation states of models to understand why the finance domain-specific language models don’t outperform RoBERTa and how they can be improved could be fruitful. In large category and overall, RoBERTa large provide the best performance across all categories except PC-S.
We note that sentence splitting does help improve performance for meeting minutes and press conference data, but it doesn’t help with speech data. Also, on average improvement from sentence splitting is higher with the base models compared to large models. The goal of sentence splitting is to not improve the performance of the classification task but to better measure, the document-level monetary policy stance constructed in the next section. In order to make sure that there is no look-ahead bias in our performance, we perform a robustness check in Appendix D.
ChatGPT
Zero-shot ChatGPT outperforms both rule-based and fine-tuned RNN-based (LSTM & Bi-LSTM) models. We note that the ChatGPT can’t be considered a good baseline as it has many issues highlighted by Rogers et al. (2023). ChatGPT model with zero-shot underperforms fine-tuned PLMs across all datasets. The finding here is in line with the survey done by Pikuliak (2023), which finds that zero-shot ChatGPT fails to outperform fine-tuned models on more than 77% of NLP tasks.
5.2 Hawkish Measure Construction
We use the RoBERTa-large model finetuned on the combined data to label all the filtered sentences in the meeting minutes, speeches, and press conferences. We then use labeled sentences in each document to generate a document-level measure of hawkishness for document using the following formula:
where is document level measure, is number of hawkish sentences in document , is number of dovish sentences in document , and is the total number of filtered sentences.
5.3 Market Analysis
Our Measure with CPI and PPI
To understand how quick the Fed is in reacting to inflation or deflation we use monthly CPI and PPI data and overlay our measure. As observed in Figure 1, our measure based on meeting minutes captures both the inflation and deflation period pretty well. It also shows that when Fed reacts quickly (2001 and 2008) it controls inflation and deflation better.
We also look at the correlation of our measure with the CPI and PPI percentage change. As reported in Table 6, for all three data classes we find a statistically significant positive correlation. We also observe that the correlation increases over time as Fed is communicating its policy stance better to the public in recent years. As part of better communication, the Fed has started hosting press conferences at every alternate meeting starting in 2011 and every meeting starting in 2019. We refer readers to Coibion et al. (2022) for a detailed discussion on Fed communication shift over time.
| Maturity | Constant () | Beta () |
| Panel A: Meeting Minutes (1996-2022) | ||
| 3 Month | 1.94*** | 4.91*** |
| 1 Year | 2.17*** | 5.23*** |
| 10 Year | 3.54*** | 3.12*** |
| Panel B: Speeches (1996-2022) | ||
| 3 Month | 2.64*** | 1.69** |
| 1 Year | 2.82*** | 2.21*** |
| 10 Year | 3.81*** | 1.79*** |
| Panel C: Press Conf. (2011-2022) | ||
| 3 Month | 0.76*** | 1.27** |
| 1 Year | 0.98*** | 1.97*** |
| 10 Year | 2.10*** | 1.10** |
US Treasury Market
is highly sensitive to monetary policy changes. We validate the power of our measure in estimating treasury yield by running the linear regression provided in the Eq 1. We run the regression for three different maturities (3 months, 1 year, and 10 years) using three time-series measures generated from meeting minutes, speeches, and testimonies. We report the results in Table 7. We observe that the yield of treasury with 1-year maturity is most sensitive to monetary policy changes. All the regression yields statistically significant results which further validate the generated measure.
| (1) |
here indicates maturity, and indicates the date on which the document was released.
Equity Market
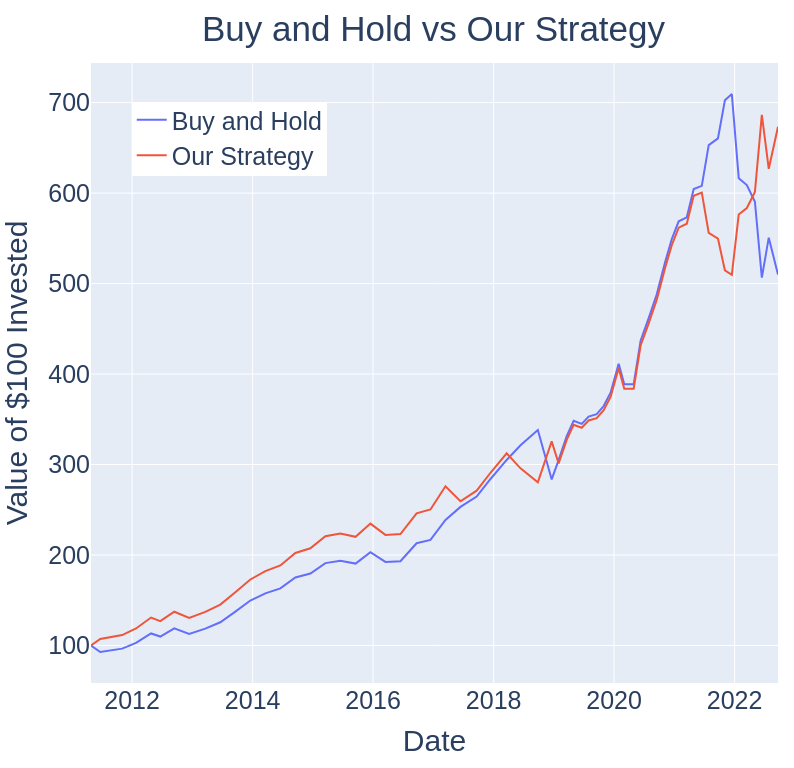
For a reality check, we construct a simple trading strategy based on the generated measure and compare its performance against the "Buy and Hold" strategy. In our strategy, we take a short position of the QQQ index fund when the measure is positive (hawkish) and a long QQQ position when the measure is negative (dovish). In the "Buy and Hold" strategy, the portfolio is always long QQQ. As shown in Figure 2, our strategy provides an excess return of 163.4% (673.29% our strategy vs 509.89% buy and hold) compared to the buy and hold strategy as of September 21st, 2022. Not only did our strategy outperform at the end, but it gives a better return during the majority of the period. We analyze the strategy for the period for which we have press conference data available. We choose press conference data because it is available immediately after the meeting as opposed to meeting minutes which are released after at least 21 days.
6 Conclusion
Our work contributes a new cleaned, tokenized, and labeled open-source dataset for FOMC text analysis of various data categories (meeting minutes, speeches, and press conferences). We also propose a new sequence classification task to classify sentences into different monetary policy stances (hawkish, dovish, and neutral). We show the application of this task by generating a measure from the trained model. We validate the measure by studying its relation with CPI, PPI, and Treasury yield. We also propose a simple trading strategy that outperforms the high benchmark set by the QQQ index over the last decade. We release our models, code, and benchmark data on Hugging Face and GitHub. We also note that the trained model for monetary policy stance classification can be used on other FOMC-related texts.
Limitations
In this article, we focus only on meeting minutes, speech, and press conference data. Many other text datasets such as transcripts from congressional and senate testimonies, beige books, green books, etc can be incorporated to understand pre-FOMC drift better. We don’t use audio or video features in constructing the measure, which might contain additional information. It can be an interesting future study to compare measures generated from FOMC text with an alternate measure that can be constructed from the news or social media data. In dataset construction, while splitting sentences, we use a simple rule-based approach. We leave it as an open problem for future researchers to find better methods for splitting sentences with opposite tones.
In our trading strategy construction, we do not include transaction fees as it involves low-frequency trading. In the future, one can use our model and data to construct a high-frequency trading strategy as well. In addition, a more comprehensive zero-shot and few-shot generative LLM benchmark with open-source models can be performed to provide a better comparison.
Ethics Statement
We acknowledge the geographic bias in our study as we only study the data from the Federal Reserve Bank of the United States of America. We also recognize the presence of gender bias in our study, given the Fed had a female chair for only 4 years out of 27 years (actually the only female chair in its entire history) of the observation period. Data used in the study which will be made public doesn’t pose any ethical concerns as all the raw data is public and Fed is subject to public scrutiny. All of the language models used are publicly available and under the license category that allows us to use them for our purpose. Given the pre-training of large PLMs has a big carbon footprint, we limit our work to fine-tuning the existing PLMs.
Acknowledgements
We appreciate the generous infrastructure support provided by Georgia Tech’s Office of Information Technology, especially Robert Griffin. We would like to thank Pratvi Shah, Alexander Liu, Ryan Valuyev, and Suraj Chatrathi for their help. We greatly appreciate all the feedback from the reviewers which has helped us improve the paper and add some additional information for readers.
References
- Abadi et al. (2016) Martin Abadi, Paul Barham, Jianmin Chen, Zhifeng Chen, Andy Davis, Jeffrey Dean, Matthieu Devin, Sanjay Ghemawat, Geoffrey Irving, Michael Isard, Manjunath Kudlur, Josh Levenberg, Rajat Monga, Sherry Moore, Derek G. Murray, Benoit Steiner, Paul Tucker, Vijay Vasudevan, Pete Warden, Martin Wicke, Yuan Yu, and Xiaoqiang Zheng. 2016. Tensorflow: A system for large-scale machine learning. In Advances in Neural Information Processing Systems 32, pages 265–283.
- Alanis et al. (2022) Emmanuel Alanis, Sudheer Chava, and Agam Shah. 2022. Benchmarking machine learning models to predict corporate bankruptcy. Available at SSRN 4249412.
- Araci (2019) Dogu Araci. 2019. Finbert: Financial sentiment analysis with pre-trained language models. ArXiv, abs/1908.10063.
- Bennani et al. (2020) Hamza Bennani, Nicolas Fanta, Pavel Gertler, and Roman Horvath. 2020. Does central bank communication signal future monetary policy in a (post)-crisis era? the case of the ecb. Journal of International Money and Finance, 104:102167.
- Bird et al. (2009) Steven Bird, Ewan Klein, and Edward Loper. 2009. Natural language processing with Python: analyzing text with the natural language toolkit. " O’Reilly Media, Inc.".
- Bowen et al. (2002) Robert M Bowen, Angela K Davis, and Dawn A Matsumoto. 2002. Do conference calls affect analysts’ forecasts? The Accounting Review, 77(2):285–316.
- Bushee et al. (2003) Brian J Bushee, Dawn A Matsumoto, and Gregory S Miller. 2003. Open versus closed conference calls: the determinants and effects of broadening access to disclosure. Journal of accounting and economics, 34(1-3):149–180.
- Caldara and Iacoviello (2022) Dario Caldara and Matteo Iacoviello. 2022. Measuring geopolitical risk. American Economic Review, 112(4):1194–1225.
- Chava et al. (2019) Sudheer Chava, Wendi Du, and Nikhil Paradkar. 2019. Buzzwords? Available at SSRN 3862645.
- Chava et al. (2022) Sudheer Chava, Wendi Du, Agam Shah, and Linghang Zeng. 2022. Measuring firm-level inflation exposure: A deep learning approach. Available at SSRN 4228332.
- Chava and Paradkar (2016) Sudheer Chava and Nikhil Paradkar. 2016. December doldrums, investor distraction, and stock market reaction to unscheduled news events. Available at SSRN 2962476.
- Cieslak et al. (2019) Anna Cieslak, Adair Morse, and Annette Vissing-Jorgensen. 2019. Stock returns over the fomc cycle. The Journal of Finance, 74(5):2201–2248.
- Coibion et al. (2022) Olivier Coibion, Yuriy Gorodnichenko, and Michael Weber. 2022. Monetary policy communications and their effects on household inflation expectations. Journal of Political Economy, 130(6):000–000.
- Consoli et al. (2022) Sergio Consoli, Luca Barbaglia, and Sebastiano Manzan. 2022. Fine-grained, aspect-based sentiment analysis on economic and financial lexicon. Knowledge-Based Systems, 247:108781.
- Cutts (2020) M. Cutts. 2020. Oxford Guide to Plain English. Oxford Paperback Reference. Oxford University Press.
- Devlin et al. (2018) Jacob Devlin, Ming-Wei Chang, Kenton Lee, and Kristina Toutanova. 2018. Bert: Pre-training of deep bidirectional transformers for language understanding. arXiv preprint arXiv:1810.04805.
- Ehrmann and Talmi (2020) Michael Ehrmann and Jonathan Talmi. 2020. Starting from a blank page? semantic similarity in central bank communication and market volatility. Journal of Monetary Economics, 111:48–62.
- Frunza (2020) Oana Frunza. 2020. Information extraction from federal open market committee statements. In Proceedings of the 1st Joint Workshop on Financial Narrative Processing and MultiLing Financial Summarisation, pages 195–203, Barcelona, Spain (Online). COLING.
- Gorodnichenko et al. (2021) Yuriy Gorodnichenko, Tho Pham, and Oleksandr Talavera. 2021. The voice of monetary policy. Technical report, National Bureau of Economic Research.
- Hansen and McMahon (2016) Stephen Hansen and Michael McMahon. 2016. Shocking language: Understanding the macroeconomic effects of central bank communication. Journal of International Economics, 99:S114–S133.
- Hansen et al. (2018) Stephen Hansen, Michael McMahon, and Andrea Prat. 2018. Transparency and deliberation within the fomc: a computational linguistics approach. The Quarterly Journal of Economics, 133(2):801–870.
- Jegadeesh and Wu (2017) Narasimhan Jegadeesh and Di Wu. 2017. Deciphering fedspeak: The information content of fomc meetings. SSRN, https://ssrn. com/abstract, 2939937.
- Li et al. (2020) Jiazheng Li, Linyi Yang, Barry Smyth, and Ruihai Dong. 2020. Maec: A multimodal aligned earnings conference call dataset for financial risk prediction. In Proceedings of the 29th ACM International Conference on Information & Knowledge Management, pages 3063–3070.
- Liu et al. (2019) Yinhan Liu, Myle Ott, Naman Goyal, Jingfei Du, Mandar Joshi, Danqi Chen, Omer Levy, M. Lewis, Luke Zettlemoyer, and Veselin Stoyanov. 2019. Roberta: A robustly optimized bert pretraining approach. ArXiv, abs/1907.11692.
- Liu et al. (2020) Zhuang Liu, Degen Huang, Kaiyu Huang, Zhuang Li, and Jun Zhao. 2020. Finbert: A pre-trained financial language representation model for financial text mining. In Proceedings of the Twenty-Ninth International Joint Conference on Artificial Intelligence, IJCAI, pages 5–10.
- Loughran and McDonald (2011) Tim Loughran and Bill McDonald. 2011. When is a liability not a liability? textual analysis, dictionaries, and 10-ks. The Journal of finance, 66(1):35–65.
- Mathur et al. (2022) Puneet Mathur, Atula Neerkaje, Malika Chhibber, Ramit Sawhney, Fuming Guo, Franck Dernoncourt, Sanghamitra Dutta, and Dinesh Manocha. 2022. Monopoly: Financial prediction from monetary policy conference videos using multimodal cues. In Proceedings of the 30th ACM International Conference on Multimedia, MM ’22, page 2276–2285, New York, NY, USA. Association for Computing Machinery.
- Matsui et al. (2021) Akira Matsui, Xiang Ren, and Emilio Ferrara. 2021. Using word embedding to reveal monetary policy explanation changes. In Proceedings of the Third Workshop on Economics and Natural Language Processing, pages 56–61, Punta Cana, Dominican Republic. Association for Computational Linguistics.
- Nakamura and Steinsson (2018) Emi Nakamura and Jón Steinsson. 2018. High-frequency identification of monetary non-neutrality: the information effect. The Quarterly Journal of Economics, 133(3):1283–1330.
- Paszke et al. (2019) Adam Paszke, Sam Gross, Francisco Massa, Adam Lerer, James Bradbury, Gregory Chanan, Trevor Killeen, Zeming Lin, Natalia Gimelshein, Luca Antiga, Alban Desmaison, Andreas Kopf, Edward Yang, Zachary DeVito, Martin Raison, Alykhan Tejani, Sasank Chilamkurthy, Benoit Steiner, Lu Fang, Junjie Bai, and Soumith Chintala. 2019. Pytorch: An imperative style, high-performance deep learning library. In H. Wallach, H. Larochelle, A. Beygelzimer, F. d'Alché-Buc, E. Fox, and R. Garnett, editors, Advances in Neural Information Processing Systems 32, pages 8024–8035. Curran Associates, Inc.
- Pikuliak (2023) Matúš Pikuliak. 2023. Chatgpt survey: Performance on nlp datasets. https://www.opensamizdat.com/posts/chatgpt_survey.
- Rogers et al. (2023) Anna Rogers, Niranjan Balasubramanian, Leon Derczynski, Jesse Dodge, Alexander Koller, Sasha Luccioni, Maarten Sap, Roy Schwartz, Noah A. Smith, and Emma Strubell. 2023. Closed ai models make bad baselines.
- Rohlfs et al. (2016) Christopher Rohlfs, Sunandan Chakraborty, and Lakshminarayanan Subramanian. 2016. The effects of the content of FOMC communications on US treasury rates. In Proceedings of the 2016 Conference on Empirical Methods in Natural Language Processing, pages 2096–2102, Austin, Texas. Association for Computational Linguistics.
- Rozkrut et al. (2007) Marek Rozkrut, Krzysztof Rybiński, Lucyna Sztaba, and Radosław Szwaja. 2007. Quest for central bank communication: Does it pay to be “talkative”? European Journal of Political Economy, 23(1):176–206.
- Schmeling and Wagner (2019) Maik Schmeling and Christian Wagner. 2019. Does central bank tone move asset prices? Available at SSRN 2629978.
- Shah et al. (2022) Raj Sanjay Shah, Kunal Chawla, Dheeraj Eidnani, Agam Shah, Wendi Du, Sudheer Chava, Natraj Raman, Charese Smiley, Jiaao Chen, and Diyi Yang. 2022. When flue meets flang: Benchmarks and large pretrained language model for financial domain. In Proceedings of the 2022 Conference on Empirical Methods in Natural Language Processing (EMNLP). Association for Computational Linguistics.
- Sohangir et al. (2018) Sahar Sohangir, Dingding Wang, Anna Pomeranets, and Taghi M Khoshgoftaar. 2018. Big data: Deep learning for financial sentiment analysis. Journal of Big Data, 5(1):1–25.
- Tobback et al. (2017) Ellen Tobback, Stefano Nardelli, and David Martens. 2017. Between hawks and doves: measuring central bank communication. SSRN.
- Tsukioka and Yamasaki (2020) Yasutomo Tsukioka and Takahiro Yamasaki. 2020. The tone of the beige book and the pre-fomc announcement drift. Available at SSRN 3306011.
- Vargas et al. (2017) Manuel R Vargas, Beatriz SLP De Lima, and Alexandre G Evsukoff. 2017. Deep learning for stock market prediction from financial news articles. In 2017 IEEE international conference on computational intelligence and virtual environments for measurement systems and applications (CIVEMSA), pages 60–65. IEEE.
- Wolf et al. (2020) Thomas Wolf, Lysandre Debut, Victor Sanh, Julien Chaumond, Clement Delangue, Anthony Moi, Pierric Cistac, Tim Rault, Rémi Louf, Morgan Funtowicz, Joe Davison, Sam Shleifer, Patrick von Platen, Clara Ma, Yacine Jernite, Julien Plu, Canwen Xu, Teven Le Scao, Sylvain Gugger, Mariama Drame, Quentin Lhoest, and Alexander M. Rush. 2020. Transformers: State-of-the-art natural language processing. In Proceedings of the 2020 Conference on Empirical Methods in Natural Language Processing: System Demonstrations, pages 38–45, Online. Association for Computational Linguistics.
- Xing et al. (2018) Frank Z Xing, Erik Cambria, and Roy E Welsch. 2018. Natural language based financial forecasting: a survey. Artificial Intelligence Review, 50(1):49–73.
- Yang et al. (2020) Yi Yang, Mark Christopher Siy Uy, and Allen Huang. 2020. Finbert: A pretrained language model for financial communications. CoRR, abs/2006.08097.
- Zirn et al. (2015) Cäcilia Zirn, Robert Meusel, and Heiner Stuckenschmidt. 2015. Lost in discussion? tracking opinion groups in complex political discussions by the example of the FOMC meeting transcriptions. In Proceedings of the International Conference Recent Advances in Natural Language Processing, pages 747–753, Hissar, Bulgaria. INCOMA Ltd. Shoumen, BULGARIA.
Appendix A FinBERT Sentiment Analysis
In order to objectively understand the necessity of the new task and the created dataset, we use the fine-tuned model available on Hugging-face. The model is fine-tuned for financial sentiment analysis using the pre-trained FinBERT (Araci, 2019). We associate the "positive" label of FinBERT with "dovish", "negative" label with "hawkish", and "neutral" with "neutral" to measure the zero-shot performance on our dataset. The results in Table 8 show that the model doesn’t perform well, thus reemphasizing the need for a new dataset and task for hawkish-dovish classification.
| Data | Mean | Standard Deviation |
|---|---|---|
| MM | 0.3214 | 0.0060 |
| MM-S | 0.3868 | 0.0192 |
| PC | 0.3035 | 0.0253 |
| PC-S | 0.4357 | 0.0271 |
| SP | 0.5098 | 0.0186 |
| SP-S | 0.5014 | 0.0396 |
| Combined | 0.4254 | 0.0025 |
| Combined-S | 0.4304 | 0.0198 |
Appendix B Transfer Learning
To understand if there is a need to annotate all three categories of data or whether the model trained on two categories of data can do equally well on the third category, we run an additional experiment. Here we take our best-performing (RoBERTa-large) model and train it on the train split of meeting minutes and press conference combined data and test it on a test sample of speech data. We additionally perform a grid search on four different learning rates (1e-4, 1e-5, 1e-6, 1e-7) and four different batch sizes (32, 16, 8, 4) to find the best hyperparameters. The best average F1 score for 3 seeds is 0.6625 which is lower compared to 0.7169 for the model trained on a training sample of speech data.
Appendix C Manual Annotation
C.1 Annotation Agreement
Annotation agreement statistics for the split categories of the dataset are provided in Table 9. Any disagreement between the two annotators was resolved using the annotation guide. If the annotation guide did not cover a specific case of disagreement, online resources were used and the missing case was later added to the annotation guide.
| Data | Agreement |
|---|---|
| MM-S | 89.04% |
| PC-S | 95.03% |
| SP-S | 91.13 |
| Combined-S | 90.68 |
C.2 Annotation Guide
| Category | Dovish | Hawkish | Neutral |
|---|---|---|---|
| Economic Status | when inflation decreases, when unemployment increases, when economic growth is projected as low | when inflation increases, when unemployment decreases when economic growth is projected high when economic output is higher than potential supply/actual output when economic slack falls | When unemployment rate or growth is unchanged, maintained, or sustained |
| Dollar Value Change | when the dollar appreciates | when the dollar depreciates | N/A |
| Energy/House Prices | when oil/energy prices decrease, when house prices decrease | when oil/energy prices increase, when house prices increase | N/A |
| Foreign Nations | when the US trade deficit decreases | when the US trade deficit increases | when relating to a foreign nation’s economic or trade policy |
| Fed Expectations/Actions/Assets | Fed expects subpar inflation, Fed expecting disinflation, narrowing spreads of treasury bonds, decreases in treasury security yields, and reduction of bank reserves | Fed expects high inflation, widening spreads of treasury bonds, increase in treasury security yields, increase in TIPS value, increase bank reserves | N/A |
| Money Supply | money supply is low, M2 increases, increased demand for loans | money supply is high, increased demand for goods, low demand for loans | N/A |
| Key Words/Phrases | when the stance is "accommodative", indicating a focus on “maximum employment” and “price stability” | indicating a focus on “price stability” and “sustained growth” | use of phrases “mixed”, “moderate”, “reaffirmed” |
| Labor | when productivity increases | when productivity decreases | N/A |
Our annotation guide was built by dividing each target sentence into eight defined categories: Economic Status, Dollar Value Change, Energy/House Prices, Foreign Nations, Fed Expectations/Actions/Assets, Money Supply.
-
•
Economic Status: A sentence pertaining to the state of the economy, relating to unemployment and inflation
-
•
Dollar Value Change: A sentence pertaining to changes such as appreciation or depreciation of value of the United States Dollar on the Foreign Exchange Market
-
•
Energy/House Prices: A sentence pertaining to changes in prices of real estate, energy commodities, or energy sector as a whole.
-
•
Foreign Nations: A sentence pertaining to trade relations between the United States and a foreign country. If not discussing United States we label neutral.
-
•
Fed Expectations/Actions/Assets: A sentence that discusses changes in the Fed yields, bond value, reserves, or any other financial asset value.
-
•
Money Supply: A sentence that overtly discusses impact to the money supply or changes in demand.
-
•
Key Words/Phrases: A sentence that contains key word or phrase that would classify it squarely into one of the three label classes, based upon its frequent usage and meaning among particular label classes.
-
•
Labor: A sentence that relates to changes in labor productivity
A label of "Dovish", "Hawkish", and "Neutral" were assigned based on the contents of each sentence by category. The annotation guide and categories were influenced by initial readings of FOMC text and the need to maintain a consistent labeling standard. The annotation guide was utilized during the labeling procedure by two independent annotators to classify each sentence.
Both annotators were male researchers, who have taken finance-related coursework and understood macroeconomics. One originated from the United States, while the other was from India.
Appendix D Robustness check
As our dataset is a temporal dataset and the RoBERTa model is trained on data available prior to mid-2019, our model could have utilized future knowledge to predict past sentences a phenomenon deemed "look-ahead bias". Our train-test split based on different seeds contains this bias, so to ensure that it is not present in our model performance, we perform a robustness check by generating a train-test split based on time and checking the performance of the best-performing (RoBERTa-large) model. We split the Combined-S data into a training set spanning from 1996 to 2019 and a test set from 2020 to 2022. For the experiment, we averaged our model performance across 3 seeds (5768, 78516, 944601) and generated an average weighted F1 score of 0.7114, thus validating our performance as not being driven by look-ahead bias.