No-Reference Point Cloud Quality Assessment via Weighted Patch Quality Prediction
Abstract
With the rapid development of 3D vision applications based on point clouds, point cloud quality assessment (PCQA) is becoming an important research topic. However, the prior PCQA methods ignore the effect of local quality variance across different areas of the point cloud. To take an advantage of the quality distribution imbalance, we propose a no-reference point cloud quality assessment (NR-PCQA) method with local area correlation analysis capability, denoted as COPP-Net. More specifically, we split a point cloud into patches, generate texture and structure features for each patch, and fuse them into patch features to predict patch quality. Then, we gather the features of all the patches of a point cloud for correlation analysis, to obtain the correlation weights. Finally, the predicted qualities and correlation weights for all the patches are used to derive the final quality score. Experimental results show that our method outperforms the state-of-the-art benchmark NR-PCQA methods. The source code for the proposed COPP-Net can be found at https://github.com/philox12358/COPP-Net.
Index Terms:
Point convolution, point cloud quality assessment, deep learningI Introduction
A 3D point cloud is a large and dense collection of sampled points with spatial coordinates and attributes, obtained by 3D scanning technology like lidar. Each point in a point cloud contains a geometric attribute, i.e. 3D space coordinates, and other attributes, such as color, reflectivity, opacity, etc., represented by feature vectors. As point clouds directly represent the 3D world, they are widely used in automatic driving, industrial robots, cultural heritage protection, geographic mapping, and other fields.
Similar to image and video, point clouds can be distorted due to many factors during the collection and transmission process. However, point clouds suffer from more complex distortions due to their data format. Therefore, PCQA is more challenging than traditional image quality assessment. Accurate PCQA is critical for providing high-quality point clouds for various purposes. Like in traditional image and video quality assessment, PCQA methods can also be divided in full-reference (FR), reduced-reference (RR), and no-reference (NR) methods, according to the availability of a reference point cloud.
Several FR-PCQA methods have been proposed recently [1] [2] [3] [4] [5] [6] [7], and they have reached relatively good performance already. However, in many real-life application scenarios, there is no pristine reference point cloud available, and NR-PCQA is therefore a very important research topic at the moment. Regarding the recent development of image quality assessment (IQA), the most accurate NR-IQA methods are based on deep convolutional neural networks (CNN). Unfortunately, training of deep neural networks (DNN) requires a large amount of training samples, and the currently available PCQA databases are mostly small, and each point cloud often contains millions of points. Advanced point convolution neural networks directly processing such a large number of points have a very high computational load, limiting the use of deep neural networks for NR-PCQA.

Although some attempts have been made to use DNNs for NR-PCQA [8] [9] [10], these methods usually obtain projected 2D images from the whole point cloud or a few features of the whole point cloud as the input of the network through preprocessing, rather than directly using the point cloud. ResSCNN [11] directly uses the entire point cloud as input, but sparse convolution is used to save computation, which reduces the computational accuracy. NR-CNN-3D-PC [12] divides the point cloud into many patches, but does not consider the impact of different patches on the overall quality of the point cloud. At the same time, compared with the most accurate FR-PCQA method, the proposed models still perform poorly. So far, we have not identified any stable and accurate method of NR-PCQA task that uses point cloud as the input of DNN model directly and takes into account the local correlation of point cloud.
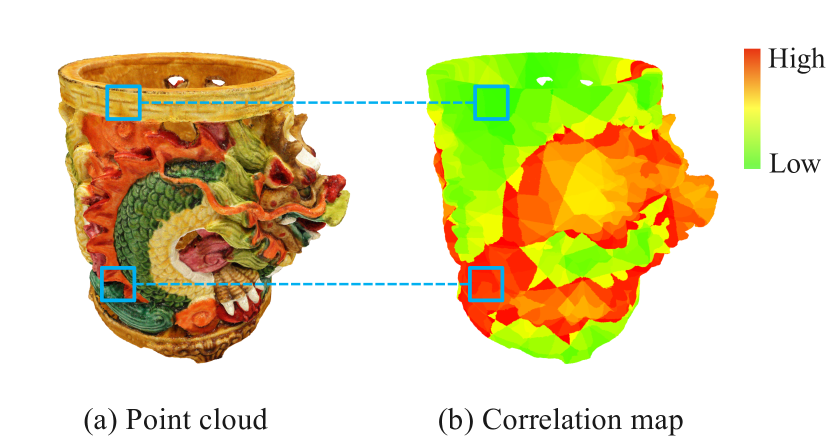
Due to the development of new methods for deep learning in the recent years, such as PointNet++ [13] and transformers [14], there have been remarkable progress in processing point clouds with fewer points recently. On the other hand, in many practical use cases large 3D point clouds need to be observed from different sides and viewing angles multiple times through rotation and scaling. Moreover, point cloud usually has complex structure and rich texture, and the visual appearance of different regions can be very different. Therefore, the correlation between the local quality and the overall quality varies strongly between different areas of the a point cloud. Based on these considerations and the previous work, we propose a patch-based NR-PCQA method that generates features representing the structure and texture of each patch. Then, point cloud quality is predicted by using appropriate weights derived from the correlations between patch quality and overall quality.
It is worth noting that correlation in our method is different from saliency. Even though the correlations may be related to saliency, our method does not aim to calculate the saliency map of the point cloud. Specifically, we first divide a point cloud into several patches, representing different parts of the point cloud. In the proposed COPP-Net model, we propose Adaptive R-Sampling KNN PointNet++ (ARKP) network, based on PointNet++ architecture [13], to generate texture and structure features from patches generated from the point cloud. These features are used to predict local quality scores for the patches, and they are also used as input to the proposed Quality Correlation Analysis (CORA) network, predicting the weights for each patch. Finally, the quality scores for each patch are multiplied by their relative weights to predict the overall quality score through a weighted average.
II Related work
II-A Full-Reference metrics
For PCQA, several FR metrics were firstly developed to be used for assessing performance of point cloud compression. The classic methods are point-based FR metrics proposed by MPEG, such as p2point [1] and p2plane [15]. Their computational complexity is low, but on the other hand, their accuracy is limited and they are prone to instability when complex distortion types are concerned. In [16], a point-based metric based on angular similarity was proposed, and [17] proposed a series of methods using local luminance patterns, local binary patterns and multi-distance approach. In [18], a generalized Hausdorff distance based quality metric for geometric point cloud distortions was proposed, and [17] used the local curvature statistics to evaluate the quality of point clouds. Later, inspired by SSIM [4], several metrics were proposed in [5] [7]. They considered the structural characteristics of the point cloud and achieved a good performance for FR-PCQA.
II-B No-Reference metrics
Due to the limited availability of point cloud quality databases, exploration of NR-PCQA started relatively late. Since NR-IQA methods have matured [8], it has been proposed to project point clouds to 2D pictures from different angles, and then use traditional IQA methods or CNN to predict point cloud quality indirectly from the 2D images. In NR-3DQA [9], 3D point clouds are projected into feature domains based on color and geometry, and the quality score is obtained using support vector machine (SVM) regression. IT-PCQA [10] using the rich prior knowledge of natural images to build a bridge between 2D and 3D perception for quality assessment via transfer learning. ResSCNN [11] uses 3D sparse convolution for efficient computations. However, in the process of sparse convolution, the local accuracy of the point cloud data will be reduced, resulting in partial information loss. Therefore, the performance of the method is not stable on point clouds with different types of distortions.
In [12], point clouds are split into multiple local patches, and low level patch-wise features (e.g., geometric distance, local curvature) are used to train a CNN. However, this method does not take into account the quality inconsistency between different areas of the point cloud. To tackle this challenge, we propose a model that learns the weights for different parts of the point cloud to balance the inconsistencies in local quality.
III Our Approach
III-A Point Cloud Preprocessing Module
A point cloud instance is a set that contains a total of points, , located on the surface of the object of interest. Note that defines the -th point of this point cloud, and the spatial coordinates denoted as and the color information denoted as . Thus, a 3D point cloud object can be represented by a matrix of size . Generally, is in millions. Processing that many points will consume a lot of computing resources. Considering that different parts of the point cloud have different quality correlations, we divide the point cloud into multiple patches through preprocessing.
For preprocessing, we first normalize into a sphere with a radius of 1000, then we use the farthest point sampling (FPS) [13] algorithm to obtain center points, and finally we use the k-nearest neighbor (KNN) [19] algorithm to sample the nearest points to each center point to form the patches. For each patch, we center the coordinates and the color information, respectively. As a result, we sample patches from a point cloud, and each patch contains points. These patches are then used as input to the patch feature generation module.
III-B Patch Feature Generation Module
The feature generation module will generate features for texture and structure information. Texture information is very sensitive to downsampling, because it requires fine and continuous dense data representation. Fortunately, continuous regions with similar quality scores tend to share similar texture distortion characteristics. Therefore, we can generate texture features from small regions without losing the accuracy of the representation. For structural information, rough and sparse information is sufficient to represent complex spatial structures, so structural information is not sensitive to downsampling. Based on these observations, we follow different strategies to generate texture and structure features.
Specifically, the module is composed of local texture feature generation network (ARKPt) and 3D structure feature generation network (ARKPs). Both networks are based on ARKP architecture, and they are used to generate texture and structure features, respectively. The details are as follows:
Texture feature generator ARKPt. In a patch with points, we use KNN algorithm to sample locally adjacent and continuous points to be used as input to ARKPt for obtaining the texture features of the patch.
Structure feature generator ARKPs. In a patch with points, we use random sampling to sample a relatively small number of points within the range of the patch to be used as input to ARKPs for obtaining the structure features of the patch.
Then, we concatenate the features from the two networks and send it through a MaxPool layer to obtain the final patch feature vectors (Fpatch). Fpatch will be used to predict the patch quality score (Qpatch). It is also used by the CORA network to obtain correlation weight (Wpatch). We will present a detailed description of the ARKP network below.
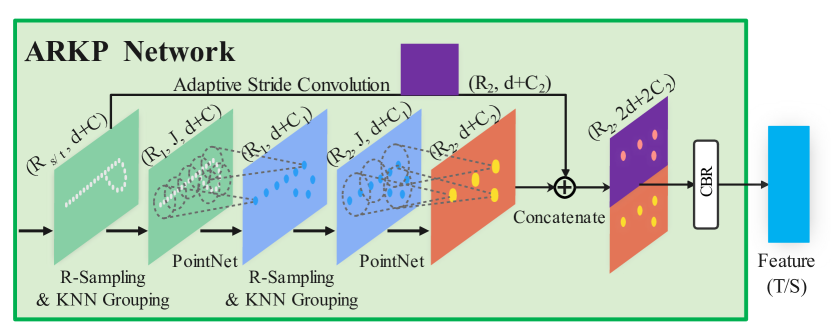
III-C ARKP Network
We propose the ARKP network to generate features more accurately. As depicted in Figure 3, the ARKP architecture is based on the single-scale grouping (SSG) version of PointNet++ [13].
In PointNet++, the hierarchical structure is composed of a number of specific abstraction levels, each of which is made up of three key layers: the Sampling layer, Grouping layer, and PointNet layer [13]. The Sampling layer defines the centroids of local regions using FPS algorithm, and the Grouping layer constructs local regions by performing a ball query. The PointNet layer encodes the local region into feature vectors.
The ARKP network differs from the SSG version of PointNet++ in the following aspects:
-
•
To improve the overall information generation ability, we added Adaptive Stride Convolution before and after the baseline structure.
-
•
To reduce computational overhead, we use Random Sampling (R-Sampling) instead of FPS in the sampling layer.
-
•
To improve stability in PCQA tasks, we use KNN to select neighboring points in the Grouping layer.
Our ablation experiments demonstrate the effectiveness of the proposed modifications.
III-D Point Cloud Quality Regression Module
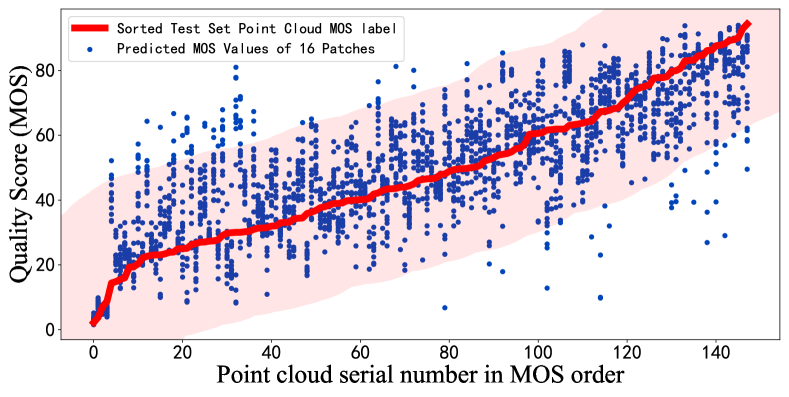
Figure 2 shows a detailed overview of the steps to predict the point cloud quality score from the Fpatch. Using Fpatch as input, we apply a regression head comprising two linearlayers, batch normalization layer, and leaky ReLU layer to predict Qpatch. In the training phase, we assign the overall point cloud quality score as ground truth quality score for all the patches. Mean squared error (MSE) is used as loss function for training. If the quality score of a point cloud is calculated by averaging the values of Qpatch, high prediction accuracy seems to be achieved.
However, as shown in Figure 4, the quality scores for individual patches tends to be scattered, since different areas of the point cloud have different quality levels. To reduce the impact of outlier patches, we use a network (CORA) to analyze the dispersion of quality of each patch.
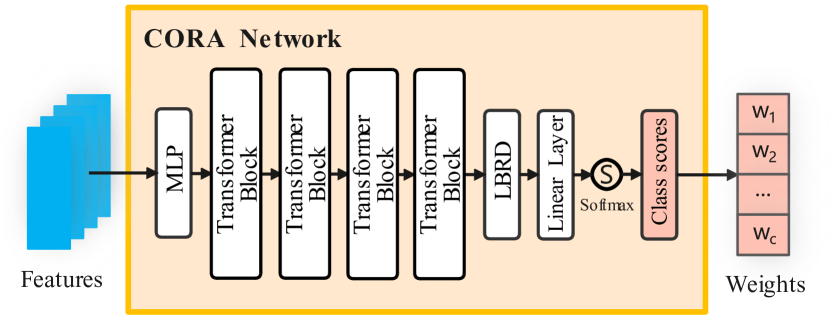
III-E CORA Network
The CORA network is designed to estimate the correlation between the patch quality and the overall point cloud quality by predicting correlation labels. As illustrated in Figure 5, we concatenate all Fpatch of a single point cloud to form the input to the CORA network. Then, we apply a multilayer perceptron (MLP) with two linear layers, followed by four transformer blocks and two additional linear layers to predict the correlations. The middle hidden layer dimension is set to 512. Finally, SoftMax operation is applied to the output to compute the correlation-based Wpatch.
Specifically, we obtain all Qpatches of a point cloud and rank them in ascending order based on the absolute difference between each Qpatch and the ground truth quality score of the point cloud. Then divide them into three correlation classification labels, i.e., strong correlation, average correlation, and weak correlation. The goal of the CORA network is to predict the correlation classifications accurately. We use cross-entropy loss to train the CORA network.
In the final phase of computing the predicted overall quality score, we use correlation weight pooling. Specifically, we use Qpatches and Wpatches from the CORA network, and then compute the weighted average of the quality scores to obtain the final quality score of the point cloud. Formally, the correlation weight pooling can be expressed as:
| (1) |
where QPC is the quality score of the point cloud, is the number of patches generated from each point cloud, Wi is the correlation weight for -th patch, and Qi is the predicted quality score for -th patch.
| Type | Method | PLCC | SRCC | RMSE |
| NR | NIQE [20] | 0.3957 | 0.3887 | 22.55 |
| BRISQUE [21] | 0.4176 | 0.3781 | 22.54 | |
| PQA-Net [8] | 0.7000 | 0.6900 | 15.18 | |
| NR-3DQA [9] | 0.6591 | 0.6326 | 16.45 | |
| ResSCNN [11] | 0.4292 | 0.4352 | 23.27 | |
| IT-PCQA [10] | 0.5609 | 0.5683 | 19.07 | |
| Our COPP-Net | 0.9324 | 0.9251 | 8.10 |
Type Method Banana Cauliflower Mushroom Pineapple PLCC SRCC RMSE PLCC SRCC RMSE PLCC SRCC RMSE PLCC SRCC RMSE FR PSNRp2po,M [1] 0.7236 0.6471 14.98 0.4555 0.3501 19.95 0.6406 0.6396 17.02 0.4678 0.3777 18.04 PSNRY [2] 0.7560 0.6785 14.20 0.6332 0.5927 17.35 0.8022 0.6550 13.23 0.7466 0.7217 13.58 PCQM [3] -0.7145 -0.7686 15.18 -0.7057 -0.6971 15.88 -0.8033 -0.7819 13.20 -0.7578 -0.7862 13.32 SSIMp [4] 0.7156 0.7544 15.16 0.6515 0.5967 17.00 0.7994 0.7297 13.32 0.7214 0.7193 14.14 GraphSIM [5] 0.5990 0.5300 17.38 0.6010 0.5520 17.91 0.7120 0.6730 15.56 0.0410 0.0310 20.20 VIFPp [6] 0.7938 0.7956 13.20 0.6581 0.5820 16.88 0.8450 0.8658 11.85 0.7456 0.7285 13.61 IW-SSIMp [7] 0.8724 0.8627 10.61 0.8578 0.8125 11.52 0.8697 0.8528 10.94 0.7817 0.7584 12.73 NR PQA-Net [8] 0.5300 0.5200 18.87 0.7000 0.6900 15.27 0.7700 0.7100 13.81 0.8700 0.8900 9.80 NR-3DQA [9] 0.6965 0.7008 16.13 0.5977 0.5744 18.42 0.7740 0.8297 15.17 0.6288 0.5915 15.90 ResSCNN [11] 0.4484 0.4694 25.04 0.4113 0.3340 23.65 0.5259 0.5209 22.48 0.7383 0.6747 22.51 IT-PCQA [10] 0.7855 0.8377 13.58 0.7156 0.7146 15.20 0.2989 0.3097 22.05 0.2923 0.3702 20.32 Our COPP-Net 0.9121 0.8878 9.07 0.9190 0.9246 9.54 0.9495 0.9272 7.72 0.9571 0.9478 6.02
IV Experiment
In this section, we first describe the experimental setup, then we introduce the Waterloo Point Cloud Database (WPC), and compare the performance of our COPP-Net with the prior mainstream FR and NR methods. Then, we conduct an ablation study on the proposed COPP-Net. Finally, we test the performance of the model on other databases.
IV-A Experiment Setups
In each of the practical experiments, we extracted =16 patches from a point cloud, with =14900 points in each patch. In the feature generation module, we used KNN algorithm to select =8192 adjacent points around the center of a patch as input to ARKPt, and random sampling to select =1024 points as input to ARKPs.
The model was trained in two stages: in the first stage, we trained the feature generation and patch quality prediction part, and in the second stage, we trained the CORA network.
We used 32 mini-batches in the first stage and 4 in the second stage. In both training stages, we used stochastic gradient descent (SGD) optimization algorithm. We set the initial learning rate to and applied cosine learning rate decay method until the loss converged. As performance indicators for the final model, we used Pearson correlation coefficient (PLCC), Spearman rank order correlation coefficient (SRCC) and root mean squared error (RMSE) to evaluate the accuracy of the predicted scores in comparison to the ground truth quality scores. These indicators are all widely used to assess the performance of IQA and PCQA models. All our experiments were run on a single NVIDIA RTX 3090 GPU.
| Model | Pooling | Criteria | ||
| PLCC | SRCC | RMSE | ||
| PointNet++ SSG [13] | AVE | 0.7136 | 0.6988 | 15.65 |
| ARKPt w/o Stride Conv | AVE | 0.7724 | 0.7653 | 14.86 |
| ARKPt w/o R-Sampling | AVE | 0.8461 | 0.8286 | 13.74 |
| ARKPt w/o KNN | AVE | 0.7538 | 0.7346 | 15.03 |
| ARKPt | AVE | 0.8589 | 0.8446 | 11.75 |
| ARKPs | AVE | 0.8691 | 0.8616 | 10.91 |
| ARKPt+ARKPs | AVE | 0.9015 | 0.8994 | 9.92 |
| ARKPt+ARKPs | CORA | 0.9324 | 0.9251 | 8.10 |
IV-B Prediction performance on WPC database
Waterloo Point Cloud Database (WPC) includes 20 high-quality color point clouds, covering various geometric and texture characteristics. The database includes 37 distorted versions for each original point clouds, and there are in total 20 original point clouds and 740 distorted point clouds in the database. Each point cloud is annotated with their ground truth quality scores, obtained by subjective testing. In our experiments, we used the same division into training and testing sets as described in [8] [9]: the point clouds for , , , , accounting for 20% of the whole data set, were used as test set, and the remaining point clouds were used as training set.
Table I lists the overall results of COPP-Net and the selected benchmark NR methods [8] [9] [11] [10] on the WPC test set. The results show that the proposed COPP-Net outperforms the prior state-of-the-art NR methods with a large margin.
In Table II, we summarize the performance of several FR methods [1] [2] [3] [4] [5] [6] [7] on different test contents in the WPC database separately, as given in [7], as well as the results for the same contents with the state-of-the-art NR models [8] [9] [11] [10], and the proposed COPP-Net obtained from our experiments. According to the results, COPP-Net is not only superior to the best performing prior NR methods in each category, but also outperforms the strongest FR method on all source contents. In general, FR models perform better than NR models, because they use the original pristine point cloud as a reference.
IV-C Ablation Study
To validate the efficacy of the proposed ARKP and CORA networks, we performed experiments on the WPC database using COPP-Net with various network configurations and pooling strategies. The results presented in Table III demonstrate the effectiveness of the modifications we introduced in the ARKP networks. Specifically, the ARKPt and ARKPs models exhibit superior feature generation capabilities in comparison to the baseline PointNet++ SSG. Our analysis reveals that the Adaptive Stride Convolution and KNN components play a significant role in boosting performance, whereas the R-sampling component has a minor impact on accuracy, but it contributes to increasing the training speed.
Table III demonstrates that the combination of ARKPt and ARKPs outperforms the individual networks. This indicates that the features generated by these two networks capture different aspects of quality, highlighting the importance of using distinct features for texture and structure. Furthermore, the use of weighted average pooling instead of average pooling in the CORA network enhances the performance, indicating that the model successfully leverages the quality imbalances across various regions of the point cloud.
| Method | SJTU-PCQA | SIAT-PCQD | WPC2.0 | LS-PCQA Part I | ||||||||
| PLCC | SRCC | RMSE | PLCC | SRCC | RMSE | PLCC | SRCC | RMSE | PLCC | SRCC | RMSE | |
| NR-3DQA [9] | 0.5987 | 0.5676 | 2.15 | 0.0327 | 0.0148 | 0.13 | 0.3944 | 0.4303 | 23.31 | 0.3861 | 0.3634 | 0.84 |
| ResSCNN [11] | 0.9261 | 0.9099 | 1.49 | 0.3083 | 0.2613 | 0.11 | 0.8213 | 0.8208 | 15.19 | 0.4131 | 0.4085 | 0.70 |
| IT-PCQA [10] | 0.5922 | 0.5269 | 2.09 | 0.4266 | 0.0824 | 0.10 | 0.4571 | 0.3863 | 20.45 | 0.3159 | 0.3023 | 0.78 |
| Our COPP-Net | 0.9257 | 0.8915 | 1.31 | 0.8512 | 0.7115 | 0.08 | 0.8685 | 0.8706 | 12.78 | 0.5885 | 0.5949 | 0.68 |
IV-D Prediction performance on other databases
To provide a more comprehensive evaluation of the proposed model, we conducted comparative studies using COPP-Net and three state-of-the-art NR methods on five additional publicly available point cloud quality databases, including SJTU-PCQA [22], SIAT-PCQD [23], WPC2.0 [24], and LS-PCQA parts I [11]. In each dataset, we adopted an 80%-20% split for training and testing, respectively. PQA-Net [8] is not included, because it cannot be used on databases with multiple distortion types.
As shown in Table IV, our COPP-Net outperforms most of the other methods across multiple databases, and even in cases where it does not achieve the best performance, the difference against the best performing method is typically small. These results highlight that the proposed method is widely applicable on different databases.
V Conclusions
In this paper, we proposed a novel method for NR point cloud quality assessment, named as COPP-Net. The method takes into account the impact of different quality levels in different parts of the point cloud to the overall quality by using CORA network to constrain the dispersion of local quality levels. The ARKP network used in COPP-Net shows stronger feature generation capability than the baseline, demonstrating the importance of generating both texture and structure features of the point cloud. The experimental results show that the proposed method outperforms state-of-the-art FR and NR methods for PCQA.
The main limitation of COPP-Net is its limited scalability when increasing the number of patches: the CORA network needs to calculate all Fpatch features of a point cloud in parallel, which requires a significant amount of GPU memory. In contrast, the proposed ARKP network requires much less GPU memory, and the ARKP network without CORA can also achieve satisfactory performance.
References
- [1] R. Mekuria, Z. Li, C. Tulvan, and P. Chou, “Evaluation criteria for pcc (point cloud compression),” ISO/IEC JTC1/SC29/WG11, N16332, 2016.
- [2] R. Mekuria, S. Laserre, and C. Tulvan, “Performance assessment of point cloud compression,” in 2017 IEEE Visual Communications and Image Processing (VCIP). IEEE, 2017, pp. 1–4.
- [3] G. Meynet, Y. Nehmé, J. Digne, and G. Lavoué, “PCQM: A full-reference quality metric for colored 3d point clouds,” in 2020 Twelfth International Conference on Quality of Multimedia Experience (QoMEX). IEEE, 2020, pp. 1–6.
- [4] Z. Wang, A. C. Bovik, H. R. S., and E. P. Simoncelli, “Image quality assessment: from error visibility to structural similarity,” IEEE transactions on image processing, vol. 13, no. 4, pp. 600–612, 2004.
- [5] Q. Yang, Z. Ma, Y. Xu, Z. Li, and J. Sun, “Inferring point cloud quality via graph similarity,” IEEE Transactions on Pattern Analysis and Machine Intelligence, 2020.
- [6] H. R. Sheikh and A. C. Bovik, “Image information and visual quality,” IEEE Transactions on image processing, vol. 15, no. 2, pp. 430–444, 2006.
- [7] Q. Liu, H. Su, Z. Duanmu, W. Liu, and Z. Wang, “Perceptual quality assessment of colored 3d point clouds,” IEEE Transactions on Visualization and Computer Graphics, 2022.
- [8] Q. Liu, H. Yuan, H. Su, H. Liu, Y. Wang, H. Yang, and J. Hou, “PQA-Net: Deep no reference point cloud quality assessment via multi-view projection,” IEEE Transactions on Circuits and Systems for Video Technology, vol. 31, no. 12, pp. 4645–4660, 2021.
- [9] Z. Zhang, W. Sun, X. Min, T. Wang, W. Lu, and G. Zhai, “No-reference quality assessment for 3d colored point cloud and mesh models,” IEEE Transactions on Circuits and Systems for Video Technology, 2022.
- [10] Q. Yang, Y. Liu, S. Chen, Y. Xu, and J. Sun, “No-reference point cloud quality assessment via domain adaptation,” in Proceedings of the IEEE/CVF Conference on Computer Vision and Pattern Recognition, 2022, pp. 21 179–21 188.
- [11] Y. Liu, Q. Yang, Y. Xu, and L. Yang, “Point cloud quality assessment: Dataset construction and learning-based no-reference metric,” ACM Transactions on Multimedia Computing, Communications, and Applications (TOMM), 2022.
- [12] A. Chetouani, M. Quach, G. Valenzise, and F. Dufaux, “Deep learning-based quality assessment of 3d point clouds without reference,” in 2021 IEEE International Conference on Multimedia & Expo Workshops (ICMEW). IEEE, 2021, pp. 1–6.
- [13] C. R. Qi, L. Yi, H. Su, and L. J. Guibas, “Pointnet++: Deep hierarchical feature learning on point sets in a metric space,” Advances in neural information processing systems, vol. 30, 2017.
- [14] A. Vaswani, N. Shazeer, N. Parmar, J. Uszkoreit, L. Jones, A. N. Gomez, Ł. Kaiser, and I. Polosukhin, “Attention is all you need,” Advances in neural information processing systems, vol. 30, 2017.
- [15] D. Tian, H. Ochimizu, C. Feng, R. Cohen, and A. Vetro, “Geometric distortion metrics for point cloud compression,” in 2017 IEEE International Conference on Image Processing (ICIP). IEEE, 2017, pp. 3460–3464.
- [16] E. Alexiou and T. Ebrahimi, “Point cloud quality assessment metric based on angular similarity,” in 2018 IEEE International Conference on Multimedia and Expo (ICME). IEEE, 2018, pp. 1–6.
- [17] G. Meynet, J. Digne, and G. Lavoué, “PC-MSDM: A quality metric for 3d point clouds,” in 2019 Eleventh International Conference on Quality of Multimedia Experience (QoMEX). IEEE, 2019, pp. 1–3.
- [18] A. Javaheri, C. Brites, F. Pereira, and J. Ascenso, “A generalized hausdorff distance based quality metric for point cloud geometry,” in 2020 Twelfth International Conference on Quality of Multimedia Experience (QoMEX). IEEE, 2020, pp. 1–6.
- [19] T. Abeywickrama, M. A. C., and D. Taniar, “K-nearest neighbors on road networks: a journey in experimentation and in-memory implementation,” arXiv preprint arXiv:1601.01549, 2016.
- [20] A. Mittal, R. Soundararajan, and A. Bovik, “Making a “completely blind” image quality analyzer,” IEEE Signal processing letters, vol. 20, no. 3, pp. 209–212, 2012.
- [21] A. Mittal, A. Moorthy, and A. Bovik, “No-reference image quality assessment in the spatial domain,” IEEE Transactions on image processing, vol. 21, no. 12, pp. 4695–4708, 2012.
- [22] Q. Yang, H. Chen, Z. Ma, Y. Xu, R. Tang, and J. Sun, “Predicting the perceptual quality of point cloud: A 3d-to-2d projection-based exploration,” IEEE Transactions on Multimedia, vol. 23, pp. 3877–3891, 2020.
- [23] X. Wu, Y. Zhang, C. Fan, J. Hou, and S. Kwong, “Subjective quality database and objective study of compressed point clouds with 6dof head-mounted display,” IEEE Transactions on Circuits and Systems for Video Technology, vol. 31, no. 12, pp. 4630–4644, 2021.
- [24] Q. Liu, H. Yuan, R. Hamzaoui, H. Su, J. Hou, and H. Yang, “Reduced reference perceptual quality model with application to rate control for video-based point cloud compression,” IEEE Transactions on Image Processing, vol. 30, pp. 6623–6636, 2021.