galaxies: spiral — galaxies: ISM — radio lines: galaxies — dust, extinction — ISM: molecules
CO Multi-line Imaging of Nearby Galaxies (COMING). XII. CO-to-H2 Conversion Factor and Dust-to-Gas Ratio
Abstract
We simultaneously measured the spatially-resolved CO-to-H2 conversion factor () and dust-to-gas ratio (DGR) in nearby galaxies on a kiloparsec scale. In this study, we used 12CO() data obtained by the Nobeyama 45-m radio telescope with Hi and dust mass surface densities. We obtained the values of global and DGR in 22 nearby spiral galaxies, with averages of pc-2 (K km s-1)-1and , respectively. Furthermore, the radial variations of and DGR in four barred spiral galaxies (IC 342, NGC 3627, NGC 5236, and NGC 6946) were obtained by dividing them into the inner and outer regions with a boundary of , where is the isophotal radius at 25 mag arcsec-2 in the band. The averages of and DGR in the inner region () are pc-2 (K km s-1)-1 and , while those in the outer region () are pc-2 (K km s-1)-1 and , respectively. The value of in the outer region is to times larger than that of the inner region. When separated into the inner and outer regions, we find that and DGR correlate with the metallicity and the star formation rate surface density. The value of derived in this study tends to be smaller than those obtained in previous studies for the Milky Way and nearby star-forming galaxies. This fact can be attributed to our measurements being biased toward the inner region; we measured at 0.85 and 0.76 times smaller in radius than the previous works for nearby star-forming galaxies and the Milky Way, respectively.
1 Introduction
Stars are formed in dense and cold molecular clouds, which mainly consist of molecular hydrogen (H2). It is important to measure the precise amount and distribution of H2 gas to understand star formation in galaxies. However, H2 molecules cannot emit line emission at the low temperature of molecular clouds, 10 K, because they do not have permanent dipole moments. This indicates that H2 molecules in molecular clouds cannot be directly observed. Carbon monoxide (CO) is the most common tracer of H2 gas mass in molecular clouds. 12CO() is easily excited in molecular clouds by frequent collisions with H2 molecules because the energy gap of 12CO rotational transition between to is low ( K, where is the energy gap between to and is the Boltzmann constant). Thus, 12CO() emission is widely used as a cold H2 gas tracer. The H2 column density () is often derived from the integrated intensity of 12CO() () by using the empirical CO-to-H2 conversion factor () with the following equation:
| (1) |
The mass surface density of molecular gas () is also derived using the CO-to-H2 conversion factor of including a factor of 1.36 for helium using the following equations:
| (2) |
The measurements of or in galaxies are necessary to estimate accurate molecular gas mass and understand star formation in galaxies.
The Galactic conversion factor pc-2 (K km s-1)-1 or cm-2 (K km s-1)-1 (e.g., [Bolatto, Wolfire & Leroy (2013)]) has been widely used to estimate the molecular gas mass of galaxies. On the other hand, studies have reported that depends on various properties of the interstellar medium (ISM). For example, the CO-to-H2 conversion factor in galaxies with low metallicity tends to be larger than that with high metallicity (e.g., [Arimoto, Sofue & Tsujimoto (1996)], [Gratier et al. (2010)], [Leroy et al. (2011)], [Narayanan et al. (2012)]). Ultra-luminous infrared galaxies and merger galaxies with active star formation tend to have a lower CO-to-H2 conversion factor than the galactic value (e.g., [Downes & Solomon (1998)], [Narayanan et al. (2011)], [Papadopoulos et al. (2012)]). These studies suggest that would be different among galaxies and within a galaxy depending on the physical properties of the ISM or local environments within a galaxy. Therefore, spatially-resolved CO mapping data of various galaxies is essential to investigate the variety of among different galaxies and within a particular galaxy.
Sandstrom et al. (2013) (hereafter S13) statistically investigated in 26 nearby star-forming galaxies using the data of HERA CO-Line Extragalactic Survey (HERACLES, Leroy et al. (2009)), which was the 12CO() mapping survey of nearby galaxies with the IRAM 30-m telescope. The mean , where is the which is the isophotal radius at 25 mag arcsec-2 in the band, of 26 galaxies is 4.4′. S13 measured by using CO integrated intensity (K km s-1), atomic gas mass surface density ( pc-2), and dust mass surface density ( pc-2) by using the following equation:
| (3) | |||||
where DGR is the mass surface density ratio of interstellar dust to that of interstellar gas. The total gas mass surface density (= + ) includes a factor of 1.36 for helium. S13 derived considering the following assumptions: (1) dust and gas are mixed well, (2) DGR does not depend on the gas phase, namely, atomic or molecular gas, (3) the fraction of mass in the ionized gas is negligible, (4) the line ratio of 12CO() to 12CO(), , is constant for the HERACLES samples (; e.g., Rosolowsky et al. (2015)), and (5) DGR is constant on kiloparsec scale. Furthermore, their and DGR were measured in each hexagonal region called “solution pixel” on kiloparsec scales. They measured at which the scatter of DGR was minimized in each solution pixel. Finally, they reported that the average for their samples was 3.1 pc-2 (K km s-1)-1 with a standard deviation of 0.3 dex.
Because the energy of from the ground level of 12CO is 16.6 K, which is higher than the temperature of typical molecular clouds (10 K; Scoville & Sanders (1987)), depends on the excitation condition of molecular gas. Studies have reported that is not constant within a galaxy and that is inappropriate in certain nearby galaxies. Koda et al. (2012) investigated the variation of within the nearby spiral galaxy M 51 by using 12CO data observed by the Combined Array for Research in Millimeter Astronomy (CARMA), the Nobeyama 45-m radio telescope, and the IRAM 30-m telescope. They obtained that in the interarm regions is typically (often 0.4 – 0.6) and the rise of in the spiral arms (often 0.8 – 1.0) and central region (0.8 – 1.0). Yajima et al. (2021) presented the variations of among 24 nearby galaxies by using 12CO data observed by the Nobeyama 45-m radio telescope and the IRAM 30-m telescope. They reported that the median of for 24 nearby galaxies is 0.61, and the weighted mean of by 12CO() integrated intensity is 0.66 with a standard deviation of 0.19. Considering the variation of from 0.7 within and among galaxies reported in these studies, the assumption of a constant could impose additional uncertainty on the estimation. Therefore, statistical studies of without the assumption of are required. Although it is necessary to measure in nearby galaxies by using 12CO() data without additional uncertainties, statistical studies regarding using 12CO() mapping data are limited. Therefore, we measured in nearby galaxies using the data of the large 12CO() mapping surveys of nearby galaxies and investigated the relation between and various properties of the ISM. We used the spatially-resolved 12CO() data of CO multi-line imaging of nearby galaxies (COMING, Sorai et al. (2019)) obtained with the multi-beam receiver FOur-beam REceiver System (FOREST, Minamidani et al. (2016)) on the Nobeyama 45-m radio telescope. For COMING, the mapping region covers 70% of the optical disk diameter with a kiloparsec scale resolution. We also used the spatially-resolved 12CO() data from the Nobeyama CO Atlas of nearby galaxies (CO Atlas, Kuno et al. (2007)). Fifteen out of 40 galaxies have larger optical diameter than the mean optical diameter of the samples of S13 (). They are also sufficient to derive in nearby galaxies. We measured in nearby galaxies for the sample galaxies of the COMING and the CO Atlas by modifying the method of S13 using 12CO() instead of 12CO().
We explain the sample selection and the method for measuring and DGR in section 2. In section 3, we present the derivation of resolved , , and . Details regarding the ancillary data for metallicity and SFR used in section 6 are presented in section 4 followed by the results of the and DGR measurements in our sample galaxies in section 5. In subsection 6.1, we discuss the correlation of the and DGR values with metallicity and SFR. In subsection 6.2, we compare the value of obtained in this study with the standard value in the Milky Way (MW) and derived by S13 and discuss the cause of the difference between them.
2 Sample selection and measurement method of and DGR
2.1 Sample selection
We set two criteria for sample selection. First, because our method to measure requires infrared and Hi data, in addition to CO, we selected the galaxies of COMING and CO Atlas whose archival data of Hi and infrared wavelengths is available. For the Hi data, we used the archival data of the Hi Nearby Galaxies Survey (THINGS, Walter et al. (2008)) and the VLA Imaging of Virgo in Atomic gas (VIVA, Chung et al. (2009)). For the galaxies that were not included in the THINGS and the VIVA, we obtained the data from the NRAO Science Data Archive and performed data reduction. For IC 342, we used Hi data of Crosthwaite et al. (2000) observed by the Very Large Array (VLA). For the infrared data, we used the archival data of the DustPedia project (Davies et al. (2017)), which was the legacy project of the Space Observatory and releases photometric data across 42 UV-microwave bands for 875 galaxies. Second, we excluded galaxies that were categorized as edge-on in table 1 of Sorai et al. (2019) because we were investigating the radial variation of and DGR within the galaxies. We also selected three interacting galaxy pairs from the COMING samples: NGC 4298/NGC 4302, VV 219 (NGC 4567/NGC 4568), and Arp 116 (NGC 4647/NGC 4649). We excluded NGC 4302 because this galaxy was classified as edge-on. We divided NGC 4567 and NGC 4568 by using the filamentary structure described in Kaneko, Kuno & Saitoh (2018) as the boundary between NGC 4567 and NGC 4568 and measured and DGR in each galaxy. We excluded NGC 4649 because CO emission from this galaxy was very faint and we could not detect it significantly. Finally, we analyzed 40 nearby galaxies listed in table Acknowledgments.
2.2 Method
As explained in section 1, we used the integrated intensity of 12CO() (), the atomic gas mass surface density (), and the dust mass surface density () to obtain and DGR. The grid size and beam size of all data were matched to the data with the largest grid and beam sizes among 12CO(), Hi and the infrared data we used. The adopted grid size and beam size for the measurements of and DGR are listed in table Acknowledgments.
We determined and DGR simultaneously by using the fitting described in the following equations:
| (4) |
| (5) |
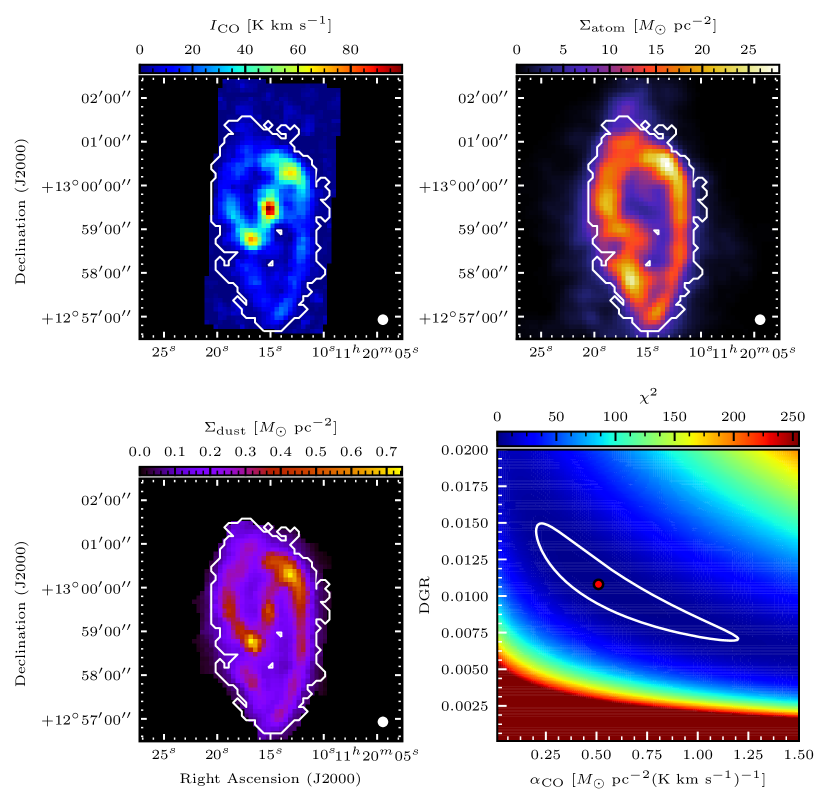
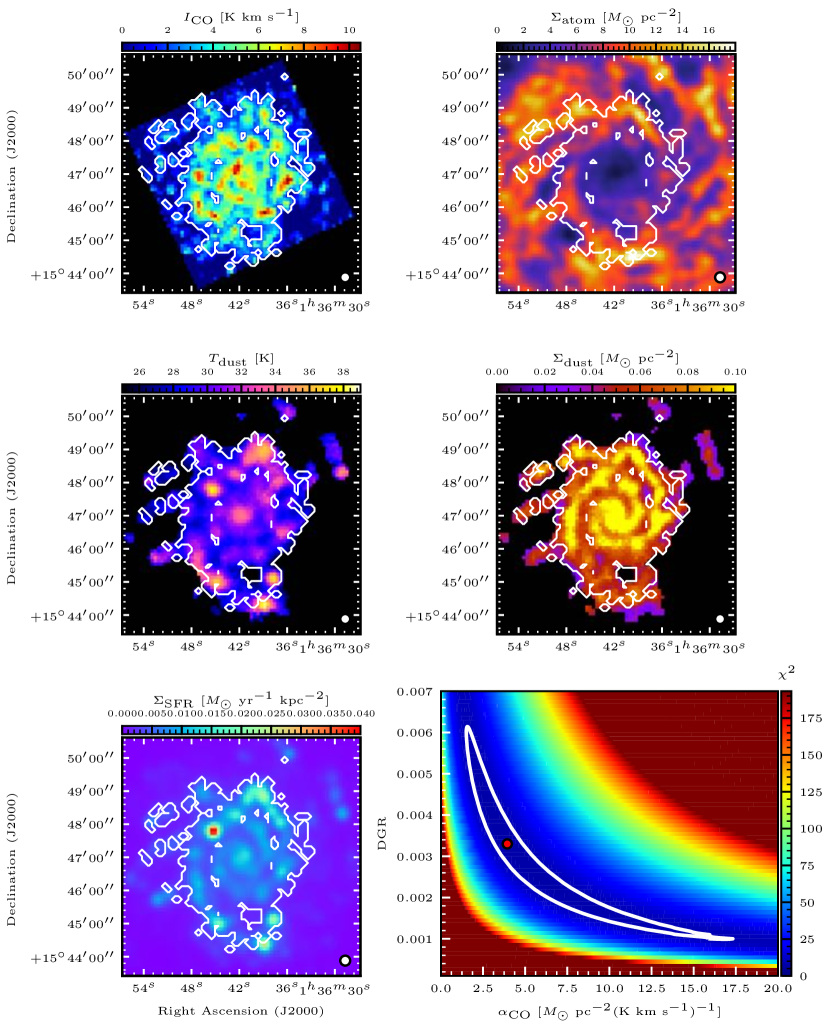
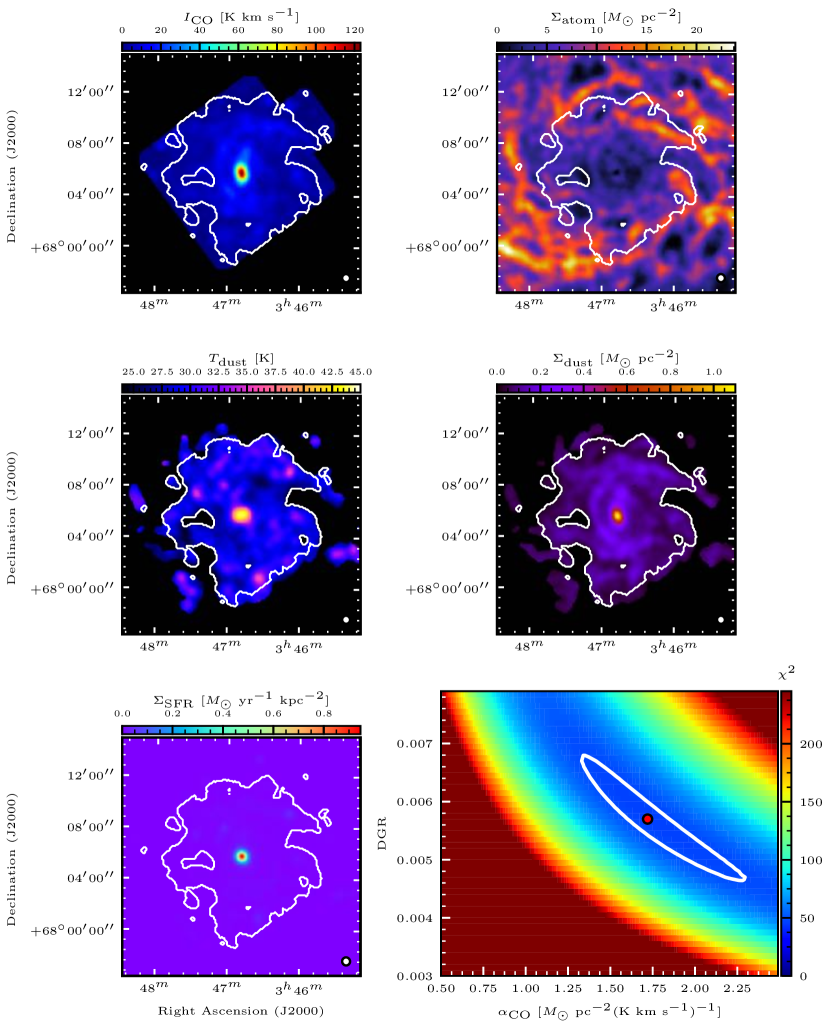
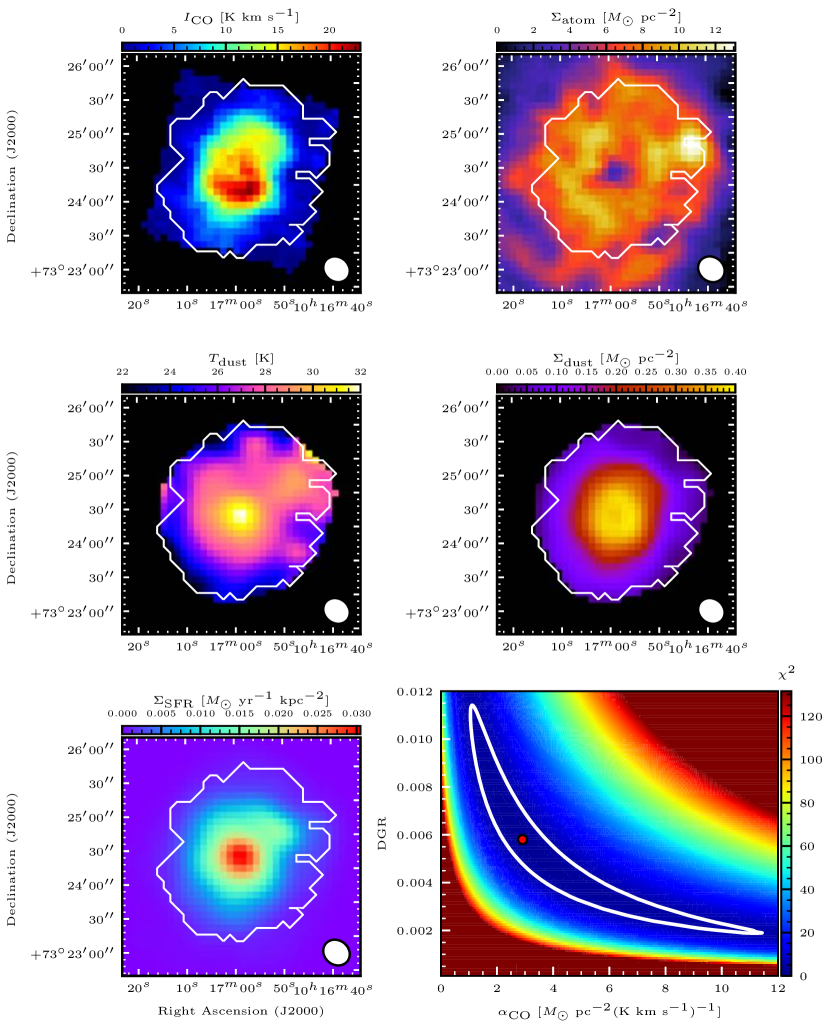
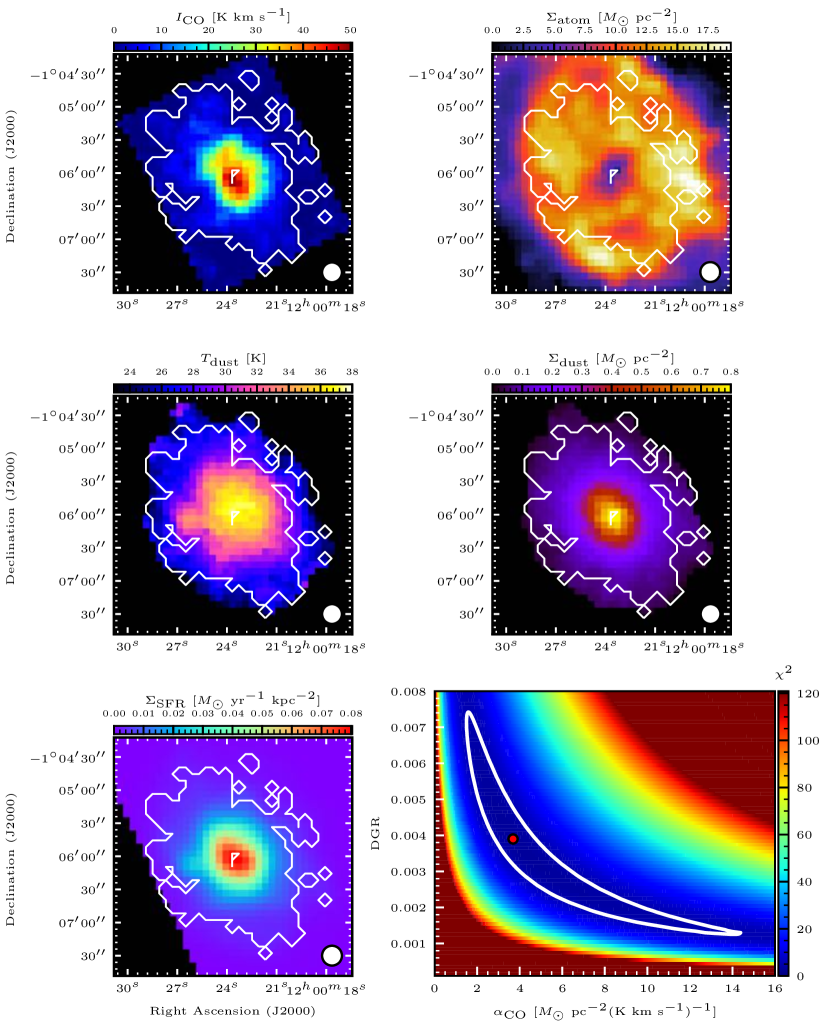
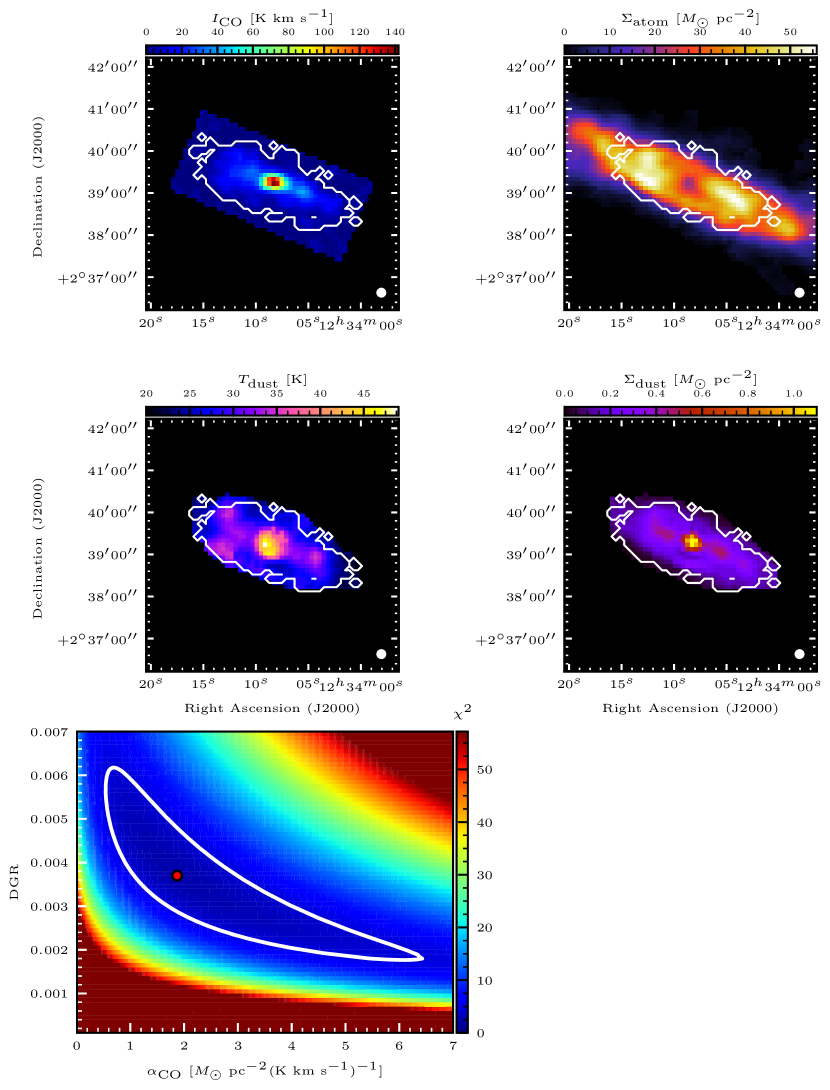
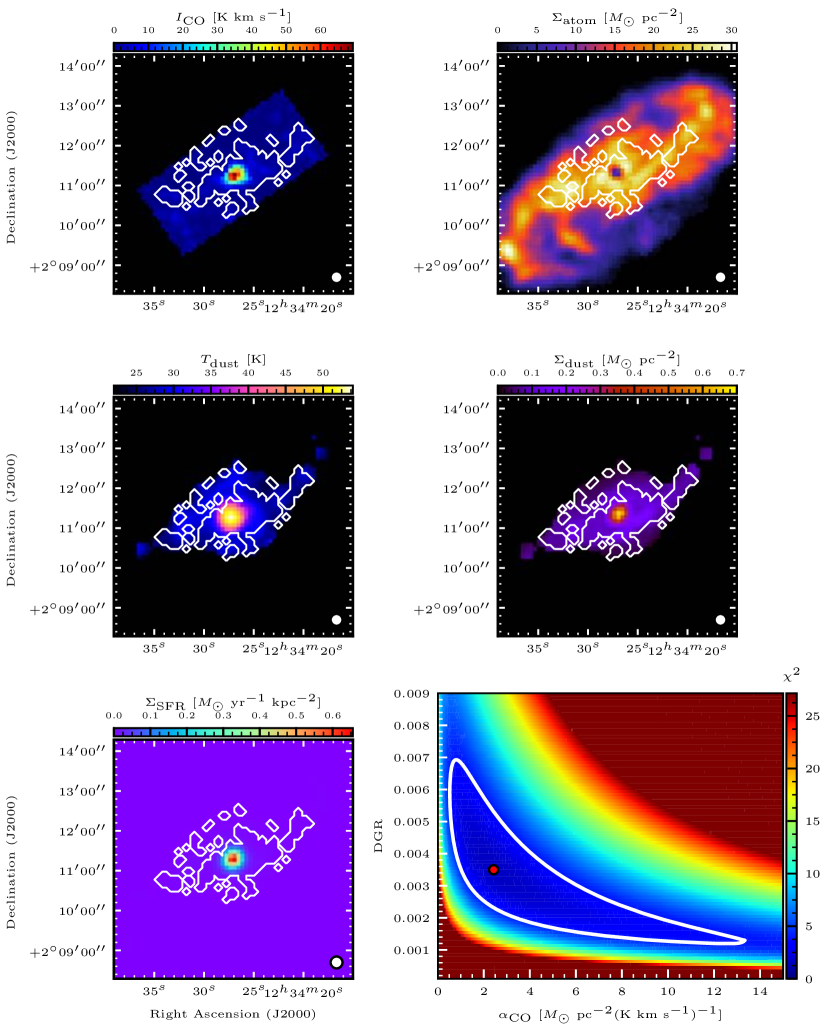
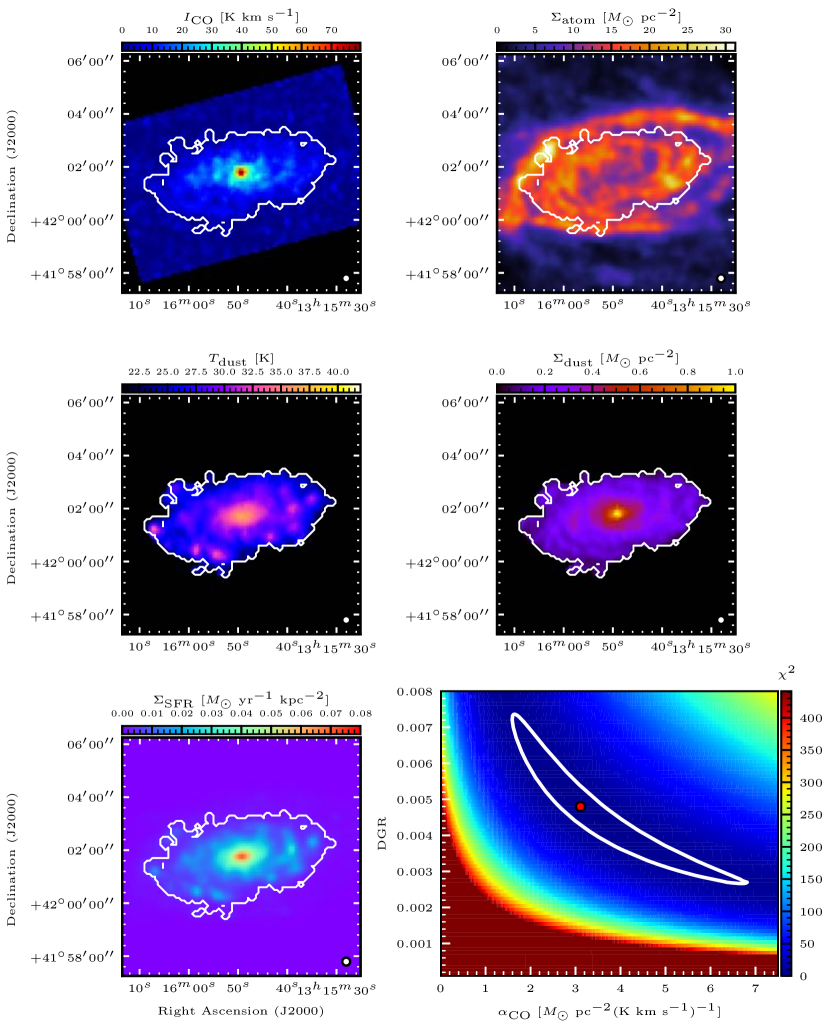
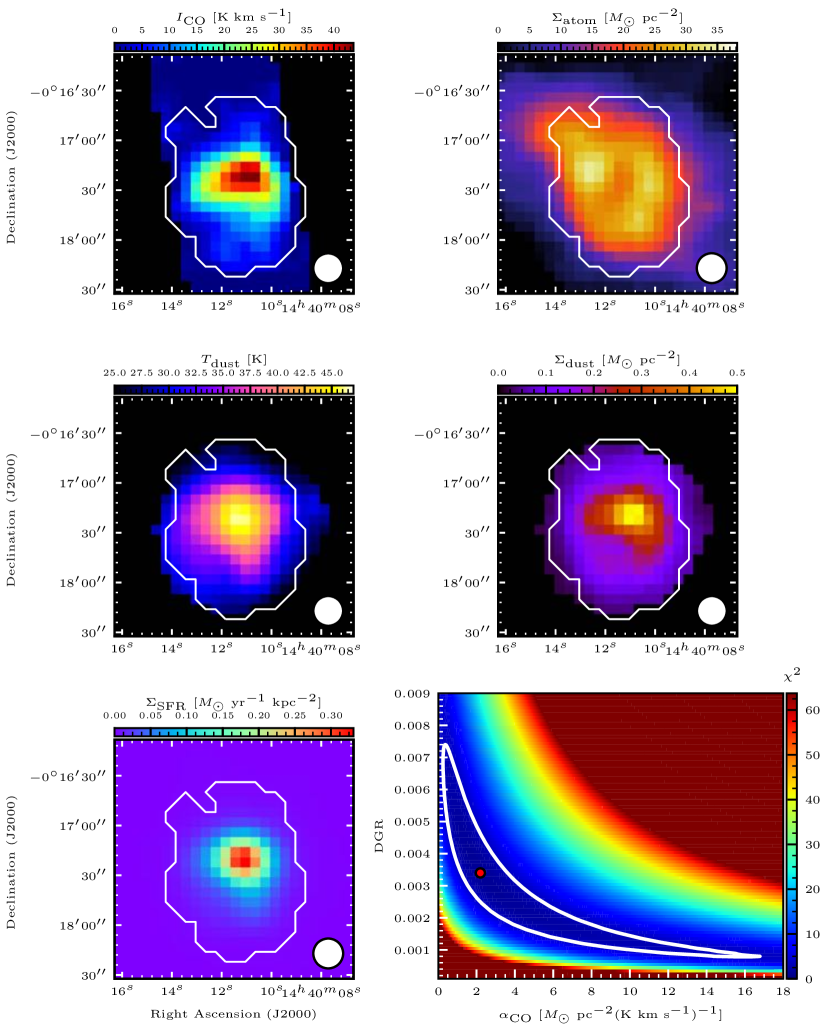
We calculated the dust mass surface density () in each pixel () by using equation (4), changing and DGR as free parameters. , , and are the observed values and corrected for the inclination of a galactic disk by multiplying , where is the inclination angle listed in table Acknowledgments. Thus, we calculated the value of by using equation (5) and the observed dust mass surface density () and in the region where , , and the infrared intensity 3rms noise of emission-free regions in an infrared intensity map. and are the error of integrated intensity of CO and Hi, respectively. The derivations of these physical quantities are described in section 3. The fitting assumes that and DGR are constant over the region where and DGR are measured. We find the optimal values of and DGR which minimize the value of (), indicating the minimized difference between and . As an example, figure 1 presents the result of NGC 3627. The top left, top right, and bottom left panels are maps of , , and , respectively. The measurement regions of and DGR are shown as the white contour in these panels. The bottom right panel shows the calculated result of equation (5), and the red point in the panel presents and DGR, which minimizes the value for optimization. The calculated results of equation (5) for other galaxies are shown in the Appendix A.
The optimal values of and DGR were searched within the ranges of pc-2 (K km s-1)-1 with a step of 0.01 pc-2 (K km s-1)-1and with a step of 0.0001, respectively. We determined the maximum of the ranges of (= 50.0 pc-2 (K km s-1)-1) and DGR () by referring to the observational studies of , DGR, and metallicity in nearby galaxies including our samples. In the measurement regions of our samples, the range of normalized metallicity () estimated by the metallicity () from Pilyugin et al. (2014) presented in subsection 4.2 and the one in the solar neighborhood () from Pilyugin et al. (2006) is 0.6 – 2.9.
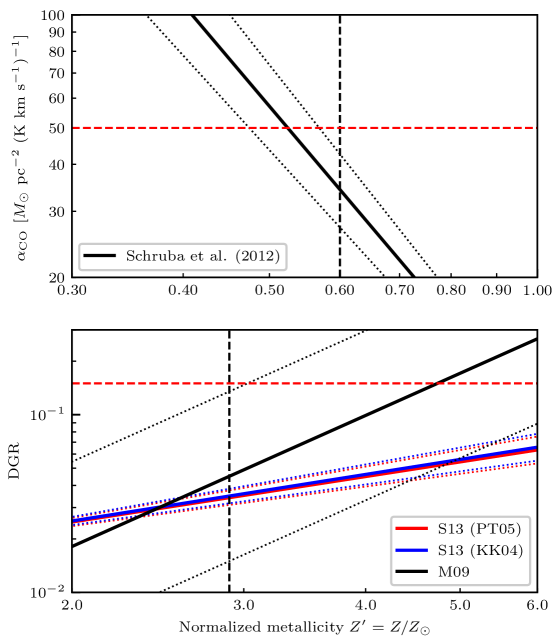
The top panel of figure 2 shows as a function of investigated by several studies of nearby galaxies. For the range of our , we referred to the result listed in the top row of table 7 from Schruba et al. (2012), who measured global derived from , where is a constant H2 depletion time and is a observed CO luminosity, in dwarf and spiral galaxies. 22 out of 40 samples in this study overlap with the samples from Schruba et al. (2012). Considering the relation between the result of Schruba et al. (2012) and the minimum as shown in the top panel of figure 2, we suspected that of our samples were lower than 50 pc-2 (K km s-1)-1.
The bottom panel of figure 2 shows DGR as a function of investigated by several studies of nearby galaxies. For the range of our DGR, we referred to the results of Muñoz-Mateos et al. (2009) (hereafter M09) and S13. M09 measured the radial variations of DGR for 12 spiral galaxies by combining Hi profiles from the THINGS with CO profiles from the literature and using the metallicity-dependent CO-to-H2 conversion factor. Seven out of 12 samples of M09 overlap with our samples. They obtained the linear fitted relation between the measured DGR and metallicity of Moustakas et al. (2010) with the oxygen abundance calibrated by Kobulnicky & Kewley (2004) (hereafter KK04) while they did not evaluate the error of fitting. We investigated the relation between the metallicity measured by using values listed in table 8 of Moustakas et al. (2010) and the radial DGR values, which were measured in galaxies whose CO and Hi data were available and listed in table 4 of M09. We found that 74% () of their radial DGR followed their linear fit within a factor of three. Therefore, we defined the range within a factor of three around the linear fit of M09 as the error of the linear fit. S13 also obtained the linear fitted relation between DGR and metallicity with the oxygen abundance calibrated by KK04 and Pilyugin & Thuan (2005) (hereafter PT05) in eight spiral galaxies overlapping with our samples. Considering the relation between their results and the maximum as shown in the bottom panel of figure 2, we suspected that DGR of our samples was lower than 0.15.
2.3 Uncertainties of and DGR
To evaluate the uncertainties of and DGR, we adopted a confidence interval of parameters denoted as for the fitting. If there are two free parameters used in the fitting, the 1 confidence interval of the parameters is . Therefore, the uncertainties of and DGR are estimated from the minimum and maximum values of and DGR with . The white contour shown in the bottom right panel of figure 1 is an example of the curve with . If of and DGR extends outside of the parameter search space, we exclude the galaxy from the analysis of and DGR.
Our method determining the uncertainties in and DGR is different from that of S13. The uncertainties of and DGR in S13 were determined by Monte Carlo tests and bootstrapping iterations. Our method can measure the uncertainties of and DGR in a simple way compared to the S13 method using the method.
3 Derivation of physical quantities
3.1 CO integrated intensity
We used the 12CO() mapping data obtained in the COMING project (Sorai et al. (2019)) and the archival data of the CO Atlas (Kuno et al. (2007)) project to measure . The original angular resolutions of COMING and CO Atlas are \timeform17” and \timeform15”, respectively. The pixel size of COMING and the CO Atlas archival data are \timeform6” and \timeform1”, respectively. We used the auto-reduction system COMING-ART for the data reduction of COMING. COMING-ART contains the procedures for flagging bad data, baseline subtraction, and basket-weaving. Details regarding data reduction are described in Sorai et al. (2019).
The integrated intensity of CO () is evaluated as follows:
| (6) |
where is the number of emission channels, is the velocity width of one channel (= 10 km s-1). Sorai et al. (2019) determined the emission channels of the COMING cube data by identifying the channels above 2.5 in the smoothed cube by pixels in space. We also determined the emission channels of CO Atlas cube data adopting the same method.
The error of () is evaluated as follows:
| (7) |
where is the rms noise temperature on the scale (K) and is the total velocity width of identified emission channels ( km s-1). was calculated in the baseline range. For the COMING cube data, 200 km s-1 at the edges of the observed velocity range was defined as the baseline channels. For the CO Atlas cube data, the baseline range was determined by eye. To measure and DGR in the region where 12CO() emission is significantly detected, we masked the pixels where . The distribution of in individual galaxies is shown in the Appendix A.
3.2 Atomic gas mass surface density
For galaxies in the THINGS and the VIVA projects, and IC 342 (Crosthwaite et al. (2000)), we measured by using their publicly available Hi integrated intensity map. For galaxies whose data were obtained from the NRAO Science Data Archive, was derived by integrating over the entire velocity range of each spectrum. Assuming that the optical depth of Hi gas is thin, is calculated by the following equation:
| (8) |
where is the Hi integrated intensity. This equation includes a factor of 1.36 for helium. We masked the pixel where to measure and DGR in the region where Hi emission is significantly detected. For the THINGS samples, Walter et al. (2008) reported that the typical sensitivity of was 0.5 pc-2, which corresponds to , at resolution. Therefore, we convolved the publicly available Hi integrated intensity map of the THINGS with a Gaussian kernel to match resolution and masked the pixel where of the convolved map was lower than . For the samples from the NRAO Science Data Archive, we determined the emission channels by identifying the channels with in the smoothed cube convolved to twice the original beam size. We made a map of by using the identified Hi emission channels and equation (6) and measured by using equation (7). of Hi data was calculated in the velocity ranges which were not identified as Hi emission channel. To identify Hi emission channels and derived maps of and for the VIVA samples, we adopted the same method as samples of the NRAO Science Data Archive to archival cleaned cube data of VIVA. For IC 342, we masked pixels of with negative value because there was no archival cube data for Hi and we could not evaluate from equation (7). The distributions of in individual galaxies are shown in the Appendix A.
3.3 Dust mass surface density
Our samples mainly comprise star-forming galaxies and the peak of the spectral energy distribution (SED) of the cold dust component in a star-forming galaxy is located in the wavelength range of 100 to 200 m (e.g., Boselli et al. (2003); Dale et al. (2012)). Therefore, we measured the dust mass by using the infrared data of DustPedia (Clark et al. (2018)) from the archived PACS 70, 100, 160 m, and SPIRE 250 m photometry. can be derived from the dust temperature and infrared flux density (e.g., Hildebrand (1983), Gall, Hjorth & Andersen (2011)) using the following equation:
| (9) |
where is the infrared flux density at a frequency , is the dust absorption coefficient, is the distance to a galaxy, and is the Planck function as a function of dust temperature (). Finally, is derived by converting to the mass surface density in units of in each pixel. We used the infrared flux density at 250 m to measure because the angular resolution (original FWHM = \timeform18”; Clark et al. (2018)) is similar to that of the 12CO() data of COMING. We adopted the dust absorption coefficient111https://www.astro.princeton.edu/ draine/dust/dustmix.html at 250 m of 3.98 cm2 g-1 derived from the model using the dust size distribution for in the Milky Way (Weingartner & Draine (2001)).
We can obtain the distribution of by the SED fitting at each pixel in the infrared maps. We adopted the SED model of Casey (2012) (hereafter C12) to obtain . C12 described the SED model (), in which a modified blackbody (i.e., greybody) dominates at wavelengths 50 m, whereas a power law dominates at wavelengths 50 m. The model is described as follows:
| (10) |
| (11) |
, , , and are free parameters; is the normalization of the greybody term, is the galaxy’s characteristic cold dust temperature (), is the emissivity, and is the mid-infrared power-law slope. is the wavelength at which the optical depth is at unity ( 200 m). is the normalization of the power-law term. is the wavelength where the mid-infrared power law turns over and described by and as follows:
| (12) |
where , , , and . Details regarding are described in table 1 of C12, which suggests if there are more than three independent photometric points at , should be maintained as a free parameter; otherwise, the fixed should be adopted. They also suggested that if the photometric points are more than three at , should be maintained as a free parameter; otherwise, a fixed should be adopted. In our study, the photometric points are less than three at and . Therefore, we applied fixed and for all samples listed in table Acknowledgments.
We performed the SED fitting with the C12 SED model as follows:
-
1.
We calculated the rms noise of the background in the 70, 100, 160, and 250 m data for the emission-free region.
-
2.
If the infrared flux density at a pixel () is lower than at one or more wavelengths, the pixel () is not used for the SED fitting.
-
3.
We determined the optimal and of the SED model by fitting the observed data using the non-linear least squares in each pixel and obtained the distribution of the dust temperature ().
The distributions of and in individual galaxies are shown in the Appendix A.
4 Ancillary data
Metallicity affects the abundance of interstellar dust, CO and H2 (e.g., Arimoto, Sofue & Tsujimoto (1996), Leroy et al. (2011), Rémy-Ruyer et al. (2014)). Therefore, and DGR are expected to be related to metallicity. Furthermore, depends on the gas density and temperature of molecular clouds (e.g., Bolatto, Wolfire & Leroy (2013)), which are related to the star-formation activity of molecular clouds. Therefore, we discuss the dependence of and DGR on metallicity and SFR.
4.1 Star formation rate
We obtained the SFR surface density () to discuss the correlation with and DGR in subsection 6.1. is measured by using far-ultraviolet (FUV) and mid-infrared 24 m as a tracer of SFR with the following equation (Leroy et al. (2008)):
| (13) |
where and are the intensities of FUV and 24 m, in units of MJy sr-1, respectively, and corrects the inclination angle of a galaxy. We obtained the distribution of in individual galaxies by using the archival data of the FUV and 24 m from the DustPedia project. Clark et al. (2018) reported that the DustPedia acquired the UV data observed by the GALaxy Evolution eXplorer (GALEX; Morrissey et al. (2007)) from the GR6/7 data release (Bianchi (2014)) and the 24 m observed by the Space Telescope and provided from the MIPS Local Galaxies Program (Bendo et al. (2012)). The original FWHM of the FUV and 24 m from DustPedia are \timeform5.3” and \timeform6”, respectively. The original grid sizes of these wavelengths are \timeform3.2” and \timeform2.4”–\timeform2.6”, respectively. For NGC 628, we used the 24 m data observed by the Local Volume Legacy (Dale et al. (2009)), whose beam size and grid size were \timeform6” and \timeform1.5”, respectively, owing to the lack of data of 24 m in the DustPedia project. The maps of FUV and 24 m were regridded and convolved with a Gaussian kernel to match the spatial resolution listed in table Acknowledgments.
4.2 Metallicity
We discuss the correlation of metallicity with and DGR. We used the metallicity reported by Pilyugin et al. (2014). They investigated the distributions of the abundance of gas phase oxygen and nitrogen across the optical disks from 3740 spectra of the Hii regions in 130 nearby late-type galaxies by combining the line intensities of [O ii]3727+3729, [O iii]5007, [N ii]6584, [S, ii]6717, and [S ii]6731 normalized by H. They modeled the radial distribution of the oxygen abundance () within the isophotal radius in each galaxy as follows:
| (14) |
5 Results
5.1 Global and DGR
The regions where and DGR were measured in each galaxy are shown in the Appendix A. In 18 out of 40 galaxies, the 1 range of of DGR extended outside the parameter search regions of and DGR. These galaxies do not have a sufficient number of pixels for the fitting owing to the low signal-to-noise ratio of the CO data or the small contrast of CO/Hi to derive and DGR using this method. Small contrast in the CO/Hi ratio (/ constant) causes the degeneracy of and DGR in equation (4) and increases the 1 range of and DGR. We did not use these galaxies for subsequent analysis. Finally, we obtained and DGR for 22 spiral galaxies. We define these and DGR as “global” and DGR, (global) and DGR(global). These values and the largest radius of the measurement regions in individual galaxies are listed in table Acknowledgments. Among the interacting galaxies listed in table Acknowledgments, we obtained (global) and DGR(global) in the spiral galaxy NGC 4568 only. The mean radius of the measurement regions of (global) and DGR(global) for the 22 spiral galaxies is 0.38. The average and standard deviation of (global) and DGR(global) for the 22 spiral galaxies are pc-2 (K km s-1)-1and , respectively. The values of (global) in 20 out of 22 spiral galaxies are lower than the standard values in the Milky Way pc-2 (K km s-1)-1 in Bolatto, Wolfire & Leroy (2013). The comparison of (global) with (MW) is discussed in sub-subsection 6.2.2.
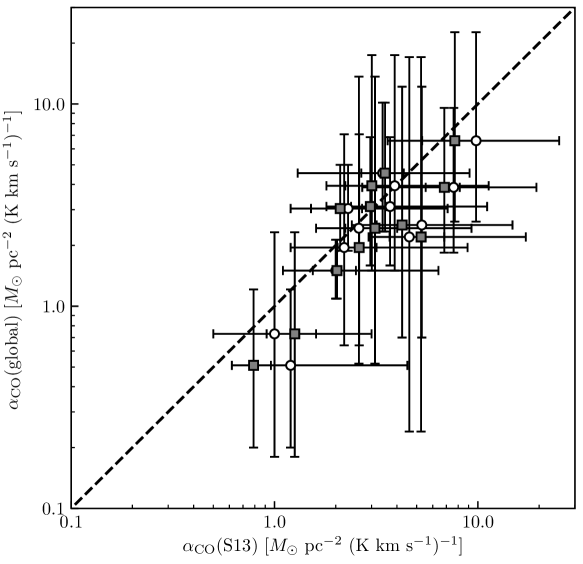
Thirteen out of 22 galaxies are in common with samples of S13 as shown in figure 3. For the 13 galaxies, table Acknowledgments presents the values of (global) in this study and the mean values of obtained by S13 in individual galaxies ((S13)). The values of (global) in 10 out of 13 galaxies are lower than those of S13. S13 adopted the constant to measure (S13). Yajima et al. (2021) reported the mean weighted by the integrated intensity of 12CO() () in nearby galaxies. was derived using the COMING and the CO Atlas for 12CO(), and the HERACLES for 12CO(). The range of in 13 galaxies is 0.46–0.88. Figure 3 also shows (S13) corrected for by (S13) (gray squares). We discuss the difference between (global) and (S13) in sub-subsection 6.2.1: (1) total dust mass, (2) CO()/CO() line ratio , and (3) difference in the data sampling area.
5.2 Radial variations of and DGR
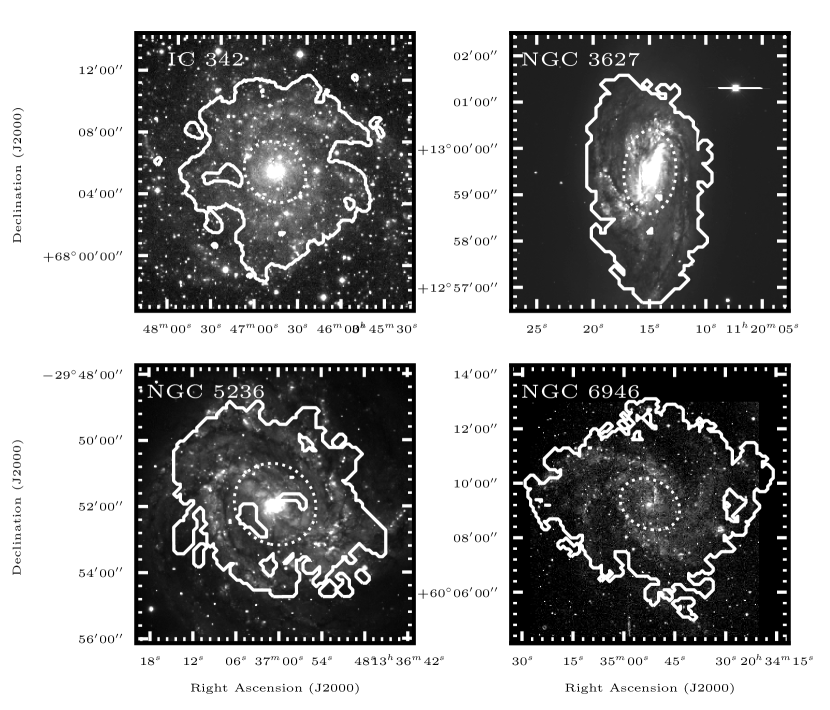
We investigated the radial variation of and DGR for the galaxies whose (global) and DGR(global) are discussed in subsection 5.1. To obtain an adequate amount of pixels used for the fitting and sufficient contrast of the CO/Hi ratio, we divided the region within a galaxy only into inner and outer regions. We adopted 0.2 as the boundary of the inner and outer regions, as we could obtain and DGR in both the inner and outer regions in the largest number of galaxies with the boundary. We define and DGR in the inner region as (inner) and DGR(outer) and those in the outer region as (outer) and DGR(outer). Finally, we obtained and DGR in the inner and outer regions of the following four barred spiral galaxies: IC 342, NGC 3627, NGC 5236, and NGC 6946, as listed in table Acknowledgments. The boundary of 0.2 in each four galaxies is shown in figure 4. The inclination and the position angle were corrected. In these galaxies, the inner region includes the center and the bar structure, while the outer region includes the spiral arms. The average and standard deviation of (inner) and DGR(inner) are pc-2 (K km s-1)-1 and , while (outer) and DGR(outer) are pc-2 (K km s-1)-1 and , respectively. In each galaxy, while (outer) is 2.3 to 5.3 times larger than (inner), DGR(outer) is 0.3 to 0.6 times smaller than that DGR(inner). Moreover, the mean values of (inner) and (outer) are smaller than the mean (global) within the whole samples ( pc-2 (K km s-1)-1). The four galaxies with (inner) and (outer) also have the lower (global) than the mean (global). Therefore, our measurement of the radial variation of is biased towards the galaxies with small (global) and this causes the small (inner) and (outer).
The radial variation of and DGR in galaxies has also been reported in previous studies. Cormier et al. (2018) found that has lower values in the center of eight nearby spiral galaxies. Nakai & Kuno (1995) measured in M 51 and reported cm-2 (K km s-1)-1 ( pc-2 (K km s-1)-1) in the inner region ( \timeform1.2’) and cm-2 (K km s-1)-1 ( pc-2 (K km s-1)-1) in the outer region ( \timeform2’). S13 found the decrease in DGR with a galactocentric radius in nearby star-forming galaxies. Giannetti et al. (2017) demonstrated the radial variation of the gas-to-dust ratio () as a function of the galactocentric radius between 2 kpc and 20 kpc from the center of the Milky Way by the following equation:
| (15) |
where is the galactocentric radius in units of kpc.
5.3 Relations with environmental properties
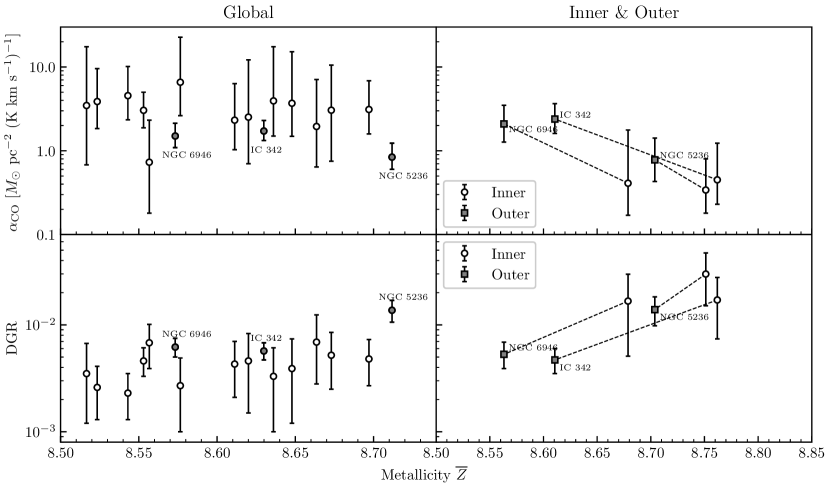
We investigated the correlations of and DGR with metallicity and SFR. Figure 5 presents the relations of and DGR with metallicity. and DGR in the left panels are the global values listed in table Acknowledgments. The metallicity in the left panels of figure 5 is the average over pixels where (global) and DGR(global) are measured. We define this metallicity as (global). The results of NGC 3147, NGC 3627, NGC 4527, NGC 4536, NGC 4568, and NGC 5713 are not plotted owing to the lack of metallicity data in Pilyugin et al. (2014). The Spearman’s rank correlation coefficient of (global) and DGR(global) with (global) in the left panels of figure 5 are 0.15 and 0.19, respectively. The right panels of figure 5 present and DGR in the inner and outer regions measured listed in table Acknowledgments as a function of metallicity which is the average over pixels where and DGR in the inner and outer regions are measured. We define the metallicity in the inner region as (inner) and that in the outer region as (outer). The Spearman’s rank correlation coefficients of and DGR with in the inner and outer regions are and 0.83, respectively. We can find a clearer correlation of metallicity with and DGR in the inner and outer regions than (global) and DGR(global).
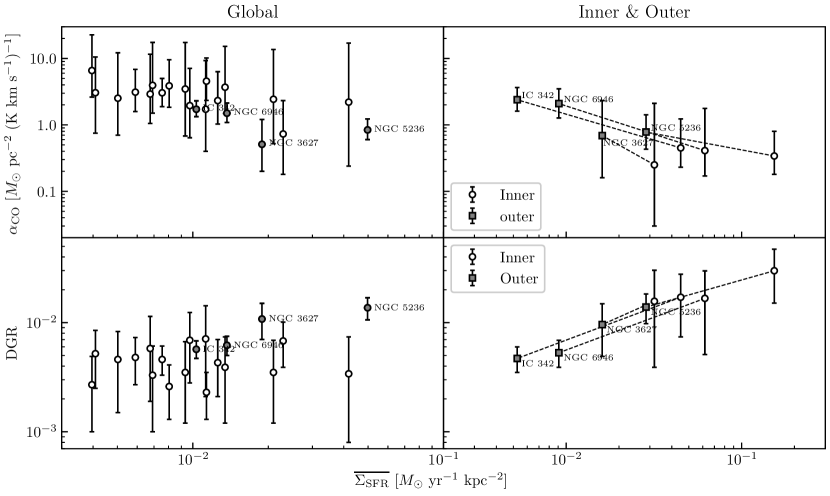
Figure 6 presents the relations of and DGR with . and DGR in the left panels are the global values listed in table Acknowledgments. NGC 4527 is not plotted in the left panels of figure 6 due to the lack of 24 m data. The SFR surface density in the left panels of figure 6 is the average over pixels where (global) and DGR(global) are measured. We define this average as (global). The Spearman’s rank correlation coefficient of (global) and DGR(global) with (global) are and 0.29, respectively. The right panels of figure 6 present and DGR in the inner and outer regions measured listed in table Acknowledgments as a function of SFR surface density which is the average over pixels where and DGR in the inner and outer regions are measured. We define the average in the inner region as (inner) and that in the outer region as (outer). The Spearman’s rank correlation coefficients of and DGR with in the inner and outer regions are and 0.98, respectively. As with metallicity, a more apparent correlation for the radial values can be observed compared to the global values. We discuss the difference of these correlations between global values and radial values in subsection 6.1.
6 Discussion
6.1 Dependence of and DGR on environmental properties
We discuss the dependence of and DGR on the metallicity obtained from figure 5. According to theoretical models (e.g., Bolatto et al. (1999)), in the low metallicity region, CO photodissociation is promoted owing to the decrease in interstellar dust and CO abundance. Although H2 is also dissociated by FUV, it is more likely to exist in the outer layer of a molecular cloud than CO owing to its stronger self-shielding. Observations indicate that low metallicity galaxies have a large . For example, Arimoto, Sofue & Tsujimoto (1996) measured as a function of metallicity for nearby spiral and dwarf irregular galaxies and reported a linear relationship. Leroy et al. (2011) measured in local group galaxies, such as M 31, M 33, the large magellanic cloud (LMC), small magellanic cloud (SMC), and NGC 6822, utilizing the same relation between and DGR described in equation (3) used in this study. They found that low metallicity galaxies, such as NGC 6822 and SMC, whose metallicities are , have a large ( 30 and 70), while the of M 31, M 33, and LMC, whose metallicities are , are nearly constant () within a factor of two. They also found that DGR has a nearly linear relationship with metallicity in their samples. Large values of in SMC have also been reported in other previous studies (e.g., Israel (1997); Leroy et al. (2007)).
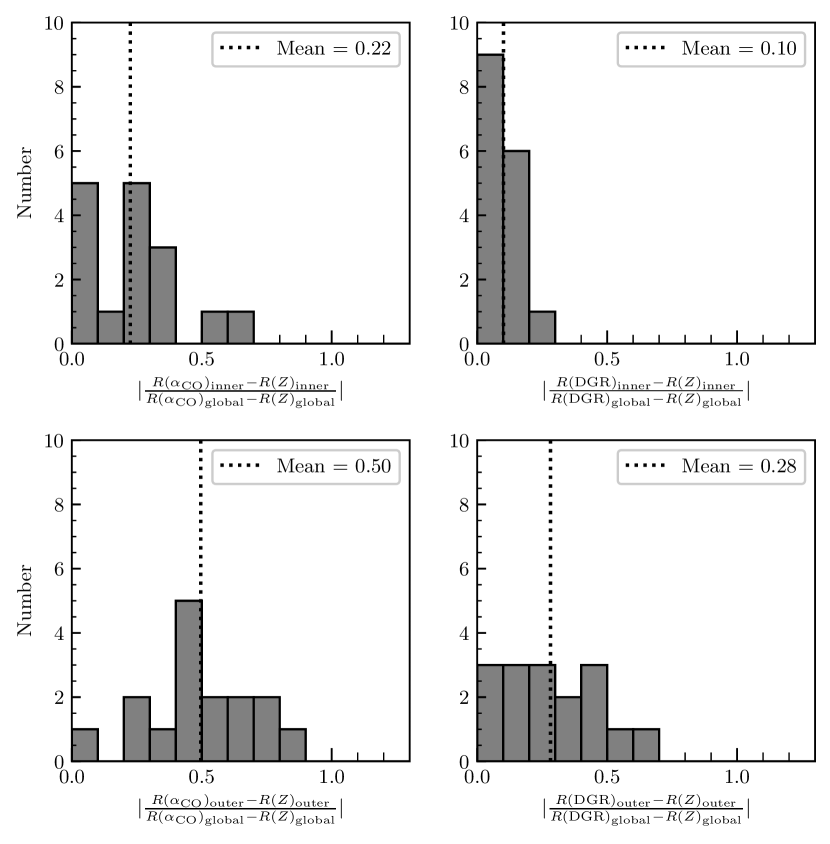
From the results of figure 5, we cannot find a significant correlation of (global) with (global) and DGR(global). This is because the diversity of among our sample galaxies is excessively large in the narrow metallicity range. This is also consistent with the previous studies in which was nearly constant in galaxies with . On the other hand, we can find a clearer correlation of metallicity with and DGR in the inner and outer regions than with (global) and DGR(global). We speculate that this results from the difference in the manner the values of , DGR, and metallicity are obtained. In our sample galaxies, the metallicity expressed by equation (14) decreases at a constant rate with a galactocentric radius, in contrast to the radial profiles of CO, Hi, and dust. When comparing (global) (or DGR(global)) and (global) within a galaxy, there is a discrepancy in the typical radius where their values are represented. On the other hand, when comparing (inner) (or DGR(inner)) and (inner) within a galaxy, the discrepancy of the typical radius where their radial values are represented becomes smaller because (inner) (or DGR(inner)) and (inner) are averaged within narrower regions than (global) (or DGR(global)) and (global). The comparison of (outer) (or DGR(outer)) with (outer) is also similar. To verify the speculation, we investigated the differences of typical radii of , DGR, and metallicity (, , and ) in the global, inner (), and outer () regions for galaxies which are listed in table Acknowledgments and have the data of metallicity. , , and are the average radii over pixels where and DGR are measured and weighted by , , and metallicity, respectively. We measured and in the global, inner, and outer regions and compared them. Figure 7 shows the histogram showing the absolute value of the ratio between (or ) in the inner region and that in the global region. All ratios are smaller than the unity, indicating that the difference of typical radius between (or DGR) and metallicity in the inner region is smaller than that in the global region. This trend is the same as in the case of the outer region. Therefore, we can find the correlation of (or DGR) with the metallicity by separating them into the inner and outer regions.
Note that the three galaxies (IC 342, NGC 5236, and NGC 6946) have a large metallicity gradient within their galactic disk among our samples. The gradient of metallicity is determined by in equation (14). Among our samples where (global) was measured, the three galaxies have the large values of while there are some galaxies with small like NGC 4321, NGC 4736, NGC 5248, and NGC 7331. If we can also obtain and DGR in the inner and outer regions of galaxies with small metallicity gradient, it is expected that the correlations between , DGR and metallicity in the inner and outer regions shown in the right panels of figure 5 are weak.
From figure 6, we can also find a clearer correlation of with and DGR in the inner and outer regions than with (global) and DGR(global). The decrease in the CO-to-H2 conversion factor in high SFR regions is suggested by the numerical simulations. Narayanan et al. (2012) investigated the variations of in merging galaxies. They suggested that decreases in high SFR regions because a higher kinetic temperature and larger velocity dispersion increases the CO integrated intensity. There are also observational studies supporting this prediction (e.g., Accurso et al. (2017); Morokuma-Matsui et al. (2020)). This trend is consistent with the expectation from the numerical simulations of .
In our samples, both and metallicity increase with a decreasing radius. Therefore, it is difficult to distinguish which metallicity or affect the radial variations of and DGR within a galaxy in this study. To solve this problem, the distributions of , DGR, metallicity, and with smaller spatial scales are necessary.
6.2 Comparisons with the previous studies
6.2.1 in Sandstrom et al. (2013)
We compared our (global) with that in S13 for the 13 galaxies in common with both our study and S13 as shown in figure 3. Although our (global) is within the standard deviation of in S13, our (global) is lower than that in S13 for 10 out of 13 galaxies as listed in table Acknowledgments. We discuss the cause of the difference considering the following: (1) total dust mass, (2) CO()/CO() line ratio , and (3) difference in the data sampling area.
(1) Total dust mass
The SED model to derive a dust mass is different between our study and S13. We discuss the difference of dust mass caused by the different SED models and the effect of its difference on the value of . We obtained by using the C12 SED model with a single dust temperature using infrared data (70, 100, 160, and 250 m) from the DustPedia. S13 obtained using the SED model of Draine & Li (2007) (hereafter DL07) and infrared data (IRAC 3.6, 4.5, 5.8, and 8.0 m, MIPS 24 and 70 m, PACS 70, 100, and 160 m; SPIRE 250 and 350 m) from Key Insights on Nearby Galaxies: A Far-Infrared Survey with Herschel (KINGFISH, Kennicutt et al. (2011)). Although there is no information regarding the dust mass in S13, Aniano et al. (2020) (hereafter A20) performed the dust modeling to the full KINGFISH samples by using the DL07 model and the infrared data of IRAC, MIPS, PACS, and SPIRE, which were the same as S13. They also provided the archival data222https://dataspace.princeton.edu/handle/88435/dsp01hx11xj13h of for galaxies listed in table Acknowledgments, whose was measured by both this study and S13. Therefore, we investigated the difference of dust mass between this study using the C12 SED model and A20 as an indicator of dust mass of S13. After background subtraction, A20 convolved each image with a common point spread function and resampled to match a common pixel size. They provided a map of whose FWHM and grid size are (\timeform18.2”, \timeform6.0”). Except for NGC 4254 and NGC 4321, the 11 galaxies listed in table Acknowledgments have similar spatial resolution (beam size = \timeform18.0” and pixel size = \timeform6.0”) to that of provided by A20. Therefore, we compared of A20 with of 11 galaxies modeling with the C12 SED model.
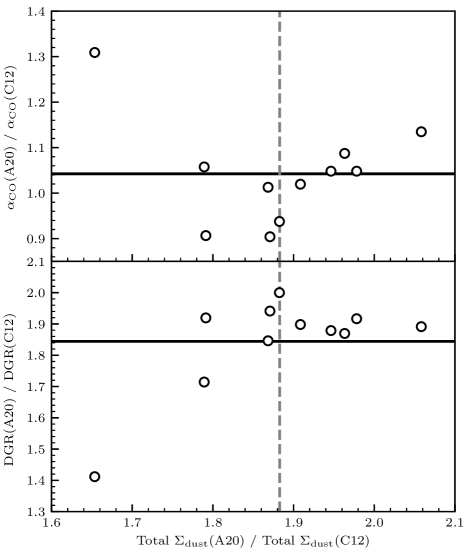
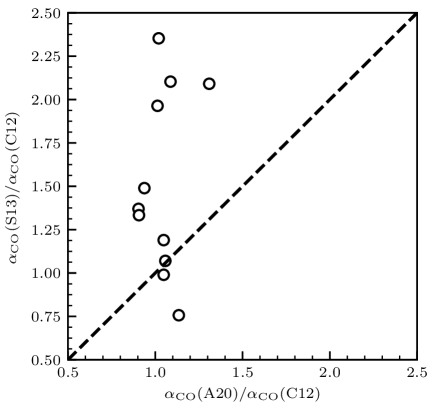
We measured (global) and DGR(global) by using from A20, which were defined as (A20) and DGR(A20), in the same region where (global) and DGR(global) were measured. In this discussion, we define (global) and DGR(global) using estimated by the C12 SED model as (C12) and DGR(C12). Figure 8 presents the ratio of (A20) to (C12) and that of DGR(A20) to DGR(C12) as a function of the ratio of total from A20 to that estimated by the C12 SED model for the 11 galaxies. The means of the (A20)/(C12) ratio and the DGR(A20)/DGR(C12) ratio, indicated by the solid horizontal black lines in figure 8, are 1.04 and 1.84, respectively. Moreover, the mean of the ratio of total from A20 to that estimated by the C12 SED model, indicated by the dashed vertical gray lines in figure 8, is 1.88. The variation of the (A20)/(C12) ratio is within 30%. In this comparison, increases, while and are not changed. Considering equation (3) of , increasing affects increasing DGR more than . If increases and DGR does not change to compensate for the increase in the total dust mass, the Hi/H2 ratio is changed. This causes a change in the contrast of the total gas mass surface density and increases the variation of the DGR, and the value becomes larger. We also compared the ratio of the mean from S13 and listed in table Acknowledgments ((S13)) to (C12) with the (A20)/(C12) ratio as shown in figure 9. The variation of (A20)/(C12) ratios tends to be smaller than that of (S13)/(C12) ratios. Therefore, the difference in total dust mass is not the main cause of the difference between our (global) and of S13.
(2) CO()/CO() line ratio
S13 used the integrated intensity of 12CO() () assuming a constant () to estimate the integrated intensity of 12CO() (). However, if the true is larger than 0.7, the integrated intensity of 12CO() is overestimated, and is underestimated. On the other hand, if true is lower than 0.7, the integrated intensity of 12CO() is underestimated and is overestimated.
We investigated the effect of the variation of on the derivation of (global). As a reference to true in each galaxy, we used derived by Yajima et al. (2021). For the 13 galaxies, we obtained the relation between our (global) and (S13) shown in figure 3. Some galaxies have (S13) which is similar to our (global) (NGC 3184, NGC 3521, NGC 3627, NGC 4254, NGC 5055, and NGC 7331). There are also large differences between our (global) and (S13) in other galaxies (NGC 628, NGC 4321, NGC 4536, NGC 4736, NGC 5457, NGC 5713, and NGC 6946). However, even if (S13) is corrected for , the variations of (S13) are consistent with the uncertainties of our (global) and (S13). Therefore, the assumption of the constant cannot be the main cause of the difference between the results obtained in our study and those of S13.
(3) Difference in the data sampling area
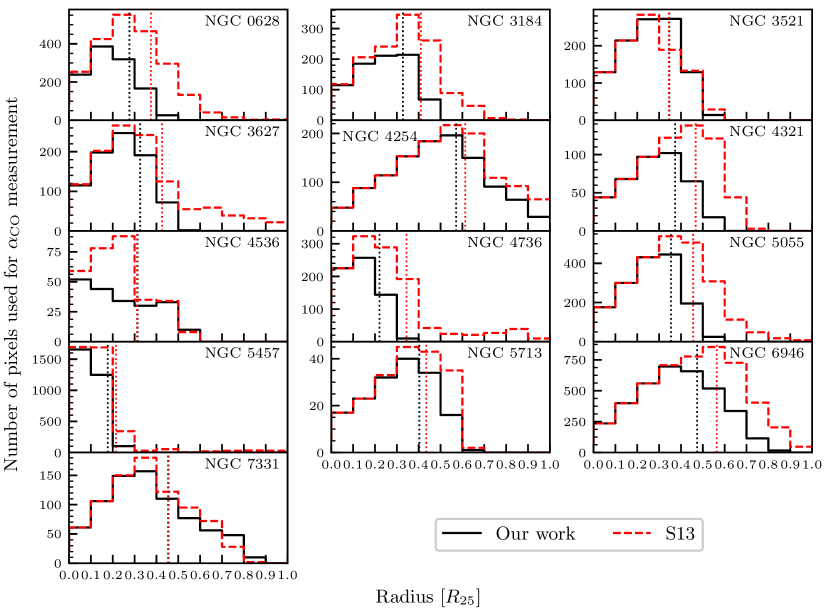
Considering the previous studies that reported the radial variation of , it is expected that in the inner region of a galaxy tends to be smaller than that of the outer region. While S13 measured in the region where K km s-1, we measured (global) in the region where , , and an infrared flux density , where RMS was estimated in the emission-free region of an infrared map. The median and mean of in the CO observation region of our samples listed in table Acknowledgments are 0.61 and 0.69 K km s-1, respectively. Furthermore, the achieved sensitivity for the S13 samples was better than that of our samples. Thus, it is possible that our measurements of are biased toward the inner region where tends to be smaller. To confirm the presumption, we compared the data sampling area for the measurements of in our study and S13. Figure 10 presents the radial variation of data sampling area used for the measurement of our (global) and of S13. The vertical axis indicates the radial variation in the number of pixels used for the measurement of in each annulus ring with a width . While the dotted red line indicates the number of pixels, where K km s-1, the dotted black line indicates and , , and an infrared flux density . We used the map obtained from the HERACLES project333https://www.iram.fr/ILPA/LP001/ and the map of each galaxy was convolved with a Gaussian kernel and matched to the spatial resolution listed in table Acknowledgments. The mean radii of the regions used for the measurement of our (global) and of S13 for the 13 galaxies are 0.35 and 0.41, respectively. This implies that we may measure within the radius, which is 0.85 times smaller than the typical radius, where S13 measured . As indicated in subsection 5.2, tends to be smaller in the inner region of a galactic disk in many galaxies. S13 also reported that in the inner regions of their sample galaxies is generally lower than the remaining of the disk. Therefore, the difference in the sampling area is one of the possibilities causing the difference in between our study and S13, that is, the value of in S13, which is derived from a larger area than that used in our study, can be larger than our value of .
6.2.2 in the Milky Way
In addition to our value of (global) being lower than that of S13, we also found that (global) of the 20 galaxies is lower than the standard value in the Milky Way, pc-2 (K km s-1)-1(e.g., Bolatto, Wolfire & Leroy (2013)). (MW) as the typical value of the solar neighborhood has been measured by various methods; virial masses (e.g., Solomon et al. (1987); Scoville et al. (1987)), CO isotopologues (Goldsmith et al. (2008)), extinction (e.g., Pineda et al. (2008); Paradis et al. (2012)), dust emission (Dame et al. (2001); Planck Collaboration XIX et al. (2011)), and -ray radiation (e.g., Strong & Mattox (1996); Ackermann et al. (2012)).
Because our measurements are biased towards the inner region of galaxies, as indicated in subsection 6.2.1, it can also cause the difference between the value of obtained in this study and (MW). To confirm our presumption, we compared the typical radius where (global) was measured in this study with that of (MW). We assumed that in the Milky Way is twice the distance from the Galactic center to the solar neighborhood kpc (Bigiel et al. (2012)): the radius from the Galactic center to the solar neighborhood is . We obtained the mean radius of the regions used for the measurement of (global) in the 22 galaxies () in subsection 5.1. This result implies that the typical radius where (global) was measured is 0.76 times smaller than the typical radius where (MW) has been measured. Previous studies have reported the radial variation of the CO-to-H2 conversion factor in the Milky Way. Strong et al. (2004) measured the radial variation of in the Milky Way by the -ray observations and found cm-2 (K km s-1)-1 ( pc-2 (K km s-1)-1) at and cm-2 (K km s-1)-1 ( pc-2 (K km s-1)-1) at in the Milky Way. Sodroski et al. (1995) obtained cm-2 (K km s-1)-1 ( pc-2 (K km s-1)-1) from 140 m, 240 m, and 12CO() observations within approximately 400 pc of the galactic center and found that their is 3–10 times lower than that in the galactic disk at kpc obtained from previous studies. They also obtained the least-square fit of as a function of galactocentric distance in the unit of kpc by fitting their observations and literature measurements as follows:
| (16) |
These results indicate that in the center region of the Milky Way is smaller than (MW) in the solar neighborhood. Therefore, our measurements are biased towards the inner region compared to (MW). This is one of the possibilities leading to the lower value of our than (MW). Furthermore, the use of (MW) within a region where CO emission is detected in our samples leads to an overestimation of molecular gas mass surface density.
We also compare (inner) listed in table Acknowledgments ( pc-2 (K km s-1)-1) with that in the Milky Way. We investigated the typical radius of (inner) in the inner region by averaging the radii over the pixels where (inner) is measured and weighting with in subsection 6.1. The mean typical radius of (inner) for four galaxies is . Therefore, we compare (inner) with that at ( kpc) in the Milky Way. of equation (16) of Sodroski et al. (1995) at 1.60 kpc is cm-2 (K km s-1)-1, which corresponds to pc-2 (K km s-1)-1. Pineda et al. (2013) surveyed the Galactic plane in the [C ii] 158 m line with the and obtained the radial variation of by using the H2 column density traced by CO and [C ii]. From figure 20 of Pineda et al. (2013), we can find the plots of cm-2 (K km s-1)-1, which corresponds to pc-2 (K km s-1)-1, at kpc. Therefore, our (inner) is smaller than in the Milky Way even if we compare them at the similar distance from the galactic center.
6.2.3 DGR in the Milky Way
As described in subsection 6.2.2, the typical radius at which (global) and DGR(global) were measured in our study in the 22 nearby galaxies () is different from that of the solar neighborhood (, Bigiel et al. (2012)). Using equation (15) and defining the radius of the solar neighborhood (= 8 kpc = ), the estimated DGR of the Milky Way at 0.38 is . Furthermore, a linear fit of the DGR as a function of a galactocentric radius for nearby star-forming galaxies as shown in figure 12 of S13 indicates a larger DGR at than the typical value of DGR for the solar neighborhood (). These values are larger than the average of DGR(global) obtained in our study in the 22 nearby galaxies (). Note that the absolute value of DGR highly depends on the model adopted for SED fitting, whereas the trend of the radial variation is not affected. In subsection 6.2.1, we found that the mean and standard deviation of DGR(global) using from A20 in the 11 galaxies shown in figure 8 is , which is closer to the results of S13 and Giannetti et al. (2017) than the mean of DGR(global) using estimated by the C12 SED model.
7 Conclusions
We simultaneously measured the spatially-resolved CO-to-H2 conversion factor and DGR in nearby spiral galaxies on a kiloparsec scale by using the method developed by Leroy et al. (2011) and Sandstrom et al. (2013) (S13) with the spatially-resolved 12CO() mapping data from the COMING and the CO Atlas projects. The conclusions of this study are summarized as follows:
-
1.
We obtained global averaged values of and DGR, (global) and DGR(global), for 22 nearby spiral galaxies. The averages and standard deviations of (global) and DGR(global) in the 22 spiral galaxies are pc-2 (K km s-1)-1 and , respectively. The average of (global) is lower than not only the standard value in the Milky Way pc-2 (K km s-1)-1 (e.g., Bolatto, Wolfire & Leroy (2013)), but also the average ( pc-2 (K km s-1)-1) of in S13 ((S13)). We divided the measurement regions for and DGR into the inner and outer regions with a boundary at , and obtained the radial variations of and DGR in the following four barred spiral galaxies: IC 342, NGC 3627, NGC 5236, and NGC 6946. In these four galaxies, the averages and standard deviations of and DGR in the inner region () are pc-2 (K km s-1)-1 and , while those in the outer region () are pc-2 (K km s-1)-1 and , respectively. We found that in the outer region is 2.3 to 5.3 times larger than that in the inner region.
-
2.
We found a clearer correlation of and DGR with metallicity and SFR surface density using the data separated into inner and outer regions than that of the global region. The correlation between and SFR surface density is expected by theoretical studies in which the decrease of is attributed to the increase in the CO integrated intensity owing to a high kinetic temperature and large velocity dispersion in high SFR regions.
-
3.
Using the mean 12CO()/12CO() line ratio () from Yajima et al. (2021), we corrected (S13), which was derived using the constant . However, the variations of (S13) corrected for are consistent with the uncertainties of our (global) and (S13). We conclude that the constant cannot be the main cause of the difference between (global) and (S13). The mean radius of the regions used for the measurement of (global) in the 22 nearby galaxies is , which is smaller than the radius of the solar neighborhood (, Bigiel et al. (2012)). On the other hand, owing to the difference in the data sampling condition between our study and S13, the mean radii of the regions used for the measurement of in the 13 galaxies in common with our study and S13 are and , respectively. These results imply that we may measure within a radius smaller than that of S13 and (MW). This is one of the possibilities leading to the smaller (global) in our study compared to S13 and (MW). In our samples, the use of (MW) within a region where CO emission is detected leads to an overestimation of molecular gas mass surface density.
Acknowledgments
We are grateful to Nobeyama Radio Observatory staff for setting up and operating the Nobeyama 45-m telescope system and for supporting our COMING project. The Nobeyama 45-m radio telescope is operated by the Nobeyama Radio Observatory, a branch of the National Astronomical Observatory of Japan. This work utilized CO Atlas; Nobeyama CO Atlas of Nearby Spiral Galaxies (Kuno et al. (2007)), HERACLES; the HERA CO-Line Extragalactic Survey (Leroy et al. (2009)), THINGS; The Hi Nearby Galaxies Survey (Walter et al. (2008)), VIVA; VLA Imaging of Virgo in Atomic gas (Chung et al. (2009)), DustPedia (Davies et al. (2017)), and the Local Volume Legacy (Dale et al. (2009)). This work was supported by the Japan Society for the Promotion of Science KAKENHI (Grant Nos. 18K13593 and 20K04008) and MEXT Leading Initiative for Excellent Young Researchers (HJH02007). This research has also made use of the NASA/IPAC Extragalactic Database, which is operated by the Jet Propulsion Laboratory, California Institute of Technology, under contract with the National Aeronautics and Space Administration, and the NRAO Science Data Archive.
Parameters of the sample galaxies. Galaxy Morphology Distance [Mpc] PA [∘] [∘] [′] Isolated galaxies NGC 337 SB(s)d 18.90 119.6 44.5 1.44 NGC 628 SA(s)c 9.02 20 7 5.24 IC 342 SAB(rs)cd 3.3 48 31 10.69 NGC 1569 Ibm 3.25 112 63 1.82 NGC 2841 SA(r)b? 14.60 152.6 73.7 4.06 NGC 2976 SAc pec 3.63 -25.5 64.5 2.94 NGC 3077 I0 pec 3.81 63.8 38.9 2.69 NGC 3147 SA(rs)bc 39.30 142.79 35.19 1.95 NGC 3184 SB(s) 8.7 6 21 3.71 NGC 3198 SB(rs)c 13.40 -145.0 71.5 4.26 Mrk 33 Im pec? 24.9 124.0 42.6 0.50 NGC 3351 SB(r)b 10.7 -168 41 3.71 NGC 3521 SAB(rs)bc 14.20 -19 63 5.48 NGC 3627 SAB(s)b 9.04 176 52 4.56 NGC 3938 SA(s)c 17.9 -154.0 20.9 2.69 NGC 4030 SA(s)bc 29.90 29.6 39.0 2.08 NGC 4192 SAB(s)ab 16.1 155 79 4.89 NGC 4254 SA(s)c 16.1 66 42 2.69 NGC 4321 SAB(s)bc 16.1 158 27 3.71 NGC 4501 SA(rs)b 16.1 139 68 3.46 NGC 4527 SAB(s)bc 16.5 69.5 70 3.08 NGC 4535 SAB(s)c 16.1 2 44 3.54 NGC 4536 SAB(rs)bc 16.5 -54.5 64.2 3.79 NGC 4569 SAB(rs)ab 16.1 22 64 4.77 NGC 4579 SAB(rs)b 16.5 92.1 41.7 2.94 NGC 4654 SAB(rs)cd 16.1 124 51 0.24 NGC 4689 SA(rs)bc 16.1 164 36 2.13 NGC 4736 (R)SA(r)ab 4.3 119 40 5.61 NGC 5055 SA(rs)bc 9.04 98 61 6.29 NGC 5236 SAB(s)c 4.5 45 24 6.44 NGC 5248 SAB(rs)bc 13.00 103.9 38.6 3.08 NGC 5364 SA(rs)bc pec 18.2 -144.4 47.9 3.38 NGC 5457 SAB(rs)cd 7.2 42 18 14.42
(Continued). Galaxy Morphology Distance [Mpc] PA [∘] [∘] [′] Isolated galaxies NGC 5713 SAB(rs)bc pec 19.5 -157 33 1.38 NGC 6946 SAB(rs)cd 5.5 242 40 5.74 NGC 7331 SA(s)b 13.90 167.7 75.8 5.24 Interacting galaxies NGC 4298/NGC 4302 NGC 4298 SA(rs)c 16.5 -48.9 54.8 1.62 VV 219 NGC 4567 SA(rs)bc 16.5 80 46 1.48 NGC 4568 SA(rs)bc 16.5 23 64 2.29 Arp 116 NGC 4647 SAB(rs)c 16.5 98.5 39.3 1.44 {tabnote} Note. Morphology, distance, position angle (PA), and inclination angle were obtained from Sorai et al. (2019) and Kuno et al. (2007). of COMING and CO Atlas samples was obtained from Sorai et al. (2019) and NED Database, respectively.
Summary of 12CO() and Hi data. Galaxy Reference Adopted spatial resolution Spatial scale of beam size [kpc] 12CO() Hi Beam size [′′] Pixel size [′′] Isolated galaxies NGC 337 COMING N 29.6 21.1 6.0 2.7 1.9 NGC 628 COMING T 18.0 18.0 6.0 0.8 0.8 IC 342 CO Atlas C00 38.0 37.0 6.1 0.6 0.6 NGC 1569 COMING T 18.0 18.0 6.0 0.3 0.3 NGC 2841 COMING T 18.0 18.0 6.0 1.3 1.3 NGC 2976 COMING T 18.0 18.0 6.0 0.3 0.3 NGC 3077 COMING T 18.0 18.0 6.0 0.3 0.3 NGC 3147 COMING N 25.3 22.0 6.0 4.8 4.8 NGC 3184 CO Atlas T 18.0 18.0 6.0 0.8 0.8 NGC 3198 COMING T 18.0 18.0 6.0 1.2 1.2 Mrk 33 COMING N 18.0 18.0 6.0 2.2 2.2 NGC 3351 COMING T 18.0 18.0 6.0 0.9 0.9 NGC 3521 CO Atlas T 18.0 18.0 6.0 1.2 1.2 NGC 3627 COMING T 18.0 18.0 6.0 0.8 0.8 NGC 3938 COMING N 18.8 18.2 6.0 1.6 1.6 NGC 4030 COMING N 18.0 18.0 6.0 2.6 2.6 NGC 4192 CO Atlas V 28.0 25.9 10.0 2.2 2.0 NGC 4254 CO Atlas V 26.8 24.5 6.0 2.1 1.9 NGC 4321 CO Atlas V 31.1 28.1 10.0 2.4 2.2 NGC 4501 CO Atlas V 18.0 18.0 6.0 1.4 1.4 NGC 4527 COMING N 18.0 18.0 6.0 1.4 1.4 NGC 4535 CO Atlas V 25.0 24.1 10.0 2.0 1.9 NGC 4536 COMING N 18.0 18.0 6.0 1.4 1.4 NGC 4569 CO Atlas V 18.0 18.0 6.0 1.4 1.4 NGC 4579 COMING V 42.4 34.5 10.0 3.4 2.8 NGC 4654 CO Atlas V 18.0 18.0 6.0 1.4 1.4 NGC 4689 CO Atlas V 18.0 18.0 6.0 1.4 1.4 NGC 4736 CO Atlas T 18.0 18.0 6.0 0.4 0.4 NGC 5055 COMING T 18.0 18.0 6.0 0.8 0.8 NGC 5236 CO Atlas T 18.0 18.0 6.0 0.4 0.4 NGC 5248 COMING N 18.0 18.0 6.0 1.1 1.1 NGC 5364 COMING N 18.0 18.0 6.0 1.6 1.6 NGC 5457 CO Atlas T 18.0 18.0 6.0 0.6 0.6
(Continued). Galaxy Reference Adopted spatial resolution Spatial scale of beam size [kpc] 12CO() Hi Beam size [′′] Pixel size [′′] Isolated galaxies NGC 5713 COMING N 18.0 18.0 6.0 1.7 1.7 NGC 6946 CO Atlas T 18.0 18.0 6.0 0.5 0.5 NGC 7331 COMING T 18.0 18.0 6.0 1.2 1.2 Interacting galaxies NGC 4298 COMING V 18.0 18.0 6.0 1.4 1.4 NGC 4567/NGC 4568 COMING V 18.0 18.0 6.0 1.4 1.4 NGC 4647 COMING N 18.0 18.0 6.0 1.4 1.4 {tabnote} Note. Hi data are obtained from THINGS (T, Walter et al. (2008)), VIVA (V, Chung et al. (2009)) and NRAO Science Data Archive (N, https://archive.nrao.edu/archive/advquery.jsp). Hi data of IC 342 is used for Crosthwaite et al. (2000) (C00) obtained from NED Database.
Results of , DGR, and properties. Galaxy () DGR (DGR) [ pc-2 (K km s-1)-1] [] [] (1) (2) (3) (4) (5) NGC 628 3.94 (1.50 – 17.44) 0.0033 (0.0010 – 0.0061) 0.61 0.69 8.64 IC 342 1.72 (1.33 – 2.30) 0.0057 (0.0047 – 0.0066) 0.88 1.03 8.63 NGC 3147 2.91 (1.05 – 11.59) 0.0058 (0.0019 – 0.0114) 0.79 0.68 —∗∗ NGC 3184 2.52 (0.70 – 12.17) 0.0046 (0.0015 – 0.0083) 0.58 0.50 8.52 NGC 3521 3.87 (1.84 – 9.56) 0.0026 (0.0013 – 0.0041) 0.66 0.80 8.52 NGC 3627 0.51 (0.20 – 1.21) 0.0108 (0.0070 – 0.0150) 0.61 1.89 —∗∗ NGC 4030 3.69 (1.49 – 15.20) 0.0039 (0.0012 – 0.0074) 0.81 1.34 8.65 NGC 4254 4.55 (2.34 – 10.15) 0.0023 (0.0013 – 0.0035) 1.09 1.13 8.54 NGC 4321 1.95 (0.64 – 7.08) 0.0069 (0.0028 – 0.0124) 0.66 0.97 8.66 NGC 4501 3.05 (0.75 – 10.53) 0.0052 (0.0025 – 0.0085) 1.03 0.41 8.67 NGC 4527 1.87 (0.54 – 6.53) 0.0037 (0.0018 – 0.0062) 0.82 —∗ —∗∗ NGC 4536 2.43 (0.52 – 13.65) 0.0035 (0.0012 – 0.0069) 0.65 2.10 —∗∗ NGC 4654 3.47 (0.68 – 17.43) 0.0035 (0.0012 – 0.0067) 0.77 0.93 8.52 NGC 4736 0.73 (0.18 – 2.32) 0.0068 (0.0039 – 0.0101) 0.44 2.29 8.56 NGC 5055 3.11 (1.59 – 6.85) 0.0048 (0.0027 – 0.0073) 0.72 0.59 8.70 NGC 5236 0.84 (0.60 – 1.23) 0.0137 (0.0106 – 0.0169) 0.56 4.98 8.71 NGC 5248 2.32 (1.03 – 6.32) 0.0043 (0.0021 – 0.0070) 0.78 1.26 8.61 NGC 5457 3.04 (1.88 – 5.00) 0.0046 (0.0033 – 0.0061) 0.40 0.75 8.55 NGC 5713 2.20 (0.24 – 17.05) 0.0034 (0.0008 – 0.0074) 0.71 4.19 —∗∗ NGC 6946 1.50 (1.09 – 2.13) 0.0062 (0.0050 – 0.0075) 0.94 1.37 8.57 NGC 7331 6.58 (2.62 – 22.64) 0.0027 (0.0010 – 0.0049) 0.96 0.40 8.58 NGC 4568 1.72 (0.40 – 9.30) 0.0071 (0.0021 – 0.0143) 0.67 1.13 —∗∗ {tabnote} (1)–(2) Measured global and DGR. and DGR indicate the range between the minimum and maximum values of and DGR at . (3) The maximum radius within which and DGR in columns (1) and (2) are measured. (4)–(5) Mean of the star formation rate surface density and metallicity ( in equation (14)) over pixels where global and DGR are measured.
∗ Archived data of 24 m is unavailable.
∗∗ The lack of metallicity data in Pilyugin et al. (2014).
Radial variation of , DGR, and properties. Galaxy region () DGR (DGR) [ pc-2 (K km s-1)-1] [] (1) (2) (3) (4) IC 342 inner 0.45 (0.23 – 1.23) 0.0171 (0.0074 – 0.0278) 4.50 8.76 outer 2.39 (1.61 – 3.65) 0.0047 (0.0035 – 0.0060) 0.53 8.61 NGC 3627 inner 0.25 (0.03 – 2.11) 0.0157 (0.0039 – 0.0302) 3.18 —∗ outer 0.69 (0.16 – 2.32) 0.0096 (0.0049 – 0.0149) 1.60 —∗ NGC 5236 inner 0.34 (0.18 – 0.80) 0.0299 (0.0151 – 0.0471) 15.35 8.75 outer 0.78 (0.43 – 1.42) 0.0139 (0.0098 – 0.0183) 2.85 8.70 NGC 6946 inner 0.41 (0.17 – 1.77) 0.0167 (0.0051 – 0.0298) 6.17 8.68 outer 2.09 (1.27 – 3.49) 0.0053 (0.0039 – 0.0069) 0.91 8.56 {tabnote} (1)–(2) The measured and DGR in the inner () and outer (, where is the same as column (3) in table Acknowledgments region. and DGR indicate the range between the minimum and maximum values of and DGR at . (3)-(4) Mean of star formation rate surface density and metallicity ( in equation (14)) over pixels where radial and DGR are measured in the inner and outer regions, respectively.
∗ The lack of metallicity data in Pilyugin et al. (2014).
and in galaxies which are consistent with S13. Galaxy () (S13) (Std. Dev.) (S13) [ pc-2 (K km s-1)-1] [ pc-2 (K km s-1)-1] [ pc-2 (K km s-1)-1] (1) (2) (3) (4) NGC 628 3.94 (1.50 – 17.44) 3.9 (2.1 – 7.4) NGC 3184 2.52 (0.70 – 12.17) 5.3 (2.9 – 9.5) NGC 3521 3.87 (1.84 – 9.56) 7.6 (4.9 – 11.8) NGC 3627 0.51 (0.20 – 1.21) 1.2 (0.4 – 3.3) NGC 4254 4.55 (2.34 – 10.15) 3.4 (2.1 – 5.7) NGC 4321 1.95 (0.64 – 7.08) 2.2 (1.1 – 4.6) NGC 4536 2.43 (0.52 – 13.65) 2.6 (1.0 – 6.7) NGC 4736 0.73 (0.18 – 2.32) 1.0 (0.5 – 2.0) NGC 5055 3.11 (1.59 – 6.85) 3.7 (1.9 – 7.4) NGC 5457 3.04 (1.88 – 5.00) 2.3 (1.1 – 4.8) NGC 5713 2.20 (0.24 – 17.05) 4.6 (1.7 – 12.6) NGC 6946 1.50 (1.09 – 2.13) 2.0 (0.9 – 4.4) NGC 7331 6.59 (2.62 – 22.64) 9.8 (6.2 – 15.3) {tabnote} (1) Global in this study. is the range between the minimum and maximum values of at . (2) Mean and the standard deviation listed in table 4 of Sandstrom et al. (2013) (S13). (3) Mean of weighted by the integrated intensity of 12CO() and standard deviation of measured in Yajima et al. (2021). (4) Corrected (S13) by multiplying the ratio of to , which is the constant value S13 adopted.
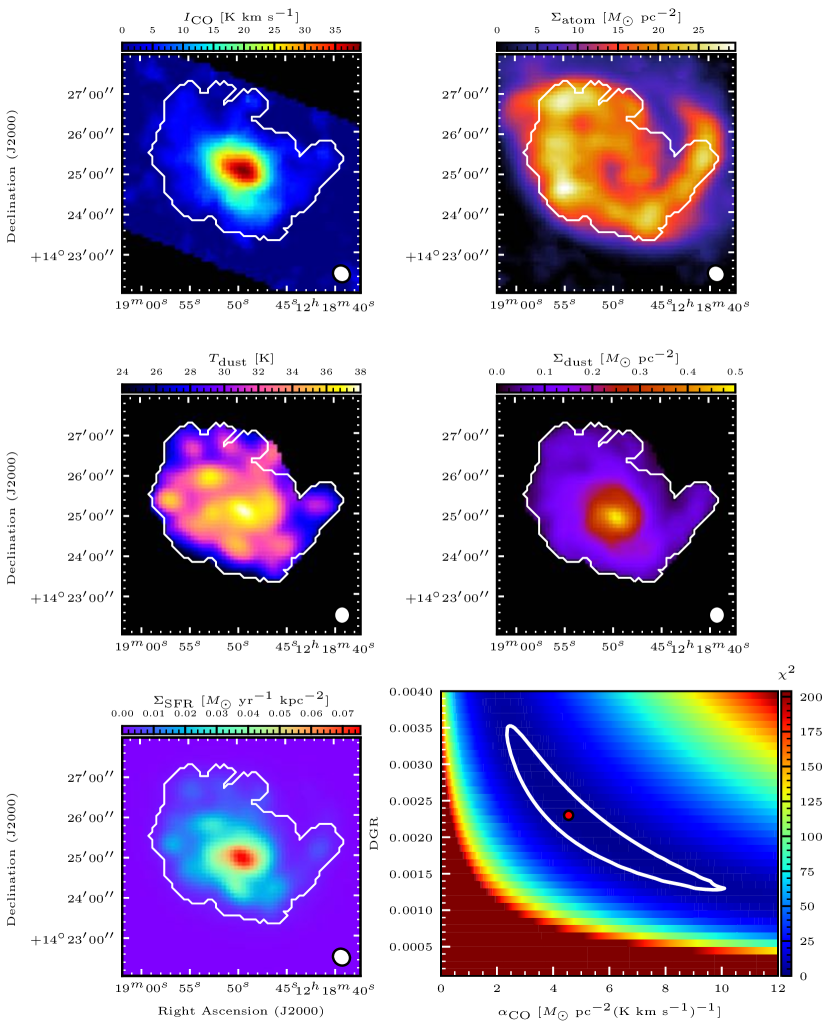
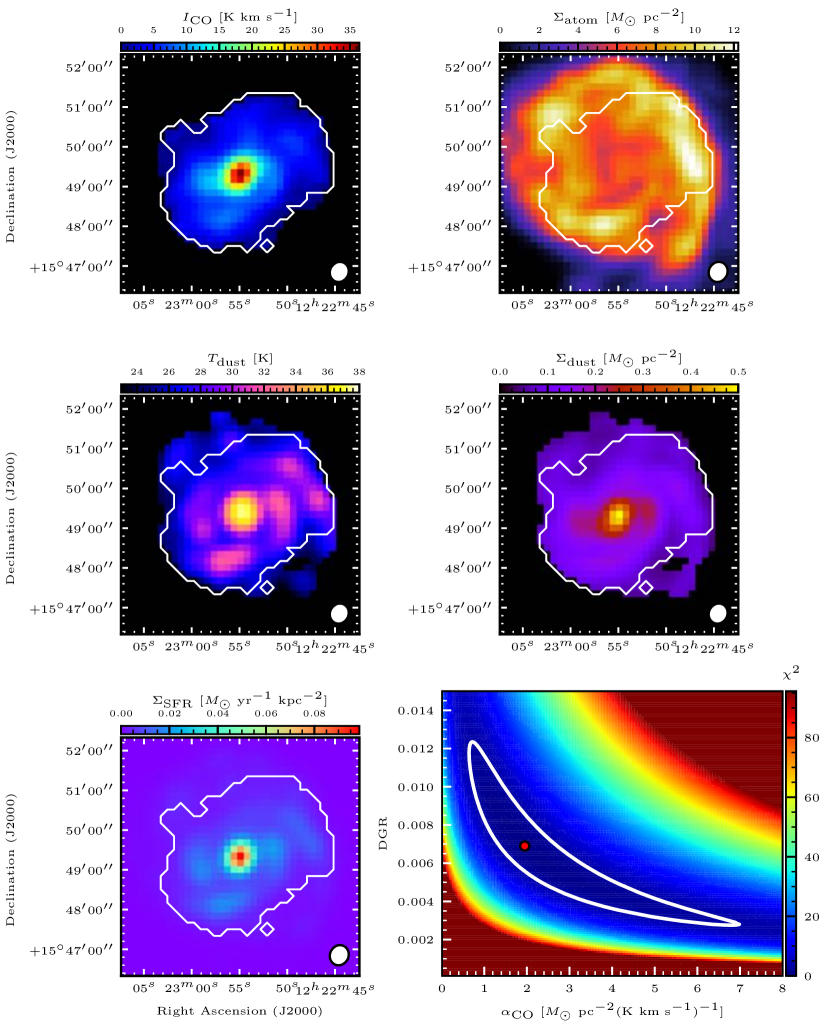
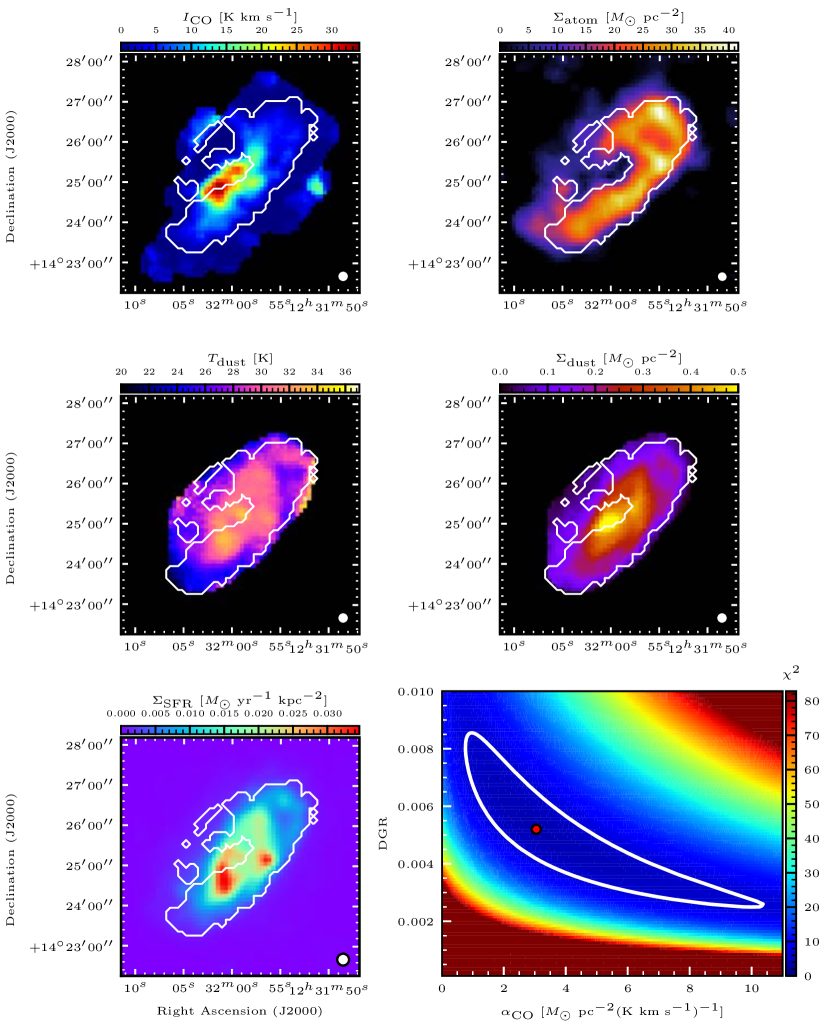
Appendix A Maps used for the measurement of (global) and DGR(global) and results of fitting for (global) and DGR(global)
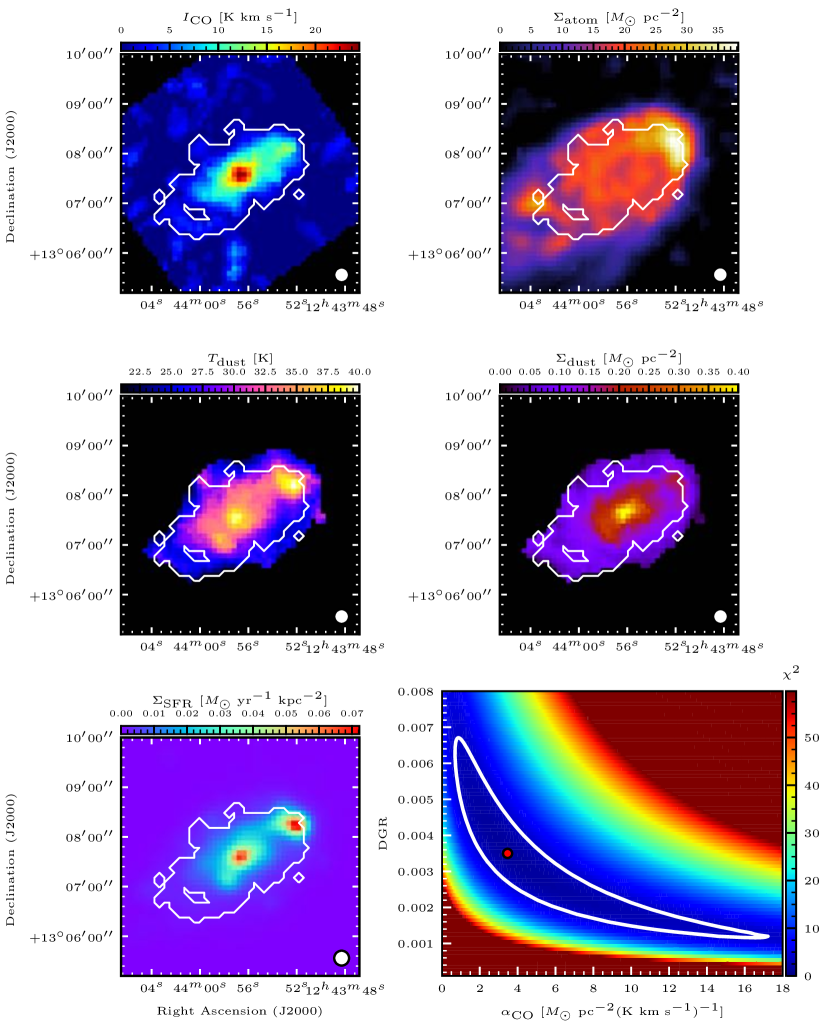
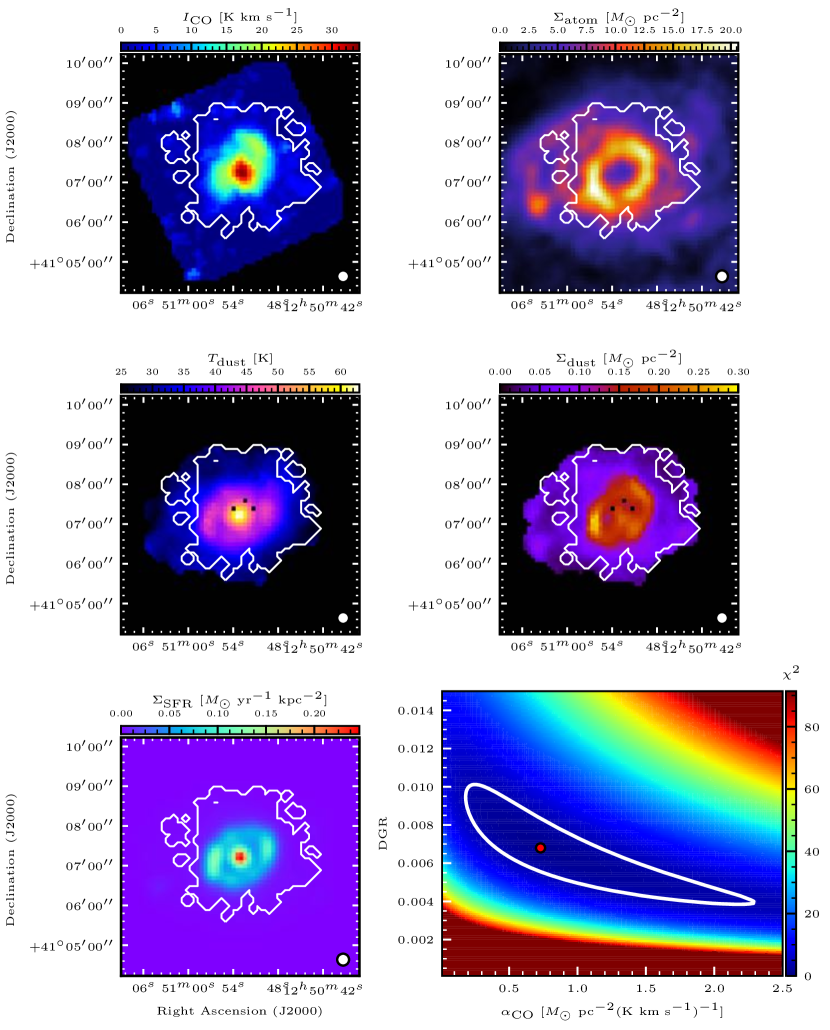
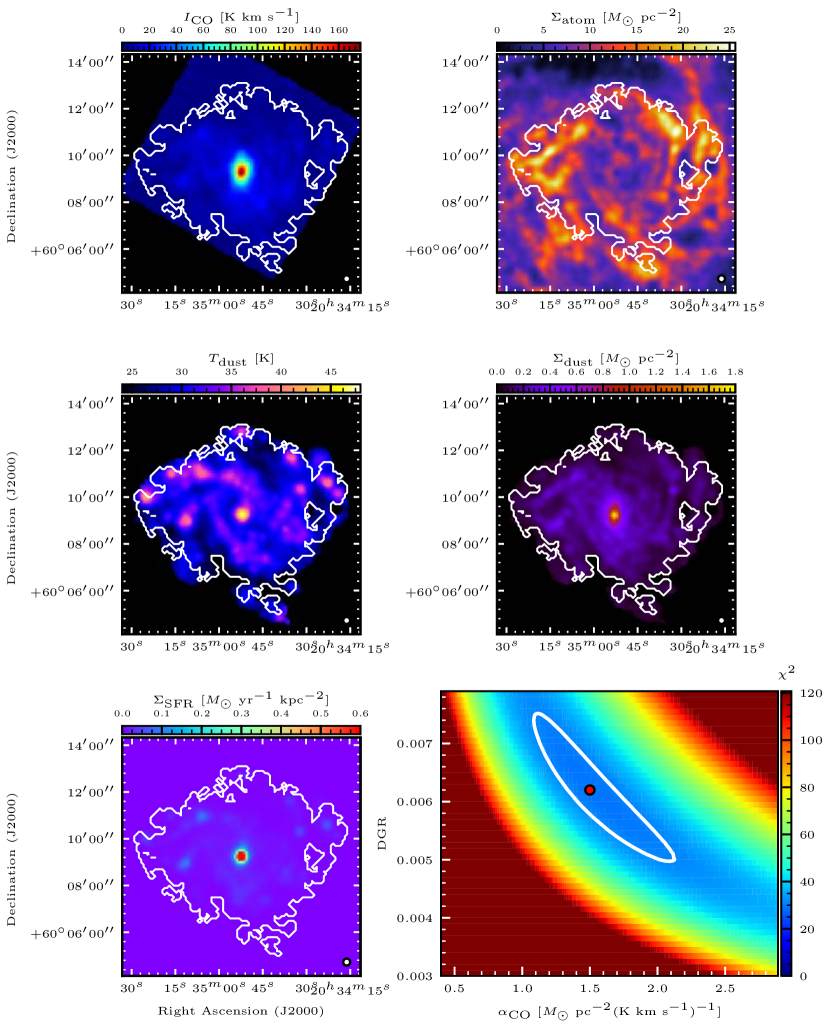
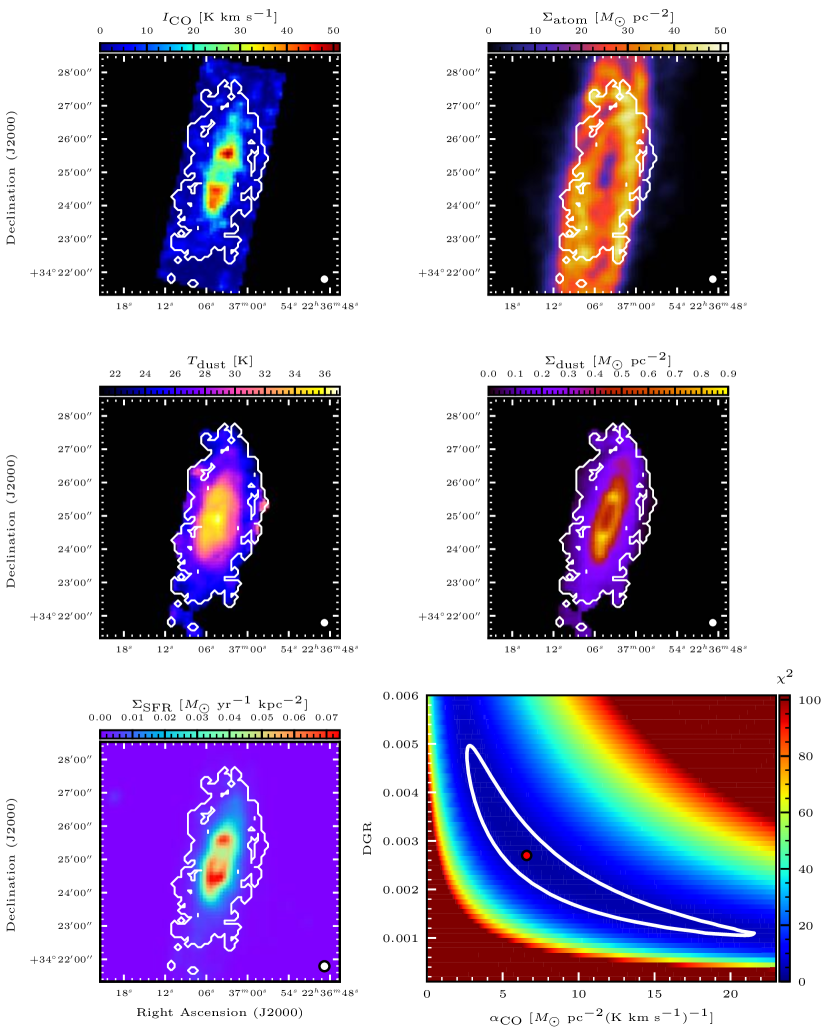
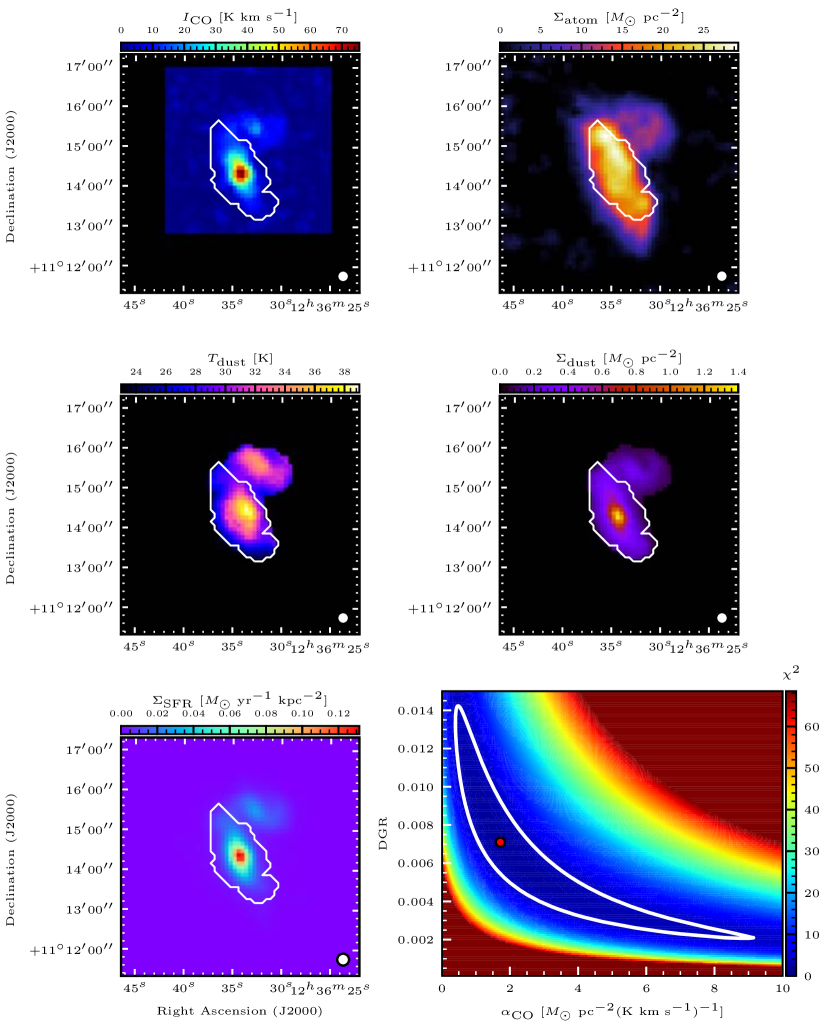
This appendix presents maps of the integrated intensity of 12CO() (), the atomic gas mass surface density (), the characteristic cold dust temperature () derived from the SED model of Casey (2012), the dust mass surface density (), and the star formation rate surface density (). Furthermore, the result of fitting for (global) and DGR(global) in each galaxy is also shown.
References
- Accurso et al. (2017) Accurso, G., et al. 2017, MNRAS, 470, 4750
- Ackermann et al. (2012) Ackermann, M., et al. 2012, A&A, 538, A71
- Aniano et al. (2020) Aniano, G., et al. 2020, ApJ, 889, 150 (A20)
- Arimoto, Sofue & Tsujimoto (1996) Arimoto, N., Sofue, Y. & Tsujimoto, T. 1996, PASJ, 48, 275
- Bendo et al. (2012) Bendo, G. J., Galliano, F., & Madden, S. C. 2012, MNRAS, 423, 197
- Bianchi (2014) Bianchi, L. 2014, Ap&SS, 354, 103
- Bigiel et al. (2012) Bigiel, F. & Blitz, L., 2012, ApJ, 756, 183
- Bolatto et al. (1999) Bolatto, A. D., Jackson, J. M. & Ingalls L. G. 1999, ApJ, 513, 275
- Bolatto, Wolfire & Leroy (2013) Bolatto, A. D., Wolfire, M., & Leroy, A. K. 2013. Annual Review of Astronomy and Astrophysics, 51(1), 207
- Boselli et al. (2003) Boselli, A., Gavazzi, G. & Sanvito, G. 2003, A&A, 402, 37
- Casey (2012) Casey, C. M. 2012, MNRAS, 425, 3094 (C12)
- Chung et al. (2009) Chung, A., van Gorkom, J. H., Kenney, J. D. P., Crowl, H. & Vollmer, B. 2009, ApJ, 138, 1741
- Clark et al. (2018) Clark, C. J. R., et al. 2018, A&A, 609, A37
- Cormier et al. (2018) Cormier, D., et al. 2018, MNRAS, 475, 3909
- Crosthwaite et al. (2000) Crosthwaite, L. P., Turner, J. L., & Ho, P. T. P. 2000, ApJ, 119, 1720
- Dale et al. (2009) Dale, D. A., et al. 2009, ApJ, 703, 517
- Dale et al. (2012) Dale, D. A., et al. 2012, ApJ, 745, 95
- Dame et al. (2001) Dame, T. M., Hartmann, D. & Thaddeus, P. 2001, ApJ, 547, 792
- David et al. (2014) David, O. C., et al., 2014, MNRAS, 445, 899
- Davies et al. (2017) Davies, J. I., et al. 2017, PASP, 129, 044102
- Downes & Solomon (1998) Downes, D, & Solomon, P. M. 1998, ApJ, 507, 615
- Draine & Li (2007) Draine, B. T., & Li, A. 2007, ApJ, 657, 810
- Gall, Hjorth & Andersen (2011) Gall C., Hjorth, J. & Andersen, A. C. 2011, A&AR, 19, 43
- Giannetti et al. (2017) Giannetti, A., et al. 2017, A&A, 606, L12
- Goldsmith et al. (2008) Goldsmith, P. F., Heyer, M., Narayanan, G., Snell, R., Li, D. & Brunt, C. 2008. ApJ. 680, 428
- Gratier et al. (2010) Gratier, P., Braine, J., Rodriguez-Fernandez, N. J., Israel, F. P., Schuster, K. F., Brouillet, N., & Gardan, E. 2010, A&A, 512, A68
- Hildebrand (1983) Hildebrand, R. H., 1983, QJRAS, 24, 267
- Israel (1997) Israel, F. P. 1997, A&A, 328, 471
- Kaneko, Kuno & Saitoh (2018) Kaneko, H., Kuno, N., & Saitoh, T. R. 2018, ApJ Letters, 860, L14
- Kennicutt et al. (2011) Kennicutt, R. C., et al. 2011, PASP, 123, 1347
- Knapen et al. (2004) Knapen, J. H., Stedman, S., Bramich, D. M., Folkes, S. L., & Bradley, T. R. 2004, A&A, 426, 1135
- Koda et al. (2012) Koda, J., et al. 2012, ApJ, 761, 41
- Kobulnicky & Kewley (2004) Kobulnicky, H. A., & Kewley, L. J. 2004, ApJ, 617, 240 (KK04)
- Kuno et al. (2007) Kuno, N., et al. 2007, PASJ, 59, 117
- Nakai & Kuno (1995) Nakai, N. & Kuno, N., 1995, PASJ, 47, 761
- Narayanan et al. (2011) Narayanan, D., Krumholz, D., Ostriker, E. C., & Hernquist, L. 2011, MNRAS, 418, 664
- Narayanan et al. (2012) Narayanan, D., et al. 2012, MNRAS, 421, 3127
- Minamidani et al. (2016) Minamidani, T., et al. 2016, Proc. SPIE 9914, Millimeter, Submillimeter, and Far-Infrared Detectors and Instrumentation for Astronomy VIII, 99141Z
- Morrissey et al. (2007) Morrissey, P., et al. 2007, ApJS, 173, 682
- Morokuma-Matsui et al. (2020) Morokuma-Matsui, K., et al. 2020, PASJ, 72, 90
- Moustakas et al. (2010) Moustakas, J., et al. 2010, ApJS, 190, 233
- Muñoz-Mateos et al. (2009) Muñoz-Mateos, J.C., et al. 2009. ApJ. 701, 1965 (M09)
- Leroy et al. (2007) Leroy, A., Bolatto, A., Stanimirovic, S., Mizuno, N., Israel, F. & Bot, C. 2007, ApJ, 658, 1027
- Leroy et al. (2008) Leroy, A. K., Walter, F., Brinks, E., Bigiel, F., de Blok, W. J. G., Madore, B. & Thornley, M. D. 2008, ApJ, 136, 2782
- Leroy et al. (2009) Leroy, A. K., et al. 2009, ApJ, 137, 4670
- Leroy et al. (2011) Leroy, A. K., et al. 2011, ApJ, 737, 12
- Papadopoulos et al. (2012) Papadopoulos, P. P., van der Werf, P., Xilouris, E., Isaak, K. G. & Gao, Y. 2012, ApJ, 751, 10
- Paradis et al. (2012) Paradis, D., Dobashi, K., Shimoikura, T., Kawamura, A., Onishi, T., Fukui. Y. & Bernard, J. P. 2012. A&A, 543, A103
- Planck Collaboration XIX et al. (2011) Planck Collaboration XIX, et al., 2011, A&A, 536, A19
- Pilyugin & Thuan (2005) Pilyugin, L. S., & Thuan, T. X. 2005, ApJ, 631, 231 (PT05)
- Pilyugin et al. (2006) Pilyugin, L. S., Thuan, T. X., & Vílchez, J. M. 2006, MNRAS, 367, 1139
- Pilyugin et al. (2014) Pilyugin, L. S., et al. 2014, ApJ, 147, 131
- Pineda et al. (2008) Pineda, J. E., Caselli, P. & Goodman, A. A. 2008. ApJ. 679, 481
- Pineda et al. (2013) Pineda, J. L., Langer, W. D., Velusamy, T., & Goldsmith, P. F. 2013, A&A, 554, 103
- Rémy-Ruyer et al. (2014) Rémy-Ruyer, A., et al. 2014, A&A, 563, A31
- Rosolowsky et al. (2015) Rosolowsky, E., et al. 2015, American Astronomical Society Meeting Abstracts, 225, 141.25
- Sandstrom et al. (2013) Sandstrom, K. M., et al. 2013, ApJ, 777, 5 (S13)
- Scoville & Sanders (1987) Scoville, N. Z., & Sanders, D. B. 1987, in Astrophysics and Space Science Library, Vol. 134, Interstellar Processes, ed. D. J. Hollenbach & H. A. Thronson, Jr. (Dordrecht: Reidel), 21
- Scoville et al. (1987) Scoville, N. Z., Yun, M. S., Clemens, D. P., Sanders, D. B. & Waller, W. H. 1987, ApJ supplement series, 63, 821
- Schruba et al. (2012) Schruba, A., et al. 2012, AJ, 143, 138
- Sodroski et al. (1995) Sodroski, T. J., et al. 1995, ApJ, 452, 262
- Solomon et al. (1987) Solomon, P. M., Rivolo, A. R., Barrett, J. & Yahil, A. 1987, ApJ, 319, 730
- Sorai et al. (2019) Sorai, K., et al. 2019, PASJ, 71, S14
- Strong & Mattox (1996) Strong, A. W. & Mattox, J. R., 1996, A&A, 308, L21
- Strong et al. (2004) Strong, A. W., Moskalenko, I. V., Reimer, O., Digel, S. & Diehl, R. 2004. A&A, 422, L47
- Walter et al. (2008) Walter, F., Brinks, E., de Blok, W. J. G., Bigiel, F., Kennicutt, Jr. R. C., Thornley, M. D. & Leroy, A. K. 2008. ApJ, 136, 2563
- Weingartner & Draine (2001) Weingartner, J. C. & Draine, B.T. 2001, ApJ, 548, 296
- Yajima et al. (2021) Yajima, Y., et al. 2021, PASJ, 73, 257