Impacts of Differential Privacy on Fostering more Racially and Ethnically Diverse Elementary Schools
Abstract.
In the face of increasingly severe privacy threats in the era of data and AI, the US Census Bureau has recently adopted differential privacy, the de facto standard of privacy protection for the 2020 Census release. Enforcing differential privacy involves adding carefully calibrated random noise to sensitive demographic information prior to its release. This change has the potential to impact policy decisions like political redistricting and other high-stakes practices, partly because tremendous federal funds and resources are allocated according to datasets (like Census data) released by the US government. One under-explored yet important application of such data is the redrawing of school attendance boundaries to foster less demographically segregated schools. In this study, we ask: how differential privacy might impact diversity-promoting boundaries in terms of resulting levels of segregation, student travel times, and school switching requirements? Simulating alternative boundaries using differentially-private student counts across 67 Georgia districts, we find that increasing data privacy requirements decreases the extent to which alternative boundaries might reduce segregation and foster more diverse and integrated schools, largely by reducing the number of students who would switch schools under boundary changes. Impacts on travel times are minimal. These findings point to a privacy-diversity tradeoff local educational policymakers may face in forthcoming years, particularly as computational methods are increasingly poised to facilitate attendance boundary redrawings in the pursuit of less segregated schools.
1. Introduction
In recent years, the concept of differential privacy (Dwork et al., 2006) has gained widespread attention in the field of data privacy. Differential privacy is a mathematical framework that prevents the disclosure of sensitive information while still allowing for meaningful analysis.
One critical real-world application of differential privacy is implemented by the US Census Bureau (Abowd et al., 2022), which adopted differential privacy as a privacy-preserving technique for the release of 2020 Census data. The census provides crucial data for a variety of purposes, including the allocation of federal funding (Abowd and Schmutte, 2019), redistricting for political representation (Kenny et al., 2021), and informing research and decision-making in a wide range of fields. The Census Bureau’s use of differential privacy is intended to protect the privacy of individuals while still providing accurate population data.
However, recent studies have raised concerns about the potential negative impacts of applying differential privacy to certain types of data analyses. In particular, several studies (Pujol et al., 2020; Zhu et al., 2021, 2022; Kenny et al., 2021; Steed et al., 2022) have found that differential privacy can introduce bias or unfairness into the outcomes of different high-stakes analyses. This is a significant concern, particularly in the context of important decision-making processes that rely on accurate and unbiased data.
While understudied thus far in the differential privacy context, one such decision-making setting is the redrawing of school attendance boundaries—or school catchment areas—for creating less racially and ethnically segregated schools. Segregation by race and class continues to hamper many school districts even today (Office, 2022), and has long been associated with several adverse consequences in K12 educational settings, namely: the perpetuation of achievement gaps (Reardon et al., 2018), barriers to accessing bridging social capital (Chetty et al., 2022), and limited opportunities for helping students build understanding and empathy for those who are different from them (Wells et al., 2016). Generally, the lines determining school district boundaries themselves assume most responsible for existing levels of segregation, but within-district school attendance boundaries can also play a nontrivial role in impeding integration efforts (Fiel, 2013; Monarrez, 2021). Even with increasing levels of school choice across the US in recent years (Houlgrave, 2021), boundary-based assignment continues to be the norm (of Education, 2021), suggesting attendance boundaries are a powerful “default setting”, and hence, lever for reducing segregating and advancing more equitable education policies.
Still, changing attendance boundaries can be a highly political and contentious process (Bridges, 2016; Zhang, 2008; Staff, 2019). Yet recent findings using computational boundary simulation models have highlighted the possibility of drawing attendance boundaries in ways that might simultaneously reduce racial/ethnic segregation and travel times (Gillani et al., 2023b), sparking interest from school districts to explore how these models might support their desegregation policymaking efforts (Gillani et al., 2023a).
Of course, to the extent that districts are the primary users of these models, and their uses remain internal within the districts, it is perhaps unclear why differential privacy is relevant here: districts generally have exact, geocoded counts of students by race and ethnicity, and exclusively internal uses obviate the need to obfuscate such counts with noise for privacy-preservation purposes. Yet districts may lack the technical infrastructure and expertise to adapt and apply redistricting models on their own. For assistance, they often hire outside consultants, yet even these consultants may use manual procedures and/or lack the necessary tools and expertise. Researchers and technologists might help bridge these gaps by creating new, widely-available platforms that make it easy for districts to upload their latest geocoded student counts and existing attendance boundaries and obtain simulated, diversity-promoting boundary changes. Indeed, recent evidence suggests that there may be latent, and perhaps even growing, demand for such tools across many districts (Gillani et al., 2023a). Even if they are only asked to upload aggregated students counts, school districts may have privacy concerns, especially if certain geographies have very small numbers of students belonging to certain racial groups. Therefore, equipping such platforms with differential privacy may help increase trust and usage among districts, and ultimately, advance practical school desegregation boundary planning efforts.
A less forward-looking motivation involves the fact that even school districts with exact geocoded student counts may still turn to Census and American Community Survey (ACS) to approximate demographics they do not have available at the student-level— like socioeconomic status (SES). Many districts have turned to SES integration as a primary objective given both the important role it can have on fostering more equitable education and life outcomes (Chetty et al., 2022; Yeung, 2022) and the controversial legal landscape around using student race/ethnicity in assignment policymaking (Kennedy, 2007). Districts will sometimes factor in SES, often derived from a composition of several ACS block group-level variables like parental educational attainment, English speaking status, and household income (Quick, 2016), into student assignment policymaking like boundary planning. Of course, these publicly-derived datasets may already be released using disclosure avoidance systems, meaning privacy-preservation techniques could at present be influencing student assignment policymaking in ways that are not currently well understood.
These scenarios motivate the need to empirically investigate how imposing differential privacy in school redistricting might affect potential gains (in terms of demographic integration in schools) and costs (in terms of travel times and school switching). We focus primarily on the first motivating scenario and build on the data and models presented in (Gillani et al., 2023b) to explore how differential privacy might affect redistricting efforts to reduce White/non-White segregation across 67 school districts in one state: Georgia. Georgia has a storied history with both civil rights and school desegregation (to the United States Commission on Civil Rights, 2007), and continues to be an important state in the movement for more racial justice and equity (Times, 2022). Our specific question is: how differential privacy might impact diversity-promoting boundaries in terms of resulting levels of segregation, student travel times, and school switching requirements?
Simulations of alternative boundaries across these Georgia school districts reveal that imposing differential privacy generally decreases the extent to which alternative boundaries foster greater racial/ethnic integration—seemingly by reducing the number of students who are redistricted to different schools—while having minimal effects on expected travel times. We find similar results when optimizing for SES integration, which we present in the Appendix. Together, these findings point to a privacy-diversity tradeoff that districts and researchers may face in the coming years if differential privacy is used in computationally-supported desegregation policymaking efforts.
2. Related Work
2.1. Impacts of differential privacy in high-stakes decision-making
Motivated by widespread applications of differential privacy made by statistical agencies (Abowd et al., 2022) and corporations (Differential Privacy Team, 2017), there has been a stream of research about evaluating the impacts of differential privacy on downstream tasks. (Pujol et al., 2020) presents an empirical study of multiple decision-making tasks, e.g., minority language voting rights and fund allocation, based on privatized data and demonstrates that disparities in outcomes may arise due to adoption of differential privacy. For example, (Kenny et al., 2021) systematically analyzes how the U.S. Census Bureau’s latest Disclosure Avoidance System (DAS) (Abowd et al., 2022) powered by differential privacy affects the redrawing of electoral districts. The authors identify how DAS might prevent policymakers from creating districts of equal population—and hence, potentially violate the “One Person, One Vote” standard for political equality. Following (Pujol et al., 2020)’s illumination of how differential privacy may exert disparate impacts, (Steed et al., 2022) conducts an in-depth analysis of Title I fund allocation (over $11.6 billion in 2021) under privacy protection, surfacing how applications of differential privacy might lead to the misallocation of federal education funds due to existing data deviations. Building upon these critical findings, recent studies such as (Tran et al., 2021; Zhu et al., 2022) focus on designing proper mechanisms to remedy the negative effects brought by differential privacy, especially unfairness in fund allocation.
2.2. Algorithmic school redistricting
This paper aims to investigate a demographic-related downstream task, i.e., redrawing of elementary school attendance boundaries for creating more racial and ethnic diversity, and analyze the potential influences of differential privacy on its performance. In terms of this specific task, this study builds upon the data and models from (Gillani et al., 2023b), which takes an initial step towards simulating alternative attendance boundaries optimized to achieve racial and ethnic desegregation across multiple US school districts. Our present study is relevant in light of this prior work, and the follow-on interest from districts to explore how algorithmic redistricting models might help reveal new pathways to desegregation policymaking in their own contexts (Gillani et al., 2023a). Given this interest, along with ongoing researcher-practitioner partnerships that involve the development and application of computational models for fostering more diverse schools (e.g., (Allman et al., 2022)), in the forthcoming years, there may be demand for tools and systems that flexibly enable districts to directly explore possible diversity-promoting boundary configurations on their own specific datasets. Privacy preservation (e.g., through the use of differential privacy) is likely to play an important role in fostering the trust needed for districts to feel comfortable using such systems. Therefore, we seek to fill an important gap in the literature: empirically investigating how differential privacy might affect the outputs of diversity-promoting school redistricting algorithms.
3. Preliminaries of Differential Privacy
Differential privacy is a concept in data privacy that aims to protect the privacy of individuals when their data is being used for analysis. It ensures that statistical queries made on a dataset do not reveal too much sensitive information about any individual. The mathematical definition of differential privacy is formally presented as follows.
Definition 3.1 (Differential Privacy (Dwork et al., 2006)).
A randomized mechanism with domain and range is -differentially private, if, for any two neighboring datasets , which differ in only one record, and any possible outcome :
where the probabilities above are taken over the randomness of the mechanism .
The key parameter , often known as privacy budget, is a non-negative real number, which quantifies the privacy loss of the randomized algorithm . It measures the strength of privacy protection provided by the algorithm, with smaller values of indicating stronger privacy guarantees.
The Laplace mechanism, which employs carefully calibrated Laplace noise to obfuscate query answers, is one of the most commonly-used differentially private mechanisms both in theory and practice.
Theorem 3.2 (Laplace Mechanism (Dwork et al., 2006)).
Let be a numeric query. The Laplace mechanism achieves -differential privacy with its output , where, for any , the entry of is an i.i.d. sample drawn from the Laplace distribution .
In the definition above, the parameter , often called (global) sensitivity, measures the maximum amount that the query answer can change due to addition or removal of an individual record in the dataset, i.e.,
This work considers a discrete variant of the Laplace mechanism, known as the geometric mechanism, which is capable of preserving both the integrality of its output and providing privacy guarantees.
Theorem 3.3 (Geometric Mechanism (Ghosh et al., 2009)).
Let be a numeric query. The geometric mechanism achieves -differential privacy with its output , where, for any , the entry of is an i.i.d. sample drawn from the two-sided geometric distribution with . The probability mass function of a random variable is shown as follows
Besides, this work is dependent on a crucial property of differential privacy, which is its immunity to post-processing. This desirable property states that a differentially private output can be arbitrarily transformed, using some data- independent function, without affecting its privacy guarantees.
Theorem 3.4 (Post-processing Immunity (Dwork et al., 2006)).
Let be a randomized mechanism that is -differentially private. Let be an arbitrary mapping. Then, is -differentially private.
4. Problem Settings
This paper uses the following notation: boldface symbols denote vectors or matrices, while italic symbols are used to denote scalars or random variables. This work focuses on simulating alternative elementary school attendance boundaries within a collection of school districts. Formalizing the model presented in (Gillani et al., 2023b), let and stand for the sets of Census blocks and elementary schools, both of which belong to a particular school district, respectively. A valid school assignment can be characterized by a binary matrix, i.e., , with each row summed up to . The entry equals , if block is assigned to school , or otherwise. For convenience, let represent the current school assignment. In addition, is to used to represent a set of races and ethnicities, including White, Black, Asian, Native and Hispanic/Latinx.
In pursuit of more racially and ethnically diverse elementary schools, (Gillani et al., 2023b) explores alternative attendance boundaries different from the current ones and proposes a novel optimization approach depicted in Equation (1), which takes into consideration multiple realistic constraints. This optimization problem aims to minimize White/non-White segregation, represented by the dissimilarity index across both groups (Duncan and Duncan, 1955), i.e.,
where, given a school assignment , the quantities, and defined in Equations (1f) – (1g), stand for the numbers of White and non-White students attending school respectively. Likewise, and given by Equation (1h) indicate the total numbers of White and non-White students across the school district. Equations (1b) – (1e) present a list of the constraints that a feasible school assignment is expected to meet:
-
(1b)
One school per block. Each Census block should be assigned to only one elementary school.
-
(1c)
Maximum travel time increases. A reasonable school assignment is not supposed to increase estimated travel times by more than for any given family living in the school district. For any and , represents the estimated travel time from block to school .
-
(1d)
Maximum school size increases. To ensure the quality of education, the increase of the total population at a given school resulting from re-assignments of blocks should not exceed of its current population. The total population of a school is the combined student counts of all census blocks that have been assigned to that school. Besides, represents the total count of students living in block .
-
(1e)
Contiguity. If block is assigned to school , there should be at least one neighbor of in the induced graph of blocks, which is closer111The distance between block and school is measure by the shortest path connecting to the “root” block where is located. to and assigned to school as well. The set is a collection of the neighbors of block , which are closer to school .
| (1a) | |||||
| (1b) | s.t. | ||||
| (1c) | |||||
| (1d) | |||||
| (1e) | |||||
| (1f) | |||||
| (1g) | |||||
| (1h) | |||||
| (1i) | |||||
The solution to Equation (1) is referred to as the non-private school assignment, in order to distinguish it from the differentially private one that will be discussed later.
Notice that, to emphasize its dependence on the student counts , the non-private school assignment is expressed as a function of , which is essentially a matrix with each column a record of the students of different races and ethnicities in , along with the total counts of students living in block , i.e.,
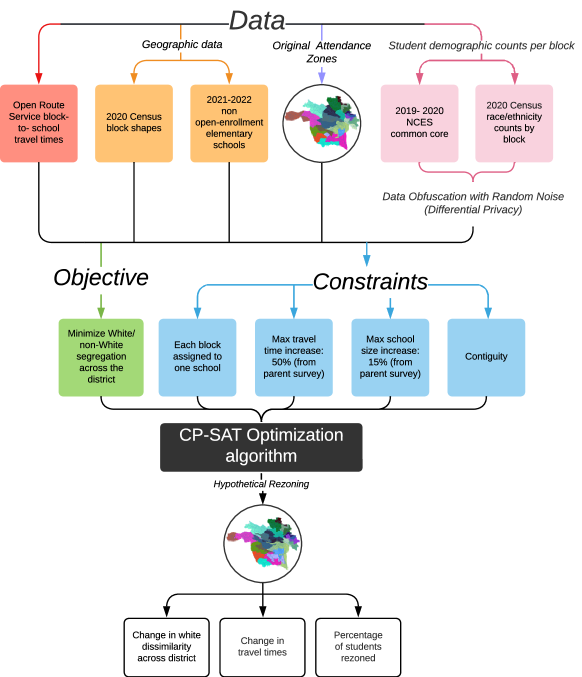
In the context of data privacy, the demographics in the form of can reveal sensitive information about individuals such as race/ethnicity and thus require privacy protection prior to data release. This work assumes that, in the context of democratizing access to algorithmic redistricting tools for promoting more diverse schools, school districts may wish to share student counts in a differentially private manner, which could be accomplished by designing and implementing a platform that applies the geometric mechanism in Theorem 3.3 to district-uploaded data and uses this as the basis for simulating alternative boundaries. Specifically, the student counts , as a query answer , can preserve -differential privacy, if i.i.d. two-sided geometric noise with is added to each of their entries. The reason why the sensitivity associated with equals is that addition or removal of an individual record from , say a student who lives in block and belongs to racial group , would affect exactly two entries of , and . Moreover, a simple post-processing step 222 is an entry-wise operation of taking the positive part of the input. should be performed ahead of data release to restore non-negativity, i.e., , such that there is no negative count in . By replacing with their private counterparts , the optimized school assignment ensures -differential privacy due to post-processing immunity333 For , the optimization problem in Equation (1) can be considered as a specific form of post-processing applied to . in Theorem 3.4 and is thus referred to as the private school assignment. Figure 1, adapted from (Gillani et al., 2023b), provides a graphic illustration of the systematic procedure for generating private school assignments as inputs into the downstream rezoning process described above.
Therefore, we end up with three different school assignment scenarios:
-
•
current school assignment ,
-
•
non-private school assignment ,
-
•
private school assignment .
The main objective of this work is to evaluate the potential impacts of differential privacy on redrawing the school attendance boundaries by comparing private and non-private school assignments in different aspects, including but not limited to racial and ethnic diversity. On many occasions, the current school assignment serves as the benchmark against the other two school assignments.
5. Experiments and Results
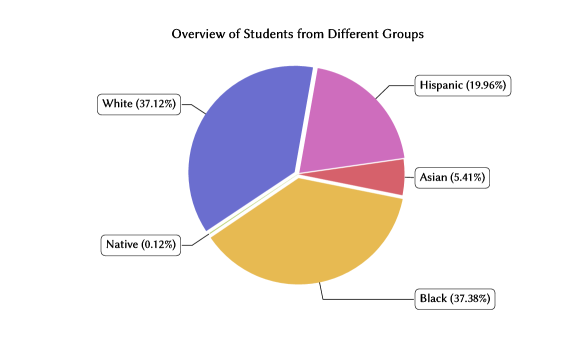
This paper focuses on 968 elementary schools across 67 school districts in Georgia, using the datasets presented in (Gillani et al., 2023b): 2021-2022 elementary school attendance boundaries, 2019-2020 publicly-available school attendance data by race/ethnicity (White, Black, Asian, Native, and Hispanic/Latinx), and 2020 Census-level estimates of the number of non-adults per demographic group living in each Census block. These datasets are used to estimate the actual populations of students living in 134,324 Census blocks. While these are estimates derived from the aforementioned datasets, for the purposes of this study, we refer to them as “ground truth” and use them as the basis for imposing differential privacy. Figure 7 presents an overview of the racial and ethnic identities of the students. This work utilizes those student counts to derive non-private school assignments across 67 school districts, by solving the optimization problem in Equation (1) using the CP-SAT constraint programming solver (Perron and Furnon, 2022). Likewise, private school assignments can be generated by similar procedures, as depicted in the previous section, but based on privatized student counts. It is noteworthy that, whatever the school assignments, the dissimilarity indices are evaluated on the ground-truth student counts in the following sections, rather than the differentially private counts used to create private school assignments.
In addition, the scenarios of private school assignments under different levels of privacy protection are showcased using two different privacy budgets, namely , where the variances of the two-sided geometric noise used for data obfuscation are around and respectively. The private school assignment with the privacy budget provides stronger privacy guarantees than the other (). Due to random nature of private school assignments, 200 independent rezonings are simulated for each district and privacy budget . To conclude the experimental settings, this work permits up to increase in travel time and increase in school size due to re-assignments of Census blocks, i.e., and , motivated by data obtained from a parent survey in (Gillani et al., 2023b) highlighting these as potentially realistic values for such parameters.
5.1. District-level Results
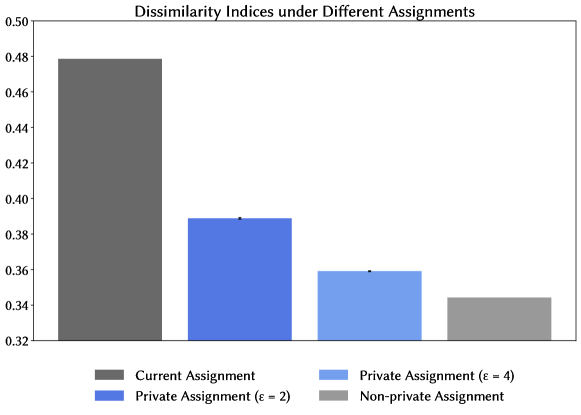
For the convenience of presentation, this section mainly covers the results associated with the stronger privacy budget , unless otherwise specified. The primary goal here is to examine the impacts of differential privacy on the redrawing of school attendance boundaries in terms of racial and ethnic desegregation. Table LABEL:tab:long_dissim_idx_info contains the dissimilarity indices associated with the three school assignments of different types across 67 school districts. In most of the school districts studied in this work, the performance of the private school assignments is moderate and lies somewhere between the non-private and current ones. To be more accurate, as illustrated in Figure 2, the private school assignment would result in more racially segregated attendance boundaries across the studied districts than the non-private one: a median decrease of 14.91%, versus a median 23.41% reduction under non-private school assignment. This may be due in part to the fact that the private school assignment assigns around 4.75% fewer Census blocks, on average, to different schools than the non-private one.
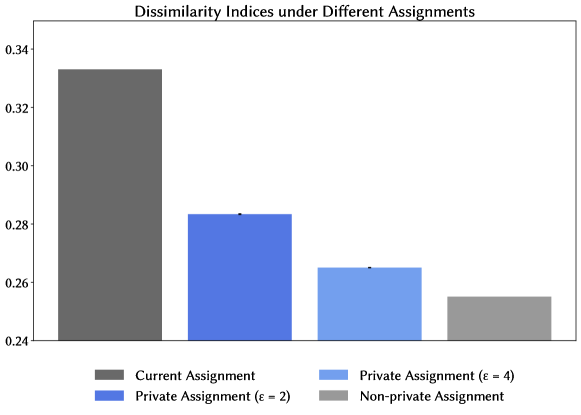
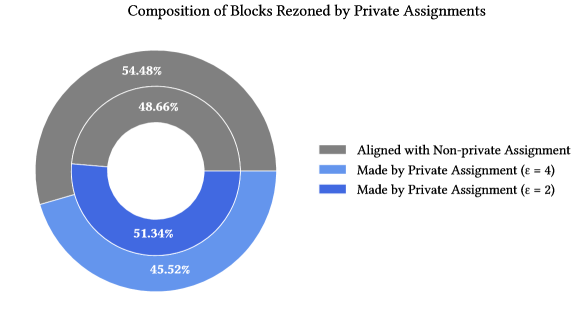
Moreover, notice that the private school assignment with the privacy budget outperforms that with and achieves a smaller performance gap against the non-private school assignment. This observation can be partially justified by the fact that, perturbed by less random noise, the private school assignment under rezones 732 more Census blocks in expectation and, more importantly, the re-assignments it makes turn out to be more efficient. Figure 3 shows that over 60% of the re-assignments of Census blocks made by the private school assignment with coincide with those made by the non-private one while that kind of re-assignments only accounts for just around 54% of the total re-assignments made by the private one with . Another intuitive way to understand this observation is that the non-private school assignment can somehow be interpreted as a private one, whose privacy budget equals because it is derived by a deterministic mechanism applied to the student counts with no noise added. Therefore, as the privacy budget increases and privacy protection gets weaker, we might expected that the private school assignment converges to the non-private one.
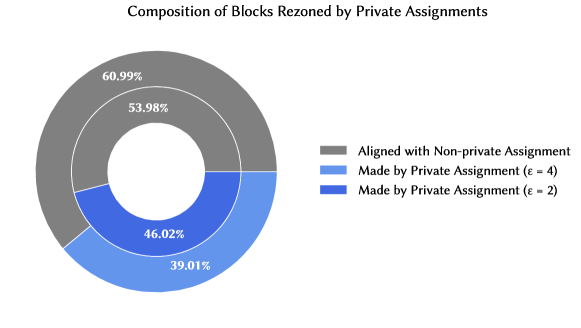
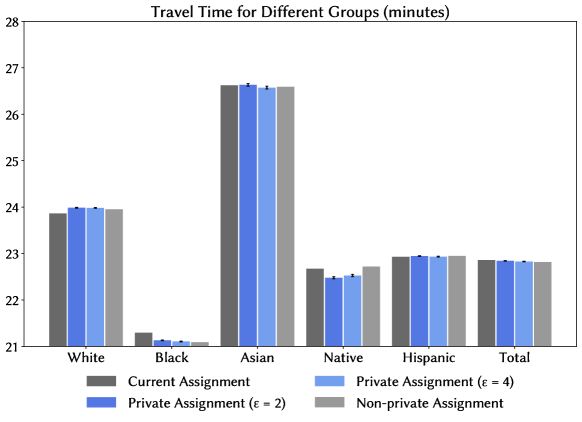
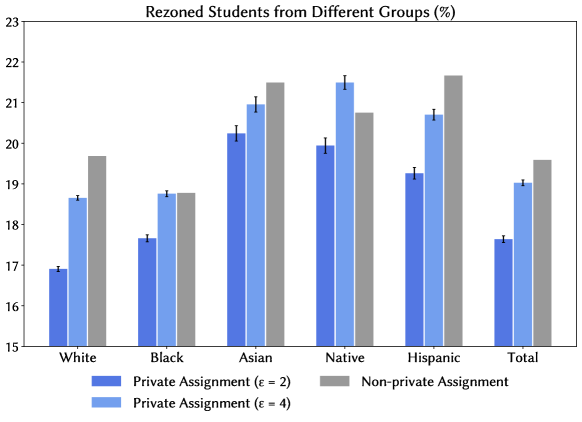
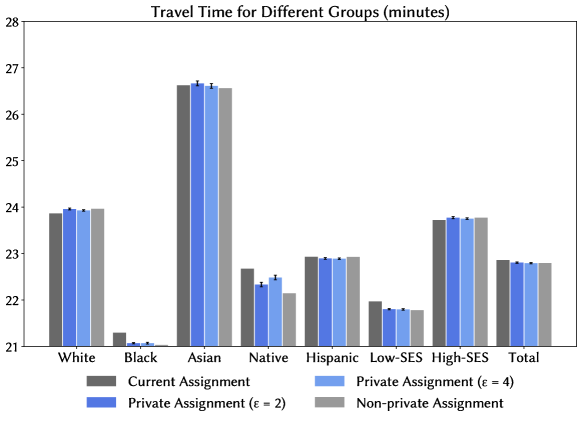
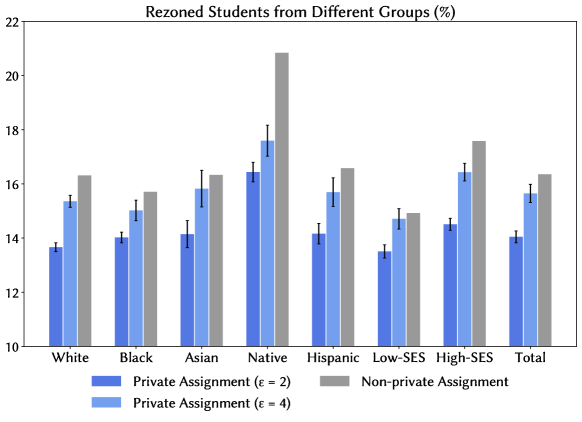
Figure 4 visualizes the changes in travel time resulting from different school assignments. Interestingly, both private and non-private boundary changes do not substantially change travel times, and in many cases, reduce them across demographic groups, similar to the findings from (Gillani et al., 2023b). Figure 5 shows that around 2% fewer students would be re-assigned to other schools by the private school assignment, compared with the non-private one, and the reduction is similar across different demographic groups. An exception occurs under the private school assignment with , where more Native American students are affected, likely due to their small population size.
Next, we hone into specific configurations across districts—namely, the scenario in each district that would produce the smallest reduction in segregation due to introduction of differential privacy, i.e., the largest difference in dissimilarity index between the private and non-private school assignments . We are interested in better understanding which district-level features are predictive of this difference, if any. This is important, as it may help shed light on which types of districts the introduction of differential privacy is more or less likely to impact, and how.
We use linear regression to study which school district features are associated with this difference. The selected features can be grouped into the following four categories:
-
1)
the demographic composition of students,
-
2)
the size of the school district,
-
3)
the location of the school district,
-
4)
the current level of racial and ethnic segregation.
| Features | Coefficients | Standard Errors | -values | 95% Confidence Intervals | ||
| % White | 0.0098 | 0.012 | 0.785 | 0.436 | -0.015 | 0.035 |
| % Black | 0.0077 | 0.012 | 0.652 | 0.517 | -0.016 | 0.031 |
| % Asian | -3.79E-5 | 0.002 | -0.017 | 0.986 | -0.004 | 0.004 |
| % Native | 0.001 | 0.001 | 0.999 | 0.322 | -0.001 | 0.003 |
| % Hispanic | 0.0034 | 0.007 | 0.498 | 0.621 | -0.01 | 0.017 |
| # Students | 0.0026 | 0.004 | 0.729 | 0.469 | -0.005 | 0.01 |
| # Elem. Schools | -0.0017 | 0.004 | -0.462 | 0.646 | -0.009 | 0.006 |
| 0.0004 | 0.001 | 0.693 | 0.491 | -0.001 | 0.002 | |
| -0.0005 | 0 | -0.935 | 0.354 | -0.001 | 0.001 | |
| 2.46E-5 | 0.001 | 0.043 | 0.966 | -0.001 | 0.001 | |
| 0.0004 | 0.001 | 0.416 | 0.679 | -0.001 | 0.002 | |
| 0.0046 | 0.001 | 4.667 | 0 | 0.003 | 0.007 | |
Results are summarized in Table 1. We find that out of the included variables, only the district’s baseline White/non-White dissimilarity index is significantly predictive of this difference (at ): the higher the , the less diverse the private school assignment is (i.e., the larger the gap between resulting dissimilarity between the private and non-private school assignments). The adjusted of the model is also generally small at approximately 0.32. Together, these values suggest that the impact of differential privacy on potential school integration is likely to vary widely across districts, and will be influenced by district-level idiosyncrasies like current boundaries, demographic distributions across constituent neighborhoods, and other factors not currently included in our model.
5.2. Block-level Results
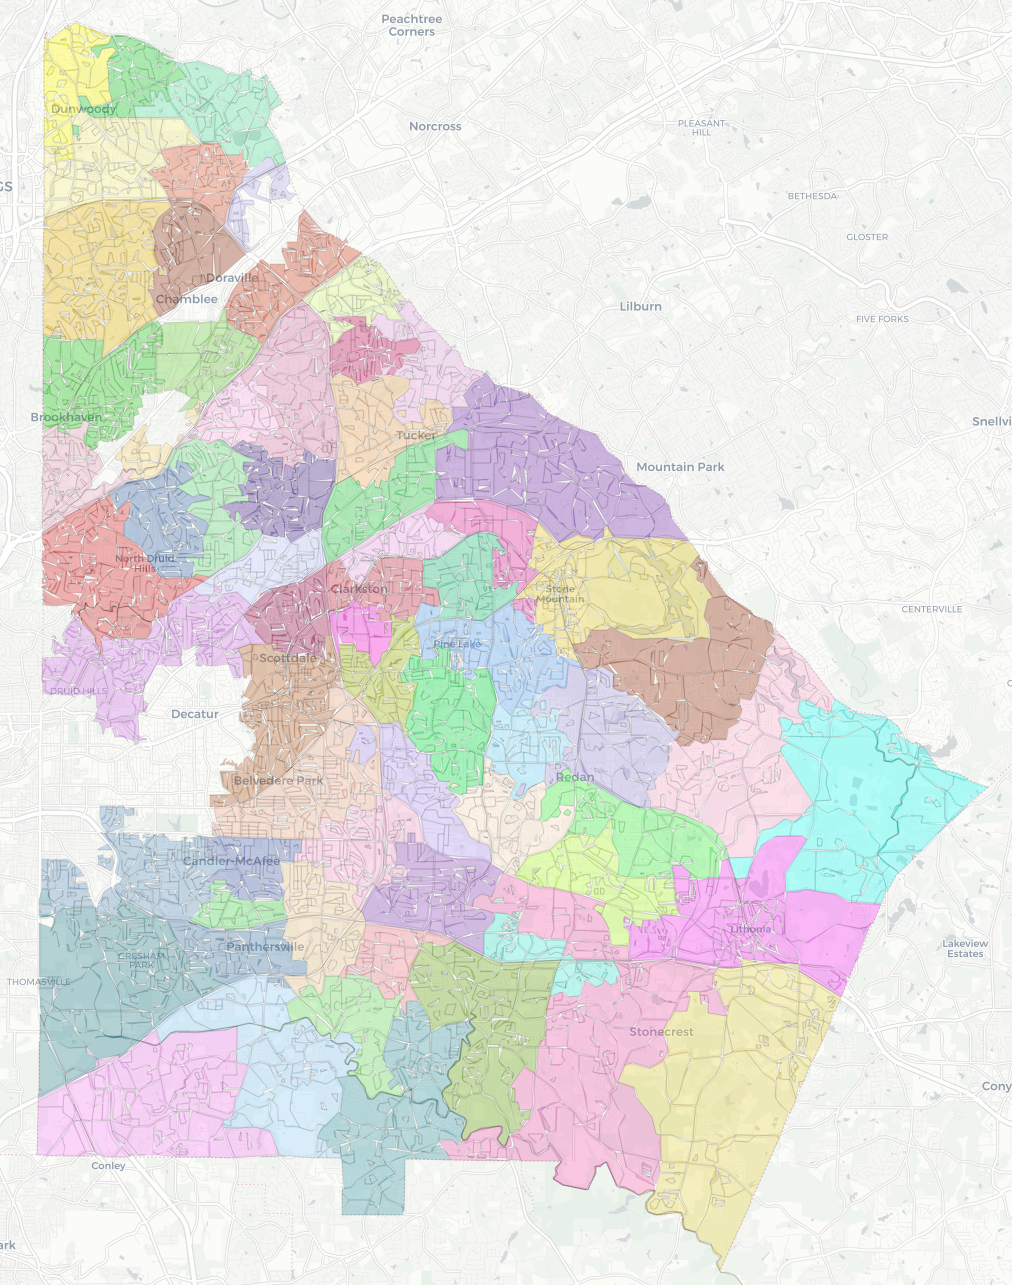
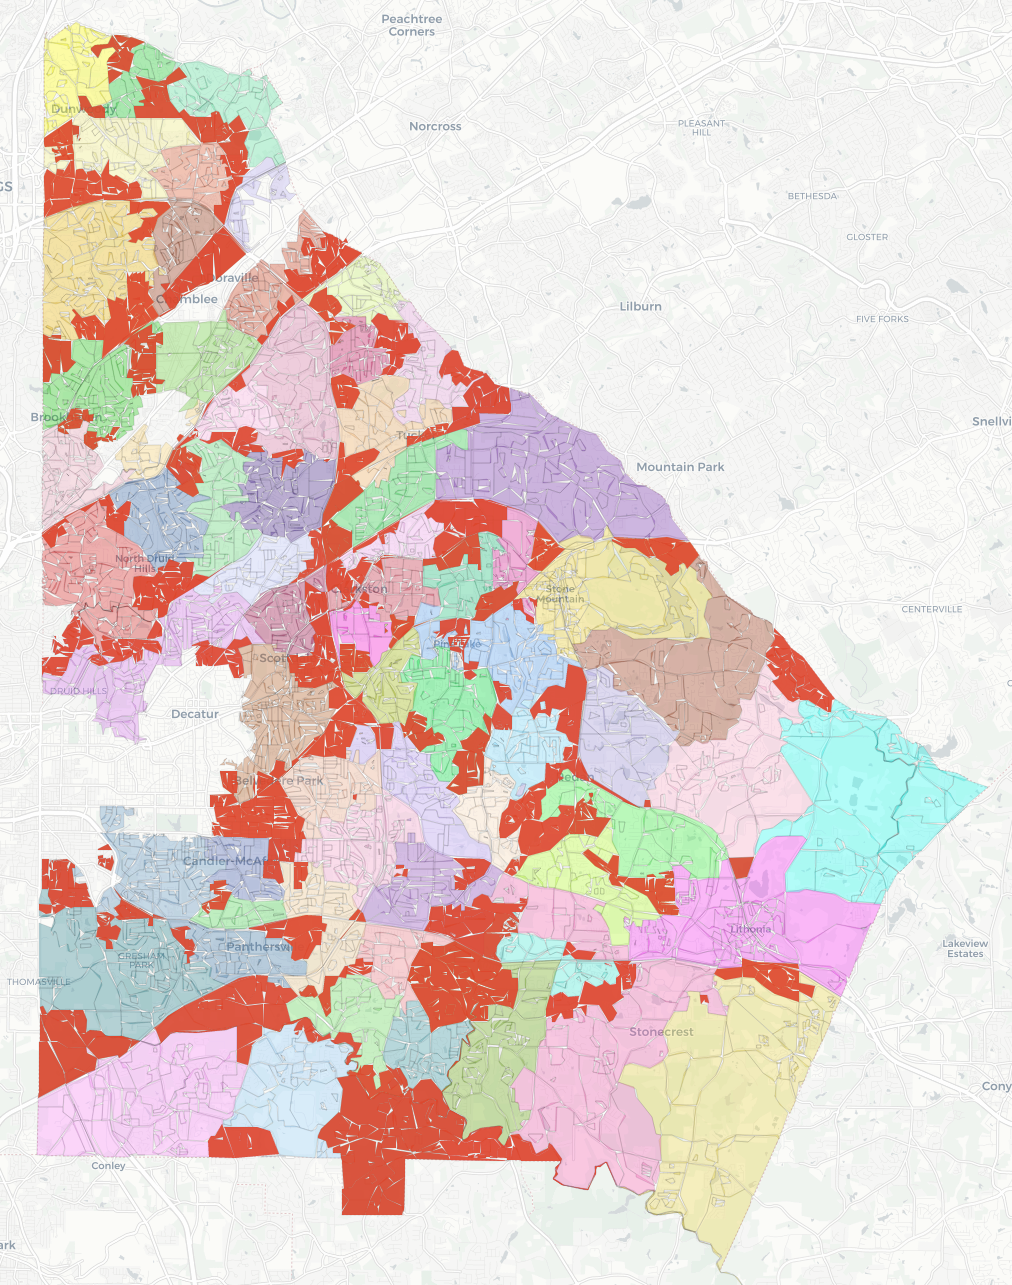
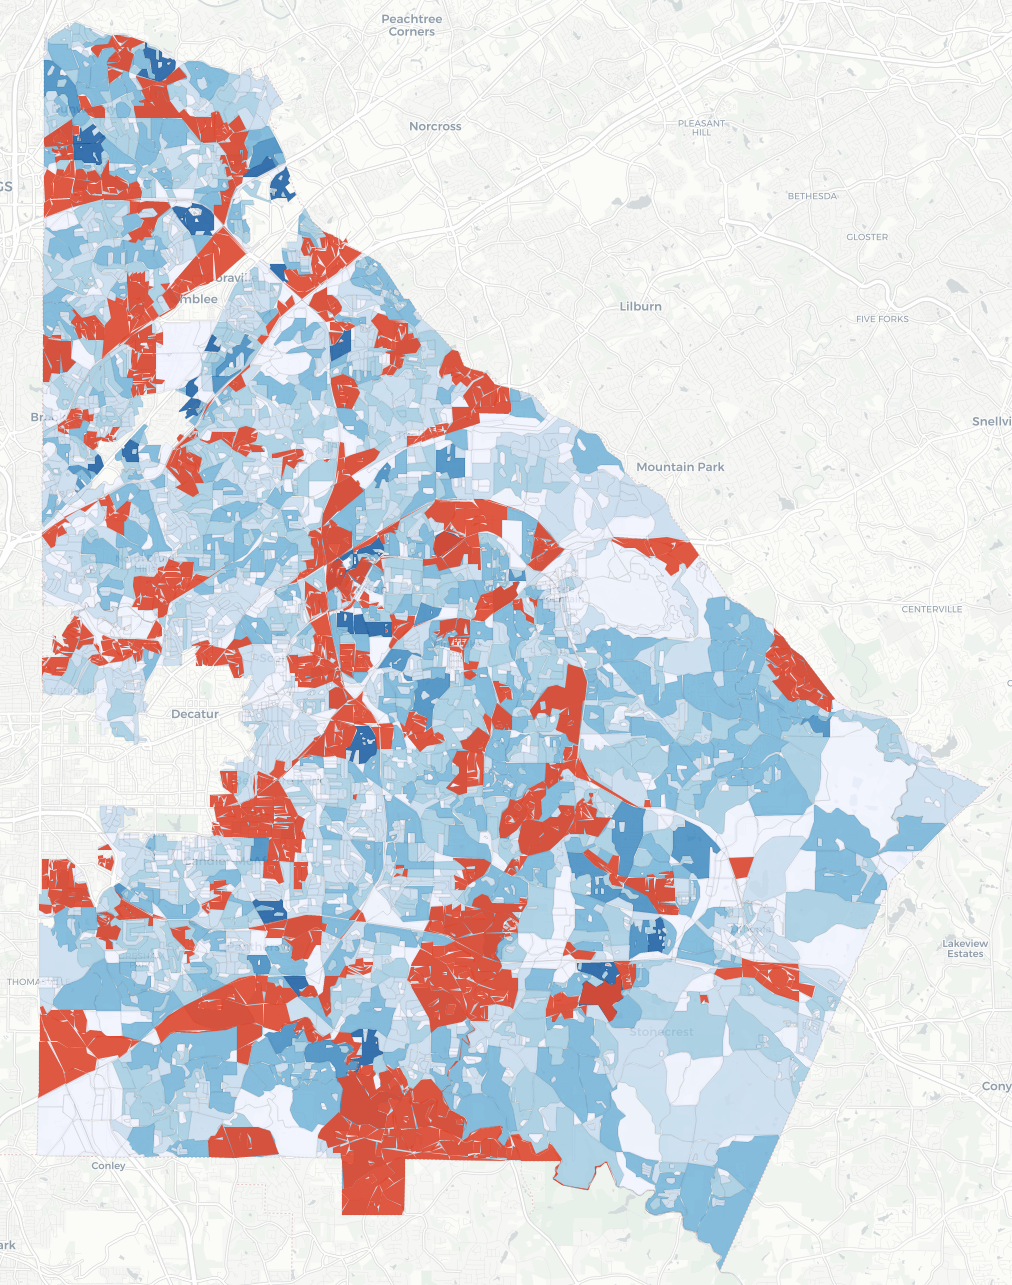
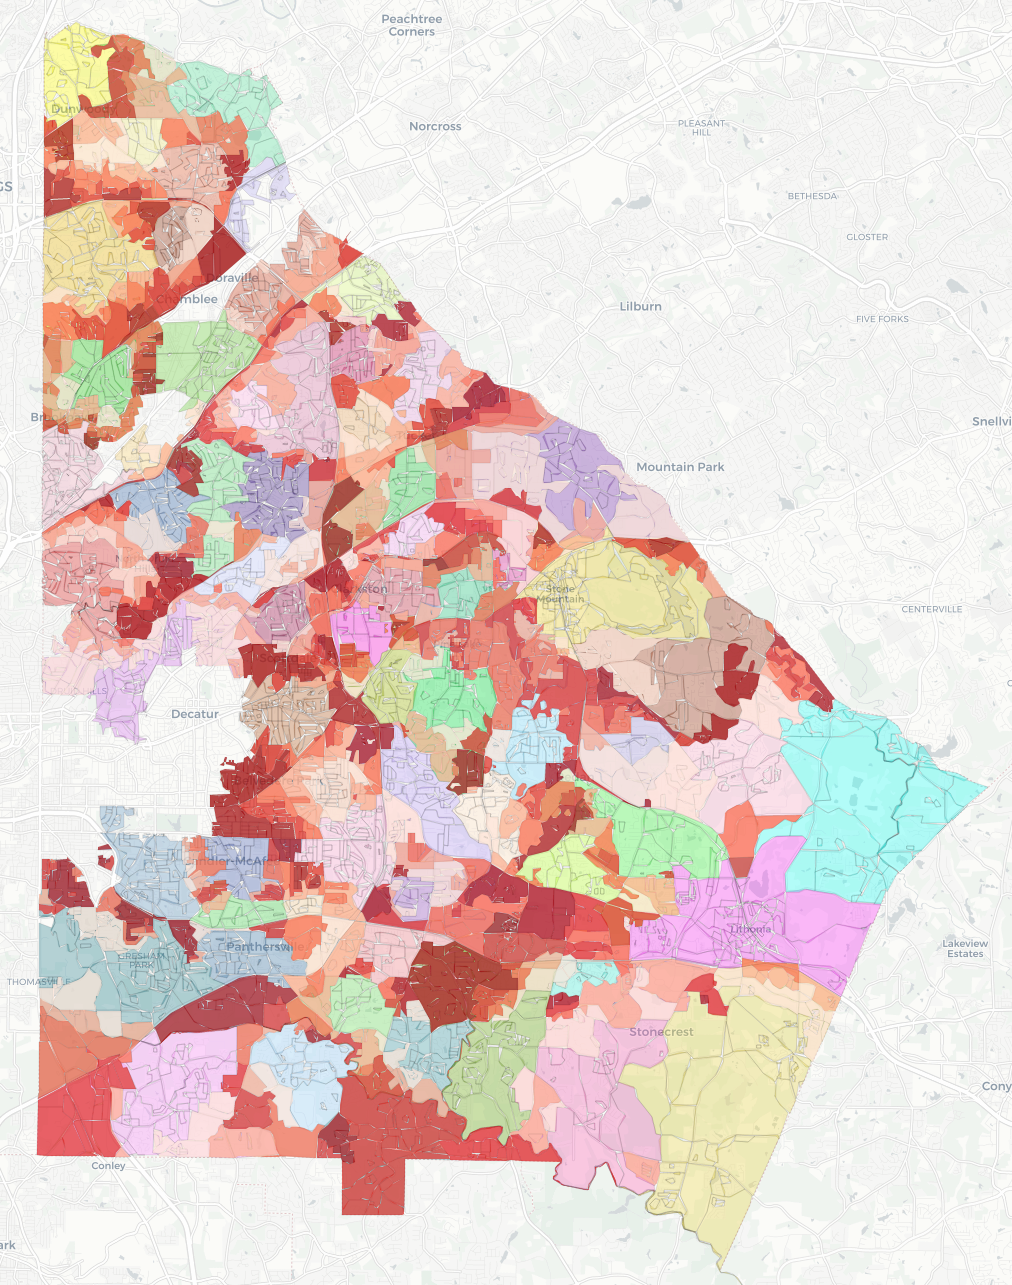
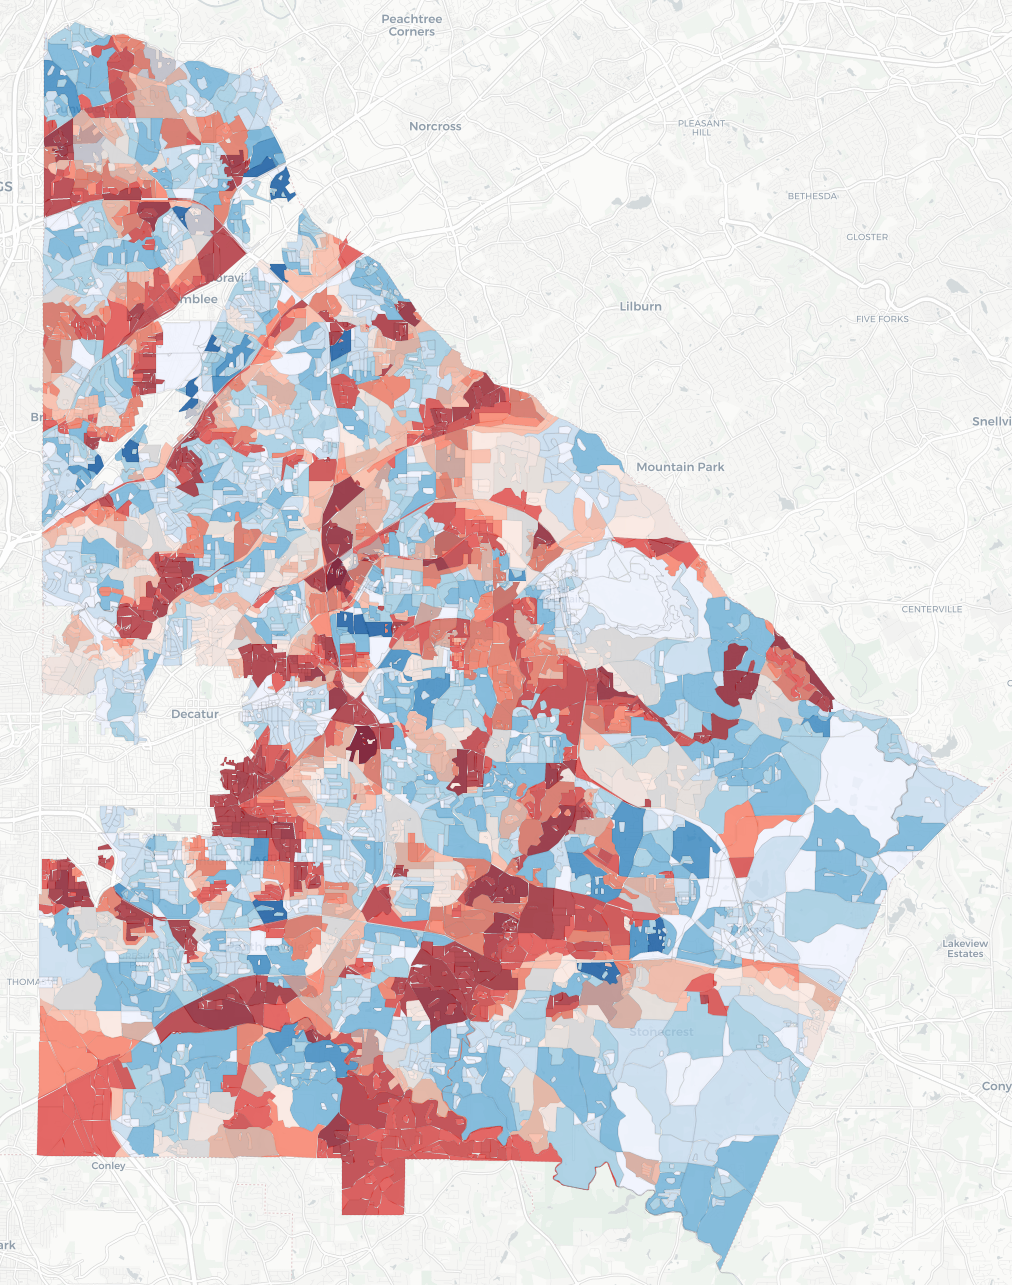
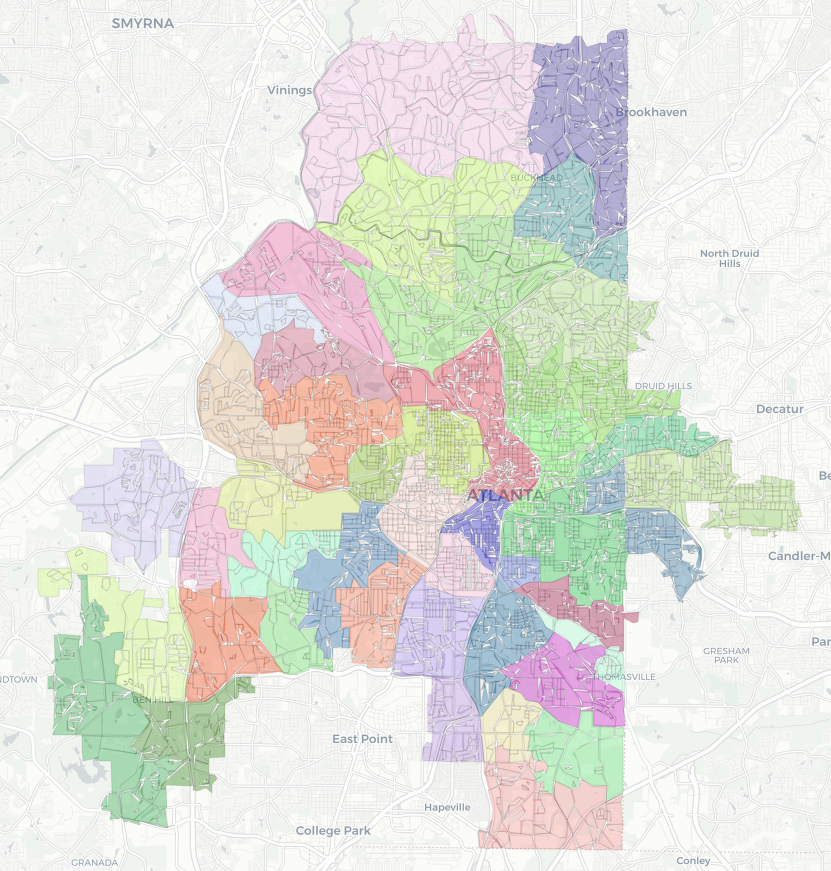
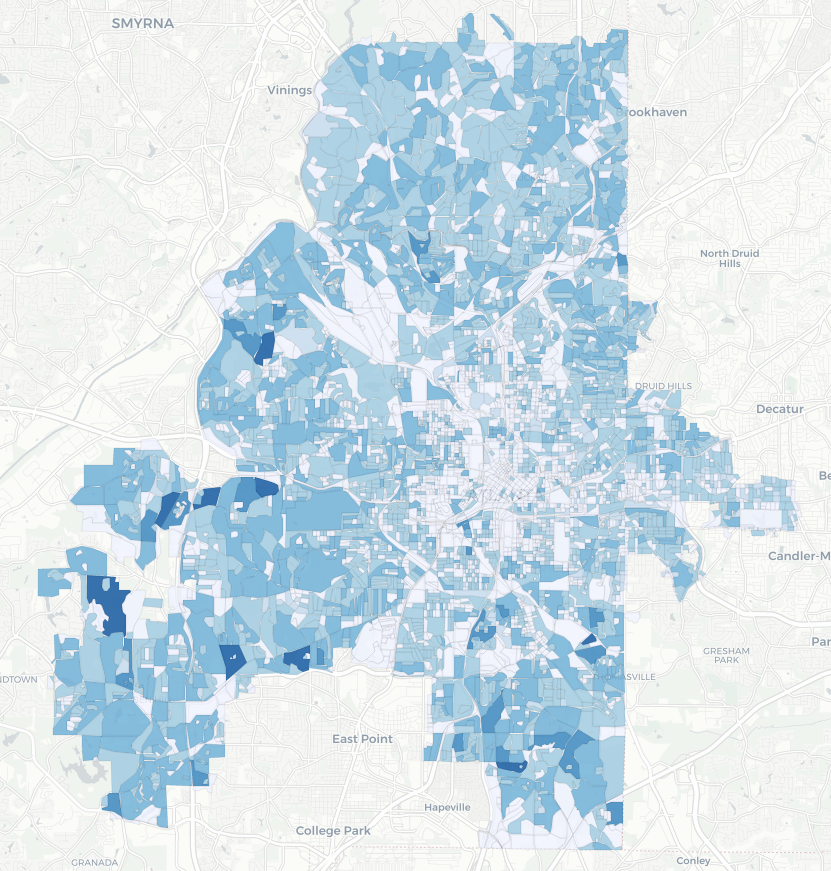
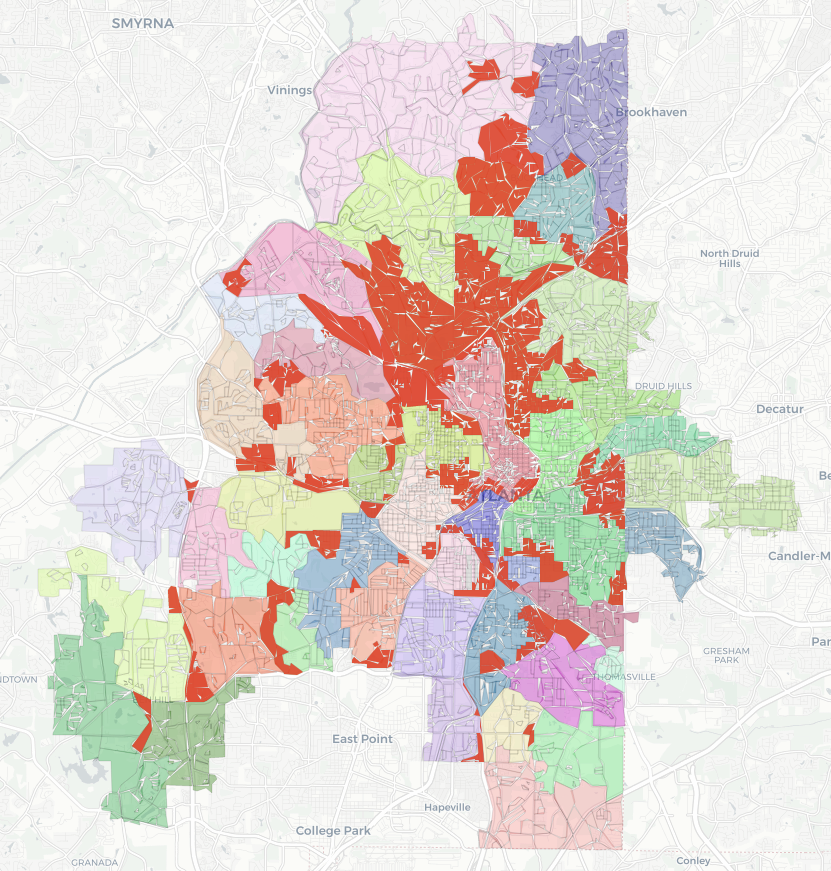
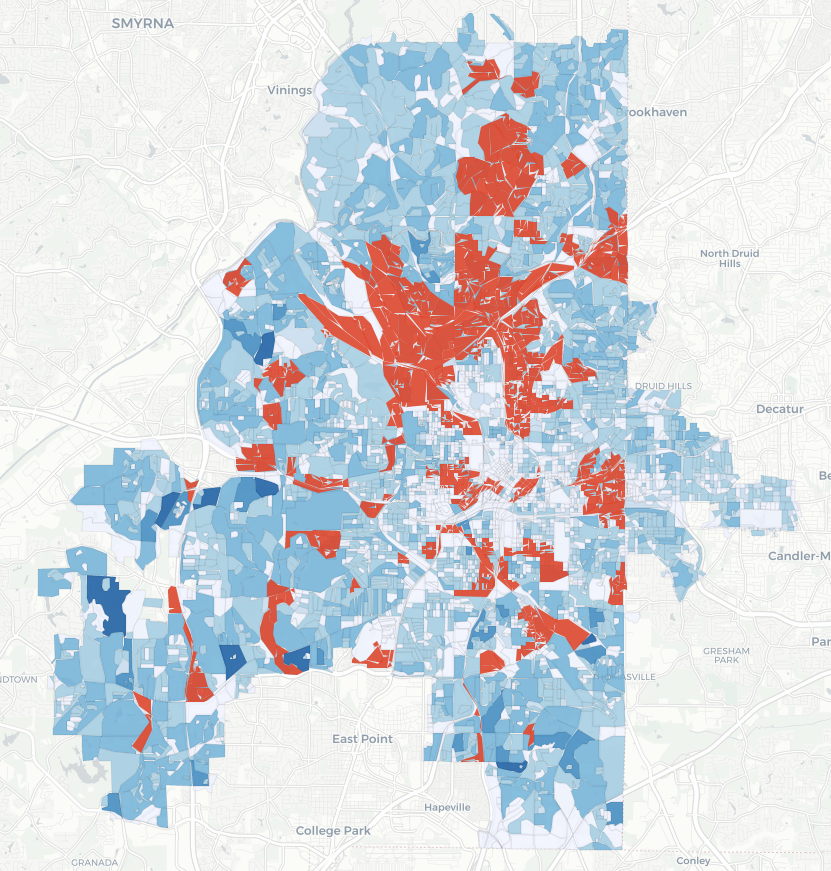
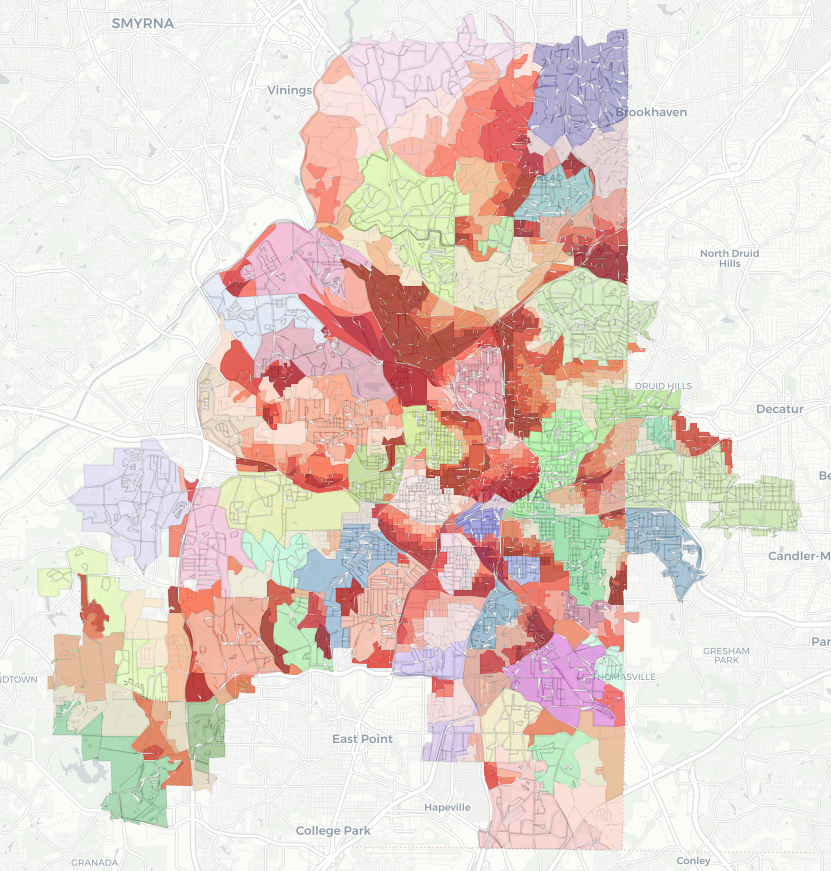
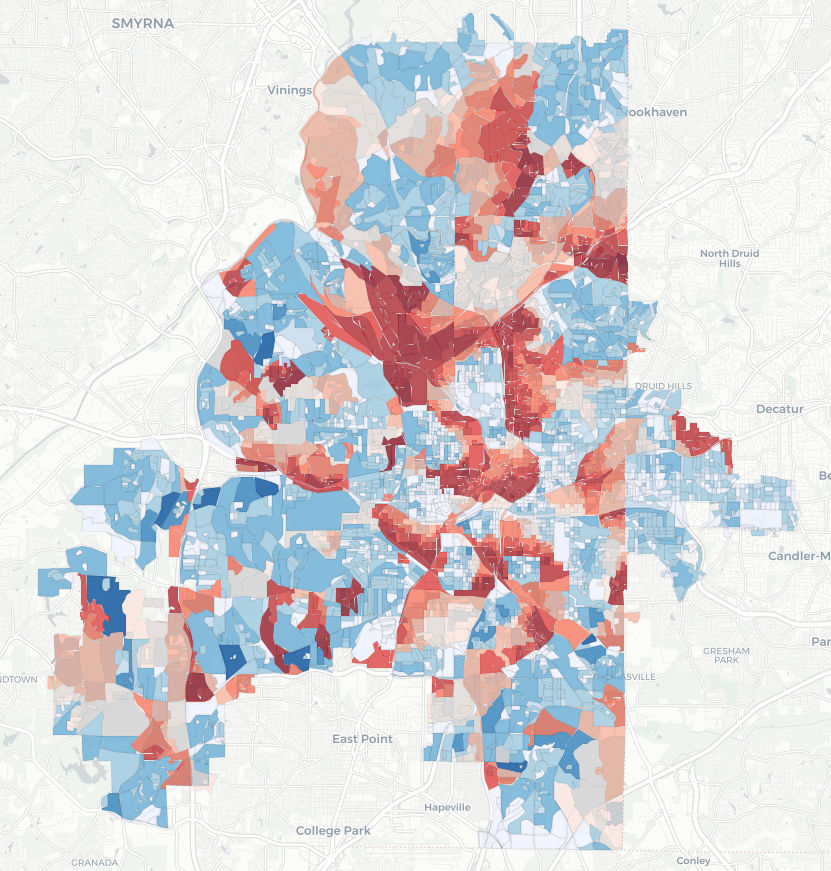
The purpose of this section is to carry out a more detailed, Census block-level analyses through case studies of two large, metropolitan, adjacent districts in Atlanta: DeKalb County and Atlanta Public Schools, represented by Figures 6 and 8 (deferred to the Appendix), respectively. The figures compare the assignment of Census blocks to schools under status quo (top row), non-private assignment (middle), and private assignment (bottom row).
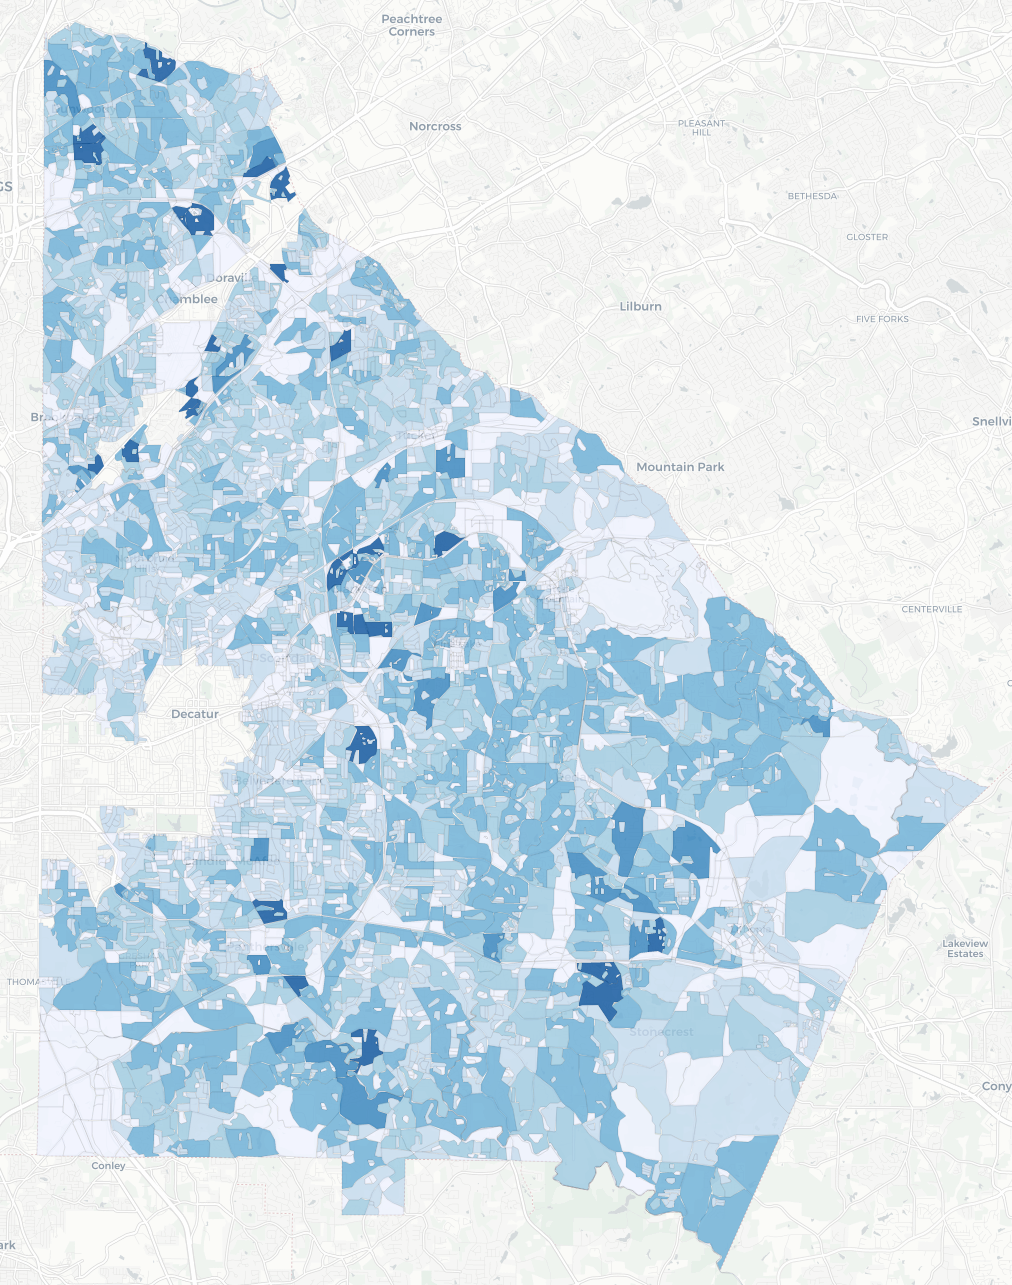
We observe that, for both of sets of alternative school attendance boundaries, most of the rezonings take place near the boundaries associated with the current school assignment, which is likely due to the travel time constraints imposed on the model. Moreover, it is noteworthy that the non-private and private school assignments are often unlikely to re-assign highly-populated Census blocks. This phenomenon can be explained by the fact that the rezoning of a block with a high population might be more likely to violate the school size constraint (presented in Equation (1d)), or perhaps adversely affect the integration objective (if they have high concentrations of students belonging to a particular demographic group). The “average-case” private school assignment exhibits similar behavior as the non-private school assignment at the level of Census blocks, though still with differences, reflecting comparisons between the non-private and private assignments across the various outcome measures discussed above.
6. Discussion
Overall, our results demonstrate that, as privacy protection strengthens, private school assignment re-assigns fewer students and yields less diverse attendance boundaries. Furthermore, only a small amount of the difference between private and non-private school assignment’s impact on changes in diversity can be explained by district-level demographics and baseline segregation rates, suggesting the nuances of each district’s current boundaries and population distribution are likely to influence how much the introduction of differential privacy will affect the outcomes of redistricting to foster more diverse and integrated schools. These findings point to a privacy-diversity trade-off local educational policymakers may face in forthcoming years, particularly as computational methods increasingly play a role in attendance boundary redrawing. Interestingly, adding differential privacy does not exert large disparate impacts on travel time and percents of the students rezoned across different groups.
Before concluding, we note several limitations with our work. For one, our focus on “average-case” analyses across multiple districts may obfuscate district-level nuances vis-á-vis how much differential privacy is likely to affect policymaking in practice. Focusing only on modeling a limited number of privacy budgets may have a similar impact. We also estimate student counts by Census block (instead of injecting privacy-preserving noise on ground truth student counts, which would require closer collaborations and data agreements with school districts), which could affect the results presented here. These limitations undescore the need for researchers to work closely with school districts in order to more thoroughly understand how the introduction of differential privacy might impact their diversity-promoting redistricting policies.
Looking ahead, we believe our results add to the growing empirical literature on how the introduction of differential privacy might affect decision-making in high-stakes policymaking settings. School districts often redraw attendance boundaries in order to mitigate school utilization imbalances; respond to changing demographics and populations; accommodate new schools; and address several other topics. Diversity is sometimes, though not always, a consideration in these settings. With demographic segregation continuing to plague many districts across the US (Office, 2022)—and issues of student admissions and diversity taking center stage in the US (aff, 2022)—there is a growing need to consider boundary-based student policy assignment changes in K12 settings in order to foster more diverse and integrated schools. Fortunately, many districts are interested in exploring such changes (Gillani et al., 2023a); still, they may also lack the in-house expertise to do so, or budgets and other resources to engage with outside consultants (who themselves may lack the expertise to model and explore a variety of integration-promoting boundary changes). This offers a unique opportunity for researchers and technologists to develop systems that support districts in these endeavors. Making this scalable to and inclusive of the thousands of districts across the US will require the development of analytical platforms and tools that equip districts to explore their own potential boundary changes and associated downstream impacts on family and district-level outcomes they might care about. Of course, garnering districts’ trust to use these tools with potentially sensitive student data will be of paramount importance. Imposing differential privacy can serve as a powerful avenue for garnering such trust, yet as we’ve shown, may also affect the extent to which districts can achieve diversity-promoting boundaries. We hope our study offers preliminary insights into what these effects of differential privacy might be and how they might vary across districts, and inspires future work that seeks to carefully balance privacy, diversity, and equity in education policymaking settings.
References
- (1)
- aff (2022) 2022. Students for Fair Admissions v. President and Fellows of Harvard College. Oyez. https://www.oyez.org/cases/2022/20-1199
- Abowd et al. (2022) John M Abowd, Robert Ashmead, Ryan Cumings-Menon, Simson Garfinkel, Micah Heineck, Christine Heiss, Robert Johns, Daniel Kifer, Philip Leclerc, Ashwin Machanavajjhala, et al. 2022. The 2020 census disclosure avoidance system topdown algorithm. Harvard Data Science Review Special Issue 2 (2022).
- Abowd and Schmutte (2019) John M Abowd and Ian M Schmutte. 2019. An economic analysis of privacy protection and statistical accuracy as social choices. American Economic Review 109, 1 (2019), 171–202.
- Allman et al. (2022) Maxwell Allman, Itai Ashlagi, Irene Lo, Juliette Love, Katherine Mentzer, Lulabel Ruiz-Setz, and Henry O’Connell. 2022. Designing School Choice for Diversity in the San Francisco Unified School District. In Proceedings of the 23rd ACM Conference on Economics and Computation. 290–291.
- Bridges (2016) Kim Bridges. 2016. Eden Prairie Public Schools: Adapting to Demographic Change in the Suburbs. The Century Foundation. https://tcf.org/content/report/eden-prairie-public-schools/
- Chetty et al. (2022) Raj Chetty, Matthew O. Jackson, Theresa Kuchler, and Johannes et al. Stroebel. 2022. Social capital II: determinants of economic connectedness. Nature 608 (2022), 122–134.
- Differential Privacy Team (2017) Apple Differential Privacy Team. 2017. Learning with Privacy at Scale. https://docs-assets.developer.apple.com/ml-research/papers/learning-with-privacy-at-scale.pdf
- Duncan and Duncan (1955) Otis Dudley Duncan and Beverly Duncan. 1955. A methodological analysis of segregation indexes. American sociological review 20, 2 (1955), 210–217.
- Dwork et al. (2006) Cynthia Dwork, Frank McSherry, Kobbi Nissim, and Adam Smith. 2006. Calibrating noise to sensitivity in private data analysis. In Theory of Cryptography: Third Theory of Cryptography Conference, TCC. 265–284.
- Fiel (2013) Jeremy E. Fiel. 2013. Decomposing School Resegregation: Social Closure, Racial Imbalance, and Racial Isolation. American Sociological Review 78, 5 (2013).
- Ghosh et al. (2009) Arpita Ghosh, Tim Roughgarden, and Mukund Sundararajan. 2009. Universally utility-maximizing privacy mechanisms. In Proceedings of the forty-first annual ACM symposium on Theory of computing. 351–360.
- Gillani et al. (2023a) Nabeel Gillani, Doug Beeferman, Cassandra Overney, Christine Vega-Pourheydarian, and Deb Roy. 2023a. All a-board: sharing educational data science research with school districts. In L@S ’23: Proceedings of the Tenth International ACM Conference on Learning at Scale.
- Gillani et al. (2023b) Nabeel Gillani, Doug Beeferman, Christine Vega-Pourheydarian, Cassandra Overney, Pascal Van Hentenryck, and Deb Roy. 2023b. Redrawing attendance boundaries to promote racial and ethnic diversity in elementary schools. Forthcoming in Educational Researcher (2023). https://papers.ssrn.com/sol3/papers.cfm?abstract_id=4387899
- Harwell and LeBeau (2010) Michael Harwell and Brandon LeBeau. 2010. Student Eligibility for a Free Lunch as an SES Measure in Education Research. Educational Researcher 39, 2 (2010).
- Houlgrave (2021) Bryon Houlgrave. 2021. COVID-19 May Energize Push for School Choice in States. Where That Leads Is Unclear. EdWeek. https://www.edweek.org/policy-politics/covid-19-may-energize-push-for-school-choice-in-states-where-that-leads-is-unclear/2021/01
- Kennedy (2007) J. Kennedy. 2007. Parents Involved in Community Schools v. Seattle School District. https://www.law.cornell.edu/supct/pdf/05-908P.ZC1. 551 US 701.
- Kenny et al. (2021) Christopher T Kenny, Shiro Kuriwaki, Cory McCartan, Evan TR Rosenman, Tyler Simko, and Kosuke Imai. 2021. The use of differential privacy for census data and its impact on redistricting: The case of the 2020 US Census. Science advances 7, 41 (2021), eabk3283.
- Monarrez (2021) Tomas Monarrez. 2021. School Attendance Boundaries and the Segregation of Schools in the US. Working paper (2021).
- of Education (2021) US Department of Education. 2021. Fast Facts: Public school choice programs. Digest of Education Statistics, 2019 (NCES 2021-009). https://nces.ed.gov/fastfacts/display.asp?id=6
- Office (2022) U.S. Government Accountability Office. 2022. K-12 Education: Student Population Has Significantly Diversified, but Many Schools Remain Divided Along Racial, Ethnic, and Economic Lines. U.S. Government Accountability Office. https://www.gao.gov/assets/gao-22-104737.pdf
- Perron and Furnon (2022) Laurent Perron and Vincent Furnon. 2022. OR-Tools. Google. https://developers.google.com/optimization/.
- Pujol et al. (2020) David Pujol, Ryan McKenna, Satya Kuppam, Michael Hay, Ashwin Machanavajjhala, and Gerome Miklau. 2020. Fair decision making using privacy-protected data. In FAT* ’20: Conference on Fairness, Accountability, and Transparency, Barcelona, Spain, January 27-30, 2020, Mireille Hildebrandt, Carlos Castillo, L. Elisa Celis, Salvatore Ruggieri, Linnet Taylor, and Gabriela Zanfir-Fortuna (Eds.). ACM, 189–199. https://doi.org/10.1145/3351095.3372872
- Quick (2016) Kimberly Quick. 2016. Chicago Public Schools: Ensuring Diversity in Selective Enrollment and Magnet Schools. The Century Foundation. https://tcf.org/content/report/chicago-public-schools/
- Reardon et al. (2018) Sean F. Reardon, D. Kalogrides, and K. Shores. 2018. The Geography of Racial/Ethnic Test Score Gaps. Stanford Center for Education Policy Analysis, Working Paper No. 16-10 (2018).
- Staff (2019) Baltimore Sun Staff. 2019. In Howard County, a ‘courageous’ plan to redraw school boundaries tests community’s commitment to diversity. The Baltimore Sun. https://www.baltimoresun.com/education/bs-md-howard-school-redistricting-20190906-xhzkmkf2zvgcxdkbd3vqdanblm-story.html
- Steed et al. (2022) Ryan Steed, Terrance Liu, Zhiwei Steven Wu, and Alessandro Acquisti. 2022. Policy impacts of statistical uncertainty and privacy. Science 377, 6609 (2022), 928–931.
- Times (2022) The New York Times. 2022. Ahmaud Arbery Shooting: A Timeline of the Case. The New York Times. https://www.nytimes.com/article/ahmaud-arbery-timeline.html
- to the United States Commission on Civil Rights (2007) Georgia Advisory Committee to the United States Commission on Civil Rights. 2007. Desegregation of Public School Districts in Georgia. U.S. Commission on Civil Rights. https://www.usccr.gov/files/pubs/docs/GADESG-FULL.pdf
- Tran et al. (2021) Cuong Tran, Ferdinando Fioretto, Pascal Van Hentenryck, and Zhiyan Yao. 2021. Decision Making with Differential Privacy under a Fairness Lens. In Proceedings of the Thirtieth International Joint Conference on Artificial Intelligence, IJCAI-21, Zhi-Hua Zhou (Ed.). International Joint Conferences on Artificial Intelligence Organization, 560–566. https://doi.org/10.24963/ijcai.2021/78 Main Track.
- Wells et al. (2016) Amy Stuart Wells, L. Fox, and D. Cordova-Cobo. 2016. How Racially Diverse Schools and Classrooms Can Benefit All Students. The Century Foundation. https://tcf.org/content/report/how-racially-diverse-schools-and-classrooms-can-benefit-all-students/
- Yeung (2022) Peter Yeung. 2022. What Happened When France Sent Low-Income Kids to Wealthy Schools. The 74 Million. https://www.the74million.org/article/what-happened-when-france-sent-low-income-kids-to-wealthy-schools/
- Zhang (2008) Haifeng Zhang. 2008. White Flight in the Context of Education: Evidence from South Carolina. Journal of Geography 107, 6 (2008), 236–245.
- Zhu et al. (2022) Keyu Zhu, Ferdinando Fioretto, and Pascal Van Hentenryck. 2022. Post-processing of Differentially Private Data: A Fairness Perspective. In Proceedings of the Thirty-First International Joint Conference on Artificial Intelligence, IJCAI-22, Lud De Raedt (Ed.). International Joint Conferences on Artificial Intelligence Organization, 4029–4035. https://doi.org/10.24963/ijcai.2022/559 Main Track.
- Zhu et al. (2021) Keyu Zhu, Pascal Van Hentenryck, and Ferdinando Fioretto. 2021. Bias and variance of post-processing in differential privacy. In Proceedings of the AAAI Conference on Artificial Intelligence, Vol. 35. 11177–11184.
Appendix A Supplementary figures
| District ID | School Districts | # Blocks | # Elem. Schools | |||
|---|---|---|---|---|---|---|
| 1300001 | Troup County | 1309 | 8 | 0.3814 | 0.3438 | 0.3593 |
| 1300090 | Atkinson County | 545 | 2 | 0.0404 | 0.0228 | 0.0325 |
| 1300120 | Atlanta Public Schools | 5939 | 44 | 0.7472 | 0.6813 | 0.7179 |
| 1300290 | Barrow County | 1088 | 8 | 0.1031 | 0.0626 | 0.0757 |
| 1300330 | Bartow County | 1862 | 12 | 0.2598 | 0.1698 | 0.1949 |
| 1300420 | Bibb County | 3436 | 19 | 0.5511 | 0.5277 | 0.5320 |
| 1300630 | Bulloch County | 2499 | 9 | 0.4282 | 0.3371 | 0.3563 |
| 1300690 | Butts County | 664 | 3 | 0.1309 | 0.1000 | 0.1288 |
| 1300840 | Carroll County | 2081 | 12 | 0.1830 | 0.1125 | 0.1316 |
| 1300930 | Catoosa County | 1308 | 8 | 0.2372 | 0.1780 | 0.2128 |
| 1301020 | Savannah-Chatham County | 5650 | 24 | 0.4517 | 0.4316 | 0.4146 |
| 1301080 | Chattooga County | 841 | 3 | 0.3202 | 0.1687 | 0.2512 |
| 1301110 | Cherokee County | 2959 | 23 | 0.2897 | 0.1980 | 0.2193 |
| 1301170 | Clarke County | 1080 | 8 | 0.5001 | 0.3551 | 0.3828 |
| 1301230 | Clayton County | 3060 | 35 | 0.2856 | 0.2088 | 0.2625 |
| 1301290 | Cobb County | 6706 | 64 | 0.4899 | 0.4452 | 0.4516 |
| 1301350 | Coffee County | 1701 | 8 | 0.2715 | 0.1025 | 0.1515 |
| 1301380 | Colquitt County | 1813 | 10 | 0.3509 | 0.2295 | 0.2721 |
| 1301410 | Columbia County | 1606 | 18 | 0.2111 | 0.1684 | 0.1785 |
| 1301500 | Coweta County | 2512 | 19 | 0.3068 | 0.2051 | 0.2484 |
| 1301590 | Dade County | 707 | 2 | 0.0720 | 0.0313 | 0.0596 |
| 1301620 | Dalton Public Schools | 688 | 6 | 0.4659 | 0.2840 | 0.3367 |
| 1301650 | Dawson County | 779 | 4 | 0.2041 | 0.1474 | 0.1834 |
| 1301740 | DeKalb County | 5916 | 66 | 0.7209 | 0.6631 | 0.6853 |
| 1301830 | Dougherty County | 2435 | 11 | 0.4762 | 0.4359 | 0.4636 |
| 1301860 | Douglas County | 1548 | 20 | 0.3823 | 0.3286 | 0.3342 |
| 1301980 | Effingham County | 1363 | 8 | 0.1760 | 0.1205 | 0.1353 |
| 1302130 | Fayette County | 1549 | 14 | 0.4015 | 0.3038 | 0.3140 |
| 1302190 | Floyd County | 1724 | 7 | 0.3101 | 0.2813 | 0.2980 |
| 1302220 | Forsyth County | 1574 | 21 | 0.3760 | 0.3134 | 0.3162 |
| 1302280 | Fulton County | 6278 | 59 | 0.6133 | 0.5494 | 0.5591 |
| 1302310 | Gainesville City | 744 | 5 | 0.4287 | 0.2961 | 0.3196 |
| 1302400 | Glynn County | 2495 | 10 | 0.4032 | 0.3284 | 0.3767 |
| 1302430 | Gordon County | 1204 | 6 | 0.1252 | 0.0968 | 0.1157 |
| 1302460 | Grady County | 1309 | 5 | 0.4846 | 0.2978 | 0.4181 |
| 1302520 | Griffin-Spalding County | 1515 | 11 | 0.4330 | 0.2930 | 0.3302 |
| 1302550 | Gwinnett County | 6536 | 80 | 0.4280 | 0.3868 | 0.3982 |
| 1302580 | Habersham County | 1477 | 8 | 0.3999 | 0.3465 | 0.3720 |
| 1302610 | Hall County | 3055 | 19 | 0.5331 | 0.4091 | 0.4436 |
| 1302700 | Harris County | 1019 | 4 | 0.1522 | 0.1075 | 0.1383 |
| 1302730 | Hart County | 1214 | 3 | 0.2012 | 0.1473 | 0.1845 |
| 1302790 | Heard County | 543 | 3 | 0.1530 | 0.0922 | 0.1430 |
| 1302820 | Henry County | 3153 | 27 | 0.4671 | 0.3846 | 0.4029 |
| 1302880 | Houston County | 3267 | 20 | 0.3307 | 0.2752 | 0.2904 |
| 1302940 | Jackson County | 1550 | 6 | 0.1428 | 0.1128 | 0.1275 |
| 1303150 | Jones County | 692 | 4 | 0.2469 | 0.1363 | 0.1762 |
| 1303300 | Liberty County | 1189 | 7 | 0.2089 | 0.1718 | 0.1865 |
| 1303390 | Lowndes County | 1779 | 7 | 0.1873 | 0.1303 | 0.1578 |
| 1303480 | Madison County | 1140 | 5 | 0.2791 | 0.2348 | 0.2550 |
| 1303510 | Marietta City | 972 | 7 | 0.6007 | 0.3581 | 0.4156 |
| 1303720 | Monroe County | 994 | 3 | 0.1051 | 0.0517 | 0.0886 |
| 1303840 | Murray County | 788 | 6 | 0.2339 | 0.0947 | 0.1250 |
| 1303870 | Muscogee County | 2963 | 30 | 0.5389 | 0.4897 | 0.5039 |
| 1303930 | Newton County | 1930 | 13 | 0.4578 | 0.3910 | 0.4137 |
| 1303960 | Oconee County | 750 | 5 | 0.2040 | 0.1331 | 0.1827 |
| 1304020 | Paulding County | 1508 | 19 | 0.2518 | 0.2167 | 0.2215 |
| 1304050 | Peach County | 851 | 3 | 0.4192 | 0.3488 | 0.3910 |
| 1304140 | Pierce County | 1103 | 3 | 0.2146 | 0.1277 | 0.1801 |
| 1304200 | Polk County | 1524 | 6 | 0.2483 | 0.2180 | 0.2348 |
| 1304380 | Richmond County | 3525 | 27 | 0.5369 | 0.4748 | 0.5032 |
| 1304410 | Rockdale County | 1231 | 11 | 0.3336 | 0.2874 | 0.2983 |
| 1304440 | Rome City | 807 | 5 | 0.4082 | 0.1465 | 0.1824 |
| 1304980 | Tift County | 1874 | 8 | 0.1256 | 0.1109 | 0.1226 |
| 1305310 | Valdosta City | 1131 | 5 | 0.4077 | 0.2133 | 0.2827 |
| 1305370 | Walker County | 1923 | 10 | 0.1687 | 0.1443 | 0.1642 |
| 1305390 | Walton County | 1666 | 9 | 0.3130 | 0.1857 | 0.2267 |
| 1305700 | Whitfield County | 1683 | 13 | 0.4025 | 0.3420 | 0.3538 |
Appendix B Extension to socioeconomic (SES) integration
Beyond racial and ethnic segregation, this section aims to explore the adoption of the optimization approach discussed in Section 4 to facilitate socioeconomic (SES) integration and investigate how differential privacy affects the school attendance boundaries optimized for bringing together students of different socioeconomic statuses.
SES is a nebulous and multidimensional measure. Districts will often use Free/Reduced-Price Lunch (FRL) eligibility as a proxy, yet FRL suffers from a number of limitations, including its often weak association with household economic resources (Harwell and LeBeau, 2010). Here, we compute an index measure of SES used by several school districts across the US (Quick, 2016). The measurecombines several Census block-group level demographic variables into a composite value. These variables include: the percentage of dual parent households, percentage of households with a bachelor’s degree, percentage of households speaking non-English languages, percentage of homes that are owner-occupied, and median family income. We source these variables from the 2017-2021 American Community Survey (ACS) and standardize (z-score) each of these measures independently at the block group level. The z-scores for each variable are averaged together, and a global z-score is computed over this average to arrive at an SES score for each block group. Because our optimization model operates over blocks (which are finer-grained than block groups), we make the simplifying assumption of applying the block-group level z-scores to each of the block group’s constituent blocks. Blocks with z-scores falling above average are classified as high-SES; those falling below average are classified as low-SES. An additional limitation of this SES measure (which districts themselves face when making policy decisions based on Census or ACS-derived data) is that it is not available at the student level; only at a coarser geographic level.
Similar to the method presented in the main text, we apply differential privacy by injecting noise on the number of students per Census block belonging to each SES group (analogous to doing so on the number of students belonging to each racial/ethnic group). Future work may involve exploring the impacts of injecting noise on variables upstream of these block-level counts per SES group—for example, on the individual variables that combine to produce the index SES measure.
In general, we find that the results produced from the SES simulations are consistent with those produced by the ones for race/ethnicity: stronger privacy guarantees might impede SES integration efforts (perhaps resulting from fewer students being rezoned), with minimal impacts on travel times. Figures 9-12 and Table LABEL:tab:ses_long_dissim_idx_info describe these results in greater detail, mirroring those presented in the main text.
| District ID | School Districts | # Blocks | # Elem. Schools | |||
|---|---|---|---|---|---|---|
| 1300001 | Troup County | 1309 | 8 | 0.6550 | 0.6027 | 0.6333 |
| 1300090 | Atkinson County | 545 | 2 | 0.4188 | 0.3876 | 0.4215 |
| 1300120 | Atlanta Public Schools | 5939 | 44 | 0.6882 | 0.6354 | 0.6557 |
| 1300290 | Barrow County | 1088 | 8 | 0.3966 | 0.2704 | 0.2927 |
| 1300330 | Bartow County | 1862 | 12 | 0.2557 | 0.1301 | 0.1629 |
| 1300420 | Bibb County | 3436 | 19 | 0.7467 | 0.6693 | 0.6821 |
| 1300630 | Bulloch County | 2499 | 9 | 0.4650 | 0.1286 | 0.2401 |
| 1300690 | Butts County | 664 | 3 | 0.4440 | 0.3056 | 0.3590 |
| 1300840 | Carroll County | 2081 | 12 | 0.3633 | 0.2101 | 0.2580 |
| 1300930 | Catoosa County | 1308 | 8 | 0.5671 | 0.5317 | 0.5632 |
| 1301020 | Savannah-Chatham County | 5650 | 24 | 0.6007 | 0.5718 | 0.5357 |
| 1301080 | Chattooga County | 841 | 3 | 0.2732 | 0.0329 | 0.1272 |
| 1301110 | Cherokee County | 2959 | 23 | 0.4662 | 0.3218 | 0.3611 |
| 1301170 | Clarke County | 1080 | 8 | 0.5486 | 0.3983 | 0.4370 |
| 1301230 | Clayton County | 3060 | 35 | 0.5176 | 0.3849 | 0.4141 |
| 1301290 | Cobb County | 6706 | 64 | 0.6658 | 0.5903 | 0.6193 |
| 1301350 | Coffee County | 1701 | 8 | 0.2748 | 0.0911 | 0.1376 |
| 1301380 | Colquitt County | 1813 | 10 | 0.5581 | 0.2978 | 0.3780 |
| 1301410 | Columbia County | 1606 | 18 | 0.5500 | 0.4713 | 0.4810 |
| 1301500 | Coweta County | 2512 | 19 | 0.5507 | 0.3521 | 0.4057 |
| 1301590 | Dade County | 707 | 2 | 0.0908 | 0.0009 | 0.0640 |
| 1301620 | Dalton Public Schools | 688 | 6 | 0.7054 | 0.5535 | 0.5812 |
| 1301650 | Dawson County | 779 | 4 | 0.2156 | 0.1481 | 0.2393 |
| 1301740 | DeKalb County | 5916 | 66 | 0.5722 | 0.5101 | 0.5325 |
| 1301830 | Dougherty County | 2435 | 11 | 0.5133 | 0.4501 | 0.5090 |
| 1301860 | Douglas County | 1548 | 20 | 0.5213 | 0.3828 | 0.4197 |
| 1301980 | Effingham County | 1363 | 8 | 0.4301 | 0.3608 | 0.3666 |
| 1302130 | Fayette County | 1549 | 14 | 0.4889 | 0.2661 | 0.3033 |
| 1302190 | Floyd County | 1724 | 7 | 0.5490 | 0.3487 | 0.4308 |
| 1302220 | Forsyth County | 1574 | 21 | 0.4978 | 0.3092 | 0.3287 |
| 1302280 | Fulton County | 6278 | 59 | 0.5710 | 0.4951 | 0.5131 |
| 1302310 | Gainesville City | 744 | 5 | 0.3972 | 0.1802 | 0.1844 |
| 1302400 | Glynn County | 2495 | 10 | 0.5880 | 0.4942 | 0.5360 |
| 1302430 | Gordon County | 1204 | 6 | 0.5733 | 0.4379 | 0.4566 |
| 1302460 | Grady County | 1309 | 5 | 0.3614 | 0.2094 | 0.3217 |
| 1302520 | Griffin-Spalding County | 1515 | 11 | 0.5679 | 0.3170 | 0.3943 |
| 1302550 | Gwinnett County | 6536 | 80 | 0.6223 | 0.5661 | 0.6065 |
| 1302580 | Habersham County | 1477 | 8 | 0.4447 | 0.3249 | 0.3438 |
| 1302610 | Hall County | 3055 | 19 | 0.7070 | 0.5295 | 0.5884 |
| 1302700 | Harris County | 1019 | 4 | 0.3599 | 0.2834 | 0.3301 |
| 1302730 | Hart County | 1214 | 3 | 0.1880 | 0.0269 | 0.1190 |
| 1302790 | Heard County | 543 | 3 | 0.8718 | 0.8235 | 0.8750 |
| 1302820 | Henry County | 3153 | 27 | 0.5625 | 0.3612 | 0.3918 |
| 1302880 | Houston County | 3267 | 20 | 0.5296 | 0.4434 | 0.4610 |
| 1302940 | Jackson County | 1550 | 6 | 0.6178 | 0.4955 | 0.5397 |
| 1303150 | Jones County | 692 | 4 | 0.2930 | 0.1100 | 0.1795 |
| 1303300 | Liberty County | 1189 | 7 | 0.5862 | 0.4264 | 0.4521 |
| 1303390 | Lowndes County | 1779 | 7 | 0.2946 | 0.2035 | 0.2435 |
| 1303480 | Madison County | 1140 | 5 | 0.6253 | 0.4248 | 0.5183 |
| 1303510 | Marietta City | 972 | 7 | 0.5551 | 0.3705 | 0.4442 |
| 1303720 | Monroe County | 994 | 3 | 0.4079 | 0.1540 | 0.3526 |
| 1303840 | Murray County | 788 | 6 | 0.3981 | 0.2648 | 0.2779 |
| 1303870 | Muscogee County | 2963 | 30 | 0.5764 | 0.4743 | 0.4814 |
| 1303930 | Newton County | 1930 | 13 | 0.4510 | 0.3032 | 0.3112 |
| 1303960 | Oconee County | 750 | 5 | 0.3422 | 0.2051 | 0.2578 |
| 1304020 | Paulding County | 1508 | 19 | 0.5755 | 0.4587 | 0.4699 |
| 1304050 | Peach County | 851 | 3 | 0.4691 | 0.3225 | 0.3975 |
| 1304140 | Pierce County | 1103 | 3 | 0.3128 | 0.2162 | 0.2470 |
| 1304200 | Polk County | 1524 | 6 | 0.2722 | 0.1615 | 0.1958 |
| 1304380 | Richmond County | 3525 | 27 | 0.5363 | 0.4025 | 0.4384 |
| 1304410 | Rockdale County | 1231 | 11 | 0.3833 | 0.2606 | 0.2712 |
| 1304440 | Rome City | 807 | 5 | 0.2453 | 0.1823 | 0.1982 |
| 1304980 | Tift County | 1874 | 8 | 0.2417 | 0.1179 | 0.1545 |
| 1305310 | Valdosta City | 1131 | 5 | 0.6572 | 0.3995 | 0.4707 |
| 1305370 | Walker County | 1923 | 10 | 0.5199 | 0.4066 | 0.4950 |
| 1305390 | Walton County | 1666 | 9 | 0.3276 | 0.1397 | 0.2198 |
| 1305700 | Whitfield County | 1683 | 13 | 0.4438 | 0.3605 | 0.3834 |