Towards Detecting Inauthentic Coordination in Twitter Likes Data
Abstract.
Social media feeds typically favor posts according to user engagement. The most ubiquitous type of engagement (and the type we study) is likes. Users customarily take engagement metrics such as likes as a neutral proxy for quality and authority. This incentivizes like manipulation to influence public opinion through coordinated inauthentic behavior (CIB). CIB targeted at likes is largely unstudied as collecting suitable data about users’ liking behavior is non-trivial. This paper contributes a scripted algorithm to collect suitable liking data from Twitter and a collected 30 day dataset of liking data from the Danish political Twittersphere #dkpol, over which we analyze the script’s performance. Using only the binary matrix of users and the tweets they liked, we identify large clusters of perfectly correlated users, and discuss our findings in relation to CIB.
1. Introduction
Algorithmically curated social media feeds favor posts according to user engagement. The most ubiquitous type of engagement (and the type we study) is likes (Torres-Lugo_Likes_Manip_deletions, ). A post—a tweet, a shared news article, a video, a meme, etc.—may be highlighted e.g. by being placed highly on users’ news feeds. Users customarily take engagement metrics such as likes as a neutral proxy for quality and authority (Torres-Lugo_Likes_Manip_deletions, ; MCSpaper, ). This incentivizes influence operations to misrepresent, mislead or manipulate opinion dynamics online (nizzoli2021coordinated, ). Such media manipulation tactics have been labeled coordinated inauthentic behavior (CIB) (Pacheco2021Coordinated, ; Orabi2020, ; Goerzen2019, ; Ferrara2017, ; Ferrara:2016, ; Giglietto2020coordinated, ). Influence operations and CIB may thus shape public opinion and political discourse through attention hacking, the act of exploiting platforms’ content sorting algorithms to highlight certain information items to users. This highlights the societal need to address CIB-caused misrepresentation of political views and the spread of harmful low-quality content and misinformation in the online public sphere (MCSpaper, ).
To effectively push narratives on social media, influence operations resort to coordinated groups of accounts rather than individual accounts (Kirn2022, ; Khaund2022_Socialbotcoord, ). This has, for example, led to the establishment of a marketplace for vendor-purchased engagement (Torres-Lugo_Likes_Manip_deletions, ; ikram2017_fblikefarms, ) and metric inflation through coordinated social bots. The behavior dictated by an influence operation is labeled inauthentic as it may not reflect the personal beliefs of the instructed user accounts, as these accounts may be run by algorithmic amplifiers such as automated bots or humans according to a supplied protocol (duan2022botsIndiana, ).
CIB targeted at one-click reactions such as likes is largely unstudied as collecting data about users’ liking behavior around a specific political discourse is non-trivial due to the lack of access to platform data for researchers or severe API rate restrictions that prevent collecting comprehensive datasets. The first main contribution of this paper is a script to collect comprehensive data on liking users from Twitter. The second main contribution is a dataset collected with the script. The dataset contains a month-long survey of liking user behavior from the Danish political Twittersphere, collected through the hashtag #dkpol (“DenmarK POLitics”). Under this hashtag, citizens, organizations, politicians and journalists from across the political spectrum air, discuss and orientate themselves about current debates in Danish politics. It is the centralized, place-to-be source of information on the debates of the day. The hashtag thus seems a likely candidate for inauthentic coordination, if one seeks to increase the Danish public sphere’s attention on some topic. We use the dataset first to evaluate the effectiveness of the script, and second as basis for a case study of liking users behavior with the aim to determine if the simple liking data has sufficient structure to serve as an entry point for the detection of CIB. We argue that it does.
Using a running survey approach, the script retrieves IDs of the most recent liking users of tweets satisfy a specified text query (e.g. a keyword or hashtag of a chosen political debate), timing retrievals by taking into account Twitter set rate limits of the public v2 API for Academic Research Access. The script can retrieve far more comprehensive sets of liking user IDs than are available through the default public and commercial tools of the Twitter APIs and Decahose stream. To the best of our knowledge, the resulting data is the first to contain comprehensive collections of user-IDs of liking users. The dataset thus advances the specialized field of studying one-click reaction-based CIB.
The script’s point of departure for data collection is the survey of an online discourse around a domain (e.g. a hashtag) instead of a survey of a preselected group of users. Hence, data collection does not require any prior knowledge about potentially coordinated users nor does subsequent data analysis necessarily require the retrieval of additional account data. When identifying coordination of likes given such concise data, one immediately grasps firstly which specific tweet(s) a potential influence operation is targeted at, and secondly which users are involved in the metric inflation (this is in contrast to existing methods for collecting retweeting user IDs, cf. Sec. 1.1 below). If desired, additional account information may then be rehydrated via public APIs. The focus of the collected data and following applications is thus rather on identifying the effects of CIB inflating specific tweets. These effects may be more robust to changes in the evolution of algorithmic amplifiers, social bots and cyborgs, that with varying degrees of automation increasingly emulate authentic users. Our data and applications are not dependent on individual account features nor time-synchronous actions but only on the like behavior towards an observed tweet.
We analyse the dataset in a case study of #dkpol, mainly to illustrate that the liking behavior data has sufficient structure to serve as a point of entry for detection of CIB. Pre-processing the data points into a simple binary and sparse tweet/like matrix suffices to detect like-coordinated accounts without relying on textual, temporal, nor training data (see Sec. 3.2), a topic that has previously gone unstudied. We undertake two simple analyses: First, we group users by the toughest clustering criteria of complete equality of their like profiles. Under this very strict criteria, we identify several large perfectly correlated groups, including likes we purchased from online vendors. Notably, we detect the vendor-purchased CIB and more perfectly correlated groups of users despite the users not being particularly active (one like suffices), so without any requirement that they have liked aggressively. Second, we show that these groups can be visualized using the first two dimensions in a dimensionality-reduced space using the first two eigenvectors of a Singular Value Decomposition of the tweet/like matrix.
Given a lack of ground truth, we cannot be sure the perfectly coordinated clusters we detect (other than the vendor-purchased groups) are artifacts of CIB. We do believe that the natural correlation is unlikely enough that the groupings raise red flags, warranting further inspection, out of scope of this case study. Our methods may thus serve as pre-studies for bot detection and the application of fact checkers (Kirn2022, ).
We make our resources available to the research community, including the raw datapoints complemented with timestamp data (tweet text must be rehydrated per Twitter data sharing policies) and pre-processed user-like data matrices, the scripts used for data collection, for data pre-processing, for evaluation of the completeness of a collected dataset, and for clustering and visualization. Data and scripts are available on Harvard Dataverse (Dataverse, ) and the data collection script is additionally available at the public GitHub repository Get-Twitter-Likers-Data (JahnRendsvig22Git_likers, ).
1.1. Related Work
Social media users have a plethora of available action types (Magelinski2022, ), many of which may be used in coordinated fashions. E.g., users may coordinate using a specific hashtag, posting a specific URL, tweet, image or mention, or coordinate replies, shares or reactions to existing content. As coordination is not visible when inspecting accounts in isolation, research on CIB has turned to study the collective behavior of groups, with similarities between users serving as a proxy for coordination. Studies have analysed similarities between users posting similar content (Ahmed2013, ; AlKhateebAgrawal2016_coord, ; Pacheco2021Coordinated, ; Kirn2022, ), users having similar friends and followers (nizzoli2021coordinated, ), and having similarly timed activities (e.g., (Giglietto2020coordinated, ; Giglietto2020coordinated2, ; weber2021amplifyingcoord, ; Magelinski2022, ; Cresci2018, ; Cresci2016, ; giatsoglou2015nd, )). Few studies have looked directly at coordination in one-click reactions such as liking.
Liking is a one-click engagement where users may select one option from a short pre-defined list as their ‘reaction’ to a post, with users’ choices typically summed and presented as a quantified metric beneath the item. Reactions include perhaps most famously Facebook’s original ‘Like’, the hearts/likes on Instagram, TikTok and Twitter, and Reddit’s up- and downvotes. Sharing and retweeting may also be taken as a one-click reaction on any of these platforms.
Importantly, these reactions inform the platforms’ algorithmic content sorting, thus steering users’ attention. With attention metrics such as likes being widely used as a proxy for quality and authority, manipulating like counts becomes incentivized for the sake of increased exposure, influence, and financial gain (Torres-Lugo_Likes_Manip_deletions, ). High engagement counts may be perceived as a trust signal about the content (Metaxas2015, ) and as a positive crowd reaction aiding content to broadcast and to trend (dutta2018retweet, ). Once trending, high engagement counts in likes and shares make users more likely to engage with low-credibility content instead of fact-checking questionable posts (avram2020exposure, ). Scholars have stressed that to fight disinformation campaigns, it is less effective to look at the pushed content (e.g., hashtags, URLs, memes, etc.) and more effective to look at the coordinated content pushing behaviors (Kirn2022, ).
Related work on coordinated retweeting
To push stories online, retweeting and inflation of the retweet metric attracts manipulation. Several recent papers look at retweeting as a coordination dimension.
Dutta et al. (dutta2018retweet, ) investigate non-synchronized, collusive retweeters () involved with blackmarket services. Such collusive retweeters re-share the tweets of other blackmarket customers to earn credits. The authors use a human annotated dataset and supervised machine learning methods leveraging features such as, e.g., user activity or social network characteristics to distinguish between customers and genuine retweeters, later extended to detect paying customers (Dutta2020, ). Building on these works, Arora et al. (arora2020analyzing, ) analyze user representations to improve the performance of detecting blackmarket customers while Chetan et al. (chetan2019corerank, ) develop an unsupervised approach to detect collusive blackmarket retweeters leveraging, for example, the merit of tweets and timing of retweets analyzed through a bipartite tweet-user graph.
Schoch et al. (Schoch2022, ) study time-synchronous co-retweeting (and co-tweeting) as a trace of coordination to detect astroturfing campaigns given a dataset released by Twitter consisting of tweets by accounts that Twitter classified as being involved in hidden information campaigns. The authors filtered the data and only looked at campaigns with more than tweets and users that tweeted at least times in the observation period. They do so by analyzing timing and centralization of coordination. The approach rests on the assumption that it seems implausible that repeated co-retweeting and co-tweeting happens without centralized coordination (e.g., one actor controlling multiple accounts) in a small time window of minute up to 8 hours. Increasing the temporal window beyond that yields higher false positive rates in flagging astroturfing accounts. The study builds a co-(re)tweeting graph by drawing an edge between two users that (re)tweet the same post within a minute, but only if this can be observed more than 10 times. While the authors rightfully claim that co-retweeters and co-tweeters can be rehydrated from a Twitter dataset, it remains a necessity that one has selected a list of users prior to dataset construction. Some knowledge over the presence of astroturfers is hence necessary a priori: Their approach presupposes to have a list of (suspicious) users instead of embarking on detection given an observable effect.
Similarly concerned with co-retweeting, Graham et al. (Graham2020, ) searches for evidence of bots in million retweets of million tweets, collected over the course of 10 days, containing COVID-related hashtags. The authors create a user-user ‘bot-like’ co-retweet network of Twitter accounts that frequently co-retweeet the same tweets within a time window as small as second, followed by manual inspection of the connected components.
Pacheco et al. (Pacheco2021Coordinated, ) take a high number of overlapping retweets (co-retweeting) as a coordination trace and construct a bipartite network between retweeting accounts and retweeted messages, filtering for accounts that logged at least 10 retweets. The authors represent users with TD-IDF weighted vectors containing the retweeted IDs. The weighting discounts the contributions of popular tweets. The projected co-retweet graph is then established via the cosine similarity between the account vectors. Using a hard threshold, they only keep the most suspicious 0.5% edges leaving them with a coordinated set of users. The analysis is conducted on an anonymized dataset from DARPA SocialSim containing identified Russian disinformation campaigns, collected from Twitter using English and Arabic keywords. Messages that were identified as coordinated are no longer publicly available.
Interested in how well network communities hide from coordination detection, Weber et al. (weber2021amplifyingcoord, ) study retweets using a latent coordination network. When members of a group retweet each others’ posts, detection of the involved accounts becomes easy, as the accounts are connected via an edge. The larger the detected coordinated community, the greater the likelihood that members would retweet other members. Notably, the authors find that large groupings of accounts in the Twitter curated dataset, believed to be involved in influence operations, hide well with low internal retweet ratios, and that also official political accounts seem to refrain from being involved in self-retweeting.
Adopting the network approach (nizzoli2021coordinated, ; Pacheco2021Coordinated, ; weber2021amplifyingcoord, ), Tardelli et al. (TardelliNizzoliCresci_23_tempCoord, ) model evolving coordinated retweet communities. This work explores that users may belong to different coordinated groups at different points in time. Using the Jaccard similarity measure, the authors compare influx and outflux into and out of communities at each time step. The resulting temporal networks and dynamic community detection identifies many coordinated communities and highlights the relevance of temporal nuances of coordination.
Instead of leveraging graph-based techniques, Mazza et al. (mazza2019rtbust, ) only require the timestamps of retweets and the retweeted tweets for each account, and not, e.g. full user timelines. Their work investigates temporal and synchronous retweeting patterns. The collected data spans short of million Italian retweets from million distinct users collected over the course of two weeks. The collected data is filtered for human-like retweet activity between and times per day and excludes fully automated, benign retweet bots with high retweeting activity, resulting in a dataset with distinct users. Manual annotation of a subset of the data ( users) serves as a ground truth. Given a user and their retweet history, the authors first visualize different temporal retweet patterns by plotting the timestamp of the original tweet against the timestamp of the retweet in a scatterplot. With a granularity of seconds, the authors compress timestamp data into per user time series vectors containing time information if the user retweeted a given tweet at a given time, and 0 otherwise. The resulting series remains sparse as users usually only retweet once every few minutes. To reduce sparsity, the data is then compressed employing a sequence compression scheme. Using automatic unsupervised feature extraction, the work exploits that synchronous and coordinated users will be grouped densely together in the feature space, in contrast to heterogeneous human behavior. The authors apply dimensionality reduction techniques and deep neural networks and eventually hierarchical and density-based clustering. Users that are clustered and not treated as noise (i.e., not clustered) are labeled as bots. Users clustered together are then thought of as bots acting in a coordinated and synchronous fashion.
Related work on coordinated liking.
Despite likes being a commonly adopted and an easily manipulatable mechanism, research on CIB more narrowly targeted at likes is quite scarce:
Border-lining relevancy are studies on purchased likes not of posts, but of pages and followers on Facebook and Twitter (ikram2017_fblikefarms, ; Cristofaro2014_fblikes, ; beutel2013copycatch, ; aggarwal2015Twitterfakefol, ). Studying page like or follower farms (Cristofaro2014_fblikes, ; aggarwal2015Twitterfakefol, ), these works develop supervised classifiers using demographic, explicitly temporal, and social characteristics (ikram2017_fblikefarms, ; aggarwal2015Twitterfakefol, ). Notably, Ikram et al. (ikram2017_fblikefarms, ) find their bot classifier has difficulty detecting like farms that mimick regular like-spreading over longer timespans, i.e. deliver likes slowly, without high temporal synchronization, and with lower like counts per account.
Beutel et al. (beutel2013copycatch, ) study coordinated and time-synchronized attempts to inflate likes on Facebook pages. Their unsupervised method, developed with data from inside Facebook, detects ill-gotten likes from groups of users that coordinate to like the same page around the same time, leveraging temporal data explicitly. The authors follow a graph-based approach, draw a bipartite graph between users and pages noting down the time at which each edge was created. They then apply co-clustering looking for users liking the same pages at around the same time. Since (beutel2013copycatch, )’s approach depends on timing and is designed to detect synchronous likes in a “single burst of time”, (ikram2017_fblikefarms, ) find that (beutel2013copycatch, )’s approach, too, suffers large false positive errors in detecting liking accounts that mimick regular users and deliver likes more slowly.
While the Facebook like button is the same whether it regards a page or a post, page likes inflation differs in the mechanism from post like inflation. Liking a page on Facebook entails “following” the account, subscribing to new account posts. Thus, this kind of coordinated metric inflation may not catapult a single post to the top of an algorithmically curated newsfeed but creates the illusion of a popular account.
Directly about reactions to posts is Torres-Lugo et al.’s (Torres-Lugo_Likes_Manip_deletions, ) study of metric inflation through strategic deletions on Twitter. They analyze coordination in repetitive (un)liking on deleted tweets in influence operations that seek to bypass daily anti-flooding tweeting limits. From a collection point of view, looking at unlikes is a smart move, as this data is in fact available to purchase from Twitter. Alas, the approach is inapplicable to tweets that remain online, such as those central to CIB-based influence operations that push narratives through political astroturfing (Schoch2022, ).
Also in the related field of bot detection has the detection of bots designed to engage through reactions gone unstudied, perhaps due to data restrictions. For a systematic review of the bot detection literature, see (Orabi2020, ).
1.2. Empirical Problems
Group-based detection methods are promising “in the arms race against the novel social spambot” (cresci2017paradigm, ). Yet empirical research meets challenges in this domain. The following three problems highlight the need for a feasible data collection script and findable datasets for researchers to develop and test methods to address CIB targeted at reactions online.
Time-sensitivity.
First, empirical social media studies of coordinated online accounts remain problematic to replicate and reproduce due to time-sensitivity of the relevant data (Martini2021, ). Attempts to collect the same data twice are likely to fail, as traces of coordination may be altered or deleted after an influence operation was concluded. While e.g. Twitter grants generous academic research access to historic tweets through their API, accounts involved in CIB may evade detection e.g. by changing handle, so they are no longer retrievable in their original appearance (Torres-Lugo_Likes_Manip_deletions, ). The shortcomings in data reproducibility make CIB/bot detection frameworks difficult to compare, as these typically require live data access (Martini2021, ).
Data availability.
Second, data availability limits research (Martini2021, ; Disinfresearch-agenda-2020, ; misinfo_data, ; Giglietto2020coordinated, ). Large scale studies may simply be impossible due to data access restrictions (Martini2021, ; Disinfresearch-agenda-2020, ; misinfo_data, ). Specifically data concerning users’ reactions is very difficult for researchers to obtain: none of the currently existing datasets include it,111See e.g. Indiana University’s Bot Repository, a resourceful, centralized repository of annotated datasets of Twitter social bots (Botometer, ). Twitter’s transparency reports do not include information of liking or retweeting users (Twittertransp, ), and neither Meta, Twitter nor Reddit supply this data in necessary scope (Disinfresearch-agenda-2020, ; misinfo_data, ).
Among the platforms with APIs for academic purposes, only Twitter releases user-IDs of (public) profiles that have liked or retweeted a given tweet. Twitter does not give direct access to comprehensive lists of such IDs, but only releases the user-IDs of the 100 most recent liking/retweeting users of any single post. Further restrictive, at most 75 such lists may be requested per 15 minutes. For some Twitter environments, these restrictions may be balanced by using a suitably timed algorithm, cf. below. For huge political hashtags like #MakeAmericaGreatAgain or #Brexit where CIB-based influence operations may most be feared to be in play, current data restrictions make it practically impossible to obtain a complete picture of liking and retweeting behavior. Twitter’s commercial Decahose API stream lists 100% of liking user-IDs, but only of a random 10% sample of all tweets, making a targeted analysis of a specific political discourse impossible (Decahose, ).
Ground truth.
Third, there is an issue with lacking ground truth as researchers have no access to the empirical truth about accounts engaged in coordinated inauthentic behavior. Qualified guesses can be made based on suspicious similarities in behavior or profile features, but de facto, it remains unknown whether two users’ actions are authentically correlated or inauthentically coordinated, or how many (partially) automated accounts exist in a total population (Magelinski2022, ; Martini2021, ; beutel2013copycatch, ; Chavoshi2017_unsupervised, ).
Specifically for reaction-based CIB, it seems infeasible to create a labeled dataset that even approximates the ground truth: labeling accounts individually e.g. via crowd-sourcing or the well-established bot classifier Botometer will likely fail as single accounts will often seem inconspicuous (mazza2019rtbust, ). Botometer’s feature-based approach considers accounts one at a time and does therefore not pick up on group anomalies based on suspicious similarity (Yang2019, ; Yang2020, ). Especially when it comes to coordinated liking behavior, Botometer’s feature “favourites_count” (the number of likes a user has delivered) predicts less bot-like behavior, the higher the count is (Yang2020, ), thus undermining the attempt to identify coordinated liking. For purposes of studying liking behavior in concert at a collective level (Magelinski2022, ; Grimme2018CoordUnsupervOwnBots, ; Yang2019, ; Yang2020, ), data availability restrictions make collective labeling impossible.
Instead of relying on (an approximation of) a ground truth, groups of users may be labeled as suspicious, e.g. in terms of graph structure (Magelinski2022, ; beutel2013copycatch, ), contextually validated via manual inspection and individual confession by the original poster (Grimme2018CoordUnsupervOwnBots, ; mazza2019rtbust, ), through NLP of the content promoted (nizzoli2021coordinated, ; Chavoshi2017_unsupervised, ), or compared to behavior of experimental vendor-purchased metric inflation (ikram2017_fblikefarms, ; aggarwal2015Twitterfakefol, ), as we do in the case study in Sec. 3.
2. Data Collection
To collect a comprehensive dataset needed to identify coordinated inauthentic liking behavior, we scripted an algorithm that makes effective use of the data limits set by Twitter. Here, we aim to give an intuition of the implementation and workings of the data collection algorithm. We then present its pseudocode.
2.1. Data Collection Script: Intuition
In short, the script surveys Twitter for tweets falling under a textual query during a live observation period (e.g. days). During the observation period, with a fixed time interval (e.g. every 5 min.), the script executes a pull. Each pull loop contains four steps:
-
(1)
It logs tweets posted since the last pull that satisfy the query, and their current number of likes (like count).
-
(2)
It updates the logged like count of previously logged tweets. Only tweets that are recent enough are tracked in this way (e.g., posted within the last hours).
-
(3)
For each logged tweet, it compares the tweet’s new like count to its like count at the last pull where its liking users were requested ( if the liking users have never been requested). Call the numerical difference between these two like counts the tweet’s delta.
-
(4)
It requests the most recent liking users of the top tweets with the highest delta above a set threshold (e.g., has minimum new likes).
At the end of the observation period and once every logged tweet is no longer tracked, the liking users of all logged tweets is requested a final time (in timed batches). The script also allows pulling retweeting users in the pull loop. The logic is the same. Pulling liking and retweeting users draws on separate pools of request resources.
To raise the chance of a complete data set—one that has not missed any liking users—it is preferable to set the tweet track time as long as possible, the pull interval as short as possible, and the number of top tweets checked to its maximum. Alas, this will often lead to request request shortage.
Twitter’s request limits entail that the parameters of the script have to be balanced carefully. For example, a query with 10.000 new tweets a day, each tweet tracked for 24 hours at 5 minute intervals uses 8.640.000 tweet-requests over a 30 day period. Twitter allows 10.000.000. The same parameters but a query with 12.000 tweets/24h uses 10.3680.000 tweet-requests. Hence, the pull interval and the track time must balanced with respect to the query volume. Additionally, the pull interval and the number of requests used per pull must also be balanced with respect to the liking frequency and the activity under the query. Given the 75 likers-requests available per 15 minutes, there are two extremes (if one plays it safe; see further below): a short pull interval of seconds, each pull getting the likers the top tweet and a long pull interval of min., each pull getting the likers of the top tweets. The former lowers the risk of missing out on likers during rapid hours, but burns through many more tweet-requests per hour, counting against the 10.000.000 limit. Long pull intervals, on the other hand, raise the risk of missing put on liking users.
The script allows extending the Twitter request resources by the inclusion of multiple bearer tokens. If working in a team where multiple members have Academic Research access to Twitter, all their bearer tokens may be included. The script then cycles through them, using one per pull loop.
Finally, the pull loop is written in Python 3, and is run through a shell script that resumes it from the point of failure in case of Twitter connection errors, e.g. caused by an over-use of requests or a network disruptions. This means the script allows not playing safe with request resources, most notably with the pull interval and the number of likers-requests used per pull, . Playing it unsafe allows for some flexibility. One may e.g. set min. and if one trusts that the actual distribution of tweets and likes is unlikely to break the request limit but wants to readily sacrifice more than the safe amount of requests in case of an activity surge.
2.2. Script: Details and Pseudocode
The algorithm is parameterized by three time periods. First, is the length of data collection (e.g. 24 hours, or 1 month), without restriction: with properly set parameters, one can span 1 month, after which request limits reset, making it extendable. The starts at a point in time (). Second, defines a sleep period between the conclusion of one pull and the initiation of the next. The shorter it is, the finer the temporal resolution and the lower the risk of missing any liking users, but also the higher the request usage. Third, specifies how long a tweet is monitored for new likes and retweets after it is posted (e.g., each tweet is tracked for 1 hour, or hours). To collect full data for all tweets posted in , the total scraping time amounts to .
The algorithm is split into two steps, Alg. 1 and Alg. 2, with Alg. 1 undertaking most of the work, and collects data from Twitter using the Academic Research access API (ARA). ARA provides significant data scraping resources to researchers that are, however, subject to rate limits and request caps specified by Twitter in an advance to manage server requests. Among others, but most notably, requesting liking users from ARA always returns the most recent liking users of a given tweet in question. Furthermore, this request can only be made times per minutes. As tweets routinely get more that likes in total, a dataset that contains an as complete as possible set of identifiable liking users must live-log liking users runningly.
This is accomplished in Alg. 1, which runs from to . At , Alg. 2 runs. It completes a final harvest of liking users by requesting the 100 most recent liking users from all logged tweets. This is especially relevant for those tweets with low like counts de-prioritized in Alg. 1.
Between and , Alg. 1 performs a pull every seconds. A pull at time outputs a dataframe of tweet-IDs and their liking users. Further, it continuously outputs dataframes that contain tweets, like count, retweet count, and meta-data including time of origin, text, posting user, language etc. Alg. 1 and Alg. 2 require the input parameters in Table 1.
| Keyword(s) or hashtag(s). e.g. #dkpol. ARA Twitter Authentication Bearer Token, number of tokens. More than 1 is possible. More raise request limits. Date and time to start data collection. Must be in the past. E.g now, minus 10 seconds. Observation period. E.g., 1 hour, or 60 days. How long to track each tweet for new likes. E.g., 48 hours,. Longer periods use up rate limit more quickly. Sleep interval between pull completion and next pull. E.g. 300 seconds. Shorter interval use up rate limit more quickly. How many new likes must a tweet have gotten before we request its liking users? To play safe, satisfy . Determines from how many tweets to request likers per pull. To play safe, satisfy . Minimum like (retweet) count of tweets to be considered for final harvest. E.g. 1 or 10. Twitter rate limit: 75 requests per 15 min. for liking and retweeting users each. |
3. Case Study: Data Collection and Analysis of the Danish Twittersphere
To study both the performance of the contributed script and the usefulness of the resulting dataset to address CIB, we analyze a case study of the Danish political Twittersphere.
3.1. Dataset: Parameters, Completeness and Descriptive Statistics
The dataset used in this paper was collected using the described script, without manual intervention during its runtime. The text query was “#dkpol -is:retweet”, meaning that the script sought tweets falling under #dkpol, excluding retweets. Two bearer tokens were used, doubling the request resources available. The observation period started the afternoon of May 25th, 2022 and was 30 days long. Tweets were tracked for 48 hours, as prior tests had shown that liking activity on almost all tweets under #dkpol stops before 48 hours after posting. The interval between pulls was 5 minutes, and each pull requests the liking users of the top tweets with .
Following the observation period, we requested the last 100 most recent liking users of all tweets that had at least likes. We used this limit to strongly diminish the amount of tweets in the final check, with the justification that that so little total liking activity would most likely not be hurtful coordinated inauthentic behavior. In total, the script collected liking user IDs for tweets. While this case study focuses on liking behavior, the published dataset contains retweeting user IDs as well.
To assess completeness of the dataset, we compare the number of collected likers (for those tweets subject to final harvest collection) to the maximum like count a tweet has logged during the tracktime for each tweet, i.e. 48 hours, see Fig 1.
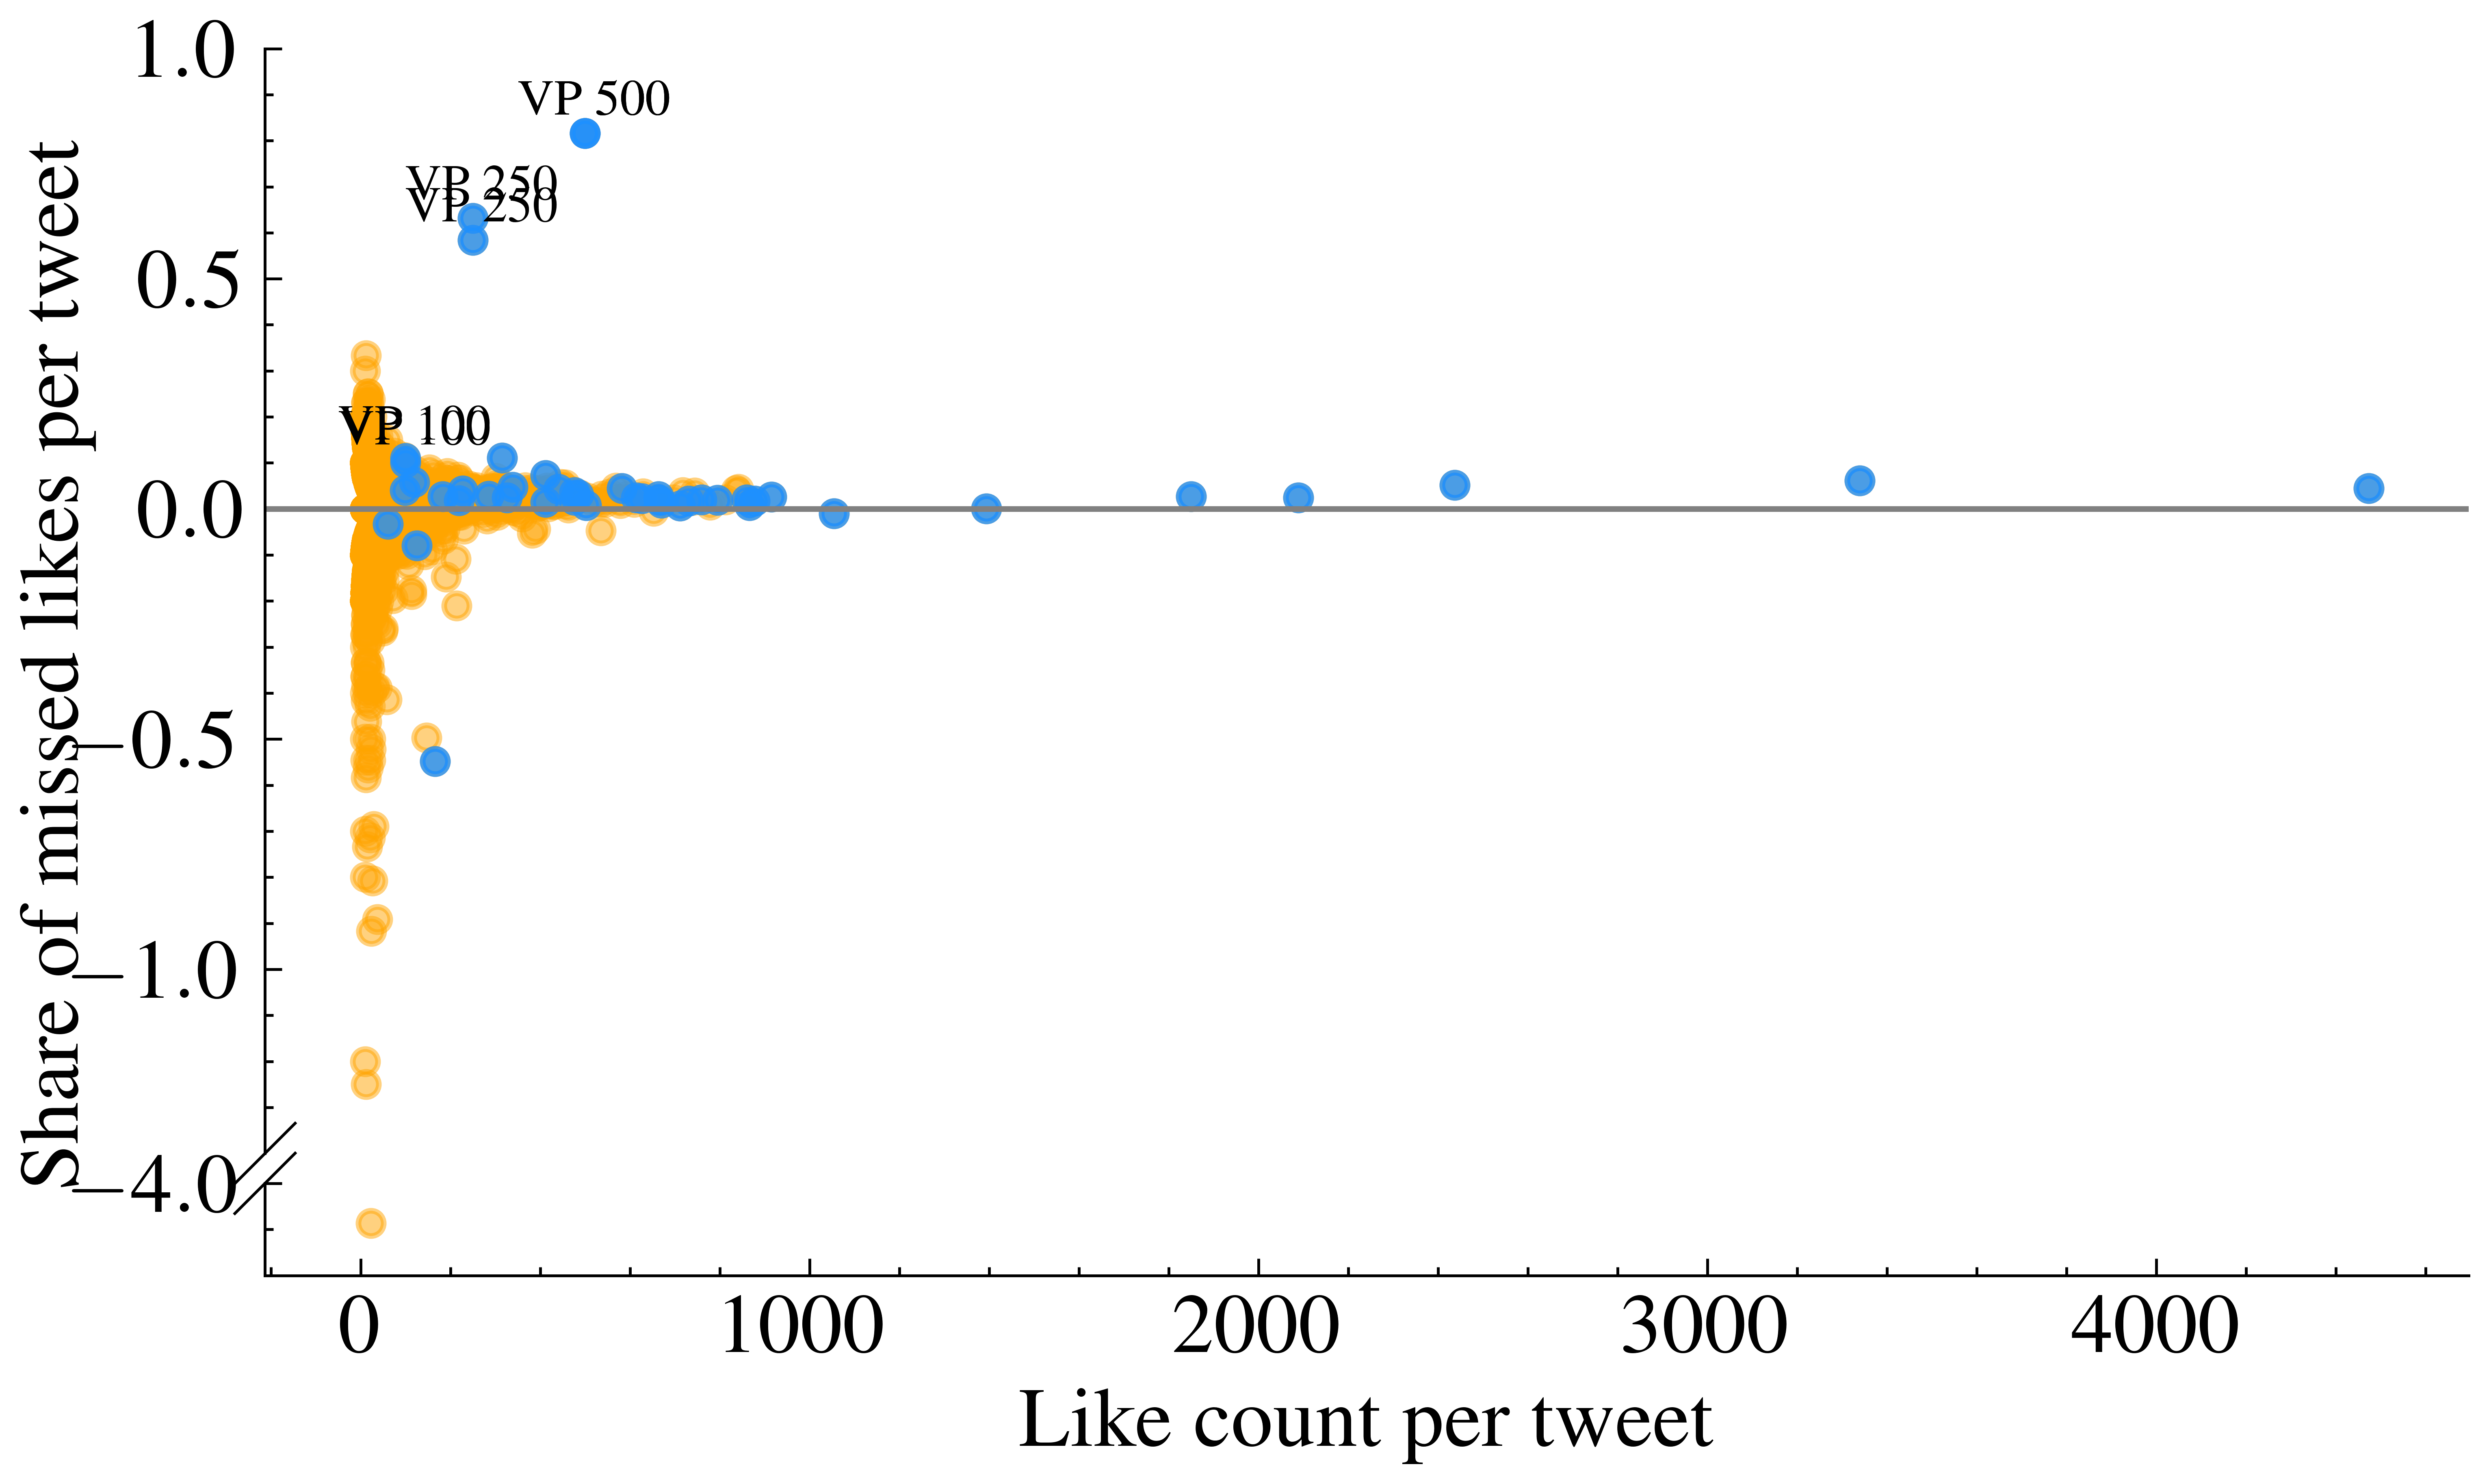
First, we see both positive and negative deviation numbers. Positive deviation is expected: the script cannot collect more than 100 liking users per tweet per pull interval. For testing, we used vendor-purchased likes on clearly-marked test-tweets. We highlight the targeted tweets in Fig 1. As we purchased some batches of more than likes and these were placed almost simultaneously (some vendors place likes more slowly), we miss out on collecting them. To detect CIB, this is not necessarily a problem: temporal detection methods leveraging time-synchronous user behavior to detect coordination can easily identify such behavior. Negative deviation indicates that the script has collected more liking users than the like count suggests. This happens when likes are retracted, the liking profiles are deleted,222These are both actions genuine users may take, but are also often observed with vendor-purchased metric inflation (Torres-Lugo_Likes_Manip_deletions, ). or a tweet attracted likes post tracktime, which we collected in the final harvest.
Second, we find that for high engagement tweets, the script performs well and collects most of the liking users. In contrast, for very low engagement tweets, the script is more prone to miss out on more than of users. This is due to the algorithm prioritizing tweets that get traction by allocating requests to collect the growing sets of likers.
Third, and to complement the plots in Fig. 1, for of tweets, the script collects exactly as many liking users as the like count suggests. For of the tweets, the script collects numbers of likers that fall within of the like count. If considering negative deviation only, in of tweets, the script deviates negatively or less. If considering positive deviation only, in of tweets, the script deviates positively or less. I.e., in of cases, the script seemingly collects of liking users.
3.2. Analysis: Perfect Correlation
In this case study, we make use of very simple user data: a binary matrix containing a row for each tweet and column for each user, each cell marked if the user liked the tweet, else . Again, the dataset contains temporal data as well, but we ignore it here, as we are mainly interested in seeking patterns in like behavior alone.
Assume we have observed tweets. Let , , be the set of users observed to have liked tweet , so is the set of all observed liking users. With , we then compress our data to a binary matrix with entry values in , each row representing a tweet, each column a user. With this matrix called , the entry if user has liked tweet , and else. Henceforth, we hence identify user with the row that contains their like profile. In this case study, is of dimension .
We seek to group users as exhibiting coordinated liking behavior if their like profiles are sufficiently similar, according to some measure. Existing work routinely projects bipartite data structures (which is) onto a user-user similarity graph using a distance or similarity metric (e.g., (Pacheco2021Coordinated, ; nizzoli2021coordinated, )) or develops algorithms to detect dense subgraphs to identify anomalous groups of nodes (e.g., (hooi2020telltail, ; shin2017densealert, )). Here, we apply the strictest measure: we group two users if, and only if, they exhibit exactly the same like behavior. This is equivalent to grouping users that have cosine similarity , Jaccard similarity , or Hamming distance .
We apply this strictest measure as behavior labeled as coordinated will also be labeled as coordinated using any less discriminating measure. The approach thus is precautious with regard to labeling coordinated users. The method is not designed to identifying all coordinated inauthentic behavior in likes. There may very well be nuances and less than perfectly correlated inauthentic behavior. To answer whether a collection of tweet likes exhibits first signs of CIB, we propose the method only as valid for positive answers: if this strongly discriminatory methods finds such signs, then methods with lower bars for coordination should, too. If the method does not find such signs, we would deem it fallacious to take this as evidence that no CIB occurred.
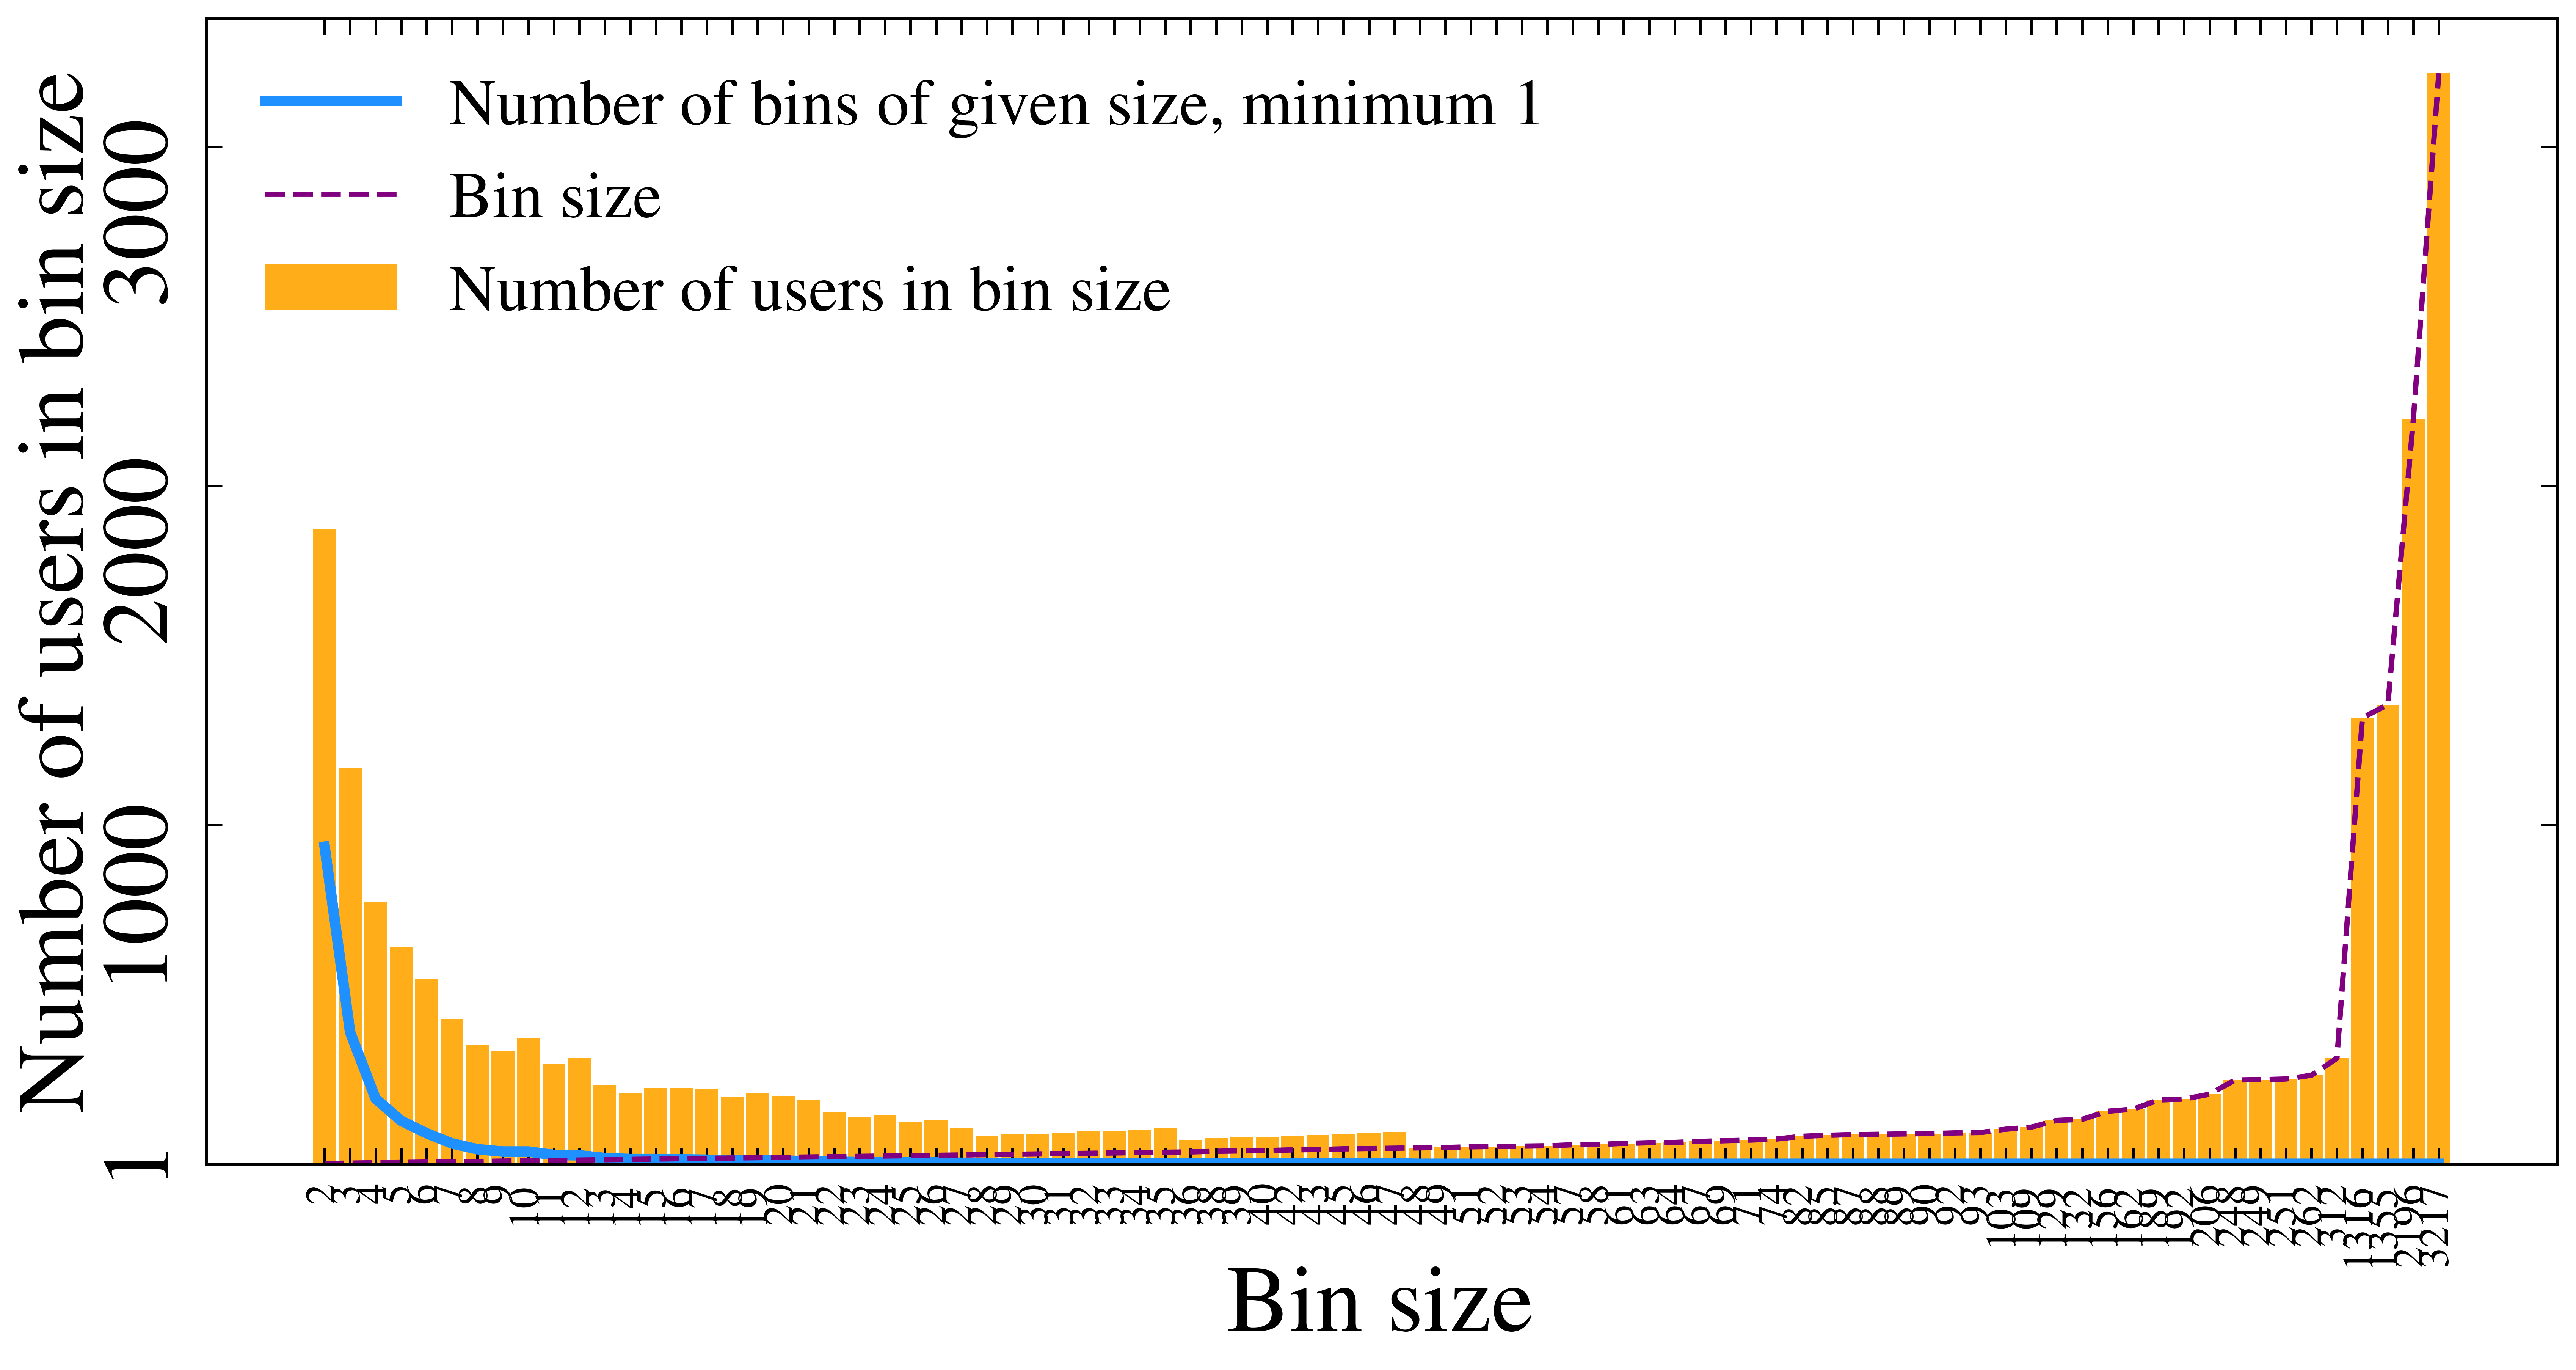
To group users with identical like profiles, we worst case have to pair-wise compare all users, i.e. undertake comparisons. To avoid as many of these comparisons as possible, we sort users into bins: we initiate a list with one bin containing the first user. For every later user, we compare them with one user from each bin in the list of bins, checking larger bins first, and stopping to place them in the first bin that provides a perfect match. If no such bin exists, we add a new bin for the user in the end of the list. We find only bins.
of users are sorted into bins of size 1. Filtering for bins of at least size 50 (as smaller bins are negligible in impact for CIB), we find bins with out of users. Put differently, of users are in a group with at least others that share the exact same like behavior across all tweets. These like most often only tweet, sometimes . In the largest bin, users are perfectly correlated liking the same tweet.
Collected in their own bins, we find the users behind the likes we purchased from online vendors. We refer to Fig. 2 for an overview of the magnitude of bins.
We find several bins of users with perfectly identical liking behaviors unrelated to our purchases. We cannot conclude from correlation to coordination to state these bins contain users engaged in coordinated inauthentic behavior. We do find the larger bins suspicious and in warrant of further analysis, cf. the discussion in Sec. 4.
We find the larger bins suspicious as we find it unlikely that the correlation has arisen without coordination. E.g., rate the probability of each bin as being non-coordinated using the following charitable assumptions (charitable to favor the odds of large bins): Assume that the probability that any two users share the exact same like profile without being coordinated is . For simplicity and charity, ignore that this probability attaches to every unordered pair of users in a bin, and let the probability that a bin of size occurred without coordination be , i.e., the probability that users pairwise and independently correlated with the same user from . This probability drops drastically with the growth of :
| 2 | 10 | 50 | 60 | 75 | 100 | 200 | |
|---|---|---|---|---|---|---|---|
| .95 | .63 | .08 | .05 | .02 | .006 |
These (fictitious) probabilities do not mean that it is unlikely that e.g. users liked the same tweet—but that it is unlikely that they all liked or did not like all the same tweets. Even under charitable conditions, bins larger than quickly seem highly unlikely. We further discuss the implications of our results in Sec. 4.
Singular Value Decomposition
To visualize and locate the identified bins among all users, we turn to plotting the data in a dimensionality-reduced space: With dimensionality reduction, user behavior often exhibits a clustered structure, for example, separating bots and humans in labeled bot datasets (Yang2020, ; Nwala2022BLOC, ), disclosing synchronous clusters of retweeters (giatsoglou2015nd, ) (later used in baseline experiments by (dutta2018retweet, ; chetan2019corerank, ; arora2020analyzing, )), revealing generally correlated groups such as polarized groups of users (wojcik2022birdwatch_twitter, ) among users writing Twitter Birdwatch notes, or coordinated clusters of agents as in (MCSpaper, ) given computer-simulated data.
We calculate the singular value decomposition (SVD) of the sample correlation matrix of the data in matrix . We consider the first dimensions’ eigenvectors, i.e., the first two columns of the orthogonal matrix where , weighted with the corresponding eigenvalue collected in the diagonal matrix (hastie_09_elements-of.statistical-learning, ). We plot the scatterplot of in Figure 3.
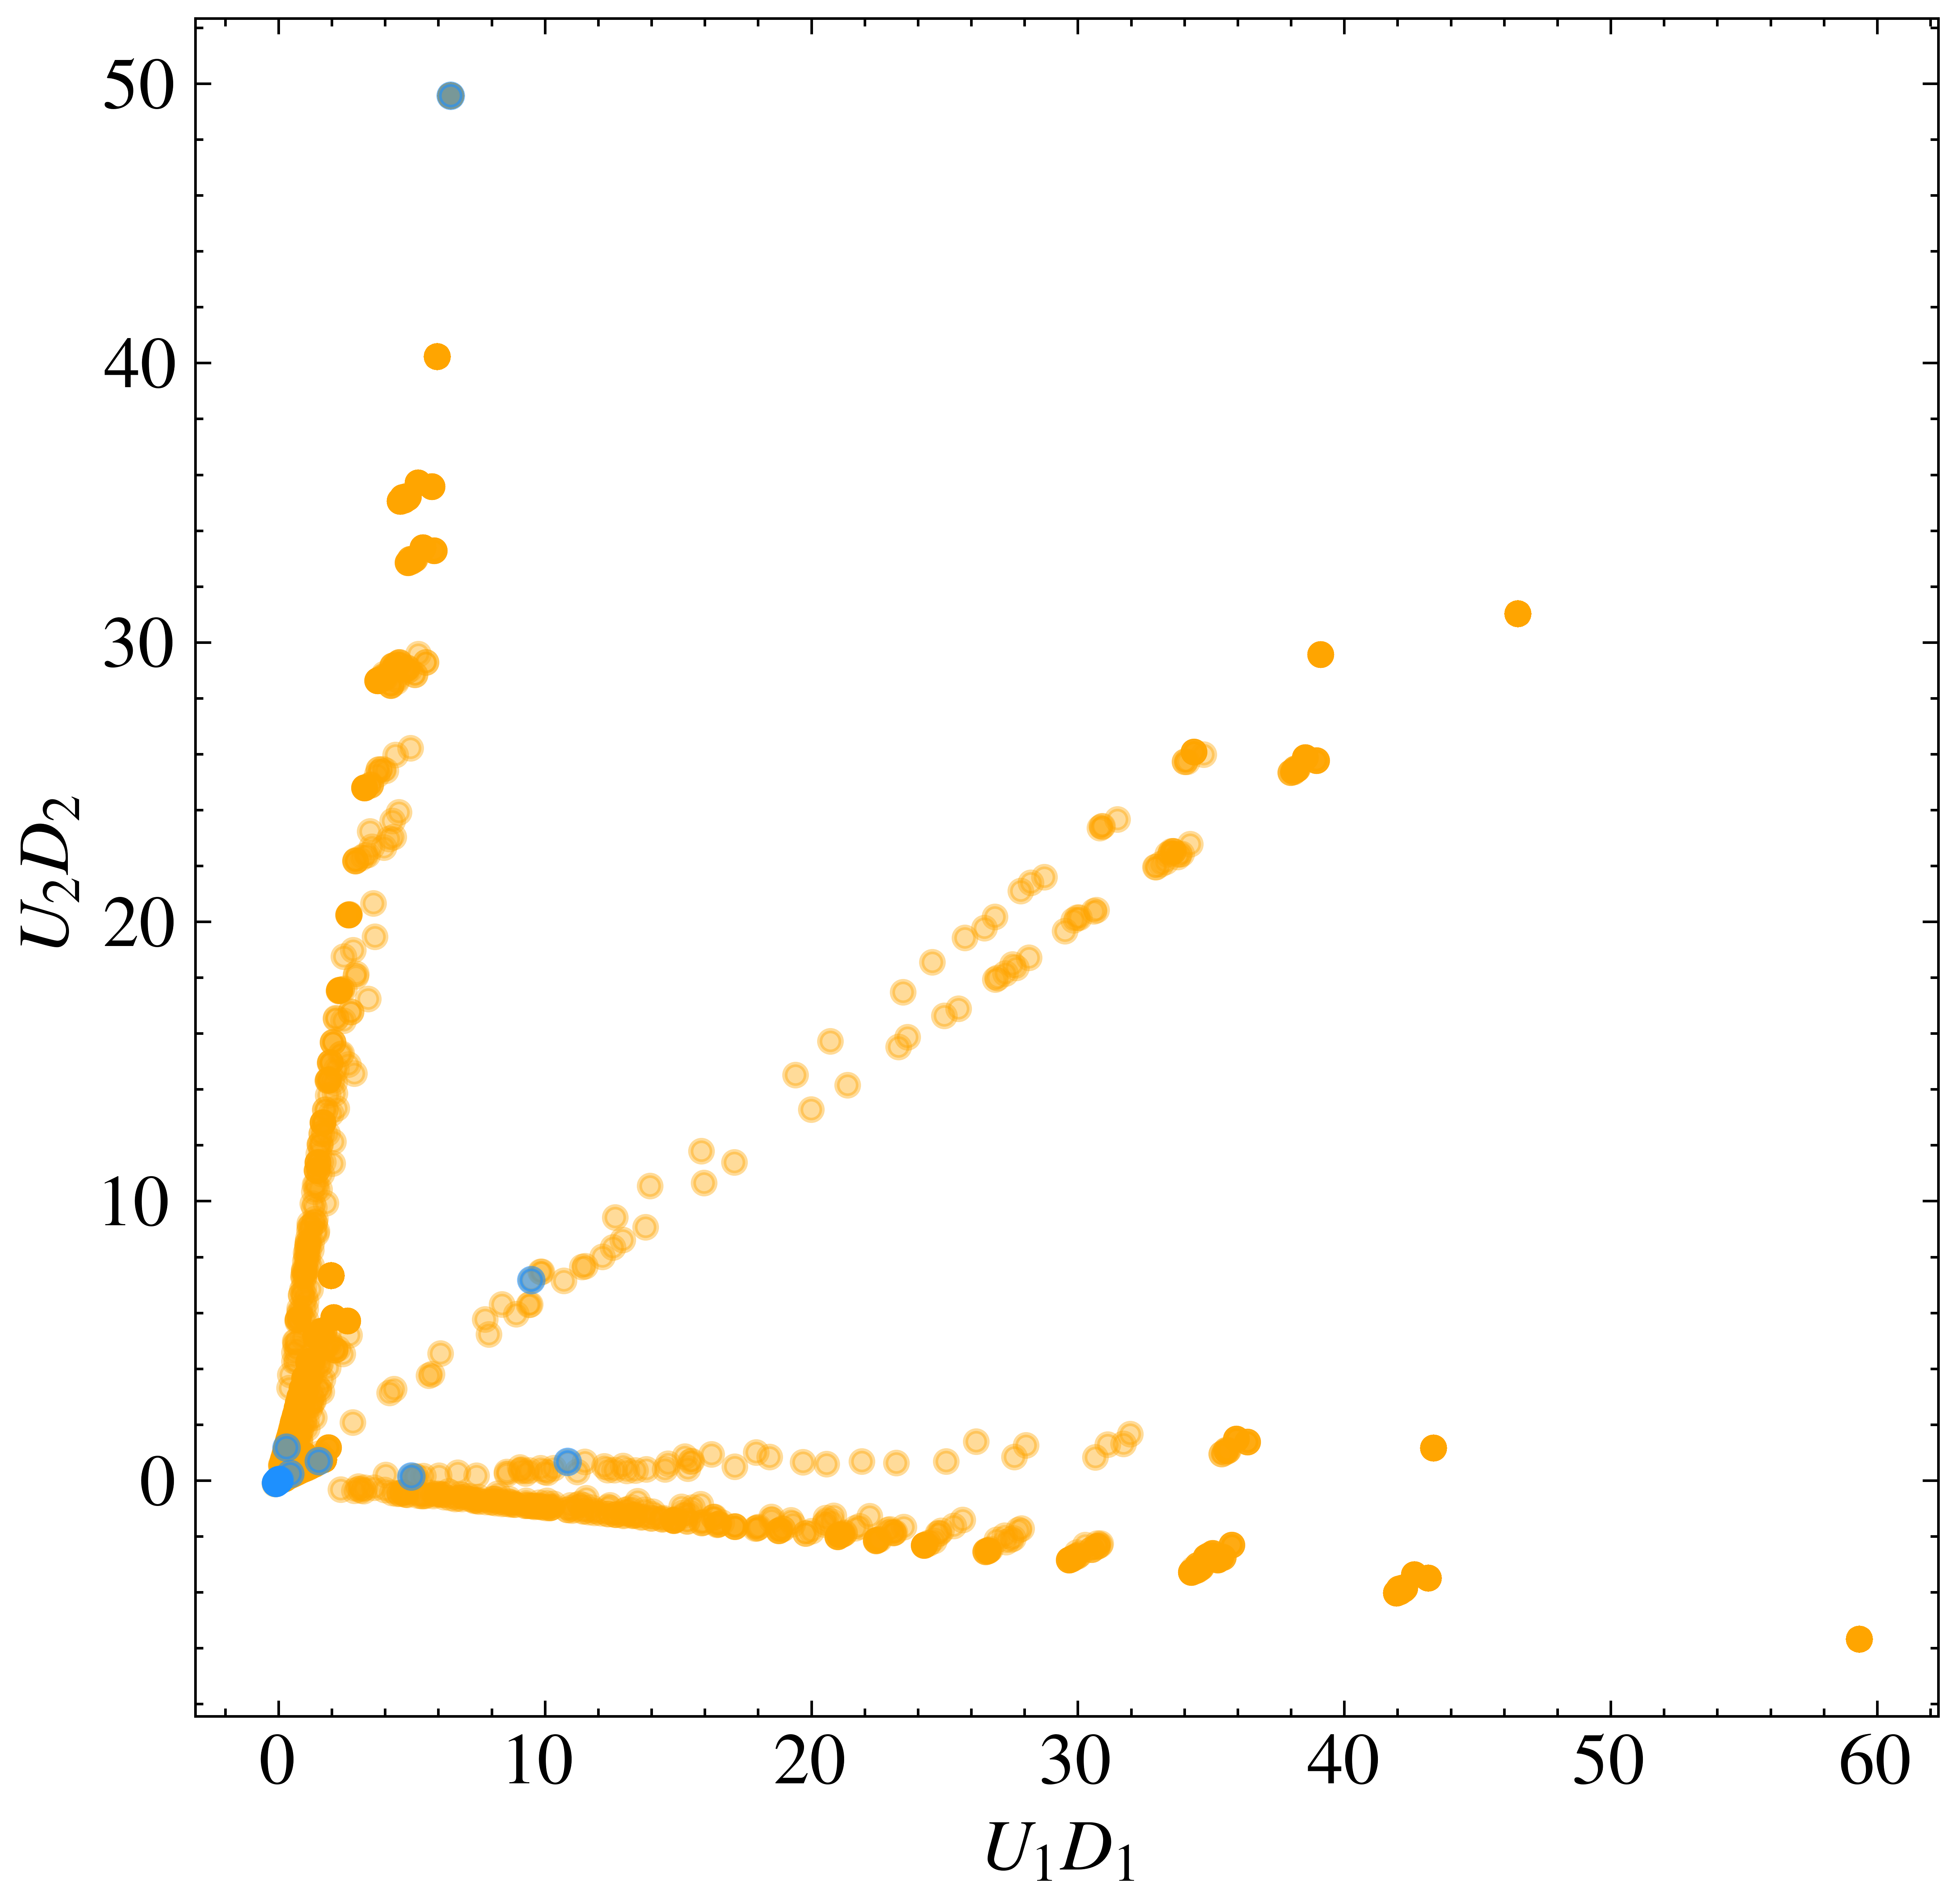
In the plot, each dot represents a liking user. While we color-coded the users placed in the largest 50 bins, they may also be discerned through their darker shade that stems from many dots perfectly overlapping one another. The SVD and the scatterplot thus picks up on correlation and the vendor-purchased metric inflation. As an alternative route, note that clustering on these first two eigenvectors (e.g. using a Gaussian Mixture Model as done in (MCSpaper, )) picks up on the inauthentically coordinated users we know of, too.
4. Concluding Remarks: Discussion & Ethical Considerations
Data collection discussion
The script we have presented here is designed to collect the IDs of liking (and/or retweeting) users of tweets that satisfy a selected textual query. As such, the script takes a domain first perspective on data collection, rather than a user first perspective as most other work designed to investigate coordinated inauthentic behavior.
The dataset presented in this paper is collected around the domain of the Danish political Twittersphere, found under #dkpol. For this domain, using the parameters described and two bearer tokens, the script had a reasonably low rate of missing liking users, and misses more than of liking users in only of cases when run continuously for 30 days. Such a targeted dataset cannot be obtained directly through any of Twitter’s data access options.
In an international context, #dkpol is a small domain. With the same parameters and number of bearer tokens, the script would indubitably fare less well on much larger domains. For larger domains with more intense liking activity, it would be interesting to study the script’s performance with more bearer tokens and far more aggressive pull parameters, such as much lower . As data retrieval from Twitter is not instantaneous (especially when it comes to updating the like count of a large batch of tweets), we suspect that a satisfactory data collection will involve multiple machines running the script in parallel, each tracking a subset of tweets assigned to them (e.g. using tweet ID modulo for machines).
Another, and favorable, option for obtaining the data on one-click reactions would be if Twitter or other social media platforms made this data available to the research community. We hope that the case study in this paper—where even a crude and strict analysis raises red flags for CIB—may be used as an argument that one-click reaction data is relevant in the study of coordinated inauthentic behavior and thus in the arms race against online misinformation to ultimately put pressure on the social media industry to release data.
Analysis discussion
In our case study, the controlled CIB through vendor-purchased likes is grouped into distinct bins that we can match to our tweets. The coordination here is achieved through weak ties in our bipartite graph structure . We complement, for example, Weber et al.’s (weber2021amplifyingcoord, ) approach focused on coordination through strong ties. As (weber2021amplifyingcoord, ) acknowledges as an open issue and we show, coordination may take place along weak ties. With our like-based approach, we provide first steps towards a measure to detect such. In contrast to existing work (e.g. (Schoch2022, )), the present like-based approach does not need to filter the data for strongly tied communities, highly influential users and superspreaders, or very active or users that, e.g. like a minimum number of times within a short period. Without filtering, we are able to group users with such behaviors together.
Our analysis made use of vendor-purchased likes. Purchasing engagement metric inflations violates Twitter’s platform manipulation and spam policy (TwitterPlatformManip, ), which defines “platform manipulation as using Twitter to engage in bulk, aggressive, or deceptive activity that misleads others and/or disrupts their experience.”. We created two Twitter accounts that in the name of the research center with which the authors are affiliated (‘CIBS1’ (@CIBS110) and ‘CIBS2’ (@CIBS22)) posted tweets with text ‘Research test tweet /6. Apologies for spamming #dkpol.’ for . We inflated the like count for these tweets. We acknowledge that the coordinated inflation of these tweets might have disrupted the experience of Twitter users. To the best of our assessment, the amplification of these tweets does not comprise harmful coordinated activity nor was it deceptive or commercially-motivated, but declared a research motivation. Ethically, we thus believe that the benefits of studying coordinated inauthentic behavior outweigh the minimal disruptions we have caused to Twitter users by violating Twitter’s manipulation and spam policy.
Unrelated to our purchases, we further find and visualize several large groups of users with perfectly correlated, identical liking behaviors—similarly achieved through weak ties. We have no ground truth about whether the suspected accounts beyond our test are naturally correlated and not inauthentically coordinated, yet we believe that natural correlation is unlikely enough that such groupings are red flags for CIB, and warrant further inspection, out of scope of this case study. Our methods may thus serve as pre-studies for bot detection and the application of fact checkers (Kirn2022, ). Further, the dataset and explorative case study may serve as a point of departure for future research to explore the correlation structures among liking users and the development of novel detection methods.
Censorship
Any flagging of behavior in public fora raises ethical concerns about censorship. The classification of reactions such as likes and retweets to tweets is no different. Generally, we find that the flagging of coordinated behavior used by inauthentic attention hackers is defendable, justified by the aim to combat misinformation online. We omit further discussion of this point. However, in applying automated techniques, there is always a risk of misclassification. If a technique is used for censorship, this may lead to unrightful labeling. The methods for initial exploration proposed here may then risk unjustified labeling users due to behavioral correlation with strongly coordinated groups of users. We strongly recommend that the methods here are taken as a first step towards fact-checking content and users and not as a final verdict about specific individual users.
Data collection approval
Approval of data collection and processing of personal data in the research project was granted by the faculty secretariat of the university of Copenhagen. The approval emphasizes that the processing of personal data in the project is in accordance with the rules of the European General Data Protection Regulation, Regulation 2016/679 on the protection of natural persons with regard to the processing of personal data. That the study would be undertaken was made public on the authors’ university websites.
Datasets and code availability
Dataset and code are made available for the research community (Dataverse, ), hosted on the archival repository Harvard Dataverse that provides a Document Object Identifier (DOI) for better findability. To comply with the Twitter terms, access to the data on Harvard Dataverse is granted when researchers actively agree to the Twitter Terms of Service, Privacy Policy and Developer Policy. The data collection code is also available on the public GitHub repository Get-Twtter-Likers-Data (JahnRendsvig22Git_likers, ).
References
- (1) Bot Repository. https://botometer.osome.iu.edu/bot-repository/datasets.html. Accessed: 2022-01-15.
- (2) Decahose API. https://developer.twitter.com/en/docs/twitter-api/enterprise/decahose-api/overview/streaming-likes. Accessed: 2022-09-10.
- (3) Platform manipulationa and spam policy. https://help.twitter.com/en/rules-and-policies/platform-manipulation. Accessed: 2022-03-01.
- (4) Twitter Moderation Research Consortium. https://transparency.twitter.com/en/reports/information-operations.html. Accessed: 2022-07-05.
- (5) A. Aggarwal and P. Kumaraguru. What they do in shadows: Twitter underground follower market. In 2015 13th Annual Conference on Privacy, Security and Trust (PST), pages 93–100. IEEE, 2015.
- (6) F. Ahmed and M. Abulaish. A generic statistical approach for spam detection in Online Social Networks. Computer Communications, 36(10-11):1120–1129, 2013.
- (7) S. Al-Khateeb and N. Agarwal. Understanding strategic information manoeuvres in network media to advance cyber operations: A case study analysing pro-russian separatists’cyber information operations in crimean water crisis. Journal on Baltic Security, 2(1), 2016.
- (8) U. Arora, H. S. Dutta, B. Joshi, A. Chetan, and T. Chakraborty. Analyzing and detecting collusive users involved in blackmarket retweeting activities. ACM Transactions on Intelligent Systems and Technology (TIST), 11(3):1–24, 2020.
- (9) M. Avram, N. Micallef, S. Patil, and F. Menczer. Exposure to social engagement metrics increases vulnerability to misinformation. The Harvard Kennedy School Misinformation Review, 1(5), July 2020.
- (10) A. Beutel, W. Xu, V. Guruswami, C. Palow, and C. Faloutsos. Copycatch: Stopping group attacks by spotting lockstep behavior in social networks. In Proceedings of the 22nd international conference on World Wide Web, pages 119–130, 2013.
- (11) N. Bliss, E. Bradley, J. Garland, F. Menczer, S. Ruston, K. Starbird, and C. Wiggins. An Agenda for Disinformation Research. Quadrennial paper, CRA Computing Community Consortium (CCC), 2020.
- (12) N. Chavoshi, H. Hamooni, and A. Mueen. DeBot: Twitter bot detection via warped correlation. Proceedings - IEEE International Conference on Data Mining, ICDM, pages 817–822, 2017.
- (13) A. Chetan, B. Joshi, H. S. Dutta, and T. Chakraborty. Corerank: Ranking to detect users involved in blackmarket-based collusive retweeting activities. In Proceedings of the Twelfth ACM International Conference on Web Search and Data Mining, pages 330–338, 2019.
- (14) S. Cresci, R. Di Pietro, M. Petrocchi, A. Spognardi, and M. Tesconi. The paradigm-shift of social spambots: Evidence, theories, and tools for the arms race. In Proceedings of the 26th international conference on world wide web companion, pages 963–972, 2017.
- (15) S. Cresci, R. D. Pietro, M. Petrocchi, A. Spognardi, and M. Tesconi. Dna-inspired online behavioral modeling and its application to spambot detection. IEEE Intelligent Systems, 31:58–64, 9 2016.
- (16) S. Cresci, R. D. Pietro, M. Petrocchi, A. Spognardi, and M. Tesconi. Social fingerprinting: Detection of spambot groups through dna-inspired behavioral modeling. IEEE Transactions on Dependable and Secure Computing, 15:561–576, 7 2018.
- (17) E. De Cristofaro, A. Friedman, G. Jourjon, M. A. Kaafar, and M. Z. Shafiq. Paying for likes? Understanding Facebook Like Fraud Using Honeypots. In Proceedings of the 2014 Conference on Internet Measurement Conference, pages 129–136, 2014.
- (18) Z. Duan, J. Li, J. Lukito, K.-C. Yang, F. Chen, D. V. Shah, and S. Yang. Algorithmic agents in the hybrid media system: Social bots, selective amplification, and partisan news about covid-19. Human Communication Research, 2022.
- (19) H. S. Dutta and T. Chakraborty. Blackmarket-driven collusion among retweeters-analysis, detection, and characterization. IEEE Transactions on Information Forensics and Security, 15:1935–1944, 2020.
- (20) H. S. Dutta, A. Chetan, B. Joshi, and T. Chakraborty. Retweet us, we will retweet you: Spotting collusive retweeters involved in blackmarket services. In 2018 IEEE/ACM International Conference on Advances in Social Networks Analysis and Mining (ASONAM), pages 242–249. IEEE, 2018.
- (21) E. Ferrara. Disinformation and social bot operations in the run up to the 2017 French presidential election. First Monday, 22(8), 2017.
- (22) E. Ferrara, O. Varol, C. Davis, F. Menczer, and A. Flammini. The Rise of Social Bots. Commun. ACM, 59(7):96–104, 2016.
- (23) M. Giatsoglou, D. Chatzakou, N. Shah, A. Beutel, C. Faloutsos, and A. Vakali. Nd-sync: Detecting synchronized fraud activities. In Advances in Knowledge Discovery and Data Mining: 19th Pacific-Asia Conference, PAKDD 2015, Ho Chi Minh City, Vietnam, May 19-22, 2015, Proceedings, Part II 19, pages 201–214. Springer, 2015.
- (24) F. Giglietto, N. Righetti, L. Rossi, and G. Marino. Coordinated Link Sharing Behavior as a Signal to Surface Sources of Problematic Information on Facebook. ACM International Conference Proceeding Series, pages 85–91, 2020.
- (25) F. Giglietto, N. Righetti, L. Rossi, and G. Marino. It takes a village to manipulate the media: coordinated link sharing behavior during 2018 and 2019 Italian elections. Information Communication and Society, 23(6):867–891, 2020.
- (26) T. Graham, A. Bruns, G. Zhu, and R. Campbell. Like a virus, 2020.
- (27) C. Grimme, D. Assenmacher, and L. Adam. Changing Perspectives: Is It Sufficient to Detect Social Bots? In G. Meiselwitz, editor, Social Computing and Social Media. User Experience and Behavior, pages 445–461, Cham, 2018. Springer International Publishing.
- (28) T. Hastie, R. Tibshirani, and J. Friedman. The Elements of Statistical Learning: Data Mining, Inference and Prediction. Springer, 2nd edition, 2009.
- (29) B. Hooi, K. Shin, H. Lamba, and C. Faloutsos. Telltail: Fast scoring and detection of dense subgraphs. In Proceedings of the AAAI Conference on Artificial Intelligence, volume 34, pages 4150–4157, 2020.
- (30) M. Ikram, L. Onwuzurike, S. Farooqi, E. D. Cristofaro, A. Friedman, G. Jourjon, M. A. Kaafar, and M. Z. Shafiq. Measuring, characterizing, and detecting Facebook like farms. ACM Transactions on Privacy and Security (TOPS), 20(4):1–28, 2017.
- (31) L. Jahn and R. K. Rendsvig. Get-twitter-likers-data. https://github.com/humanplayer2/get-twitter-likers-data/, 2022.
- (32) L. Jahn and R. K. Rendsvig. Twitter User Reactions Data (Liking and Retweeting Users). https://dataverse.harvard.edu/dataverse/twitter-likers, 2023. https://doi.org/10.7910/DVN/WRUNZD.
- (33) L. Jahn, R. K. Rendsvig, and J. Stærk-Østergaard. Detecting Coordinated Inauthentic Behavior in Likes on Social Media: Proof of Concept. Under Review, 2022.
- (34) T. Khaund, B. Kirdemir, N. Agarwal, H. Liu, and F. Morstatter. Social Bots and Their Coordination During Online Campaigns: A Survey. IEEE Transactions on Computational Social Systems, 9(2):530–545, 2022.
- (35) S. L. Kirn and M. K. Hinders. Ridge count thresholding to uncover coordinated networks during onset of the covid-19 pandemic. Social Network Analysis and Mining, 12, 12 2022.
- (36) T. Magelinski, L. Ng, and K. Carley. Synchronized Action Framework for Detection of Coordination on Social Media. Journal of Online Trust and Safety, 1, 2 2022.
- (37) F. Martini, P. Samula, T. R. Keller, and U. Klinger. Bot, or not? Comparing three methods for detecting social bots in five political discourses. Big Data and Society, 8, 2021.
- (38) J. Matthews and M. Goerzen. Black hat trolling, white hat trolling, and hacking the attention landscape. The Web Conference 2019 – Companion of the World Wide Web Conference, WWW 2019, 2:523–528, 2019.
- (39) M. Mazza, S. Cresci, M. Avvenuti, W. Quattrociocchi, and M. Tesconi. Rtbust: Exploiting Temporal Patterns for Botnet Detection on Twitter. In Proceedings of the 10th ACM conference on web science, pages 183–192, 2019.
- (40) P. T. Metaxas, E. Mustafaraj, K. Wong, L. Zeng, M. O’Keefe, and S. Finn. What Do Retweets Indicate? Results from User Survey and Meta-Review of Research. Proceedings of the 9th International Conference on Web and Social Media, ICWSM 2015, pages 658–661, 2015.
- (41) L. Nizzoli, S. Tardelli, M. Avvenuti, S. Cresci, and M. Tesconi. Coordinated Behavior on Social Media in 2019 UK General Election. In Proc. International AAAI Conference on Web and Social Media (ICWSM), volume 15, pages 443–454, 2021.
- (42) A. C. Nwala, A. Flammini, and F. Menczer. A general language for modeling social media account behavior. Preprint, 2022.
- (43) M. Orabi, D. Mouheb, Z. Al Aghbari, and I. Kamel. Detection of Bots in Social Media: A Systematic Review. Information Processing and Management, 57, 2020.
- (44) D. Pacheco, P.-M. Hui, C. Torres-Lugo, B. T. Truong, A. Flammini, and F. Menczer. Uncovering Coordinated Networks on Social Media: Methods and Case Studies. In Proc. International AAAI Conference on Web and Social Media (ICWSM), volume 15, pages 455–466, 2021.
- (45) I. V. Pasquetto, B. Swire-Thompson, et al. Tackling misinformation: What researchers could do with social media data. HKS Misinformation Review, 1(8), 2020.
- (46) D. Schoch, F. B. Keller, S. Stier, and J. H. Yang. Coordination patterns reveal online political astroturfing across the world. Scientific Reports, 12, 12 2022.
- (47) K. Shin, B. Hooi, J. Kim, and C. Faloutsos. Densealert: Incremental dense-subtensor detection in tensor streams. In Proceedings of the 23rd ACM SIGKDD International Conference on Knowledge Discovery and Data Mining, pages 1057–1066, 2017.
- (48) Tardelli, Serena and Nizzoli, Leonardo and Tesconi, Maurizio and Conti, Mauro and Nakov, Preslav and Martino, Giovanni Da San and Cresci, Stefano. Temporal dynamics of coordinated online behavior: Stability, archetypes, and influence. 2023.
- (49) C. Torres-Lugo, M. Pote, A. Nwala, and F. Menczer. Manipulating Twitter Through Deletions. In Proceedings of the 16th International AAAI Conference on Web and Social Media (ICWSM), 2022.
- (50) D. Weber and F. Neumann. Amplifying influence through coordinated behaviour in social networks. Social Network Analysis and Mining, 11(1):1–42, 2021.
- (51) S. Wojcik, S. Hilgard, N. Judd, D. Mocanu, S. Ragain, M. Hunzaker, K. Coleman, and J. Baxter. Birdwatch: Crowd wisdom and bridging algorithms can inform understanding and reduce the spread of misinformation. 2022.
- (52) K. C. Yang, O. Varol, C. A. Davis, E. Ferrara, A. Flammini, and F. Menczer. Arming the public with artificial intelligence to counter social bots. Human Behavior and Emerging Technologies, 1:48–61, 1 2019.
- (53) K.-C. Yang, O. Varol, P.-M. Hui, and F. Menczer. Scalable and generalizable social bot detection through data selection. In Proceedings of the AAAI conference on artificial intelligence, volume 34, pages 1096–1103, 2020.