longtable
Making Differential Privacy Work for Census Data Users
Abstract
The U.S. Census Bureau collects and publishes detailed demographic data about Americans which are heavily used by researchers and policymakers. The Bureau has recently adopted the framework of differential privacy in an effort to improve confidentiality of individual census responses. A key output of this privacy protection system is the Noisy Measurement File (NMF), which is produced by adding random noise to tabulated statistics. The NMF is critical to understanding any errors introduced in the data, and performing valid statistical inference on published census data. Unfortunately, the current release format of the NMF is difficult to access and work with. We describe the process we use to transform the NMF into a usable format, and provide recommendations to the Bureau for how to release future versions of the NMF. These changes are essential for ensuring transparency of privacy measures and reproducibility of scientific research built on census data.
Keywords census data • differential privacy • open science
1 Introduction
For the 2020 decennial census, the Census Bureau adopted a new Disclosure Avoidance System (DAS) based on differential privacy. The DAS was designed to protect the confidentiality of responses by injecting statistical noise into the tabulations of a confidential individual census dataset. The Bureau post-processed the resulting Noisy Measurement File (NMF) to produce the final tabulated statistics. Post-processing ensured that the final tabular statistics meet various requirements, including non-negative counts, invariant state populations, and consistency across different geographical levels of census hierarchy.
However, as some of the Bureau’s staff themselves warned, post-processing also introduces biases in the tabulated statistics [National Academies of Sciences and Medicine, (2020); see e.g., page 42].222See also the transcript of a Bureau webinar: https://www2.census.gov/about/training-workshops/2021/2021-05-13-das-transcript.pdf. Some of these biases, like inflating the average population of some zero-population areas, were expected, others were discovered by concerned data users and in cases required changes to the DAS (Dwork et al.,, 2021; Kenny et al.,, 2021; National Congress of American Indians,, 2021; JASON,, 2022; Kenny et al., 2023a, ; Scariano and Youngs,, 2022).
The NMF, which is an intermediate product of the DAS, is an invaluable resource for researchers and other Census data users to understand the error introduced by the DAS. The NMF is also essential for performing statistically valid analyses of Census data that properly account for DAS-introduced error (Kenny et al., 2023b, ).
In 2021, however, the Bureau did not make the NMF available and only released the final (post-processed) tabulated statistics. Through an open letter (Dwork et al.,, 2021), a Freedom of Information Act request, and subsequent litigation (Phillips v. Census Bureau,, 2022), dozens of scholars and data users urged the Bureau to release the NMF, which allows one to understand and correct potential biases induced by the post-processing procedure. Following these developments, in April 2023, the Bureau released a demonstration NMF based on the 2010 Census data, and subsequently in June made available the NMF for the 2020 P.L.94-171 redistricting data.333Prior to these developments, a member of the DAS team mentioned the possibility of releasing the NMF (National Academies of Sciences and Medicine,, 2020, see e.g., Section 11.2). Furthermore, in May 2023, the Bureau also published the 2020 Demographic and Housing Characteristics File (DHC) and plans to publish its NMF later this year.
We commend the Bureau’s decision to provide the NMF, which will help advance social science research, improve policy decisions, and further strengthen the DAS itself. To maximize the benefits of the released NMF, however, we believe that the Bureau must substantially improve the way in which the NMF is formatted and released (McCartan et al.,, 2023). Below, we first explain several obstacles many end users are likely to face when accessing, processing, and using the released NMF for statistical analyses. We then provide recommendations for how the Census Bureau could release the NMF going forward in a manner and format that would address these issues.
2 The Census Noisy Measurement File
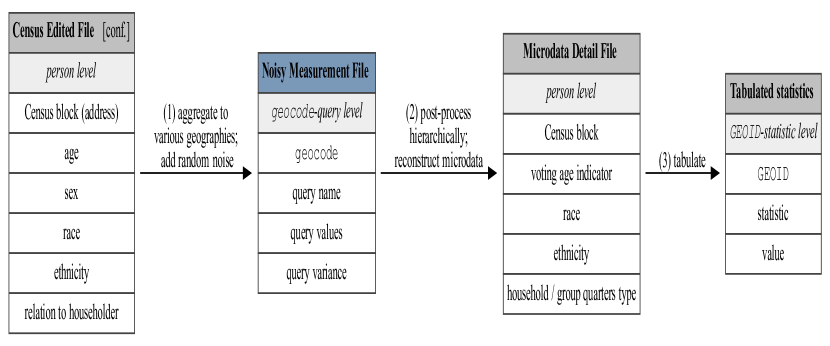
After collecting census questionnaires from the U.S. population, the Census Bureau fills in missing responses using other data sources and imputation methods. The resulting confidential dataset is called the Census Edited File (CEF), which has a row for every person in the U.S. To convert the CEF into statistics that can be reported publicly, the DAS proceeds in two steps, as illustrated in Figure 1. The process described in this section is a simplification of the full workings of the DAS; further details may be found in Abowd et al., (2022).
First, a series of queries are made for every geographic unit on the NMF geographic spine: states, counties, tracts, optimized block groups, and blocks.444The geographic spine is used for the DHC file is different from the one used for the P.L.94-171 redistricting data. Notably, the geographic spine is split between regions inside and outside of American Indian / Alaska Native (ai/an) areas . This means that, for example, a county containing a Native reservation is split into two geographic units: the ai/an area and the remainder of the county. Each of these has queries made separately. These queries are contingency tables for various statistics. One example is the “total population” query which counts the total number of people in the geographic unit. Another is the “voting age by Hispanic” query which reports a 2-by-2 table of counts of people in those binary categories.
For the decennial census redistricting data, there are 11 total queries for each geography, including a “detailed” query which is the full contingency table of voting age, Hispanic status, race, and household type, with 2,016 values. The counts that make up each of these queries have a certain amount of discrete Gaussian noise added by the DAS (Canonne et al.,, 2020), in accordance with a privacy loss schedule set by the Bureau, which is recorded in the variance column of the NMF. It is this step that ensures the released statistics meet a certain standard of differential privacy (Bun and Steinke,, 2016; Kifer et al.,, 2022).
Second, the set of noised queries across all geographic units and levels is post-processed using a multi-pass optimization routine. The goal of this post-processing step is to produce a set of counts that is self-consistent across geographic units and different statistics, and respects commonsense constraints like having nonnegative population counts. From these consistent counts, synthetic person-level data can be reconstructed, yielding the Microdata Detail File. Unlike the CEF, the exact format of the Microdata Detail File depends on the particular census product. It is then straightforward to tabulate this microdata to produce traditional census statistics for each geography in the country.
3 Processing the Noisy Measurement File
We identified four key obstacles that make it difficult to directly use the 2020 NMF released in June 2023 (Abowd et al., 2023b, ):
-
1.
Collecting the documentation necessary to open and parse the NMF;
-
2.
Converting the NMF data files to a familiar format amenable to computer and statistical analysis;
-
3.
Navigating the many-to-many mapping between NMF queries and tabulated statistics; and
-
4.
Connecting the geocodes used in the NMF to traditional census tabulation geographies.
This section describes these obstacles and our process for overcoming them.
The NMF was accompanied by sparse documentation which was not alone sufficient to reconstruct the format and coding of the data. The Bureau has made the code that implements the DAS publicly available, but this code as well is sparsely documented and highly unlikely to be accessible to non-experts. Particularly troubling is that the codebook for the variables (Male=0, Female=1, etc.) exists only as a set of undocumented Python files in a folder in this code repository. This problem is compounded for statistics that involve cross-tabulations of base variables. For example, a “sex by Hispanic” table could be reported in the order of (Non-hispanic male, Non-hispanic female, Hispanic male, Hispanic female), or it could be reported in the order of (Non-Hispanic male, Hispanic male, Non-Hispanic female, Hispanic female). There is no clear documentation as to which of these orders variables are combined in, and the actual order depends on the way the NumPy array library for Python works. Despite these challenges, by manually copying the codebook from the Python code and running numerous experiments on the NMF data, we were able to reconstruct the structure and variable coding of the NMF ourselves.555The code is available at https://github.com/uscensusbureau/DAS_2020_Redistricting_Production_Code

The NMF is made available as a series of large Apache Parquet files, a flexible archival storage format that underpins much of modern big data infrastructure. This flexibility allows the Bureau to store the NMF in a non-rectangular format: each row of the NMF contains normal records like the query name and variance, but also a variable-length vector containing the query results (collapsed from a multidimensional contingency table). This nested data structure unfortunately cannot be directly analyzed using standard tools designed for rectangular data.
As described in Section 2, at this stage each row in the NMF corresponds to a single query run for a particular geographic unit (see the top panel of Figure 2(a)). Each query’s result can be aggregated to produce an estimate of various traditional census statistics. For example, the “voting age by Hispanic” query result for some geography is stored in a single row of the NMF as the following vector with 4 elements:
This vector, which represents a table, can be summed along each dimension to produce (noisy) estimates of the voting age population or the Hispanic population, or all its entries can be summed to estimate the total population of the geographic unit.
Thus, each traditional tabulated statistic, like total or voting-age population, has multiple noisy “versions” spread across multiple queries. For example, the Hispanic population can be estimated not just by the “Hispanic” query, but by the “voting age by Hispanic” query, the “race by Hispanic” query, the “voting age by race by Hispanic” query, and the detailed query. For further analysis, data users must map the queries to statistics of interest, possibly combining information across multiple queries.
To address this challenge, we developed a series of aggregation matrices which, when multiplied by a vector of noisy query values, produces a set of tabulated statistics. For example, the aggregation matrix for the “voting age by Hispanic” query shown above would be applied as follows:
Applying these aggregation matrices to each of the queries produces multiple noisy estimates of each of the desired tabulated statistics. Applying them again to the variance of each of the queries (which is included in the NMF) calculates the variance of each of these estimates, since each entry in is independent of the others. The output of this step is shown in the second panel of Figure 2(a). Then, to integrate these estimates, we take an inverse-variance weighted mean, which produces a minimum-variance estimator of each (true) tabulated statistic.666This induces some correlation between noisy measurements within each geography, but maintains independence between geographies and across geographic levels. Where this correlation is statistically unhelpful, aggregation matrices can be built that only take the minimum-variance query for each statistic, sacrificing lower variance for ensuring completely independent statistics. The output of this step is shown in the third panel of Figure 2(a).
Mapping queries to statistics yields data that look similar to the tabulated tables traditionally released by the Bureau: each row corresponds to a tabulated statistic for a particular geographic unit (along with the error variance). But the similarity is only superficial—the geographic units in the NMF, identified by numeric geocodes, do not directly correspond to traditional census tabulation geographies, identified by so-called GEOIDs. Each Census block with non-zero population has a unique associated geocode. Geocodes are combinations of traditional census information contained in GEOIDs (e.g. FIPS codes) and information on TopDown processing steps (e.g. an indicator for whether the geography is on the ai/an spine or not). A full explanation is provided in Kenny et al., 2023b (, Table 1), and original detail is available in the NMF documentation (Abowd et al., 2023a, , see, e.g., footnotes 14-15).
While blocks correspond to blocks, every other geography aside from the country as a whole is different (Cumings-Menon et al.,, 2022). Part of this difference is due to separating the geographic spine for regions inside and outside of ai/an areas as mentioned above. This decision means that states, counties, tracts, and optimized block groups are split between ai/an regions and must be re-combined for many analyses. Traditional block groups are also replaced with “optimized block groups,” which are designed to minimize DAS-induced error for specific off-spine geographies such as Census places. Finally, any geography with no housing units is removed from the NMF.777Formally, the Bureau imposes a structural zero requirement that blocks with no housing units report zero population.
An additional complication is that when a geographic unit contains only a single subunit (for example, a tract containing only one block group), the subunit’s privacy loss budget is reallocated to the higher-level unit, and the subunit is removed from the NMF (see Abowd et al.,, 2022). This creates “holes” in the NMF and substantially increases the difficulty of analyzing the NMF.
Thankfully, a full listing of (populated) block geocodes exists in auxiliary constraint files released alongside the NMF. Since the NMF block-level geocodes can be split into two pieces, with the second piece corresponding to the block’s tabulation GEOID, this allows us to build a correspondence table that links every census block to its traditional tabulation geographies and NMF-specific geographies. Finally, by recursing down the geographic hierarchy and identifying geographies which are missing in the NMF but present in the auxiliary data, we can copy data from higher geographic levels and fill the “holes” in the NMF.
The correspondence tables linking NMF blocks to traditional tabulation geographies are only partially satisfying. They allow analysts to aggregate any block-level data, such as the final published census data (the right table in Figure 1) to both NMF and traditional geographies. Yet, because noisy measurements are not consistent across geographic levels—the sum of tract populations does not equal the county population, in general—there are many ways to aggregate NMF data to larger geographies. The simplest way—aggregating NMF block-level data—also produces far noisier estimates, which may be practically unusable for many purposes.
A better way involves aggregating noisy estimates from the largest possible NMF geographies. For example, to produce an NMF-based estimate of a school district’s population, we would add up the NMF estimates of all the tracts contained fully within the district, then all the optimized block groups that are contained fully within the remainder, and then finally the remaining blocks. If applied to all school districts in the country, this process will produce a minimum-variance unbiased estimates of the true tabulated populations, under the constraint that each of the district estimates remain statistically independent of the others and are built out of only geographies contained in each district. This approach is used in Kenny et al., 2023b . Further research is warranted, however, in establishing minimum-variance estimators under other constraints, and evaluating the tradeoffs between different estimation approaches.
For now, we recommend that most researchers interested in comparing NMF data to published tabulations should proceed by aggregating published block data to NMF geographies (rather than the other way around). This is illustrated in Figure 2(b).
4 Recommendations for the Census Bureau
Based on our experience obtaining the NMF and building tools to load, format, and analyze it, we offer the following recommendations that will significantly improve the usability of the NMF. Our recommendations are focused on facilitating the main use cases of the NMF: understanding the DAS-introduced error in published statistics and performing statistically valid inference on those data.
-
1.
Data access and documentation
-
(a)
Host the raw NMF files on an easy-to-use publicly-accessible website. The NMFs were first posted to the Globus service, which required users to create an account and install their third-party software locally in order to download any data, even the documentation. Some of the NMFs have been released on other platforms, such as the Harvard Dataverse; others have not. Ideally users could easily (and programmatically) download the individual Parquet files that make up the NMF from the Bureaus’s own website.
-
(b)
Consider un-nesting the NMF file before publication so that the data are in a rectangular format, with each query’s histogram bins fully labeled. In addition to making the data much more amenable to standard data processing tools, the inclusion of labels would additionally obviate the need for users to manually copy values from codebooks.
-
(c)
In the event that further reformatting and aggregation is performed by the Bureau on the NMF (see below for specific recommendations), provide API access to these reformated data, similar to the API for existing decennial census tabulations or ACS results.
-
(d)
Produce centralized NMF documentation and make it available separately from the data. This documentation should explain the high-level structure of the NMF and its relation to published decennial statistics and tabulation geographies. The documentation should also contain sufficient detail and code books needed to properly read and format the file. The existing documentation provided alongside the raw NMF is around 8 pages long and, while technical, does not contain enough detail on its own to allow researchers to work with the NMF.
-
(a)
-
2.
Data parsing and formatting
-
(a)
Fill in NMF geographies missing due to privacy budget reallocation with data copied from higher-level geographies. While the original NMF reflects the structure of the geographic spine used as input to the DAS, without this filling-in, researchers are unable to use the NMF to evaluate bias and noise or make statistically valid inferences from privacy-protected data.
-
(b)
In the event that the un-nested NMF is too large for users to work with, release code in standard data analysis languages (R, Python, Stata, etc.) that demonstrates how to load the NMF in and attach labels to the noisy queries.
-
(a)
-
3.
Connecting NMF queries to tabulated statistics
-
(a)
Provide aggregation specifications that link queries to traditional tabulation statistics in the redistricting or DHC files. These specifications should be designed as tables that can be joined to the NMF and then summarized to produce the necessary tabulations.
-
(b)
Produce an additional version of the NMF for which these aggregations have already performed, and the results possibly combined using inverse-variance weighted means, so that each statistic has a single minimum-variance estimate. As described in Section 3, this aggregation and weighting can be done independently across geographies, preserving the key statistical advantage of the NMF data—independent, unbiased noise—while making it directly usable for downstream tasks. Aggregation-and-weighting also significantly reduces the size of the data, allowing the output to be hosted by the Bureau and processed more easily by most end users. Other than the differences in the geographic spine, this data product could look much like the American Community Survey tabulations, which are accompanied by a margin of error estimate.
-
(a)
-
4.
Connecting the geocodes used in the NMF to traditional census tabulation geographies
-
(a)
Provide full block assignment files (BAFs) for NMF geographies, including blocks with no housing units.
-
(b)
Produce shapefiles, for the NMF geographies so that they can be used directly in analyses, if desired, and compared to geographies which are of interest to end users, such as school or voting districts.
-
(c)
Provide generalized geography assignment files which describe the best way to build each traditional tabulation geography (on- and off-spine) out of NMF geographies, following the approach discussed in Section 3. Such generalized assignment files would enable researchers to have independent, unbiased noisy measurements of statistics of interest for their desired geographies, which are also minimum-variance.888Specifically, this would ensure that resulting estimates are minimum-variance, subject to the constraint that they are built only out of NMF geographies fully contained within tabulation geographies. This in turn means that estimates be statistically independent across geographies.
-
(a)
If implemented, these recommendations would produce a NMF that is much more accessible for and familiar to data users, enabling them to focus on developing methods to analyze noisy census measurements, and answering substantive research questions.
5 Conclusion
We commend the Census Bureau for their decision to release the Noisy Measurement File (NMF), which has the potential to allow Census data users to understand and account for the DAS-introduced error for a wide array of analyses. In addition, the NMF demonstration data release offered a potential opportunity to discuss improvements to data usability before a wide range of Census stakeholders begin to build new data pipelines to incorporate the NMF into their work.999The Census Bureau has announced multiple 2020 NMF data releases. https://www.census.gov/newsroom/press-releases/2023/2020-census-data-products-schedule-updates.html Unfortunately, little change was made in the final release of the NMF to overcome the obstacles we identified in the initial version of this paper.101010Some positive changes were made, including publishing copies of some of the NMFs on the Harvard Dataverse and Amazon Web Services Open Data Registry, and publishing copies of the READMEs that accompany the NMFs on the Census Bureau’s FTP server.
The NMF, as currently released, is difficult to process and use for the kinds of tasks that will allow practitioners to evaluate and correct for DAS-introduced error in their analyses. Fortunately, many of these difficulties are logistical and not due to scientific necessity. We believe that adopting our recommendations will result in a more accessible and useful NMF for many Census data users. The Census Bureau, as the developer of the DAS and of course the principal expert on Census data, is best-positioned to make these changes and produce a data product that is both statistically sound and practically useful. Our recommendations are consistent with the Bureau’s own stated goals around data usability, such as their pioneering Enterprise Data Lake (EDL) initiative to modernize data collection, processing, and dissemination.111111https://www.census.gov/newsroom/blogs/research-matters/2022/10/technology-transformation.html
Data releases from the US Census Bureau serve as the backbone for a great deal of scientific analyses and policy decisions. We hope these discussions around data usability, accuracy, and privacy in the Census can continue to serve as a useful precedent for data providers and data users in the future.
References
- Abowd et al., (2022) Abowd, J., Ashmead, R., Cumings-Menon, R., Garfinkel, S., Heineck, M., Heiss, C., Johns, R., Kifer, D., Leclerc, P., Machanavajjhala, A., Moran, B., Sexton, W., Spence, M., and Zhuravlev, P. (2022). The 2020 Census Disclosure Avoidance System TopDown Algorithm. Harvard Data Science Review, (Special Issue 2). https://hdsr.mitpress.mit.edu/pub/7evz361i.
- (2) Abowd, J. M., Ashmead, R., Cumings-Menon, R., Garfinkel, S., Heineck, M., Heiss, C., Johns, R., Kifer, D., Leclerc, P., Machanavajjhala, A., Moran, B., Sexton, W., Spence, M., and Zhuravlev, P. (2023a). 2010 Census Production Settings Redistricting Data (P.L. 94-171) Demonstration Noisy Measurement File (2023-04-03).
- (3) Abowd, J. M., Ashmead, R., Cumings-Menon, R., Garfinkel, S., Heineck, M., Heiss, C., Johns, R., Kifer, D., Leclerc, P., Machanavajjhala, A., Moran, B., Sexton, W., Spence, M., and Zhuravlev, P. (2023b). 2020 Census Redistricting Data (P.L. 94-171) Noisy Measurement File, Version 1. Harvard Dataverse, DOI: 10.7910/DVN/5LAVKV.
- Bun and Steinke, (2016) Bun, M. and Steinke, T. (2016). Concentrated differential privacy: Simplifications, extensions, and lower bounds. arXiv preprint 1605.02065.
- Canonne et al., (2020) Canonne, C. L., Kamath, G., and Steinke, T. (2020). The discrete gaussian for differential privacy. Advances in Neural Information Processing Systems, 33:15676–15688.
- Cumings-Menon et al., (2022) Cumings-Menon, R., Abowd, J. M., Ashmead, R., Kifer, D., Leclerc, P., Ocker, J., Ratcliffe, M., and Zhuravlev, P. (2022). Geographic spines in the 2020 Census Disclosure Avoidance System. arXiv preprint 2203.16654.
- Dwork et al., (2021) Dwork, C., Greenwood, R., and King, G. (2021). Letter to U.S. Census Bureau: Request for release of “noisy measurements file” by September 30 along with redistricting data products.
- JASON, (2022) JASON (2022). Consistency of data products and formal privacy methods for the 2020 census (jsr-21-02, January 11, 2022). Technical report, The MITRE Corporation.
- Kenny et al., (2021) Kenny, C. T., Kuriwaki, S., McCartan, C., Rosenman, E., Simko, T., and Imai, K. (2021). The impact of the US Census disclosure avoidance system on redistricting and voting rights analysis. Science Advances, 7(41):1–17.
- (10) Kenny, C. T., Kuriwaki, S., McCartan, C., Rosenman, E., Simko, T., and Imai, K. (2023a). Comment: The essential role of policy evaluation for the 2020 census disclosure avoidance system. Harvard Data Science Review, Special Issue 2:1–16.
- (11) Kenny, C. T., Kuriwaki, S., McCartan, C., Simko, T., and Imai, K. (2023b). Evaluating bias and noise induced by the U.S. census bureau’s privacy protection methods. ArXiv Preprint, https://arxiv.org/pdf/2306.07521.pdf.
- Kifer et al., (2022) Kifer, D., Abowd, J. M., Ashmead, R., Cumings-Menon, R., Leclerc, P., Machanavajjhala, A., Sexton, W., and Zhuravlev, P. (2022). Bayesian and frequentist semantics for common variations of differential privacy: Applications to the 2020 census. arXiv preprint 2209.03310.
- McCartan et al., (2023) McCartan, C., Simko, T., and Imai, K. (2023). Researchers need better access to us census data. Science, 380(6648):902–903.
- National Academies of Sciences and Medicine, (2020) National Academies of Sciences, E. and Medicine (2020). 2020 Census Data Products: Data Needs and Privacy Considerations: Proceedings of a Workshop. The National Academies Press, Washington, DC.
- National Congress of American Indians, (2021) National Congress of American Indians (2021). Letter to Dr. Ron S. Jarmin from Dante Desiderio, Chief Executive Officer.
- Phillips v. Census Bureau, (2022) Phillips v. Census Bureau (2022). Phillips v. Census Bureau. 1:2022cv09304, US District Court for the Southern District of New York.
- Scariano and Youngs, (2022) Scariano, J. and Youngs, I. (2022). Balancing utility versus privacy in the 2020 census: Sentiments from data users. Available at SSRN 4089888.