Aggressive Internet-Wide Scanners: Network Impact and Longitudinal Characterization
Abstract.
Aggressive network scanners, i.e., ones with immoderate and persistent behaviors, ubiquitously search the Internet to identify insecure and publicly accessible hosts. These scanners generally lie within two main categories; i) benign research-oriented probers; ii) nefarious actors that forage for vulnerable victims and host exploitation. However, the origins, characteristics and the impact on real networks of these aggressive scanners are not well understood. In this paper, via the vantage point of a large network telescope, we provide an extensive longitudinal empirical analysis of aggressive IPv4 scanners that spans a period of almost two years. Moreover, we examine their network impact using flow and packet data from two academic ISPs. To our surprise, we discover that a non-negligible fraction of packets processed by ISP routers can be attributed to aggressive scanners. Our work aims to raise the network community’s awareness for these “heavy hitters”, especially the miscreant ones, whose invasive and rigorous behavior i) makes them more likely to succeed in abusing the hosts they target and ii) imposes a network footprint that can be disruptive to critical network services by incurring consequences akin to denial of service attacks.
1. Introduction
Intensive and incessant Internet-wide scanning activities have evolved significantly over the past several years primarily due to two orthogonal factors: the development and wide adoption of research tools such as ZMap (durumeric2013zmap, 20) and Masscan (masscan, 22) that have been enabling researchers to examine a plethora of security and networking questions; and the independent explosion of botnets and malware that target Internet-of-Things (IoT) applications and hosts (e.g., Mirai and others (10.1145/2656877.2656893, 33, 3, 32, 35, 47)). While the utility of innocuous research scanners has been indispensable for many applications (e.g., understanding the risk profile and security posture of networks and protocols (10.1145/2810103.2813703, 15, 37, 29, 6), detecting network outages (Heidemann2012APA, 26, 42, 44), disclosing and assessing new vulnerabilities (10.1145/2663716.2663755, 19), identifying IP space usage and address exhaustion (10.1145/1851182.1851196, 7, 40), studying censorship (10.1145/3473604.3474562, 41, 49, 43) and understanding botnets (antonakakis2017understanding, 3) and cybersecurity flaws (10.1145/2504730.2504755, 18, 16, 27, 48, 1)), their collective impact on the overall network traffic, their origins, the profile of the applications/ports they target, etc. are currently not well understood nor have been systematically quantified. A similar gap exists in understanding the network impact and characteristics of malicious network scanners (e.g., botnets (antonakakis2017understanding, 3) or adversaries that forage for insecure Internet hosts (Czyz:2014:TPG:2663716.2663717, 10)) that are heavily probing the Internet. In this paper, we attempt to shed some light into the behavior of both families of scanners through the lens of i) a large network telescope and ii) traffic data (i.e., flows and packet streams) from several vantage points of a large academic ISP, namely Merit Network, and a campus university network, i.e., University of Colorado; we collectively refer to these probers as aggressive scanners (AH, for short, for “aggressive hitters”) due to their defining characteristic of exhibiting some sort of “excessive” behavior.
Large network telescopes or Darknets (caida_telescope_report, 38, 36) provide a unique perspective for understanding macroscopic Internet-wide activities, such as scanning (durumeric2014internet, 17). Network telescopes are instrumented to receive and record Internet-wide traffic destined to large swaths of unused (but routed!) IP space. In this paper, we longitudinally study a large network telescope operated by Merit Network, namely the ORION Network Telescope (ORION NT) (orion, 36), covering about 500,000 contiguous “dark” (i.e., unused) IPs for a period spanning 22 months (January 1st, 2021 to October 15th, 2022) to obtain up-to-date insights into the characteristics of aggressive Internet-wide scanners that reach our Darknet. We consider three separate modalities to examine intensive scanning behavior (see Section 3). E.g., following the definition of “large scans” from (durumeric2014internet, 17), we consider hosts that scan or more of the dark IP space to be aggressive. Using this definition, we identify 155,010 unique IPs associated with aggressive scanning in 2022 across a total of 57,334,643 unique IPs reaching the Darknet. They contribute 540 billion packets amounting to of all packets captured in the Darknet for 2022.
To understand the network impact ascribed to these “heavy-hitters” we integrate into our analysis flow data from Merit, which serves upwards of one million users. Further, we examine live streams of packets at one monitoring station at the same ISP and another station at the University of Colorado campus network. We join the ISP datasets with the identified hitters to measure the impact of the AH activities on the network in terms of packet volume. We found that AH packets contribute between 0.1–5.85% of the total ingress/egress packets processed by core routers on a typical day; this is a non-negligible fraction.
Our main contributions include the i) up-to-date longitudinal profiling of Internet-wide “aggressive” scanners and ii) measurable evidence that the aggregate network footprint of these scanners is not as inconspicuous as researchers and operators generally assume. This traffic can be disruptive to network operators; especially traffic originating from origins that never disclose their intents (as opposed to the seemingly benign “Acknowledged” lists (ackedscanners, 9) that do reveal the scanning purpose). Scanners of unspecified intent are the vast majority of probers we categorize as “aggressive”, and can be associated with botnet propagation and nefarious reconnaissance (e.g., see (Czyz:2014:TPG:2663716.2663717, 10)). We plan to produce and share daily lists of such scanners (using all three definitions) that the network and “threat exchange” communities (10.1007/978-3-319-45719-2_7, 50, 34) could subscribe to, hoping that they can be utilized by operators to block and mitigate this disruptive Internet background noise.
2. Description of Datasets
| Darknet-1 | Darknet-2 | Flows-1 | Flows-2 | |
| Packets (Billions) | 1,098 | 833 | 7,560 | 770 |
| Source IPs (Millions) | 123 | 57 | 7 | 2.7 |
| Dest. IPs (Millions) | 0.475 | 0.475 | 22 | 10 |
| Total Events (Billions) | 26 | 32 | - | - |
A. Darknet data. We analyze data from the ORION NT to identify and then study the aggressive hitters. To study yearly trends, we split the Darknet dataset into two parts: Darknet-1 (spanning the entire 2021) and Darknet-2 (January 1st, 2022–October 15th, 2022). See Table 1.
Central to our analysis of Darknet data is the notion of a darknet event. For this study, a darknet event represents a “logical scan” such as those defined in (durumeric2014internet, 17, 45). Following (durumeric2014internet, 17), a logical scan summarizes the scanning activities of a source IP appearing in the Darknet. TCP-SYN packets, UDP packets, or ICMP “Echo Request” packets are the three traffic types we consider as “scanning packets” (durumeric2014internet, 17). A logical scan represents the activity of a source IP associated with a particular Darknet destination port and traffic type. For each darknet event / logical scan we record its start and end timestamps; an event is considered to have ended when no packets have been seen in the Darknet from the event’s source IP to the event’s targeted destination port and traffic category for more than a “timeout” period of around 10 minutes111The timeout or “expiration” period is based on ideas from (caida_telescope_report, 38) (see Section III.E, “Flow Timeout Problem”) and the intuition behind it is to avoid splitting “long scans” into individual shorter ones. To calculate this timeout interval, one needs the Darknet size, an assumed scanning rate and an assumed duration for the “long scan”; we used 100pps and 2 days, respectively.. For each event, we record total packets, number of unique Darknet destinations contacted and metadata (orion, 36).
B. ISP flows. To quantify the scanners’ network impact, we utilize ISP flows from Merit. The flows are in Netflow format and collected with a packet sampling rate of 1:1000 at three core Merit routers. The Netflow collectors are configured to only sample ingress and egress traffic to/from the ISP. i.e., internally facing router interfaces are not included in the flow data. We employ two datasets: Flows-1 (January 15th, 2022 to January 21st, 2022) and Flows-2 (October 1st, 2022).
C. Packet streams. To further validate the network impact results, we also performed measurements on mirrored packet streams at Merit and the campus network at the University of Colorado (to be referred as CU). CU is not associated with Merit (i.e., Merit does not provide upstream/transit services to CU and the IP spaces of both networks are different), and serves a population of 100,000 users. These non-sampled packet streams include the majority of ingress/egress traffic observed at a major core router at Merit (one of the three routers we have flow data from) and all campus traffic at CU. We examine 72 hours starting on 2022-11-28. During then, at Merit, the monitoring station processed traffic exceeding 8 Mpps (million packets per second) and 80 Gbps. At CU, we observed peak rates at 5 Mpps and 40 Gbps.
D. Acknowledged scanners. To obtain insights into the seemingly benign/research scanners while also partially validating our lists of detected aggressive scanners, we employ the publicly available list of “Acknowledged Scanners” (ackedscanners, 9). The list curator considers a scanning IP as an “Acknowledged Scanner” (“ACKed” scanner, in short) if the scanners make any efforts to disclose their intentions (e.g., research purposes). At the moment our analysis was performed, the list (ackedscanners, 9) makes available the source IPs of 36 unique organizations.
E. Honeypot data. To cross-validate the lists of non-ACKed scanners (i.e., the likely miscreant ones) and shed light into their behaviors, we employ data from GreyNoise (greynoise, 23). Grey-Noise (GN) operates distributed honeypot sensors at multiple cloud providers meticulously placed throughout the world. The IPs observed contacting their sensors are tagged by the GN team via an internal process. An IP is annotated as benign,malicious or unknown; more specific tags are also available for some IPs. We examined GN data (with 2,962,153 unique IPs) for the whole month of June 2022.
Ethical considerations. Working with real-world traces requires ethical and responsible data handling. Our measurement infrastructure was designed with careful consideration and follows best practices imposed by the security/privacy boards and network managers of the organizations that operate the corresponding instrumentation. For instance, all of our datasets are passively collected and we never interact or probe any of the identified IPs present in our datasets. The data were analyzed in a secure manner only by the authors. Moreover, we followed the “code-to-data” paradigm for analyzing the live packet streams in which our code was shared with and executed by authorized personnel with access to the mirrored data. We do not collect nor examine any device MAC addresses or user payload, and we merely performed packet counting (i.e., total packets originating from AH) when examining the packet streams.
Darknet data are generally considered to pose minimal privacy risks; however, we take measures to not expose any identifiable information that might endanger networks or individuals. E.g., in the analyses that follow we elected to not publicly disclose the actual ASN and organization names that originate AH to protect the reputation of these networks.
3. Aggressive Network Scanners
Definition 1: Address Dispersion. We classify a source IP appearing in our Darknet as aggressive whenever it is involved in a darknet event that targets or more dark IPs. This definition was also employed in (durumeric2014internet, 17) to identify “large scans”. We found 2,977,242 scanning events in Darknet-1 and 2,075,485 events in Darknet-2. We identified 158,681 distinct IPs satisfying this condition in the Darknet-1 dataset and 155,010 IPs in 2022.
Definition 2: Packet Volume. The second definition is based on packet volume. For each Darknet dataset, we compile the Empirical Cumulative Distribution Function (ECDF) for the number of packets sent per event. Using the empirical distribution, we calculate the ()th-percentile, and declare a scanner as “aggressive” whenever it participates in an event with total packets transmitted crossing the critical threshold. We utilized .
The thresholds that correspond to the top- events were found to be 64,810 packets and 23,491 for Darknet-1 and Darknet-2, respectively. The number of identified aggressive source IPs found from this definition in 2021 was 159,159. We noticed that these numbers are very similar to those obtained using the address dispersion rule; indeed, the Jaccard similarity score222Given sets and , the value denotes the Jaccard score, where denotes the set cardinality. for the two sets of hitters is found to be 0.8. Due to the high similarity among the two populations in the sequel we mostly focus our attention to scanners identified using the address dispersion definition.
Definition 3: Number of Distinct Destination Ports. Our final definition is based on the number of distinct ports that a scanning IP contacts in the Darknet in a given day. We again source our data to obtain the ECDFs for the number of unique ports for both years. We use the same to find the critical threshold. The ECDFs for Darknet-1 and Darknet-2 differ, indicating a shift towards more scanned ports (see Izhikevich et al. (izhikevich2021lzr, 30) for a possible explanation). For Darknet-1, we classified the IPs scanning more than or equal to 6542 ports per day as aggressive, whereas for 2022 the threshold is 57,410 ports.
4. Network Impact
Having the lists of AH available, we now shift focus into understanding the impact that these scanners pose to networks. First, we utilize flow data from Merit to measure the collective packet volume generated by the identified AH and processed by the ISP’s routers as they transit the network. We start by individually checking flow data from three core Merit routers. These routers collectively process more than 50% of all packets transiting Merit’s network.
Table 2 showcases the network impact imposed by aggressive scanners for definition #1 (we omit results for the second definition since that scanning population is very similar to the one identified with the first definition; results for definition #3 show a less pronounced impact, albeit non-negligible, but we omit them for brevity). We report on the total number of packets observed at a specific vantage point originating from a source IP belonging to an identified AH. In addition, we also include the portion of traffic that these packets amount to with regards to all the packets that a given router processes for the days examined. The tables highlight a somehow unexpected result: the daily fraction of aggressive scanners’ packet volume lies between ; this is a relatively high percentage and indicates that the impact of aggressive scanners on network traffic is not negligible. To rephrase, we see evidence that, on average, at least one out of every hundred ingress or egress packets that a router processes is a packet originating from an AH.
Table 2 illustrates that the peering arrangements in place at the ISP directly affect the fraction of AH packets recorded on a given router. For instance, we remark that router-1 endures the highest impact with regards to hitters identified with the address dispersion metric; this can be explained by the fact that definition #1 AH frequently originate from Europe and Asia, as shown in Table 5, and router-1’s routing policies (e.g., upstream tier-1 peers) dictate that such traffic would enter Merit at that point-of-presence.
We next reflect further on interpreting and validating this surprising result. We note that the higher percentages occur on weekends, namely when the overall Merit traffic is lower. We also speculate that content caching (10.1145/3452296.3472928, 21) plays a critical role in “amplifying” the effect of network scanning. Merit has put in place careful traffic engineering considerations to have their users benefit from content caches (e.g., videos, etc.) that reside within the ISP. User traffic to/from these content caches does not traverse the 3 border routers we study here so these packets do not contribute to the calculated ratio.
| Router-1 | Router-2 | Router-3 | |
| Date | pkts / pcnt. | pkts / pcnt. | pkts / pcnt. |
| 2022-01-15 (Sat) | 15.2 (5.82%) | 6.3 (2.84%) | 4.1 (1.9%) |
| 2022-01-16 (Sun) | 20.4 (5.85%) | 9.0 (3.03%) | 5.4 (1.92%) |
| 2022-01-17 (Mon) | 19.4 (5.2%) | 8.1 (2.24%) | 5.6 (1.56%) |
| 2022-01-18 (Tue) | 15.0 (3.62%) | 5.7 (1.51%) | 5.6 (1.2%) |
| 2022-01-19 (Wed) | 15.1 (3.29%) | 5.5 (1.37%) | 5.6 (1.14%) |
| 2022-01-20 (Thu) | 14.7 (3.23%) | 5.8 (1.42%) | 5.3 (1.1%) |
| 2022-01-21 (Fri) | 16.1 (3.66%) | 6.1 (1.56%) | 5.9 (1.38%) |
| 2022-10-01 (Sat) | 7.9 (2.52%) | 4.9 (1.86%) | 5.6 (2.59%) |
| Avg (pkts/pcnt) | 15.5 (4.15%) | 6.4 (1.98%) | 5.4 (1.6%) |
To further validate our results, and to eliminate the possibility that the high network impact might be due to some bias arising from the sampled flow data, we next examine the mirrored packet streams at both Merit and CU. Figure 1 illustrates the results, offering some interesting findings: i) This non-sampled dataset confirms that the network impact at Merit (and router-1, specifically) lies around 2% (see left panel, top row)333The (cumulative) fraction declines over time since we transition from a weekend day to a weekday. Further, we performed this 3-day analysis using AH for Nov. 27th, 2022, and due to DHCP churn (see (10.1007/978-3-319-45719-2_7, 50)) some AH IPs might have become obsolete by the second and third days of the analysis.; ii) the network impact at CU is also high, but an order of magnitude less than Merit (see right panel, top row), hovering just shy of 0.10%. We hypothesized that this could be an artifact of the lack of content caching at CU which means that the monitoring station at CU sees more video-related traffic compared to the Merit station. Indeed, we checked with the network engineers at CU and they verified that no content caching is present within their network and off-net caching is provided by their upstream ISP; iii) the instantaneous impact from AH could even exceed 7% on certain occasions (middle row panels) on both networks, reaching even 12% at Merit; iv) as we observe on the bottom row panels, on several 1-second intervals (shown in red color) when the AH impact is high, overall network traffic could also reach high levels (e.g., exceeding 6 Mpps). This implies that AH are overwhelming the network even during its “busy” times, and consequently network performance might suffer due to potentially incurred packet drops and network delays. In short, these AH collectively exhibit behavior akin to denial-of-service attacks.
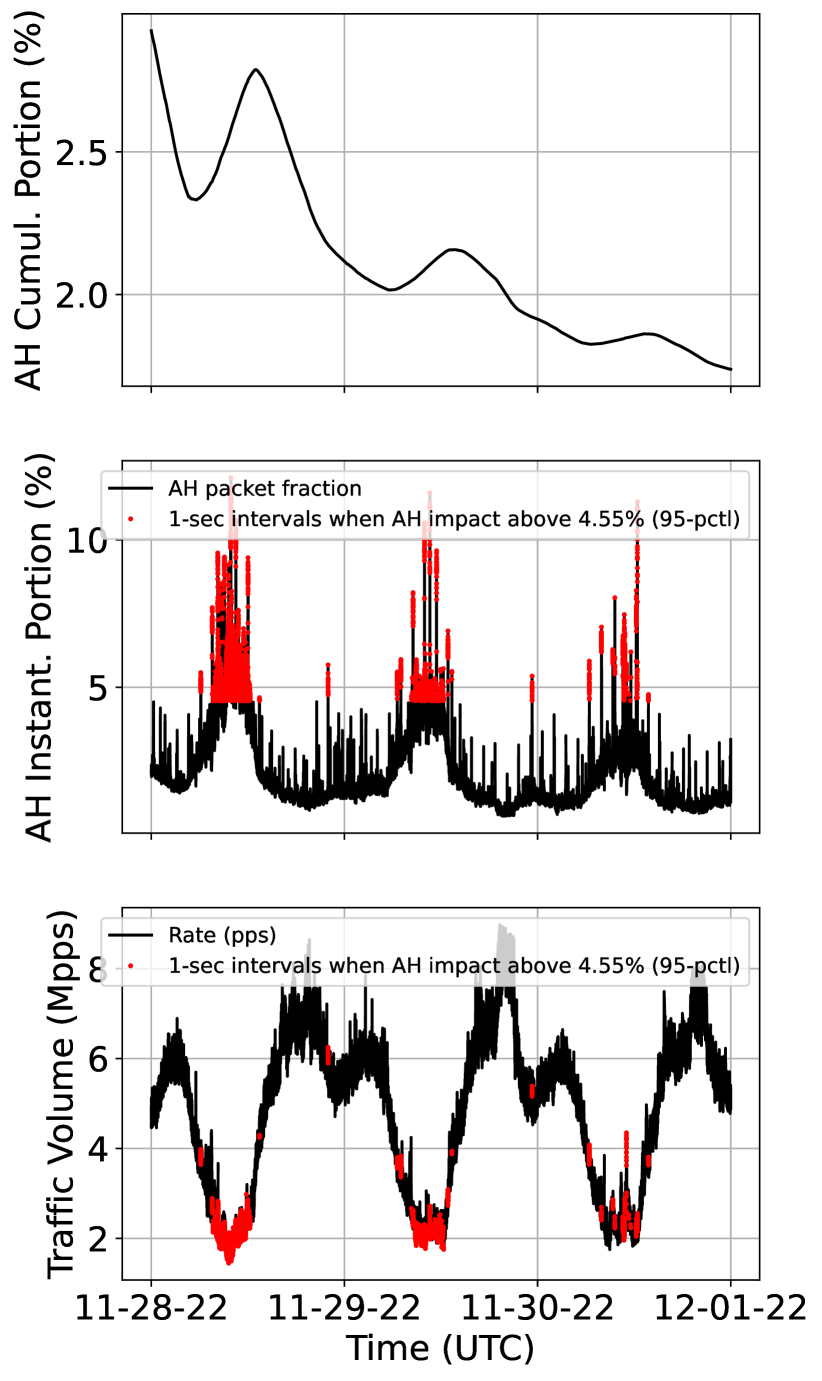
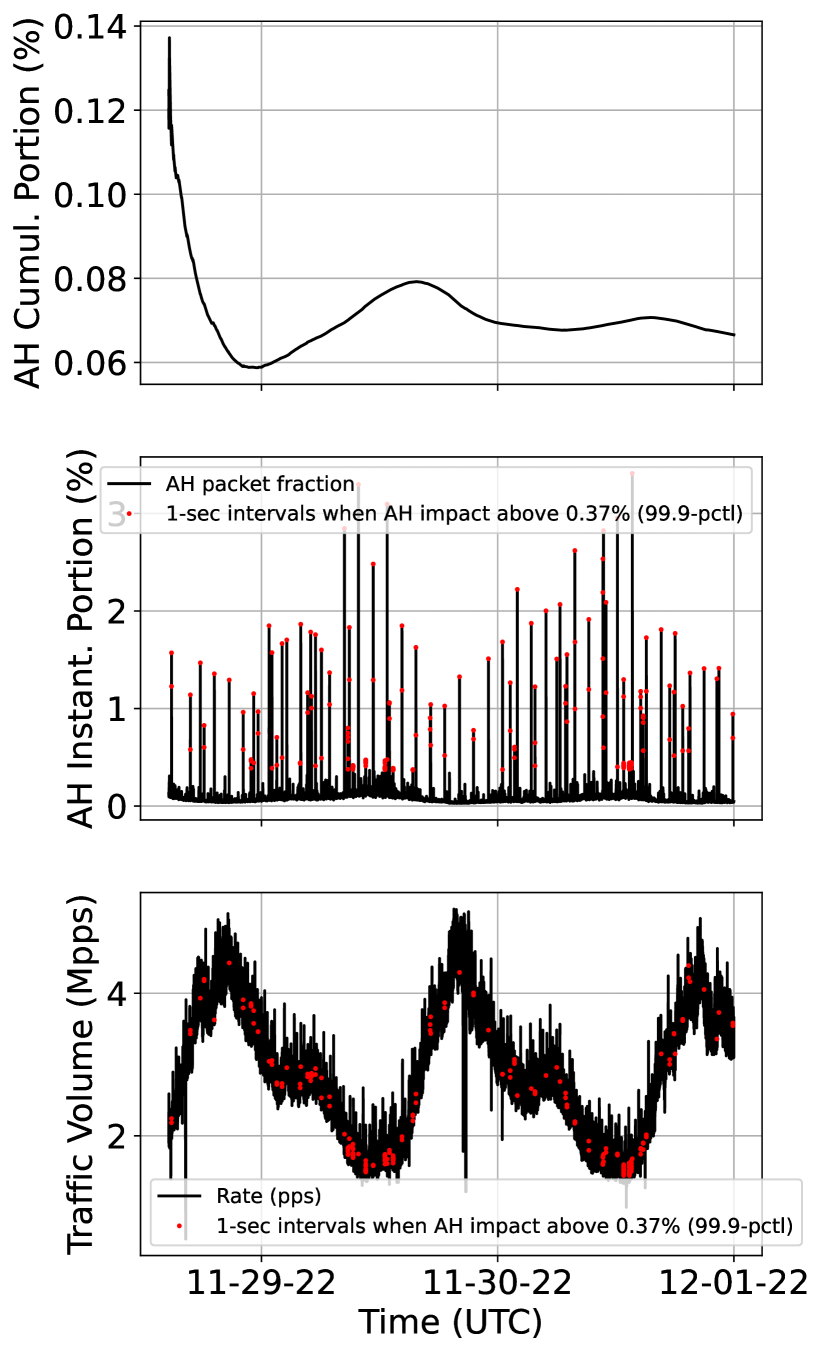
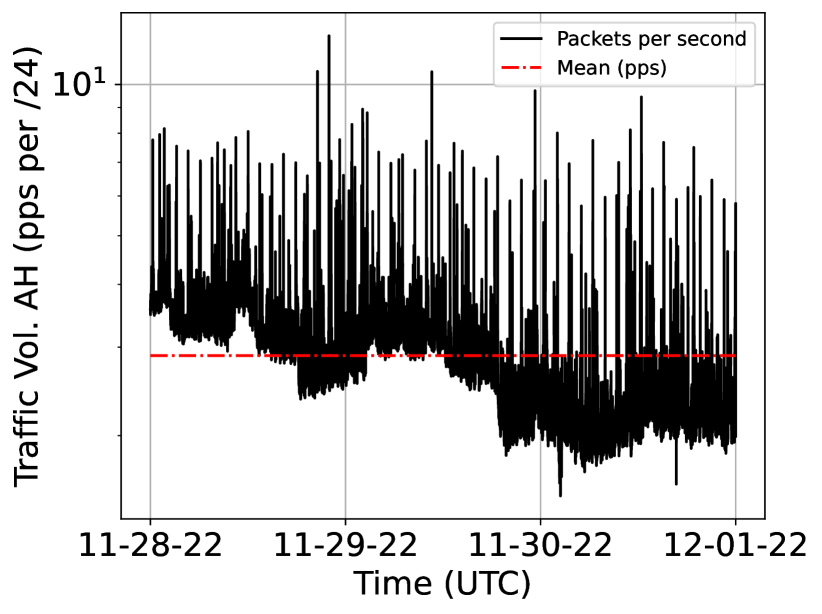
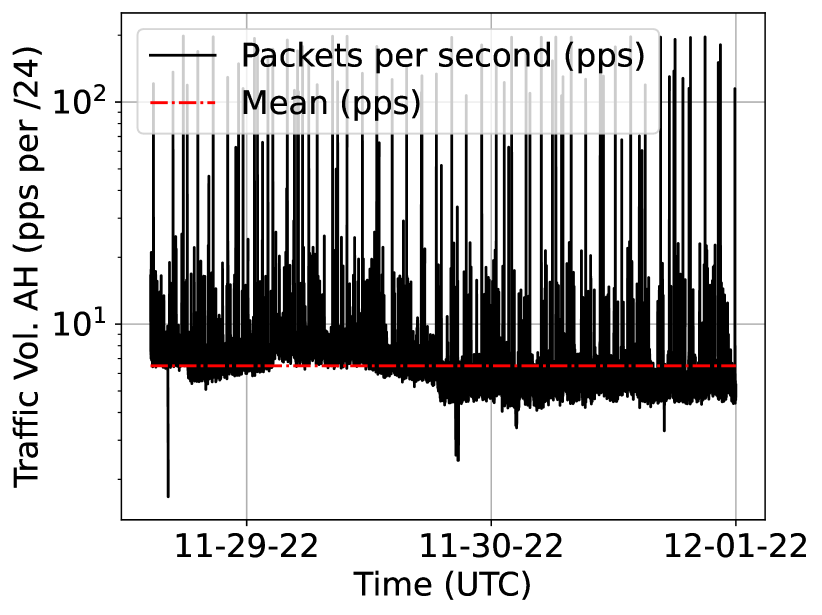
Figure 2 further corroborates the hypothesis that the network impact difference between Merit and CU can be explained by the presence of content caching (or lack thereof). The figure illustrates the instantaneous packet rates ascribed to the identified AH at Merit (left) and CU (right) when we normalize by their total number of /24 networks (28561 /24 nets for Merit and 291 for CU). As observed, CU is in fact more adversely affected by the collective impact of these scanners on a per /24 basis.
| Router-1 | Definition #1 | Definition #2 | Definition #3 |
|---|---|---|---|
| Protocol | D (%) / F (%) | D (%) / F (%) | D (%) / F (%) |
| TCP-SYN | 90.4 / 90.4 | 88.9 / 89.7 | 98.2 / 98.7 |
| UDP | 9.4 / 8.6 | 10.8 / 9.2 | 1.1 / 0.6 |
| ICMP Ech Rqst | 0.2 / 0.1 | 0.4 / 0.2 | 0 / 0.2 |
Table 3 allows us to understand the protocol behavior of these AH, as observed at both the Darknet and Flow data at Merit. The table illustrates the protocol distributions with respect to packet volume. It suggests that the actions of the AH are similar across both datasets, indicating that the high volume of packets we observe originating from them in the flow (and packet) data is indeed due to scanning and not attributed to other legitimate user behavior originating from the same IPs that are found to perform scanning.
Table 4 shows the network impact that scanners that can be classified as “Acknowledged” bear onto the network. The tabulated data suggest that “seemingly benign” scanning activities contribute a relatively high toll on the routers. The results are for the Flows-2 dataset (October 1st, 2022).
| Router-1 | Router-2 | Router-3 | |
|---|---|---|---|
| Definition # 1 | 3.17 (1.01%) | 2.42 (0.92%) | 5.47 (2.52%) |
| Definition # 2 | 3.35 (1.06%) | 3.13 (1.19%) | 5.55 (2.56%) |
| Definition # 3 | 0.5 (0.16%) | 2.83 (1.08%) | 0.59 (0.27%) |
5. Scanners Characterization
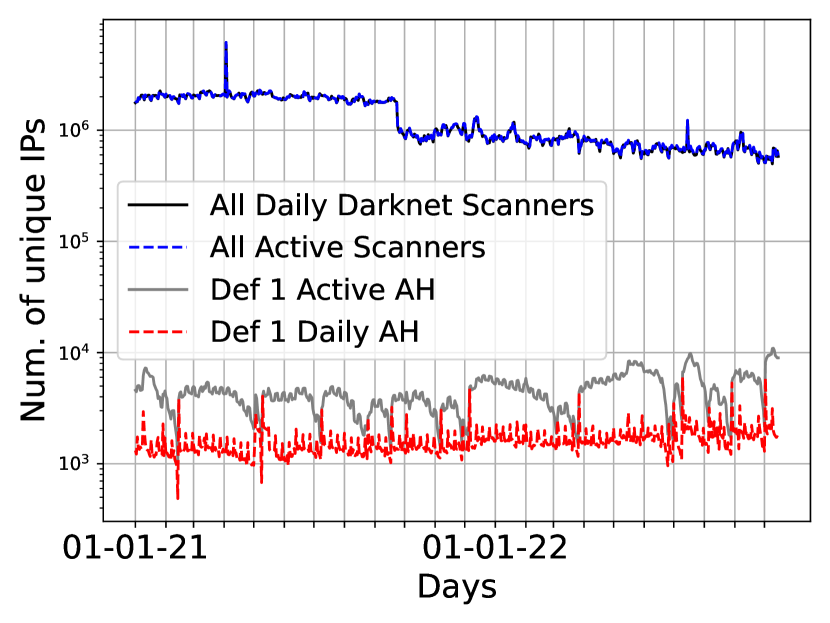
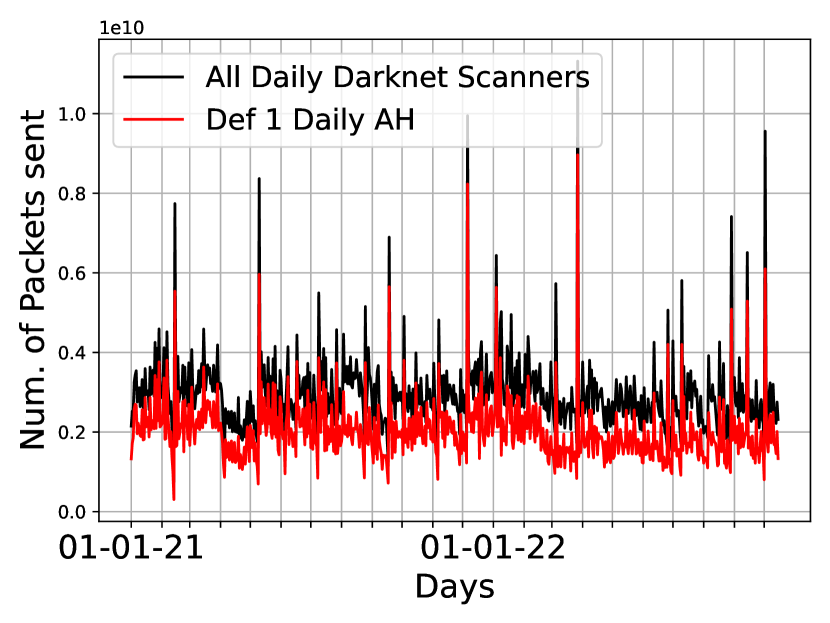
Next, we longitudinally study the identified scanners and attempt to characterize them (e.g., their origins, top ports targeted, etc.). Figure 3 shows time-series for definition #1. The left panel shows the number of active AH per day (which includes AH that may have started scanning prior to that day), the number of unique daily AH (i.e., ones that started their scanning efforts during that day), and the number of all active and daily scanners. The lines for the latter two scanner numbers seem to coincide because their values are very similar; their average difference is only 8,471 IPs. The right panel shows the number of packets transmitted by the number of daily scanners in a given day, juxtaposed with the aggregate Darknet scanning packets. Due to the darknet events data format, we can only calculate packet statistics for daily scanners.
The plot shows that the number of aggressive scanners increases over time. On average, we found 1452 (3876) daily (active) hitters per day in 2021, whereas there are 1779 (5349) daily (active) hitters per day in 2022. Figure 3 (right) depicts that the identified hitters contribute the vast majority of packets seen in the Darknet. We observe that on average around 0.1% of scanning IPs appearing in the Darknet and corresponding to AH are responsible for over 63% of the total packets captured per day in ORION NT.
Next, we discuss the origins of AH. We characterize the type of Autonomous Systems (AS) that originate these scanners, and the country of origin. Table 5 tabulates the top-10 networks and the countries associated with definition #1 AH. (Numbers in parentheses indicate ACKed scanners.) We also studied the origins of AH based on the other two definitions; for space economy, we omit these tables, but we point out that the origins for the first two definitions are very similar, echoing the previous observations that scanners from the first two definitions (address dispersion and packet volume) largely overlap. On the other hand, the origins for the third group differ, and we even see the presence of research institutions. Notably, a certain US-based cloud provider ranks top in all six definitions/datasets (except once), indicating strong preference from scanning organizations for its use.
| Darknet-1 (2021) | Darknet-2 (2022) | ||||||
|---|---|---|---|---|---|---|---|
| AS Type | unique /32s | unique /24s | Pkts (B) | AS Type | unique /32s | unique /24s | Pkts (B) |
| Cloud (US) | 37360 (3799) | 7041 (82) | 65.8 | Cloud (US) | 29933 (3626) | 6601 (67) | 67.2 |
| Cloud (CN) | 11514 | 7264 | 21.8 | ISP (CN) | 19085 | 10128 | 8.5 |
| ISP (CN) | 6791 | 5795 | 3.4 | ISP (CN) | 9908 | 7910 | 4.8 |
| Host. (CN) | 6479 | 4479 | 8.4 | Cloud (CN) | 8777 | 6130 | 19.4 |
| ISP (TW) | 3753 | 3011 | 1.4 | ISP (KR) | 8228 | 7399 | 3.7 |
| ISP (CN) | 3601 | 2895 | 4.4 | Host. (CN) | 6657 | 4551 | 11.2 |
| ISP (RU) | 2708 | 574 | 0.3 | ISP (TW) | 5771 | 4099 | 2.6 |
| ISP (US) | 2411 | 2166 | 0.2 | Cloud (US) | 3304 | 2955 | 2.5 |
| Cloud (US) | 2364 (250) | 1258 (98) | 4.8 | Cloud (US) | 2891 (54) | 1222 (17) | 3.8 |
| Cloud (US) | 2248 | 2103 | 2.6 | Cloud (US) | 2244 | 2047 | 1.5 |
| Total (%) | () | 36529 (37%) | 113.1 (15%) | 95090 (61%) | 52226 (54%) | 125.1 (23%) | |
| Address Dispersion | Packet Volume | Total Ports | ||||
| 2021 | 2022 | 2021 | 2022 | 2021 | 2022 | |
| IP match | 766 | 766 | 523 | 762 | 317 | 29 |
| Domain matches | 4672 | 4382 | 4334 | 5513 | 71 | 31 |
| Total IPs | 4706 | 4418 | 4350 | 5549 | 325 | 31 |
| Packets (Billions) | 158.3 | 130.9 | 152.5 | 145.2 | 29.0 | 5.7 |
| Packets (% all AH) | 20.4 | 24.1 | 19.9 | 24.3 | 34.0 | 28.1 |
| Total Orgs | 28 | 25 | 27 | 27 | 8 | 4 |
Next, we validate our inferences using the publicly available lists of “Acknowledged Scanners” (ackedscanners, 9), aiming to shed light into organizations that are seemingly benign and perform aggressive scanning for research purposes. We consider an identified AH as an ACKed scanner if i) its IP is within the list of IPs available in (ackedscanners, 9); ii) we find a match via reverse DNS checks. I.e., we compiled a list of 48 “keywords”(see list (keywords, 2)). based on the reverse DNS records of the IPs in (ackedscanners, 9).
Table 6 summarizes the matching results. E.g., we find that 4706 IPs from 27 distinct organizations using definition #1 and Darknet-1 are indeed AH. We note that we discovered several IPs (around 7600 in total) belonging to organizations considered as “ACKed scanners” that were not included in (ackedscanners, 9). Overall, we identified 7,974 IPs from 29 unique ACKed scanning organizations (out of 36 in (ackedscanners, 9)) during the full 22-months period across all definitions.
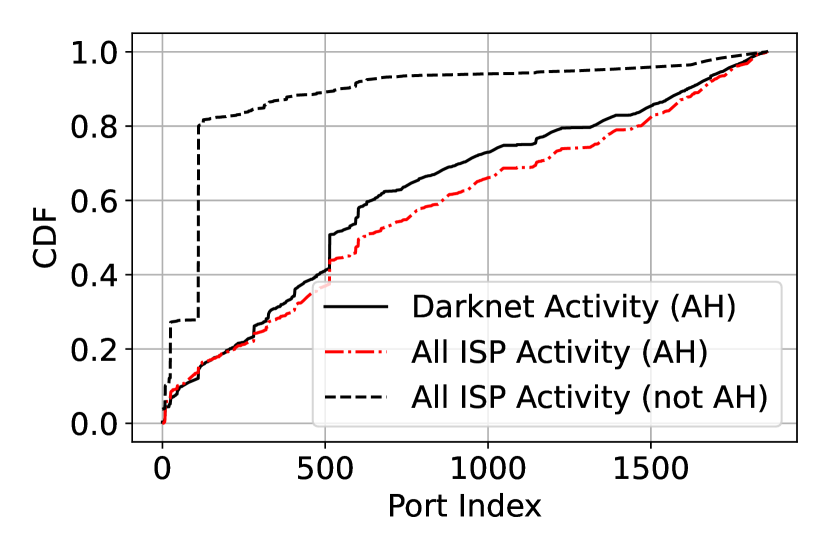
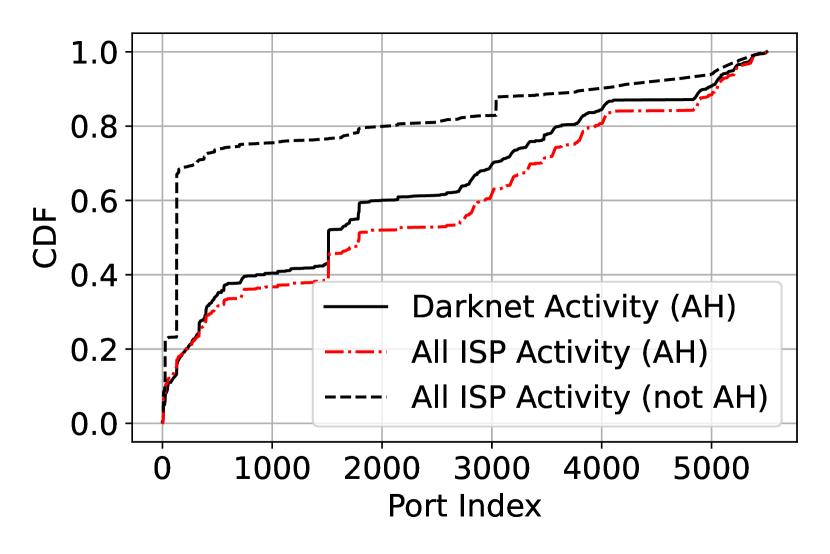
We next characterize the aggressive hitters in terms of the top applications they target (with regards to packets received). We also break down the attempts against each port based on whether the ZMap, Masscan or “Other” fingerprints have been observed (see (durumeric2014internet, 17) for the ZMap, Masscan fingerprints). Figure 4 shows the top ports/protocols for definition #1. We notice that 20 out of top 25 ports are present both in 2021 and 2022, and that AH send large number of packets to TCP ports. Out of top 25 services which receive the most number of packets in 2021, only 4 UDP-based services are targeted. ICMP (Echo Requests) completes the top-25 set.
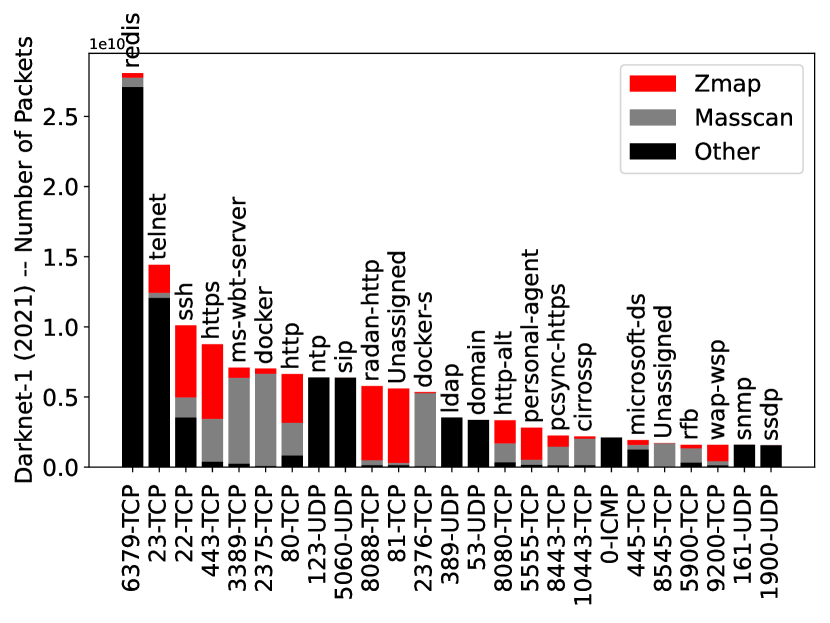
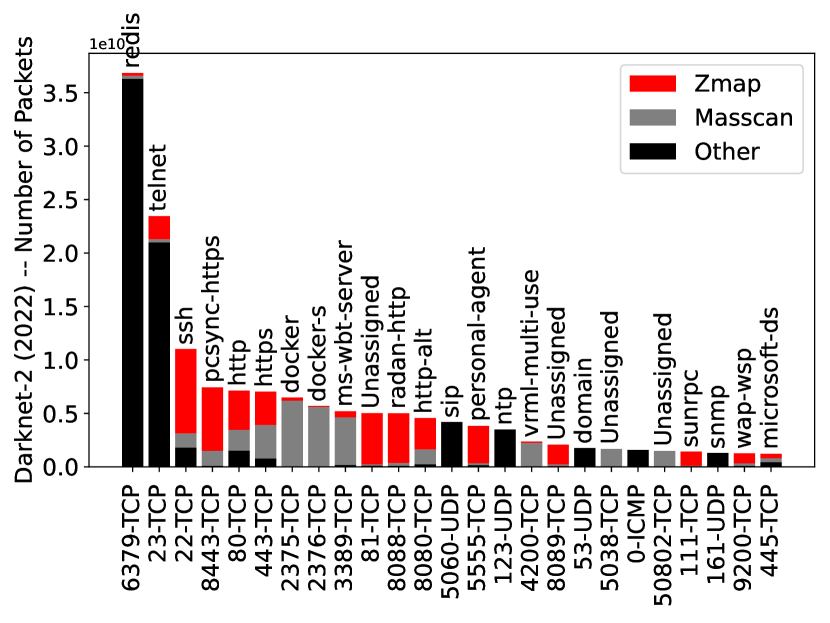
Next, we take a moment to compare this behavior with prior work (durumeric2014internet, 17), which also employed Merit’s Darknet. Figure 2 in (durumeric2014internet, 17) shows the same type of AH (i.e.,large scans targeting more than 10% of the dark IP space) and offers a baseline for comparison. Indeed, AH’s profile has dramatically changed since the Durumeric et al. 2014 study. SSH was the top-targeted port by AH back then, but it now ranks 3rd in both 2021 and 2022. The top-ranked aimed ports currently, according to ORION NT, are Redis and Telnet; neither of them were in the top-5 ports in 2014. This result is somewhat expected if one considers the rise of IoT applications and the botnet families that target Telnet services on IoT devices (e.g., see (10.1016/j.diin.2019.01.014, 47)). Further, Redis vulnerabilities are recently popularly mined for Cryptojacking (10.1007/978-3-030-58951-6_5, 8) and other application-level attacks (9690867, 25). Looking at Figure 3 in (durumeric2014internet, 17), we also notice that ZMap/Masscan currently play a prominent role in Internet-wide scanning whereas in 2014 their presence was minimal (as expected, since they were relatively unknown tools then).
Comparing with Richter et al. study (richter2019scanning, 45), we do observe some similarities in the top-ranked ports (see Figure 10 (richter2019scanning, 45)) as well as some notable differences. E.g., Telnet was the top-scanned port in the scanners identified in Richter et al. (richter2019scanning, 45), agreeing with current trends (i.e., Telnet is the 2nd most scanned port in our datasets). However, we notice that Redis/6379 was absent from the rankings of Richter et al. (richter2019scanning, 45). Interestingly, we also see that TCP/445, one of the most scanned ports in Richter et al. (richter2019scanning, 45), is not preferred by AH. This agrees with the results in Durumeric et al. (durumeric2014internet, 17) where we see TCP/445 mostly associated with “small scans” (i.e., scanning less than 10% of the Darknet space; see Figure 2, (durumeric2014internet, 17)).
We also validate our results using lists of scanners obtained from GreyNoise (greynoise, 23) in which nefarious aggressive scanners are included. Using the month of June 2022 as a basis for comparison, we found a significant overlap between the two vantage points; namely, on average 99.3% of AH identified in our Darknet are also found in GN on a given day. Since GreyNoise operates a “distributed” honeypot in several regions worldwide, this suggests that most of our identified hitters are not performing localized scans, but rather engage into macroscopic Internet-wide behaviors.
6. Related Work
Several notable works have leveraged darknet data to understand IPv4 macroscopic activities; see, e.g., (wustrow2010internet, 51, 17, 45, 31, 13, 42, 4, 37, 28, 3). For instance, network telescopes have been employed to study malware and botnet outbreaks (antonakakis2017understanding, 3, 4, 13), network outages (10.1145/2068816.2068818, 14, 24), distributed denial of service attacks (DDoS) (Moore:2006:IID:1132026.1132027, 39, 31), trends in Internet-wide scanning (durumeric2014internet, 17, 37), misconfigurations (wustrow2010internet, 51, 11), address usage (benson2015leveraging, 5, 12), etc. Leveraging the large “aperture” offered by large Darknets (i.e., ones that monitor hundreds of thousands or even millions of dark IPs), one can detect even moderately paced scans within only a few seconds with very high probability (assuming uniform scans—see (caida_telescope_report, 38)).
Our study is closest to the works of Durumeric et al. (durumeric2014internet, 17) and Richter et al. (richter2019scanning, 45). Scanning trends have changed since these studies were conducted (2014 and 2019, respectively), and we document some differences in Section 5. To the best of our knowledge, this study is the first that quantifies the network impact of aggressive Internet-wide scanners. We note though that we have not examined IPv6 scanners (10.1145/2504730.2504732, 11, 46) nor their impact. The recent work in (10.1145/3517745.3561452, 46) studies such scanners through the lens of a large Content Delivery Network and available firewall logs. We leave analysis of AH IPv6 scanners as future work.
7. Conclusions
The paper studies a germane sub-population of Internet-wide IPs, namely the AH observed at the ORION NT. The impact on the network of these AH, as shown in the paper, is surprisingly high. Thus, understanding their behavior is important, with the tangible goal of potentially blocking malicious ones (e.g., the non-ACKed ones) either at the “edge” of an ISP or as they transit the Internet. An important security implication of these AH, which are intense and persistent, is that they are more likely to succeed in finding the vulnerabilities they seek. Further, from a network performance perspective, a critical consequence is that high packet rates (see Figure 1) from these AH could lead to service degradation akin to ones occurring during DoS attacks. Thus, raising awareness towards them is important; we plan to share curated lists of these AH with the community on a regular basis.
We offer three concrete methodologies on how to identify AH. With the proposed methodologies we aim at obtaining “quality lists” of scanners, minimizing false positives due to spoofing or misconfigurations. Further, succinct AH lists have practical implications: engineers that would consider blocking Internet-wide scanners are likely to focus anyways on the top ones in order to minimize the risk of blocking legitimate traffic due to DHCP IP churn and NAT considerations (10.1007/978-3-319-45719-2_7, 50). In fact, as Figure 6 (right, Zipf-like distribution) in the Appendix shows, even starting by blocking a small amount of AH, a large fraction of the problem is ameliorated.
Future plans include further investigating the impact of the aggressive hitters on more networks beyond the academic ones studied here. In addition, by examining AH observed at additional vantage points (e.g., other large Darknets), we are aiming to further validate that there is no bias in our existing results. The fact that we identified AH using Merit’s “dark” IP space and that these AH contribute an important traffic portion at a completely different network (i.e., CU campus) points towards no selection bias. We leave analysis of heavy IPv6 scanners as part of future work, along with further characterizations of the IPv4 AH population.
References
- (1) David Adrian, Karthikeyan Bhargavan, Zakir Durumeric, Pierrick Gaudry, Matthew Green, J. Halderman, Nadia Heninger, Drew Springall, Emmanuel Thomé, Luke Valenta, Benjamin VanderSloot, Eric Wustrow, Santiago Zanella-Béguelin and Paul Zimmermann “Imperfect Forward Secrecy: How Diffie-Hellman Fails in Practice” In Proceedings of the 22nd ACM SIGSAC Conference on Computer and Communications Security, CCS ’15 Denver, Colorado, USA: Association for Computing Machinery, 2015, pp. 5–17 DOI: 10.1145/2810103.2813707
- (2) “Anonymous”, https://bit.ly/3GU2a0q, 2022
- (3) Manos Antonakakis, Tim April, Michael Bailey, Matt Bernhard, Elie Bursztein, Jaime Cochran, Zakir Durumeric, J. Halderman, Luca Invernizzi, Michalis Kallitsis, Deepak Kumar, Chaz Lever, Zane Ma, Joshua Mason, Damian Menscher, Chad Seaman, Nick Sullivan, Kurt Thomas and Yi Zhou “Understanding the Mirai Botnet” In 26th USENIX Security Symposium (USENIX Security 17) Vancouver, BC: USENIX Association, 2017, pp. 1093–1110 URL: https://www.usenix.org/conference/usenixsecurity17/technical-sessions/presentation/antonakakis
- (4) Tao Ban, Lei Zhu, Jumpei Shimamura, Shaoning Pang, Daisuke Inoue and Koji Nakao “Detection of Botnet Activities Through the Lens of a Large-Scale Darknet” In Neural Information Processing Cham: Springer International Publishing, 2017, pp. 442–451
- (5) Karyn Benson, Alberto Dainotti, Kc Claffy, Alex C Snoeren and Michael Kallitsis “Leveraging internet background radiation for opportunistic network analysis” In Proceedings of the 2015 Internet Measurement Conference, 2015, pp. 423–436
- (6) Jack Cable, Drew Gregory, Liz Izhikevich and Zakir Durumeric “Stratosphere: Finding Vulnerable Cloud Storage Buckets”, RAID ’21 San Sebastian, Spain: Association for Computing Machinery, 2021, pp. 399–411 DOI: 10.1145/3471621.3473500
- (7) Xue Cai and John Heidemann “Understanding Block-Level Address Usage in the Visible Internet” In Proceedings of the ACM SIGCOMM 2010 Conference, SIGCOMM ’10 New Delhi, India: Association for Computing Machinery, 2010, pp. 99–110 DOI: 10.1145/1851182.1851196
- (8) Dvir Cohen, Yisroel Mirsky, Manuel Kamp, Tobias Martin, Yuval Elovici, Rami Puzis and Asaf Shabtai “DANTE: A Framework for Mining and Monitoring Darknet Traffic” In Computer Security – ESORICS 2020 Cham: Springer International Publishing, 2020, pp. 88–109
- (9) Michael Collins “Acknowledged Scanners” https://gitlab.com/mcollins_at_isi/acknowledged_scanners (Last accessed: June 7th, 2022), 2022
- (10) Jakub Czyz, Michael Kallitsis, Manaf Gharaibeh, Christos Papadopoulos, Michael Bailey and Manish Karir “Taming the 800 Pound Gorilla: The Rise and Decline of NTP DDoS Attacks” In Proceedings of the 2014 Conference on Internet Measurement Conference, IMC ’14 Vancouver, BC, Canada: ACM, 2014, pp. 435–448 DOI: 10.1145/2663716.2663717
- (11) Jakub Czyz, Kyle Lady, Sam G. Miller, Michael Bailey, Michael Kallitsis and Manish Karir “Understanding IPv6 Internet Background Radiation” In Proceedings of the 2013 Conference on Internet Measurement Conference, IMC ’13 Barcelona, Spain: Association for Computing Machinery, 2013, pp. 105–118 DOI: 10.1145/2504730.2504732
- (12) Alberto Dainotti, Karyn Benson, Alistair King, kc , Michael Kallitsis, Eduard Glatz and Xenofontas Dimitropoulos “Estimating Internet Address Space Usage through Passive Measurements” In SIGCOMM Comput. Commun. Rev. 44.1 New York, NY, USA: Association for Computing Machinery, 2014, pp. 42–49 DOI: 10.1145/2567561.2567568
- (13) Alberto Dainotti, Alistair King, kc Claffy, Ferdinando Papale and Antonio Pescapè “Analysis of a ”/0” Stealth Scan from a Botnet” In Proceedings of the 2012 Internet Measurement Conference, IMC ’12 Boston, Massachusetts, USA: Association for Computing Machinery, 2012, pp. 1–14 DOI: 10.1145/2398776.2398778
- (14) Alberto Dainotti, Claudio Squarcella, Emile Aben, Kimberly C. Claffy, Marco Chiesa, Michele Russo and Antonio Pescapé “Analysis of Country-Wide Internet Outages Caused by Censorship” In Proceedings of the 2011 ACM SIGCOMM Conference on Internet Measurement Conference, IMC ’11 Berlin, Germany: Association for Computing Machinery, 2011, pp. 1–18 DOI: 10.1145/2068816.2068818
- (15) Zakir Durumeric, David Adrian, Ariana Mirian, Michael Bailey and J. Halderman “A Search Engine Backed by Internet-Wide Scanning”, CCS ’15 Denver, Colorado, USA: Association for Computing Machinery, 2015, pp. 542–553 DOI: 10.1145/2810103.2813703
- (16) Zakir Durumeric, David Adrian, Ariana Mirian, James Kasten, Elie Bursztein, Nicolas Lidzborski, Kurt Thomas, Vijay Eranti, Michael Bailey and J. Halderman “Neither Snow Nor Rain Nor MITM…: An Empirical Analysis of Email Delivery Security”, IMC ’15 Tokyo, Japan: Association for Computing Machinery, 2015, pp. 27–39 DOI: 10.1145/2815675.2815695
- (17) Zakir Durumeric, Michael Bailey and J Alex Halderman “An Internet-Wide View of Internet-Wide Scanning” In 23rd USENIX Security Symposium (USENIX Security 14), 2014, pp. 65–78
- (18) Zakir Durumeric, James Kasten, Michael Bailey and J. Halderman “Analysis of the HTTPS Certificate Ecosystem” In Proceedings of the 2013 Conference on Internet Measurement Conference, IMC ’13 Barcelona, Spain: Association for Computing Machinery, 2013, pp. 291–304 DOI: 10.1145/2504730.2504755
- (19) Zakir Durumeric, Frank Li, James Kasten, Johanna Amann, Jethro Beekman, Mathias Payer, Nicolas Weaver, David Adrian, Vern Paxson, Michael Bailey and J. Halderman “The Matter of Heartbleed” In Proceedings of the 2014 Conference on Internet Measurement Conference, IMC ’14 Vancouver, BC, Canada: Association for Computing Machinery, 2014, pp. 475–488 DOI: 10.1145/2663716.2663755
- (20) Zakir Durumeric, Eric Wustrow and J Alex Halderman “ZMap: Fast Internet-wide Scanning and Its Security Applications” In 22nd USENIX Security Symposium (USENIX Security 13), 2013, pp. 605–620
- (21) Petros Gigis, Matt Calder, Lefteris Manassakis, George Nomikos, Vasileios Kotronis, Xenofontas Dimitropoulos, Ethan Katz-Bassett and Georgios Smaragdakis “Seven Years in the Life of Hypergiants’ off-Nets” In Proceedings of the 2021 ACM SIGCOMM 2021 Conference, SIGCOMM ’21 Virtual Event, USA: Association for Computing Machinery, 2021, pp. 516–533 DOI: 10.1145/3452296.3472928
- (22) Robert Graham “MASSCAN: Mass IP port scanner” https://github.com/robertdavidgraham/masscan
- (23) “GreyNoise”, https://www.greynoise.io/, 2022
- (24) Andreas Guillot, Romain Fontugne, Philipp Winter, Pascal Merindol, Alistair King, Alberto Dainotti and Cristel Pelsser “Chocolatine: Outage Detection for Internet Background Radiation” In 2019 Network Traffic Measurement and Analysis Conference (TMA), 2019, pp. 1–8 DOI: 10.23919/TMA.2019.8784607
- (25) Chansu Han, Jun’ichi Takeuchi, Takeshi Takahashi and Daisuke Inoue “Dark-TRACER: Early Detection Framework for Malware Activity Based on Anomalous Spatiotemporal Patterns” In IEEE Access 10, 2022, pp. 13038–13058 DOI: 10.1109/ACCESS.2022.3145966
- (26) John S. Heidemann, Lin Quan and Yuri Pradkin “A Preliminary Analysis of Network Outages During Hurricane Sandy”, 2012
- (27) Nadia Heninger, Zakir Durumeric, Eric Wustrow and J. Halderman “Mining Your Ps and Qs: Detection of Widespread Weak Keys in Network Devices”, Security’12 Bellevue, WA: USENIX Association, 2012, pp. 35
- (28) Raphael Hiesgen, Marcin Nawrocki, Alistair King, Alberto Dainotti, Thomas C Schmidt and Matthias Wählisch “Spoki: Unveiling a new wave of scanners through a reactive network telescope” In 31st USENIX Security Symposium (USENIX Security 22), 2022, pp. 431–448
- (29) Liz Izhikevich, Gautam Akiwate, Briana Berger, Spencer Drakontaidis, Anna Ascheman, Paul Pearce, David Adrian and Zakir Durumeric “ZDNS: A Fast DNS Toolkit for Internet Measurement”, IMC ’22 Nice, France: Association for Computing Machinery, 2022, pp. 33–43 DOI: 10.1145/3517745.3561434
- (30) Liz Izhikevich, Renata Teixeira and Zakir Durumeric “LZR: Identifying Unexpected Internet Services” In 30th USENIX Security Symposium (USENIX Security 21), 2021, pp. 3111–3128
- (31) Mattijs Jonker, Alistair King, Johannes Krupp, Christian Rossow, Anna Sperotto and Alberto Dainotti “Millions of Targets under Attack: A Macroscopic Characterization of the DoS Ecosystem” In Proceedings of the 2017 Internet Measurement Conference, IMC ’17 London, United Kingdom: Association for Computing Machinery, 2017, pp. 100–113 DOI: 10.1145/3131365.3131383
- (32) Andreas Klopsch, Chris Dietrich and Raphael Springer “A detailed look into the Mozi P2P IoT botnet”, https://www.botconf.eu/botconf-2020/schedule/, 2020
- (33) Thomas Krenc, Oliver Hohlfeld and Anja Feldmann “An Internet Census Taken by an Illegal Botnet: A Qualitative Assessment of Published Measurements” New York, NY, USA: Association for Computing Machinery, 2014, pp. 103–111 DOI: 10.1145/2656877.2656893
- (34) Vector Guo Li, Matthew Dunn, Paul Pearce, Damon McCoy, Geoffrey M. Voelker and Stefan Savage “Reading the Tea leaves: A Comparative Analysis of Threat Intelligence” In 28th USENIX Security Symposium (USENIX Security 19) Santa Clara, CA: USENIX Association, 2019, pp. 851–867 URL: https://www.usenix.org/conference/usenixsecurity19/presentation/li
- (35) Artur Marzano, David Alexander, Osvaldo Fonseca, Elverton Fazzion, Cristine Hoepers, Klaus Steding-Jessen, Marcelo H… Chaves, Italo Cunha, Dorgival Guedes and Wagner Meira “The Evolution of Bashlite and Mirai IoT Botnets” In 2018 IEEE Symposium on Computers and Communications (ISCC), 2018, pp. 00813–00818 DOI: 10.1109/ISCC.2018.8538636
- (36) Merit Network, Inc. “ORION: Observatory for Cyber-Risk Insights and Outages of Networks”, https://github.com/Merit-Research/darknet-events/wiki/ORION-Network-Telescope, 2022
- (37) A. Mirian, Z. Ma, D. Adrian, M. Tischer, T. Chuenchujit, T. Yardley, R. Berthier, J. Mason, Z. Durumeric, J.. Halderman and M. Bailey “An Internet-wide view of ICS devices” In 2016 14th Annual Conference on Privacy, Security and Trust (PST), 2016, pp. 96–103 DOI: 10.1109/PST.2016.7906943
- (38) D. Moore, C. Shannon, G. Voelker and S. Savage “Network Telescopes: Technical Report”, 2004
- (39) David Moore, Colleen Shannon, Douglas J. Brown, Geoffrey M. Voelker and Stefan Savage “Inferring Internet Denial-of-service Activity” In ACM Trans. Comput. Syst. 24.2 New York, NY, USA: ACM, 2006, pp. 115–139 DOI: 10.1145/1132026.1132027
- (40) Giovane C.. Moura, Carlos Gañán, Qasim Lone, Payam Poursaied, Hadi Asghari and Michel Eeten “How dynamic is the ISPs address space? Towards internet-wide DHCP churn estimation” In 2015 IFIP Networking Conference (IFIP Networking), 2015, pp. 1–9 DOI: 10.1109/IFIPNetworking.2015.7145335
- (41) Ramakrishna Padmanabhan, Arturo Filastò, Maria Xynou, Ram Sundara Raman, Kennedy Middleton, Mingwei Zhang, Doug Madory, Molly Roberts and Alberto Dainotti “A Multi-Perspective View of Internet Censorship in Myanmar” In Proceedings of the ACM SIGCOMM 2021 Workshop on Free and Open Communications on the Internet, FOCI ’21 Virtual Event, USA: Association for Computing Machinery, 2021, pp. 27–36 DOI: 10.1145/3473604.3474562
- (42) Ramakrishna Padmanabhan, Aaron Schulman, Alberto Dainotti, Dave Levin and Neil Spring “How to Find Correlated Internet Failures” In Passive and Active Measurement Cham: Springer International Publishing, 2019, pp. 210–227
- (43) Paul Pearce, Roya Ensafi, Frank Li, Nick Feamster and Vern Paxson “Augur: Internet-Wide Detection of Connectivity Disruptions” In 2017 IEEE Symposium on Security and Privacy (SP), 2017, pp. 427–443 DOI: 10.1109/SP.2017.55
- (44) Lin Quan, John Heidemann and Yuri Pradkin “Detecting internet outages with precise active probing (extended)” In USC/Information Sciences Institute, Tech. Rep, 2012
- (45) Philipp Richter and Arthur Berger “Scanning the scanners: Sensing the internet from a massively distributed network telescope” In Proceedings of the Internet Measurement Conference, 2019, pp. 144–157
- (46) Philipp Richter, Oliver Gasser and Arthur Berger “Illuminating Large-Scale IPv6 Scanning in the Internet”, IMC ’22 Nice, France: Association for Computing Machinery, 2022, pp. 410–418 DOI: 10.1145/3517745.3561452
- (47) Morteza Safaei Pour, Elias Bou-Harb, Kavita Varma, Nataliia Neshenko, Dimitris A. Pados and Kim-Kwang Raymond Choo “Comprehending the IoT Cyber Threat Landscape: A Data Dimensionality Reduction Technique to Infer and Characterize Internet-Scale IoT Probing Campaigns” In Digit. Investig. 28.S NLD: Elsevier Science Publishers B. V., 2019, pp. S40–S49 DOI: 10.1016/j.diin.2019.01.014
- (48) George Arnold Sullivan, Jackson Sippe, Nadia Heninger and Eric Wustrow “Open to a fault: On the passive compromise of TLS keys via transient errors” In 31st USENIX Security Symposium (USENIX Security 22) Boston, MA: USENIX Association, 2022, pp. 233–250 URL: https://www.usenix.org/conference/usenixsecurity22/presentation/sullivan
- (49) Ram Sundara Raman, Prerana Shenoy, Katharina Kohls and Roya Ensafi “Censored Planet: An Internet-Wide, Longitudinal Censorship Observatory”, CCS ’20 Virtual Event, USA: Association for Computing Machinery, 2020, pp. 49–66 DOI: 10.1145/3372297.3417883
- (50) Kurt Thomas, Rony Amira, Adi Ben-Yoash, Ori Folger, Amir Hardon, Ari Berger, Elie Bursztein and Michael Bailey “The Abuse Sharing Economy: Understanding the Limits of Threat Exchanges” In Research in Attacks, Intrusions, and Defenses Cham: Springer International Publishing, 2016, pp. 143–164
- (51) Eric Wustrow, Manish Karir, Michael Bailey, Farnam Jahanian and Geoff Huston “Internet background radiation revisited” In Proceedings of the 10th ACM SIGCOMM conference on Internet measurement, 2010, pp. 62–74
Appendix A Appendix
Supplementary results for Section 3.
Table 7
summarizes AH population findings for all definitions and datasets,
and illustrates the intersection of yearly scanners found for all
definitions within the two datasets.
Supplementary results for Section 4.
Table 8 provides a detailed view of the number of hitters that were identified
using the ORION NT and the portion of those that were observed at each vantage point / router.
Figure 5 validates (in accordance with Table 3)
that the actions of the AH are similar across both the Darknet and the Flows datasets.
Supplementary results for Section 5.
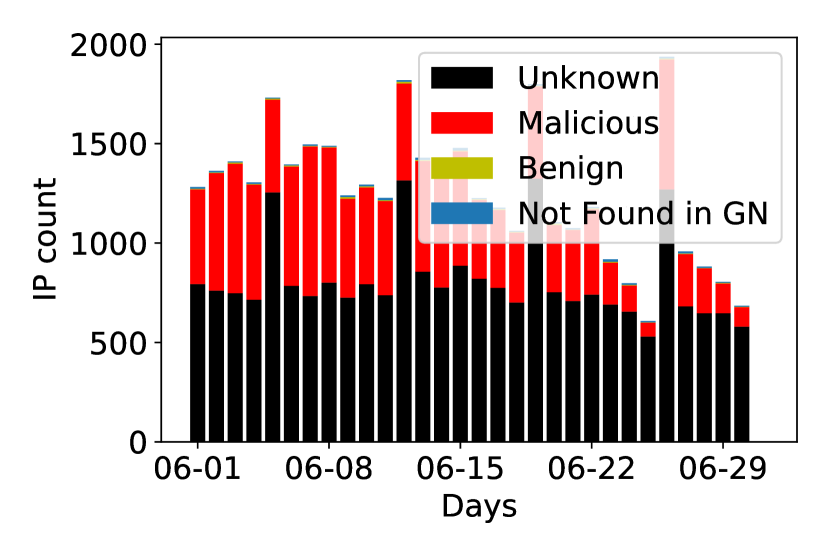
To shed more light into the AH, we remove the ACKed scanners
and focus on the remaining, presumably malicious, hosts. We leverage GN’s threat intelligence
database to obtain insights. Figure 6 (left) depicts the results
in which we consider AH identified in June 2022.
We conclude that i) a large fraction of the detected AH are indeed
malicious, ii) the majority are of unknown intentions (thus, merit
further investigation), iii) the benign scanners not removed by our ACKed
scanners filter are very few (hence, the (ackedscanners, 9) lists
are quite comprehensive) and iv) almost all AH identified in ORION NT are
also present in GN, suggesting this population is indeed primarily
engaged in Internet-wide activities. Table 9
zooms-into the top-20 “tags” that characterize the set of AH in ORION NT that are
not ACKed scanners. We observe that a large fraction of these non-ACKed AH are
indeed associated with malicious activities (w.g., Mirai-related scanners, worms, etc.).
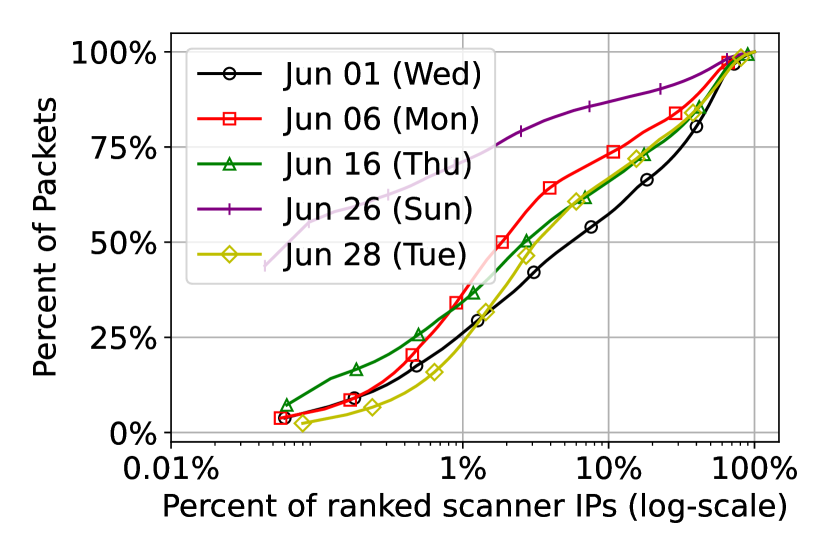
Figure 6 indicates that even a small number of AH is responsible for high packet volumes.
Acknowledgements.
We thank the reviewers for all their useful feedback. This work was partially supported by awards NSF CNS-1823192 and NSF CNS-2120400.
| Darknet-1 | D1 | D2 | D3 | D1 D2 | D2 D3 | D1 D3 | D1 D2 D3 |
|---|---|---|---|---|---|---|---|
| IP | 158681 | 159159 | 3971 | 142012 | 461 | 426 | 407 |
| ASN | 7040 | 6906 | 439 | 6649 | 364 | 361 | 353 |
| Org | 6748 | 6906 | 429 | 6368 | 356 | 351 | 344 |
| Country | 198 | 197 | 80 | 194 | 80 | 80 | 80 |
| Darknet-2 | D1 | D2 | D3 | D1 D2 | D2 D3 | D1 D3 | D1 D2 D3 |
| IP | 155010 | 295204 | 946 | 155010 | 142 | 122 | 122 |
| ASN | 5272 | 7837 | 81 | 5272 | 78 | 74 | 74 |
| Org | 5013 | 7470 | 75 | 5013 | 72 | 68 | 68 |
| Country | 183 | 201 | 25 | 183 | 25 | 25 | 25 |
| Darknet | Router-1 | Router-2 | Router-3 | ||||||||||
|---|---|---|---|---|---|---|---|---|---|---|---|---|---|
| # of AH | Percentage (%) | Percentage (%) | Percentage (%) | ||||||||||
| D1 | D2 | D3 | D1 | D2 | D3 | D1 | D2 | D3 | D1 | D2 | D3 | ||
| Flow-1 | 01-15 | 4756 | 7058 | 71 | 97.5% | 97.3% | 100% | 96.0% | 95.2% | 100% | 49.4% | 48.3% | 78.9% |
| 01-16 | 5413 | 7794 | 69 | 99.7% | 99.6% | 100% | 98.4% | 97.8% | 100% | 51.8% | 51.1% | 82.6% | |
| 01-17 | 5466 | 7761 | 69 | 99.9% | 99.7% | 100% | 98.2% | 97.6% | 100% | 51.9% | 51.4% | 84.1% | |
| 01-18 | 5484 | 7879 | 66 | 99.7% | 99.4% | 100% | 97.8% | 97.1% | 100% | 49.9% | 49.0% | 87.9% | |
| 01-19 | 4890 | 7361 | 78 | 99.7% | 99.5% | 100% | 98.2% | 96.4% | 98.7% | 52.0% | 51.4% | 75.6% | |
| 01-20 | 4773 | 7349 | 75 | 99.6% | 99.4% | 100% | 97.7% | 95.9% | 100% | 51.4% | 50.5% | 80.% | |
| 01-21 | 4662 | 7133 | 92 | 99.6% | 99.4% | 100% | 98.0% | 96.0% | 100% | 51.4% | 50.3% | 77.2% | |
| Flow-2 | 10-01 | 2162 | 3462 | 50 | 94.6% | 92.1% | 100% | 93.7% | 91.1% | 100% | 20.0% | 19.6% | 44.0% |
| Rank | GreyNoise Tags | IP Count |
|---|---|---|
| #1 | ZMap Client | 13535 |
| #2 | Web Crawler | 11661 |
| #3 | Mirai | 8955 |
| #4 | Docker Scanner | 4476 |
| #5 | Kubernetes Crawler | 4466 |
| #6 | SSH Bruteforcer | 1902 |
| #7 | TLS/SSL Crawler | 1682 |
| #8 | SSH Worm | 1540 |
| #9 | Shenzhen TVT Bruteforcer | 1516 |
| #10 | Go HTTP Client | 774 |
| #11 | Python Requests Client | 765 |
| #12 | Telnet Bruteforcer | 720 |
| #13 | JAWS Webserver RCE | 693 |
| #14 | Ping Scanner | 652 |
| #15 | Sipvicious | 624 |
| #16 | Looks Like RDP Worm | 509 |
| #17 | Carries HTTP Referer | 454 |
| #18 | SMBv1 Crawler | 394 |
| #19 | Hadoop Yarn Worm | 360 |
| #20 | Miniigd UPnP Worm CVE-2014-8361 | 344 |