Reproducible biomarkers: Leveraging nonlinear descriptors in the face of non-ergodicity
Abstract
Any reliable biomarker has to be specific, generalizable, and reproducible across individuals and contexts. The exact values of such a biomarker must represent similar health states in different individuals and at different times within the same individual to result in the minimum possible false-positive and false-negative rates. The application of standard cut-off points and risk scores across populations hinges upon the assumption of such generalizability. Such generalizability, in turn, hinges upon this condition that the phenomenon investigated by current statistical methods is ergodic, i.e., its statistical measures converge over individuals and time within the finite limit of observations. However, emerging evidence indicates that biological processes abound with non-ergodicity, threatening this generalizability. Here, we present a solution for how to make generalizable inferences by deriving ergodic descriptions of non-ergodic phenomena. For this aim, we proposed capturing the origin of ergodicity-breaking in many biological processes: cascade dynamics. To assess our hypotheses, we embraced the challenge of identifying reliable biomarkers for heart disease and stroke, which, despite being the leading cause of death worldwide and decades of research, lacks reliable biomarkers and risk stratification tools. We showed that raw R-R interval data and its common descriptors based on mean and variance are non-ergodic and non-specific. On the other hand, the cascade-dynamical descriptors, the Hurst exponent encoding linear temporal correlations, and multifractal nonlinearity encoding nonlinear interactions across scales described the non-ergodic heart rate variability ergodically and were specific. This study inaugurates applying the critical concept of ergodicity in discovering and applying digital biomarkers of health and disease.
Introduction
Heart disease and stroke are the leading causes of disease and disability globally and in the United States, claiming American lives every year—one in four deaths [1, 2]. This staggering toll of cardiovascular diseases does not end here, as it costs the nation over billion annually in direct medical expenses and lost productivity. This colossal burden highlights the importance of early diagnosis and intervention of heart disease and stroke. One of the primary requisites for effective diagnosis is the availability of specific and reliable biomarkers. Although numerous biomarkers, risk stratification models, and risk scores for various cardiovascular diseases have been proposed over the past decades, effective diagnostic and prognostic digital biomarkers are still missing [3, 4, 5]. The urgency of addressing this need is amplified by the rise and ever-growing expansion of diverse digital health and telehealth solutions in recent years, specifically in the cardiovascular field [6, 7, 8]. Such solutions, like mobile applications (mhealth), smart watches, wearable devices, implantable electronic devices, and implantable hemodynamic monitors, enable the gathering of vast amounts of data for everyone; however, the lack of diagnostic and prognostic biomarkers lays waste to this ability as such valuable amounts of data cannot be appropriately used. Lack of evidence of effect has been cited as one of the reasons why digital health technologies have not been widely employed in clinical settings [9]. The lack of reliable digital biomarkers can be considered one of the main contributors to this lack of evidence.
Heart rate variability (HRV) has been one of the key noninvasive biomarkers of cardiovascular health [10]. It measures the fluctuations and variations in time intervals between successive heartbeats or R-R intervals (RRi). HRV is an emergent phenomenon that emerges out of the complex and nonlinear interactions between the cardiovascular and nervous systems [11, 12, 13] and represents the peripheral output of the central autonomic network (CAN) and the capacity for behavioral adaption to environmental stresses [14, 15, 16, 17, 18, 19, 20, 21, 22]. Because it emerges from such complex and integral interactions, HRV can be a representative marker of cardiovascular health. Healthy human HRV indicates desirable balance and interaction between the functions of the sympathetic and parasympathetic nervous systems [23, 24, 25]. Group-level findings have shown that abnormal HRV indicates an imbalance between the two systems, among other pathophysiologies, and is associated with an increased risk of heart disease, including myocardial infarction, heart failure, and sudden cardiac death [26, 27, 28, 29, 30, 31, 32, 33, 34, 35, 36, 37]. HRV is also a potential predictor of morbidity and mortality in other diverse disorders, including type diabetes [38, 39, 40, 41, 42], chronic obstructive pulmonary disease (COPD) [43, 44, 45, 46, 47], chronic kidney disease (CKD) [48, 49, 50, 51, 52], dementia [53], depressive disorders [54, 55], anxiety and stress disorders [56, 20], obsessive compulsive disorder [57], autism spectrum disorders [58], and attention-deficit/hyperactivity disorder [59]. Some studies have suggested that HRV might be superior to many other biomarkers in representing the overall state of health and well-being [60, 61]. These developments have sparked considerable optimism surrounding the potential of heart rate-sensing wearable devices to detect and track cardiovascular diseases [62, 63, 64, 65, 66, 67, 68].
Although the emergence of HRV out of complex and intricate interactions confers HRV such an ability to represent the state of the body, it also makes its appropriate application as a digital biomarker replete with nuances. Analyses of heartbeat dynamics and HRV reveal significant nonlinearity, non-Gaussianity, and chaotic behaviors in RRi series [69, 70, 71, 72, 73, 74, 75, 76, 77, 78, 79, 80, 81, 82, 83]. These statistical signatures of nonlinearity, non-Gaussianity, and chaotic behaviors in RRi can be interpreted as manifestations of the emergence of HRV from interdependent and bidirectional interactions across multiple timescales. Such processes which lead to multiplicative fluctuations and dynamics have been termed multifractal cascades [84, 85, 86, 87, 88]. The cascade dynamical nature of HRV, like many other behavioral and physiological functions [89, 90, 91, 92, 93, 94, 95], inclines many of its measurements and descriptors toward a characteristic that has been, unfortunately, grossly overlooked in the biomedical literature: ergodicity. We believe the overlooking of ergodicity has hindered the broad application of HRV probably much more than the other challenges which have been discussed regarding HRV, like analytical challenges associated with data variability, missing data and artifacts, and lack of theory for data interpretation [96, 97, 98, 99, 100, 101, 102, 103, 104, 105, 106, 107].
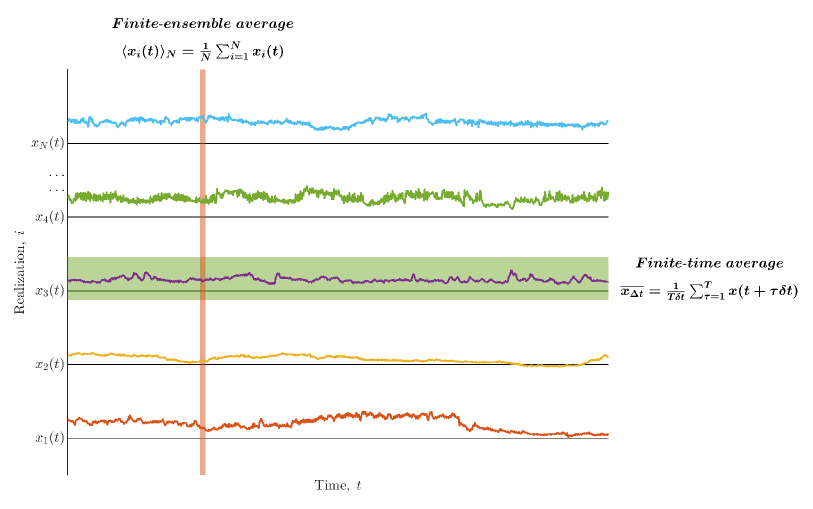
Ergodicity is an essential requirement of a digital biomarker to be applied reliably in current medical practice. Similar values of a digital biomarker across different individuals must represent similar bodily states. In other words, standard cut-off points of such a biomarker must reliably separate the states of health and disease in each different individual. The importance of this requirement is highlighted when we pay attention to the research designs and statistical practices that have dominated scientific investigations for about a century. These research designs and statistical practices were devised in the twentieth century by pioneers like Francis Galton [108, 109], Karl Pearson [110], Ronald Fisher [111, 112, 113], Jerzy Neyman [110], Egon Pearson[110], and Udny Yule [114]. Based on these practices, most medical research, similar to most biological, psychological, and social research, has been aggregating the data gathered from randomly selected groups of individuals and used group-based statistical methods to reach conclusions. Such conclusions are then deemed generalizable to the behaviors of different individuals across different contexts. However, ergodicity is a requisite of this generalizability from group-level data to an individual’s behaviors. In non-ergodic measurements, the behaviors of an individual at a specific time diverge from the average of that measurement across a group of individuals and also the average of that individual’s behaviors over an extended period [115, 116, 117, 118]. Ergodicity refers to the convergence of these two averages: the finite-ensemble average and the finite-time average (Fig. 1). The finite-ensemble average, which is also recognized as the “sample average,” is
| (1) |
where is the th of individual cases of included in the finite-ensemble average. The finite-time average, which biomedical discourse recognizes as the “average performance/trajectory of the individual,” is
| (2) |
for continuous change. The finite-time average when the measured behavior changes at discrete times is
| (3) |
So, ergodicity is an equivalence between these two averages,
| (4) |
Another phrasing of the concept of ergodicity is that ergodic systems visit all of their possible states—in a sense, ergodic systems do not have a deep sense of “history.” The criterion of “mixing” emphasizes this addition to the traditional interpretation of ergodicity. Mixing denotes independence of the states of a system across time in a way that all values of a stochastic process across all times would have equal probabilities [119]. This concept clarifies why emerging experimental data suggests that the processes related to organisms teem with, and probably are even dominated by, non-ergodicity [120, 121, 122], although the inferences of the majority of biological, psychological, and social studies in the past century have been based on this implicit presupposition that the processes they study and their measurements are ergodic. Biological processes teem with properties like interactions across space and time scales [88, 84], historical contingency [123, 124], and context dependency to break ergodicity [117]. Consider the exemplary biological process we have chosen in this study: HRV. As we mentioned earlier, data strongly suggests that heartbeat dynamics and HRV have a cascade dynamical nature and emerge from interdependent and bidirectional interactions across scales [69, 70, 71, 72, 73, 74, 75, 76, 77, 78, 79, 80, 81, 82, 83]. Also, HRV and many of its descriptors highly depend on various individual, contextual, and measurement factors such as sex [125], age [126, 127, 128], aerobic fitness and physical activity [129, 130, 75], smoking [131, 132], consumption of coffee [132] and alcohol [133], medications [132], environmental noise and CO concentrations [133], respiration [134, 104], pace of breathing [135], times of sleep [136], posture [137, 138], the length of the observation period [139], the time of measurement [75, 140], the used detection method [141], sampling frequency [142], and procedures of processing and removing artifacts [143, 144, 145, 146]. Such historical contingency and context-dependency of HRV and other biological processes generally lead to non-ergodicity and lack of generalizability from group-level findings to individuals [118, 117].
The concern for ergodicity is evident in the application of HRV. An appropriate diagnosis and risk stratification based on HRV depends on two conditions: First, the limited data gathered during the visits, consultations, or laboratory assays should sufficiently represent the states of the individual’s body over time. Second, the standard and established principles and cut-off points used to make decisions should be generalizable to that individual. These conditions have been taken for granted until now. However, as we discussed, evidence suggests that these conditions are probably violated because of non-ergodicity. Neglecting this violation can be detrimental; for instance, if screening is conducted on the entire general population, a minor increase in false positive rate can hugely raise subsequent medical tests and expenses [63, 99, 147]. An increased false-negative rate also implies delayed anticoagulant medication and increased risk of stroke in symptomatic or high-risk patients.
Our concern for ergodicity is not restricted to the application of HRV. We [119, 148, 118, 149], alongside a few others [120, 115, 116, 117], believe that ergodicity is an integral concept that undermines how scientific research across diverse fields has tried to identify cause-effect relationships. The breaking of ergodicity is abundant in biological processes and invalidates many conclusions of group-based research designs and statistical methods. Indeed, neglecting this non-ergodicity and lack of generalizability could be the leading cause of the reproducibility crisis [120, 118], which currently encompasses diverse fields from biomedical and psychological sciences to social sciences and economics [150, 151]. Specifically, in applying HRV as a biomarker of health and disease, some studies have suggested that the irreproducibility of results could be a critical problem [143, 144, 137, 152, 153, 140, 154, 146, 155, 156].
This study is an attempt in continuation of our previous works to obtain a solution to the problem of making generalizable inferences about non-ergodic processes. In this series of works, we first tried identifying sources of non-ergodicity in biological processes. Having recognized the abundance of multifractal and cascade dynamics in biological processes [89, 90, 91, 92, 93, 94, 95], we hypothesized that a potential source of non-ergodicity could be the emergence of many biological processes out of interdependent and bidirectional interactions across spatial and temporal scales, as in cascades. We observed phenomena that corroborated this hypothesis [119, 148, 149, 157]. Afterward, interestingly, we observed that descriptors that could capture the cascade-dynamical sources of ergodicity breaking in a process might provide ergodic descriptions of that process [119, 148, 149, 157].
Here, prompted by the huge amount of evidence that had suggested the multifractal and cascade-dynamical nature of HRV [69, 70, 71, 72, 73, 74, 75, 76, 77, 78, 79, 80, 81, 82, 83], We hypothesized that this nature of HRV leads to the non-ergodicity of this phenomenon. Consequently, We predicted that the linear commonly used descriptors of HRV and raw RRi series, like sample means and variances, would be non-ergodic and lack generalizability and reproducibility. Afterward, we hypothesized that descriptors that would capture the source of the non-ergodicity of HRV might provide ergodic descriptions of this non-ergodic phenomenon. Descriptors of the nonlinear, non-Gaussian, multifractal, and cascade-dynamical behaviors of HRV, some of which we had developed in our previous works, seemed worthy candidates [70, 158, 159, 74, 158, 75, 160, 161, 162, 163]. For this study, we chose descriptors of long-range correlations, , and multifractal nonlinearity, . We found strong support for our hypotheses.
Results
We analyzed the long-term ambulatory HRV in chronic heart failure (CHF) patients— survivors (age (meanSD) = years; women) and nonsurvivors ( years; women)—who died due to any cause within the follow-up period of months, and age-matched healthy older adults ( years; women). The endpoint was all-cause mortality. The majority of deaths () were cardiac-related, including death from progressive heart failure (), sudden death (), and acute myocardial infarction (). The remaining five patients died of sepsis (), pneumonia (), and stroke (). We reanalyzed HRV data from one of our previous published studies [161]. Table 1 summarizes the demographic and baseline clinical characteristics of the CHF patients.
| Characteristics | Nonsurvivors | Survivors |
|---|---|---|
| Age (years) | ||
| Sex (M/F) | ||
| New York Heart Association functional class | ||
| II | ||
| III-IV | ||
| Ischemia | ||
| Left ventricular ejection fraction (%) | ||
| BNP (pg/mL) | ||
| ln BNP | ||
| BUN (mg/dL) | ||
| ln BUN | ||
| Cr (mg/dL) | ||
| ln Cr | ||
| Medication at Holter recording | ||
| Beta-blocker | ||
| ACE/ARB | ||
| Loop diuretic | ||
| Spironolactone | ||
| Medication before hospital discharge | ||
| Beta-blocker | ||
| ACE/ARB | ||
| Loop diuretic | ||
| Spironolactone | ||
| Ventricular premature beats per hour |
BNP = brain natriuretic protein; BUN = blood urea nitrogen; Cr = creatinine; ACE = angiotensin-converting enzyme inhibitor; ARB = angiotensin II receptor blocker.
HRV breaks ergodicity
To examine the ergodic properties of the RRi series, we submitted the original RRi series and the corresponding shuffled versions to the Thirumalai-Mountain analysis [164, 165], which yields a dimensionless metric called the ergodicity breaking factor, ,
| (5) |
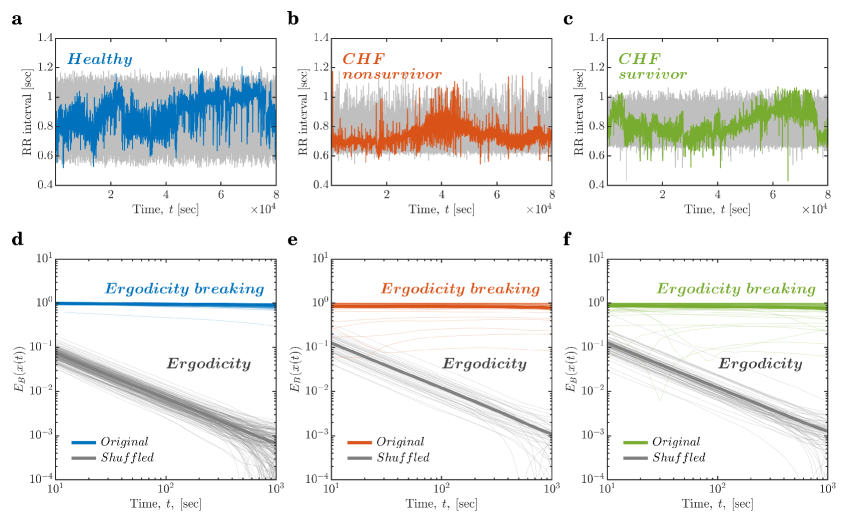
where is the time average mean-squared displacement of the stochastic series for lag time . Rapid decay of to a finite asymptotic value for progressively larger samples, i.e., as implies ergodicity. Slower decay indicates less ergodic systems in which trajectories are less reproducible. No decay or convergence to a finite asymptotic value indicates strong ergodicity breaking [166, 167]. thus allows testing whether a given series breaks ergodicity. for the original RRi series did not decay at all with , essentially remaining unchanged over a progressively longer time for healthy controls as well as the two patient groups (, and for healthy controls, CHF nonsurvivors, and CHF survivors, respectively; colored lines in Figs. 2d–f). These values of indicate strong ergodicity breaking in the original RRi series. In contrast, for the shuffled RRi series rapidly decayed to a finite asymptotic value, indicating ergodicity (, and for healthy controls, CHF nonsurvivors, and CHF survivors, respectively; grey lines in Figs. 2d–f). As by shuffling the original RRi series, the temporal structure and information of the RRi series are removed, these values of suggest that the very temporal structure of HRV is the source of non-ergodicity in HRV.
Linear descriptors based on mean and variance are non-ergodic
Now that we have witnessed ergodicity breaking in the raw RRi series, let us investigate the ergodic properties of some of the linear descriptors widely used in cardiovascular digital medicine: HRV parameters based on mean and variance [106]. Here, we chose the mean and root mean square of successive RR interval differences, hereinafter noted as and , respectively. Similar to the behavior of for the raw RRi series, for and did not decay at all over epochs (, and ; , and for healthy controls, CHF nonsurvivors, and CHF survivors, respectively). remained unchanged over a progressively larger number of epochs for all three groups (colored lines in Figs. 3a, c). In contrast, for and of the shuffled RRi series rapidly decayed to a finite asymptotic value (, and ; , and for healthy controls, CHF nonsurvivors, and CHF survivors, respectively; grey lines in Figs. 3a, c). In other words, and -based HRV parameters failed to provide ergodic descriptions of HRV. Furthermore, the contrast between behaviors of for the original and the shuffled RRi series indicates that the very temporal structure of HRV contributes to this failure.
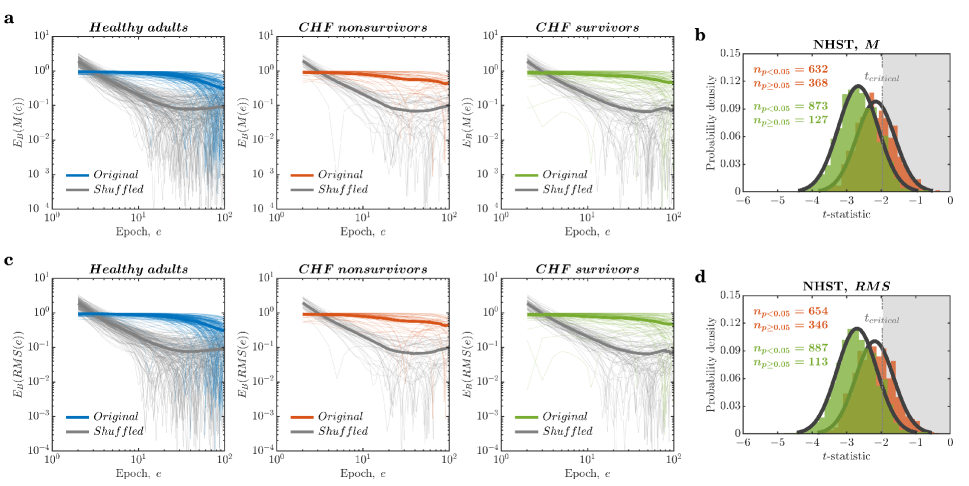
To test the specificity and reliability of these HRV parameters, we also performed Monte Carlo simulations by randomly sampling the -sample RRi series from the -hour recordings for each individual and performing one-way ANOVA tests separately on these series’ and values. We repeated this process times. One-way ANOVAs failed to detect reduced of HRV due to the CHF, and times in nonsurvivors (red histogram in Fig. 3b) and survivors (green histogram in Fig. 3b), respectively, compared to healthy controls. Likewise, one-way ANOVAs failed to detect reduced of HRV due to the CHF, and times in nonsurvivors (red histogram in Fig. 3d) and survivors (green histogram in Fig. 3d), respectively, compared to healthy controls. In other words, we found a high likelihood of failing to identify statistically significant differences among the three groups’ and . These results confirm that linear descriptors and cannot be used as reliable HRV parameters for digital biomarkers of health and disease.
Linear descriptors and are only weakly ergodic but not specific
The number of adjacent RR intervals that differ by more than milliseconds and the percentage of such RR intervals are two other linear descriptors widely used as HRV parameters [106]. for and had similar behavior to that of the shuffled RRi series; however, had a shallower initial decay for and with a progressively larger number of epochs (, and ; , and for healthy controls, CHF nonsurvivors, and CHF survivors, respectively). Eventually, reached an asymptotic finite but a relatively larger value over a progressively larger number of epochs (colored lines in Fig. 4a, c). These and curves were only marginally shallower than those for the epoch series of and for the shuffled RRi series (, and ; , and for healthy controls, CHF nonsurvivors, and CHF survivors, respectively; grey lines in Fig. 4a, c). Thus, and break ergodicity only weakly, providing more ergodic descriptions of the non-ergodic HRV than the previous two linear descriptors, and . Again, the contrast between the original and shuffled RRi series indicates that the very temporal structure of HRV contributes to this weak ergodicity breaking by and .
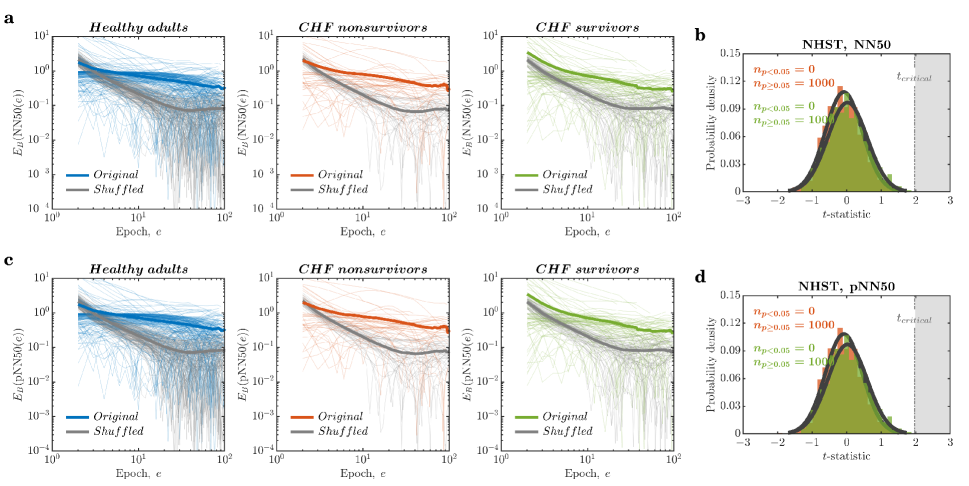
To test the specificity and reliability of these parameters, we performed Monte Carlo simulations by randomly sampling -sample RRi series from -hour recordings for each individual and performing one-way ANOVA tests separately on these series’ and values. We repeated this process times. One-way ANOVAs revealed that of HRV did not differ between either patient populations and healthy controls: CHF nonsurvivors and survivors (red histogram and green histogram, respectively, in Fig. 4b). Likewise, one-way ANOVAs revealed that of HRV did not differ between either patient populations and healthy controls: CHF nonsurvivors and survivors (red histogram and green histogram, respectively, in Fig. 4b). Hence, and might only weakly break ergodicity but also not diagnose CHF.
Cascade-dynamical descriptors and are both ergodic and specific
We hypothesized that cascade-dynamical descriptors might provide ergodic descriptions of the non-ergodic HRV by capturing the source of ergodicity breaking. The most compelling descriptions of cascading dynamics come from multifractal geometry [88, 168, 84]. Simulations of cascade processes show two critical features: long-range linear temporal correlations and nonlinear correlations involving interactions across timescales. The former feature appears most frequently as a fractional Gaussian noise (fGn) in which the standard deviation increases as a power function of the timescale. The fractional power in this function is known as the Hurst exponent, . and has already been shown to be sensitive to differences in HRV due to congestive heart failure [79]. The latter feature of nonlinear correlations concerns the effects spreading across the hierarchical organization of biological structures producing a variation in , i.e., multifractality. We can estimate this nonlinear variation by estimating the variation in power functions over time and then comparing this multifractal variation to what a linear model of the underlying RRi series can produce. That is, by comparing the multifractality (i.e., the number of power functions) estimable for the original RRi series to the same multifractal property for a sample of synthetic RRi series. The one-sample -test comparing the multifractality of the original to the synthetic RRi series provides a -statistic, multifractal nonlinearity, , which quantifies nonlinear correlations due to cascade dynamics [169]. and have been shown to provide ergodic descriptions of the non-ergodic series of both simulated and empirical biological measurements [119, 148, 149]. We aim to determine whether and can adequately describe the non-ergodic HRV. Furthermore, we test whether and provide specificity.
The behavior of for the epoch series of and bears a strong resemblance to the behavior of for the shuffled RRi series. For , had an initial shallower decay over a progressively larger number of epochs (, and ; colored lines in Fig. 5a). For , rapidly decayed initially over a progressively larger number of epochs (, and ; colored lines in Fig. 5c). These curves show a faster decay for the shuffled RRi series (, and ; grey lines in Fig. 5a). However, the decay rate of curves for the shuffled RRi series was comparable to that of the original RRi series (, and for healthy controls, CHF nonsurvivors, and CHF survivors, respectively; grey lines in Fig. 5c). These results show that the cascade-dynamical descriptors, and , provide ergodic descriptions of the non-ergodic HRV. The cascade-dynamical nature of HRV that contributed to the non-ergodicity of linear descriptors like and was appropriately captured by cascade-dynamical descriptors and .
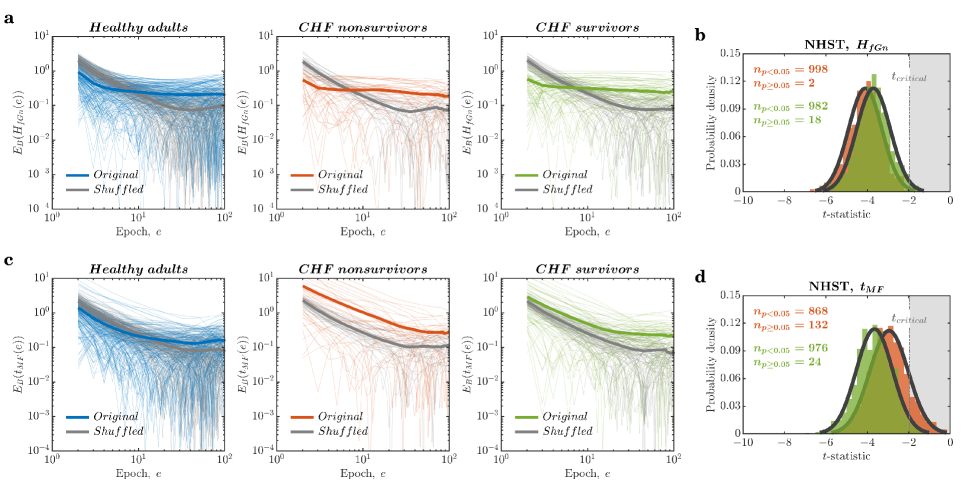
To test the specificity of these cascade-dynamical descriptors, we performed Monte Carlo simulations by randomly sampling -sample RRi series from -hour recordings for each individual and performing one-way ANOVA tests separately on these series’ and values. We repeated this process times. One-way ANOVAs failed to detect reduced of HRV due to the CHF, and times in nonsurvivors (red histogram in Fig. 5b) and survivors (green histogram in Fig. 5b), respectively, compared to healthy controls. Likewise, one-way ANOVAs failed to detect reduced of HRV due to the CHF, and times in nonsurvivors (red histogram in Fig. 5b) and survivors (green histogram in Fig. 5b), respectively, compared to healthy controls. Thus, and provide ergodic descriptions of the non-ergodic HRV and can specifically differentiate clinical groups with high reliability. These results support our proposal of capitalizing cascade-dynamical descriptors as generalizable and reproducible HRV parameters for digital biomarkers of health and disease.
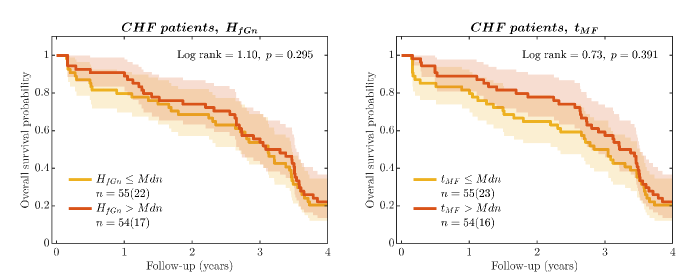
To also investigate the prognostic capacities of the cascade-dynamical descriptors and , we performed survival analysis to examine if these descriptors could predict mortality among CHF patients [170, 171]. Fig. 6 shows Kaplan-Meier cumulative survival curves using and as predictors. The two descriptors’ median () determined the cutoff points for dichotomization. and failed to predict mortality and produced comparable Mantel-Haenszel log-rank statistics. These hazard ratios were obtained: for and for .
Discussion
Here, we surveyed various descriptors that could be used by traditional and digital medicine to inform the diagnosis and prognosis of cardiovascular conditions such as CHF to identify those descriptors that could provide predictive, specific, generalizable, and reproducible assessments. The primary risk we have highlighted is that the raw RRi series breaks ergodicity. This non-ergodicity of HRV is a liability to clinical care because the raw RRi series fail to converge toward an average. Without this convergence, any sequence of RRi cannot be deemed sufficiently representative—whether of the patient’s long-term HRV or groups with a definitive clinical diagnosis or prognosis. We found that many of the most conventional linear descriptors are all as non-ergodic as the raw RRi series they summarize. We also identified that the primary source of these non-ergodicities is the very temporal structure of HRV and its cascade-dynamical nature. Afterward, we hypothesized that this very origin of non-ergodicities might hold the key to the ergodic descriptions of HRV. The cascade-dynamical descriptors and confirmed this hypothesis, provided ergodic descriptions of the non-ergodic HRV, and could also specifically differentiate clinical groups. However, our survival analysis indicated that even and cannot sufficiently predict post-CHF prognosis. Previous works exploring the usefulness of cascade-dynamical descriptors have often relied on a suite of descriptors, including those sensitive to the non-Gaussian statistics of HRV [159, 74, 158, 75, 160, 161, 162, 163]. This suggests that it might be best to employ cascade-dynamical descriptors, like and , alongside more traditional descriptors to achieve maximum predictivity, specificity, generalizability, and reproducibility.
The widespread adoption of smartwatches and other wearable biosensors with heart-rate monitoring capabilities has sparked hope for the early detection of cardiovascular diseases. However, the belief that more data is sufficient to improve predictions is overly optimistic and misguided. Machine learning/artificial intelligence (ML/AI) models are being developed to achieve highly accurate, sensitive, and specific measures of cardiovascular health; however, to aptly capitalize on these powerful tools, the need for a theoretical understanding of heart rate variability must be addressed. Despite the availability of vast amounts of data, the advancement in understanding the nature of heart rate variability has been modest despite years of work and thousands of scientific publications. This limitation prevents us from making meaningful inferences using ML/AI models. The current reliance on manual or automatic feature extraction [172, 173, 174, 175, 176, 177] is problematic since these features may not suitably reflect the primary causal mechanisms and be too much dependent on contextual variables [178, 136, 179, 180]. This study emphasizes that the current optimism surrounding the use of wearables and ML/AI models to detect cardiovascular diseases must be accompanied by a deeper understanding of the ergodicity-breaking behavior of HRV.
Our conclusions merit urgent attention as they show the unreliability of prevalent linear descriptors of HRV like mean-based parameters. We have shown that some of the most intuitive conventional descriptors of HRV, like mean-based descriptors, are non-ergodic. In contrast, cascade-dynamical descriptors, such as , can significantly improve the assessment of cardiovascular health. These results align with those of previous studies that had reported that nonlinear descriptors could provide additional prognostic information compared to conventional linear descriptors [80, 83, 161, 159, 163], e.g., short-term scaling exponent is a better predictor of mortality or other primary endpoints in cardiovascular patients [181, 182]. Moreover, such nonlinear descriptors have even been found to be reproducible across different populations [183, 184, 185] and contexts, e.g., receiving or not receiving beta-blockers [186], and different times and methods of measurement [184, 80].
Our results also show that a descriptor’s ergodicity is necessary but insufficient for its prognostic capability. Although and provided ergodic descriptions of HRV, they failed to predict mortality in CHF patients. Thus, although ergodicity is necessary for generalizable and reproducible inferences, to reach the utmost specific, generalizable, and reproducible assessment, combining descriptors that provide ergodic descriptions, like the cascade-dynamical descriptors investigated here, with other descriptors, like the conventional ones.
To also compare the nonlinear descriptors investigated here, it must be noted that is primarily a monofractal descriptor and is best suited to describe series generated based on one fractal-scaling exponent. However, the modeling of cascade dynamics due to nonlinear interactions across scales inherent to HRV is beyond the scope of and requires multifractal formalism [88, 168, 187]. Monofractal fluctuations such as fGn are ideally defined exhaustively by single fractional exponents and fall cleanly within the linear model through an autocorrelation function indicative of fractional integration [188, 189]. The nonlinearity of interactions across scales requires not only one but many fractional scaling exponents in addition to strictly linear long-range correlations. Hence, multifractal modeling is necessary to analyze the putative cascade-dynamical route to non-ergodicity thoroughly [119, 148, 149], i.e., the inherently multifractal descriptor, , is superior to in encoding nonlinear interactions across scales, which is characteristic of HRV.
Some other points also warrant further attention. For more comprehensive employment of nonlinear descriptors, such as those proposed here, especially in traditional medical settings, it might be necessary to provide more intuitive interpretations for clinicians and educate clinicians so that the biological basis of these mathematical parameters is clear [69]. Also, cascade dynamics is only one of the mechanisms that can lead to ergodicity-breaking physiological variabilities. It is still being determined whether all such mechanisms could be modeled as cascade processes (e.g., [157]). Despite the central role of cascade processes in biomedical explanation [190], we hope that future investigations examine a broader class of anomalous diffusion regimes [191, 192, 193, 194, 195, 196, 197, 198, 199, 200] that can also lead to ergodicity-breaking physiological variabilities. Further work is needed to determine whether cascade-dynamical descriptors enable reproducible health assessment when the sources of ergodicity breaking are more nuanced. The statistical modeling framework presented in the present study will be fundamental in guiding these investigations.
Eventually, the challenges faced in this study and our proposed solutions should be unrestricted to the case of HRV and cardiovascular health. Non-ergodicity and cascade dynamics abound in biological processes and are regularities—not exceptions. Much more attention must be paid to the ergodicity of investigated biological phenomena. Moreover, in cases of ergodicity breaking, we have shown here and in previous studies [119, 148, 149] that cascade dynamics should be considered one of the primary candidates for its origin and that capturing this origin through nonlinear, multifractal, and cascade-dynamical descriptors may be the key to ergodically describing non-ergodic phenomena. The importance of these insights cannot be exaggerated as they are crucial for reliable and reproducible diagnosis and prognosis across all fields. Non-ergodicity may be a signature of life, but seeking ergodicity in our generalizations and causal reasoning is pivotal for arriving at generalizable and reproducible digital biomarkers of health and disease.
Methods
Each patient gave informed written consent with full knowledge of the details. The ethics committee of Fujita Health University approved the research, which followed the guidelines stated in the Declaration of Helsinki. All data were fully anonymized before we accessed them.
Subjects
Based on the data of one of our previous studies [161], we retrospectively enrolled the patients referred to the hospital of the Fujita Health University from January 2000 to December 2001 for assessment or treatment of CHF. -hour monitoring of Holter ECG was conducted before their hospital discharge. To be eligible for this study, the patients had to be in normal sinus rhythm and had Holter ECG recordings whose periods taken up by artifacts, or noise were less than . No intravenous positive-inotropic agents or vasodilators were administered during the Holter ECG recordings. We excluded patients with chronic or paroxysmal atrial fibrillation, permanent or temporary cardiac pacemakers, active thyroid disease, or malignancy.
Follow-up and endpoint
We recorded the baseline data upon hospital discharge and the time-to-event information for each subject in a database. We then periodically sent questionnaires to patients or their families during the follow-up period and conducted telephone interviews to gather mortality information. Death from progressive heart failure was defined as death resulting from multi-organ failure caused by the progression of pump failure, and sudden death was defined as either witnessed cardiac arrest or death within one hour of onset of acute symptoms or the unexpected death of a patient known to have been well within the previous 24 hours.
Analysis of holter ECG
We digitized ECG signals at 125 Hz and 12 bits using proprietary software (Cardy Analyzer II, Suzuken Co., Ltd., Nagoya, Japan) and included only recordings with at least 22 hours of data in the analysis and of quantified sinus beats. Although the Cardy Analyzer II software had detected and labeled all QRS complexes in each recording, we manually corrected any errors in R-wave detection and QRS labeling. We then exported the individual files containing the duration of individual RRi intervals and morphology classifications of individual QRS complexes (normal, supraventricular, and ventricular premature complexes, supraventricular, and ventricular escape beats). We analyzed the -hour sequence of intervals between two successive R waves of sinus rhythm (i.e., heart rate variability or HRV). To avoid the adverse effects of any remaining errors in detecting the R wave, we reviewed large () consecutive RRi interval differences until all errors were corrected. In addition, when we encountered atrial or ventricular premature complexes, we interpolated the corresponding RRi intervals by the median of the two successive beat-to-beat intervals. We also confirmed that no sustained tachyarrhythmias were present in the HRV recordings. We then interpolated the observed RRi series with a cubic spline function and resampled at an interval () of ms ( Hz), yielding interpolated RRi series.
Estimating descriptors of HRV for epoch series
We computed the following descriptors of HRV—linear descriptors over non-overlapping -beat epochs extracted from the RRi series and fractal and multifractal descriptors over non-overlapping -sample epochs extracted from the interpolated RRi series. Hence, we computed fractal and multifractal descriptors in the time domain as both these are time-domain analytical methods. We computed these descriptors for the original (i.e., unshuffled) and a shuffled counterpart (i.e., a version with the temporal information destroyed) of each RRi series.
Conventional linear descriptors
We computed four linear descriptors of HRV. (i) Mean of successive RR intervals (). (ii) Root mean square of successive RR intervals () mathematically defined as
| (6) |
(iii) Number of pairs of successive RRi intervals that differ by more than ms (). (iv) The percentage of successive RRi intervals that differ from each other by more than ms ().
Fractal-scaling descriptor of long-range correlations using monofractal detrended fluctuation analysis
Detrended fluctuation analysis (DFA) computes the Hurst exponent, , quantifying the strength of long-range correlations in series [201, 202] using the first-order integration of -length series :
| (7) |
DFA computes root mean square (; i.e., averaging the residuals) for each linear trend fit to non-overlapping -length bins to build a fluctuation function:
| (8) |
is a power law,
| (9) |
where is the scaling exponent estimable using logarithmic transformation:
| (10) |
Higher corresponds to stronger long-range correlations.
Multifractal spectrum width based on the direct estimation of singularity spectrum
Chhabra and Jensen’s [203] direct method estimates multifractal spectrum width by sampling a series at progressively larger scales using the proportion of signal falling within the th bin of scale as
| (11) |
As increases, represents a progressively larger proportion of ,
| (12) |
suggesting a growth of the proportion according to one “singularity” strength [189]. exhibits multifractal dynamics when it grows heterogeneously across time scales according to multiple singularity strengths, such that
| (13) |
whereby each th bin may show a distinct relationship of with . The width of this singularity spectrum, , indicates the heterogeneity of these relationships [204, 205].
Chhabra and Jensen’s [203] method estimates for non-overlapping bins of -sizes and transforms them into a “mass” using a parameter emphasizing higher or lower for and , respectively, in the form
| (14) |
Then, is the singularity for mass -weighted estimated as
| (15) |
Each estimated value of belongs to the multifractal spectrum only when the Shannon entropy of scales with according to the Hausdorff dimension [203], where
| (16) |
For values of yielding a strong relationship between Eqs. (15) & (16)—in this study, correlation coefficient , the parametric curve or constitutes the multifractal spectrum and (i.e., ) constitutes the multifractal spectrum width. determines that only scaling relationships of comparable strength can support the estimation of the multifractal spectrum, whether generated as cascades or surrogates. Using a correlation benchmark aims to operationalize previously raised concerns about mis-specifications of the multifractal spectrum [206].
Surrogate testing using Iterated Amplitude Adjusted Fourier Transformation (IAAFT) generated t-statistic,
While multifractality is necessary for cascade-like interactivity, multifractality is not conclusive evidence of cascade-like interactivity, as it can follow from other sources, e.g., linear autocorrelation and outliers in the histogram [207]. To identify whether non-zero multifractal spectrum width (i.e., ) reflected multifractality due to nonlinear interactions across scales, we compared for the original and shuffled RRi series to for iterated amplitude adjusted Fourier transform (IAAFT) surrogates [208, 209]. IAAFT randomizes original values time-symmetrically around the autoregressive structure, generating surrogates with randomized phase ordering of the series’ spectral amplitudes while preserving linear temporal correlations. We refer interesting readers to Kelty-Stephen et al. [169] for a step-by-step guide to generating the IAAFT surrogates for any series. The resulting surrogate series should thus have the same values as the original series and thus the same mean and variance. It should also have the same amplitude spectrum and autocorrelation function as the original series. The one-sample -statistic, takes the subtractive difference between for the original series and that for surrogates, dividing by the standard error of for the surrogates.
Estimating ergodicity breaking parameter,
Ergodicity can be quantified using a dimensionless statistic of ergodicity breaking parameter, , also known as the Thirumalai-Mountain metric [164, 165] and already mentioned by Rytov et al. [210], computed as
| (17) |
where is the time average mean-squared displacement of the stochastic series for lag time . This relationship is effectively the variance of sample variance divided by the total-sample squared variance. Rapid decay of to a finite asymptotic value for progressively larger samples, i.e., as implies ergodicity. Thus, for Brownian motion [211, 196]. Slower decay indicates less ergodic systems in which trajectories are less reproducible, and no decay or convergence to a finite asymptotic value indicates strong ergodicity breaking [166, 167]. thus allows testing whether a given series fulfills ergodic assumptions or breaks ergodicity. For instance, it has been shown that for fractional Brownian motion (FBM) [166, 167],
| (18) |
The present work is less focused on firmly meeting the criterion of converging to zero within our finite samples. Instead, we compared the original and shuffled RRi series to assess ergodicity breaking instead of strict convergence of to zero. We computed for each original and shuffled RRi series (range = ; lag = 10) and for each epoch series of , , , , , and for the original and shuffled RRi series (range = ; lag = 1).
Monte Carlo simulations
We performed Monte Carlo simulations to test our hypothesis that ergodicity breaking by various linear and cascade-dynamical descriptors of HRV could compromise the reliability of these descriptors as diagnostic biomarkers. We randomly sampled -sample RRi series from -hour recordings for each individual and performed linear mixed-effects models separately on , , , , , , values calculated from these series. We used linear mixed-effects models with each descriptor as the dependent variable and the participant group as the independent variable. The -statistic and the resultant value were saved across the iterations. We performed all mixed-effects modeling in MATLAB 2022b (Mathworks, Inc., Natick, MA) using the function fitlme().
Survival analysis
We examined whether and were predictive of death using univariate Cox proportional hazards regression analysis [170, 171]. We used the Mantel-Haenszel log-rank test to compare Kaplan-Meier cumulative survival curves to examine the impact of identified risk factors on survival. We performed all survival analysis in R [212] using the function coxph() from the package “survival” [213].
Acknowledgements
This work was supported by the Center for Research in Human Movement Variability at the University of Nebraska at Omaha, funded by the NIH award P20GM109090.
Author contributions statement
Madhur Mangalam: Conceptualization, Methodology, Software, Validation, Formal analysis, Writing – Original draft, Writing – Review & Editing, Visualization, Project administration; Arash Sadri: Writing – Original draft, Writing – Review & Editing; Junichiro Hayano: Investigation, Data curation; Eiichi Watanabe: Investigation, Resources, Data curation; Ken Kiyono: Conceptualization, Methodology, Writing – Review & Editing; Damian G. Kelty-Stephen: Conceptualization, Methodology, Writing – Original draft, Writing – Review & Editing.
Competing interests
The authors declare no competing interests.
Data availability
The data that support the results reported herein can be obtained upon request from the corresponding author.
References
- [1] Tsao, C. W. et al. Heart disease and stroke statistics—2023 update: A report from the american heart association. \JournalTitleCirculation 147, e93–e621 (2023). https://doi.org/10.1161/CIR.0000000000001123.
- [2] Roth, G. A. et al. Global burden of cardiovascular diseases and risk factors, 1990–2019: Update from the gbd 2019 study. \JournalTitleJournal of the American College of Cardiology 76, 2982–3021 (2020). https://doi.org/10.1016/j.jacc.2020.11.010.
- [3] Omland, T. & White, H. D. State of the art: Blood biomarkers for risk stratification in patients with stable ischemic heart disease. \JournalTitleClinical Chemistry 63, 165–176 (2017). https://doi.org/10.1373/clinchem.2016.255190.
- [4] Mănescu, I.-B., Pál, K., Lupu, S. & Dobreanu, M. Conventional biomarkers for predicting clinical outcomes in patients with heart disease. \JournalTitleLife 12, 2112 (2022). https://doi.org/10.3390/life12122112.
- [5] Pál, K., Mănescu, I.-B., Lupu, S. & Dobreanu, M. Emerging biomarkers for predicting clinical outcomes in patients with heart disease. \JournalTitleLife 13, 230 (2023). https://www.mdpi.com/2075-1729/13/1/230#.
- [6] Zwack, C. C. et al. The evolution of digital health technologies in cardiovascular disease research. \JournalTitlenpj Digital Medicine 6, 1 (2023). https://doi.org/10.1038/s41746-022-00734-2.
- [7] Yeung, A. W. K. et al. Research on digital technology use in cardiology: Bibliometric analysis. \JournalTitleJournal of Medical Internet Research 24, e36086 (2022). https://doi.org/10.2196/36086.
- [8] Hughes, A., Shandhi, M. M. H., Master, H., Dunn, J. & Brittain, E. Wearable devices in cardiovascular medicine. \JournalTitleCirculation Research 132, 652–670 (2023). https://doi.org/10.1161/CIRCRESAHA.122.322389.
- [9] Nes, L. S. Digital health in cardiology: Time for action. \JournalTitleCardiology 145, 106–109 (2020). https://doi.org/10.1159/000504797.
- [10] Karemaker, J. M. An introduction into autonomic nervous function. \JournalTitlePhysiological Measurement 38, R89 (2017). https://doi.org/10.1088/1361-6579/aa6782.
- [11] Agliari, E. et al. Detecting cardiac pathologies via machine learning on heart-rate variability time series and related markers. \JournalTitleScientific Reports 10, 8845 (2020). https://doi.org/10.1038/s41598-020-64083-4.
- [12] Freeman, J. V., Dewey, F. E., Hadley, D. M., Myers, J. & Froelicher, V. F. Autonomic nervous system interaction with the cardiovascular system during exercise. \JournalTitleProgress in Cardiovascular Diseases 48, 342–362 (2006). https://doi.org/10.1016/j.pcad.2005.11.003.
- [13] Zhong, Y. et al. Autonomic nervous nonlinear interactions lead to frequency modulation between low-and high-frequency bands of the heart rate variability spectrum. \JournalTitleAmerican Journal of Physiology-Regulatory, Integrative and Comparative Physiology 293, R1961–R1968 (2007). https://doi.org/10.1152/ajpregu.00362.2007.
- [14] Beissner, F., Meissner, K., Bär, K.-J. & Napadow, V. The autonomic brain: An activation likelihood estimation meta-analysis for central processing of autonomic function. \JournalTitleJournal of Neuroscience 33, 10503–10511 (2013). https://doi.org/10.1523/JNEUROSCI.1103-13.2013.
- [15] Brosschot, J. F., Verkuil, B. & Thayer, J. F. Exposed to events that never happen: Generalized unsafety, the default stress response, and prolonged autonomic activity. \JournalTitleNeuroscience & Biobehavioral Reviews 74, 287–296 (2017). https://doi.org/10.1016/j.neubiorev.2016.07.019.
- [16] Cechetto, D. F. & Shoemaker, J. K. Functional neuroanatomy of autonomic regulation. \JournalTitleNeuroimage 47, 795–803 (2009). https://doi.org/10.1016/j.neuroimage.2009.05.024.
- [17] Guyenet, P. G. The sympathetic control of blood pressure. \JournalTitleNature Reviews Neuroscience 7, 335–346 (2006). https://doi.org/10.1038/nrn1902.
- [18] Ruiz Vargas, E., Sörös, P., Shoemaker, J. K. & Hachinski, V. Human cerebral circuitry related to cardiac control: A neuroimaging meta-analysis. \JournalTitleAnnals of Neurology 79, 709–716 (2016). https://doi.org/10.1002/ana.24642.
- [19] Thayer, J. F. & Lane, R. D. Claude Bernard and the heart–brain connection: Further elaboration of a model of neurovisceral integration. \JournalTitleNeuroscience & Biobehavioral Reviews 33, 81–88 (2009). https://doi.org/10.1016/j.neubiorev.2008.08.004.
- [20] Thayer, J. F., Åhs, F., Fredrikson, M., Sollers III, J. J. & Wager, T. D. A meta-analysis of heart rate variability and neuroimaging studies: Implications for heart rate variability as a marker of stress and health. \JournalTitleNeuroscience & Biobehavioral Reviews 36, 747–756 (2012). https://doi.org/10.1016/j.neubiorev.2011.11.009.
- [21] Thayer, J. F., Mather, M. & Koenig, J. Stress and aging: A neurovisceral integration perspective. \JournalTitlePsychophysiology 58, e13804 (2021). https://doi.org/10.1111/psyp.13804.
- [22] Wulsin, L., Herman, J. & Thayer, J. F. Stress, autonomic imbalance, and the prediction of metabolic risk: A model and a proposal for research. \JournalTitleNeuroscience & Biobehavioral Reviews 86, 12–20 (2018). https://doi.org/10.1016/j.neubiorev.2017.12.010.
- [23] Bootsma, M. et al. Heart rate and heart rate variability as indexes of sympathovagal balance. \JournalTitleAmerican Journal of Physiology-Heart and Circulatory Physiology 266, H1565–H1571 (1994). https://doi.org/10.1152/ajpheart.1994.266.4.H1565.
- [24] Khan, A. A., Lip, G. Y. & Shantsila, A. Heart rate variability in atrial fibrillation: The balance between sympathetic and parasympathetic nervous system. \JournalTitleEuropean Journal of Clinical Investigation 49, e13174 (2019). https://doi.org/10.1111/eci.13174.
- [25] van Ravenswaaij-Arts, C. M., Kollee, L. A., Hopman, J. C., Stoelinga, G. B. & van Geijn, H. P. Heart rate variability. \JournalTitleAnnals of Internal Medicine 118, 436–447 (1993). https://doi.org/10.7326/0003-4819-118-6-199303150-00008.
- [26] Amezquita-Sanchez, J. P., Valtierra-Rodriguez, M., Adeli, H. & Perez-Ramirez, C. A. A novel wavelet transform-homogeneity model for sudden cardiac death prediction using ECG signals. \JournalTitleJournal of Medical Systems 42, 1–15 (2018). https://doi.org/10.1007/s10916-018-1031-5.
- [27] Carney, R. M. et al. Depression, heart rate variability, and acute myocardial infarction. \JournalTitleCirculation 104, 2024–2028 (2001). https://doi.org/10.1161/hc4201.097834.
- [28] Chattipakorn, N., Incharoen, T., Kanlop, N. & Chattipakorn, S. Heart rate variability in myocardial infarction and heart failure. \JournalTitleInternational Journal of Cardiology 120, 289–296 (2007). https://doi.org/10.1016/j.ijcard.2006.11.221.
- [29] Fei, L., Copie, X., Malik, M. & Camm, A. J. Short-and long-term assessment of heart rate variability for risk stratification after acute myocardial infarction. \JournalTitleAmerican Journal of Cardiology 77, 681–684 (1996). https://doi.org/10.1016/S0002-9149(97)89199-0.
- [30] Hillebrand, S. et al. Heart rate variability and first cardiovascular event in populations without known cardiovascular disease: Meta-analysis and dose–response meta-regression. \JournalTitleEuropace 15, 742–749 (2013). https://doi.org/10.1093/europace/eus341.
- [31] La Rovere, M. T. et al. Short-term heart rate variability strongly predicts sudden cardiac death in chronic heart failure patients. \JournalTitleCirculation 107, 565–570 (2003). https://doi.org/10.1161/01.CIR.0000047275.25795.17.
- [32] Lombardi, F., Mäkikallio, T. H., Myerburg, R. J. & Huikuri, H. V. Sudden cardiac death: Role of heart rate variability to identify patients at risk. \JournalTitleCardiovascular Research 50, 210–217 (2001). https://doi.org/10.1016/S0008-6363(01)00221-8.
- [33] Mäkikallio, T. H. et al. Prediction of sudden cardiac death by fractal analysis of heart rate variability in elderly subjects. \JournalTitleJournal of the American College of Cardiology 37, 1395–1402 (2001). https://doi.org/10.1016/S0735-1097(01)01171-8.
- [34] Ponikowski, P. et al. Depressed heart rate variability as an independent predictor of death in chronic congestive heart failure secondary to ischemic or idiopathic dilated cardiomyopathy. \JournalTitleAmerican Journal of Cardiology 79, 1645–1650 (1997). https://doi.org/10.1016/S0002-9149(97)00215-4.
- [35] Sessa, F. et al. Heart rate variability as predictive factor for sudden cardiac death. \JournalTitleAging 10, 166–177 (2018). https://doi.org/10.18632%2Faging.101386.
- [36] Woo, M. A., Stevenson, W. G., Moser, D. K., Trelease, R. B. & Harper, R. M. Patterns of beat-to-beat heart rate variability in advanced heart failure. \JournalTitleAmerican Heart Journal 123, 704–710 (1992). https://doi.org/10.1016/0002-8703(92)90510-3.
- [37] Xhyheri, B., Manfrini, O., Mazzolini, M., Pizzi, C. & Bugiardini, R. Heart rate variability today. \JournalTitleProgress in Cardiovascular Diseases 55, 321–331 (2012). https://doi.org/10.1016/j.pcad.2012.09.001.
- [38] Benichou, T. et al. Heart rate variability in type 2 diabetes mellitus: A systematic review and meta–analysis. \JournalTitlePloS One 13, e0195166 (2018). https://doi.org/10.1371/journal.pone.0195166.
- [39] Cha, S.-A. et al. Time-and frequency-domain measures of heart rate variability predict cardiovascular outcome in patients with type 2 diabetes. \JournalTitleDiabetes Research and Clinical Practice 143, 159–169 (2018). https://doi.org/10.1016/j.diabres.2018.07.001.
- [40] Gottsäter, A., Ahlgren, Å. R., Taimour, S. & Sundkvist, G. Decreased heart rate variability may predict the progression of carotid atherosclerosis in type 2 diabetes. \JournalTitleClinical Autonomic Research 16, 228–234 (2006). https://doi.org/10.1007/s10286-006-0345-4.
- [41] Kataoka, M., Ito, C., Sasaki, H., Yamane, K. & Kohno, N. Low heart rate variability is a risk factor for sudden cardiac death in type 2 diabetes. \JournalTitleDiabetes Research and Clinical Practice 64, 51–58 (2004). https://doi.org/10.1016/j.diabres.2003.10.009.
- [42] May, O. & Arildsen, H. Long-term predictive power of heart rate variability on all-cause mortality in the diabetic population. \JournalTitleActa Diabetologica 48, 55–59 (2011). https://doi.org/10.1007/s00592-010-0222-4.
- [43] Bédard, M.-E., Marquis, K., Poirier, P. & Provencher, S. Reduced heart rate variability in patients with chronic obstructive pulmonary disease independent of anticholinergic or -agonist medications. \JournalTitleJournal of Chronic Obstructive Pulmonary Disease 7, 391–397 (2010). https://doi.org/10.3109/15412555.2010.528083.
- [44] Carvalho, T. D. et al. Fractal correlation property of heart rate variability in chronic obstructive pulmonary disease. \JournalTitleInternational Journal of Chronic Obstructive Pulmonary Disease 6, 23–28 (2011).
- [45] Gunduz, H. et al. Heart rate variability and heart rate turbulence in patients with chronic obstructive pulmonary disease. \JournalTitleCardiology Journal 16, 553–559 (2009).
- [46] Lacasse, M. et al. Post-exercise heart rate recovery and mortality in chronic obstructive pulmonary disease. \JournalTitleRespiratory Medicine 99, 877–886 (2005). https://doi.org/10.1016/j.rmed.2004.11.012.
- [47] Volterrani, M. et al. Decreased heart rate variability in patients with chronic obstructive pulmonary disease. \JournalTitleChest 106, 1432–1437 (1994). https://doi.org/10.1378/chest.106.5.1432.
- [48] Chandra, P. et al. Predictors of heart rate variability and its prognostic significance in chronic kidney disease. \JournalTitleNephrology Dialysis Transplantation 27, 700–709 (2012). https://doi.org/10.1093/ndt/gfr340.
- [49] Drawz, P. E. et al. Heart rate variability is a predictor of mortality in chronic kidney disease: A report from the CRIC study. \JournalTitleAmerican Journal of Nephrology 38, 517–528 (2013). https://doi.org/10.1159/000357200.
- [50] Fukuta, H. et al. Prognostic value of heart rate variability in patients with end-stage renal disease on chronic haemodialysis. \JournalTitleNephrology Dialysis Transplantation 18, 318–325 (2003). https://doi.org/10.1093/ndt/18.2.318.
- [51] Oikawa, K. et al. Prognostic value of heart rate variability in patients with renal failure on hemodialysis. \JournalTitleInternational Journal of Cardiology 131, 370–377 (2009). https://doi.org/10.1016/j.ijcard.2007.10.033.
- [52] Ranpuria, R., Hall, M., Chan, C. T. & Unruh, M. Heart rate variability (HRV) in kidney failure: Measurement and consequences of reduced HRV. \JournalTitleNephrology Dialysis Transplantation 23, 444–449 (2008). https://doi.org/10.1093/ndt/gfm634.
- [53] da Silva, V. P. et al. Heart rate variability indexes in dementia: A systematic review with a quantitative analysis. \JournalTitleCurrent Alzheimer Research 15, 80–88 (2018). https://doi.org/10.2174/1567205014666170531082352.
- [54] Koch, C., Wilhelm, M., Salzmann, S., Rief, W. & Euteneuer, F. A meta-analysis of heart rate variability in major depression. \JournalTitlePsychological Medicine 49, 1948–1957 (2019). https://doi.org/10.1017/S0033291719001351.
- [55] Schiweck, C., Piette, D., Berckmans, D., Claes, S. & Vrieze, E. Heart rate and high frequency heart rate variability during stress as biomarker for clinical depression. A systematic review. \JournalTitlePsychological Medicine 49, 200–211 (2019). https://doi.org/10.1017/S0033291718001988.
- [56] Chalmers, J. A., Quintana, D. S., Abbott, M. J.-A. & Kemp, A. H. Anxiety disorders are associated with reduced heart rate variability: A meta-analysis. \JournalTitleFrontiers in Psychiatry 5, 80 (2014). https://doi.org/10.3389/fpsyt.2014.00080.
- [57] Olbrich, H., Jahn, I., Stengler, K., Seifritz, E. & Colla, M. Heart rate variability in obsessive compulsive disorder in comparison to healthy controls and as predictor of treatment response. \JournalTitleClinical Neurophysiology 138, 123–131 (2022). https://doi.org/10.1016/j.clinph.2022.02.029.
- [58] Cheng, Y.-C., Huang, Y.-C. & Huang, W.-L. Heart rate variability in individuals with autism spectrum disorders: A meta-analysis. \JournalTitleNeuroscience & Biobehavioral Reviews 118, 463–471 (2020). https://doi.org/10.1016/j.neubiorev.2020.08.007.
- [59] Robe, A., Dobrean, A., Cristea, I. A., Păsărelu, C. R. & Predescu, E. Attention-deficit/hyperactivity disorder and task-related heart rate variability: A systematic review and meta-analysis. \JournalTitleNeuroscience & Biobehavioral Reviews 99, 11–22 (2019). https://doi.org/10.1016/j.neubiorev.2019.01.022.
- [60] Jarczok, M. N., Li, J., Mauss, D., Fischer, J. E. & Thayer, J. F. Heart rate variability is associated with glycemic status after controlling for components of the metabolic syndrome. \JournalTitleInternational Journal of Cardiology 167, 855–861 (2013). https://doi.org/10.1016/j.ijcard.2012.02.002.
- [61] Jarczok, M. N. et al. Investigating the associations of self-rated health: Heart rate variability is more strongly associated than inflammatory and other frequently used biomarkers in a cross sectional occupational sample. \JournalTitlePloS One 10, e0117196 (2015). https://doi.org/10.1371/journal.pone.0117196.
- [62] Avram, R. et al. Real-world heart rate norms in the Health eHeart study. \JournalTitlenpj Digital Medicine 2, 58 (2019). https://doi.org/10.1038/s41746-019-0134-9.
- [63] Bayoumy, K. et al. Smart wearable devices in cardiovascular care: Where we are and how to move forward. \JournalTitleNature Reviews Cardiology 18, 581–599 (2021). https://doi.org/10.1038/s41569-021-00522-7.
- [64] Holko, M. et al. Wearable fitness tracker use in federally qualified health center patients: strategies to improve the health of all of us using digital health devices. \JournalTitlenpj Digital Medicine 5, 53 (2022). https://doi.org/10.1038/s41746-022-00593-x.
- [65] Lee, S. P. et al. Highly flexible, wearable, and disposable cardiac biosensors for remote and ambulatory monitoring. \JournalTitlenpj Digital Medicine 1, 2 (2018). https://doi.org/10.1038/s41746-017-0009-x.
- [66] Pereira, T. et al. Photoplethysmography based atrial fibrillation detection: A review. \JournalTitlenpj Digital Medicine 3, 3 (2020). https://doi.org/10.1038/s41746-019-0207-9.
- [67] Owens, A. P. The role of heart rate variability in the future of remote digital biomarkers. \JournalTitleFrontiers in Neuroscience 14, 582145 (2020). https://doi.org/10.3389/fnins.2020.582145.
- [68] Raza, M. M., Venkatesh, K. P. & Kvedar, J. C. Intelligent risk prediction in public health using wearable device data. \JournalTitlenpj Digital Medicine 5, 153 (2022). https://doi.org/10.1038/s41746-022-00701-x.
- [69] Captur, G., Karperien, A. L., Hughes, A. D., Francis, D. P. & Moon, J. C. The fractal heart—Embracing mathematics in the cardiology clinic. \JournalTitleNature Reviews Cardiology 14, 56–64 (2017). https://doi.org/10.1038/nrcardio.2016.161.
- [70] Gierałtowski, J., Żebrowski, J. & Baranowski, R. Multiscale multifractal analysis of heart rate variability recordings with a large number of occurrences of arrhythmia. \JournalTitlePhysical Review E 85, 021915 (2012). https://doi.org/10.1103/PhysRevE.85.021915.
- [71] Goldberger, A. L. et al. Fractal dynamics in physiology: Alterations with disease and aging. \JournalTitleProceedings of the National Academy of Sciences 99, 2466–2472 (2002). https://doi.org/10.1073/pnas.012579499.
- [72] Ivanov, P. C. et al. Scaling behaviour of heartbeat intervals obtained by wavelet-based time-series analysis. \JournalTitleNature 383, 323–327 (1996). https://doi.org/10.1038/383323a0.
- [73] Ivanov, P. C. et al. From 1/f noise to multifractal cascades in heartbeat dynamics. \JournalTitleChaos 11, 641–652 (2001). https://doi.org/10.1063/1.1395631.
- [74] Kiyono, K. et al. Critical scale invariance in a healthy human heart rate. \JournalTitlePhysical Review Letters 93, 178103 (2004). https://doi.org/10.1103/PhysRevLett.93.178103.
- [75] Kiyono, K., Struzik, Z. R., Aoyagi, N., Togo, F. & Yamamoto, Y. Phase transition in a healthy human heart rate. \JournalTitlePhysical Review Letters 95, 058101 (2005). https://doi.org/10.1103/PhysRevLett.95.058101.
- [76] Kurths, J. et al. Quantitative analysis of heart rate variability. \JournalTitleChaos 5, 88–94 (1995). https://doi.org/10.1063/1.166090.
- [77] Lefebvre, J., Goodings, D., Kamath, M. & Fallen, E. Predictability of normal heart rhythms and deterministic chaos. \JournalTitleChaos 3, 267–276 (1993). https://doi.org/10.1063/1.165990.
- [78] Lin, D. & Hughson, R. Modeling heart rate variability in healthy humans: A turbulence analogy. \JournalTitlePhysical Review Letters 86, 1650 (2001). https://doi.org/10.1103/PhysRevLett.86.1650.
- [79] Peng, C.-K. et al. Fractal mechanisms and heart rate dynamics: Long-range correlations and their breakdown with disease. \JournalTitleJournal of Electrocardiology 28, 59–65 (1995). https://doi.org/10.1016/S0022-0736(95)80017-4.
- [80] Perkiömäki, J. S. Heart rate variability and non-linear dynamics in risk stratification. \JournalTitleFrontiers in Physiology 2, 81 (2011). https://doi.org/10.3389/fphys.2011.00081.
- [81] Sugihara, G., Allan, W., Sobel, D. & Allan, K. D. Nonlinear control of heart rate variability in human infants. \JournalTitleProceedings of the National Academy of Sciences 93, 2608–2613 (1996). https://doi.org/10.1073/pnas.93.6.2608.
- [82] Tan, C. O., Cohen, M. A., Eckberg, D. L. & Taylor, J. A. Fractal properties of human heart period variability: Physiological and methodological implications. \JournalTitleJournal of Physiology 587, 3929–3941 (2009). https://doi.org/10.1113/jphysiol.2009.169219.
- [83] Voss, A., Schulz, S., Schroeder, R., Baumert, M. & Caminal, P. Methods derived from nonlinear dynamics for analysing heart rate variability. \JournalTitlePhilosophical Transactions of the Royal Society A: Mathematical, Physical and Engineering Sciences 367, 277–296 (2009). https://doi.org/10.1098/rsta.2008.0232.
- [84] Kelty-Stephen, D. G., Palatinus, K., Saltzman, E. & Dixon, J. A. A tutorial on multifractality, cascades, and interactivity for empirical time series in ecological science. \JournalTitleEcological Psychology 25, 1–62 (2013). https://doi.org/10.1080/10407413.2013.753804.
- [85] Turcotte, D. L., Malamud, B. D., Guzzetti, F. & Reichenbach, P. Self-organization, the cascade model, and natural hazards. \JournalTitleProceedings of the National Academy of Sciences 99, 2530–2537 (2002). https://doi.org/10.1073/pnas.012582199.
- [86] Lovejoy, S. & Schertzer, D. Multifractals, cloud radiances and rain. \JournalTitleJournal of Hydrology 322, 59–88 (2006). https://doi.org/10.1016/j.jhydrol.2005.02.042.
- [87] Olsson, J., Persson, M. & Jinno, K. Analysis and modeling of solute transport dynamics by breakdown coefficients and random cascades. \JournalTitleWater Resources Research 43, W03417 (2007). https://doi.org/10.1029/2005WR004631.
- [88] Ihlen, E. A. & Vereijken, B. Interaction-dominant dynamics in human cognition: Beyond fluctuation. \JournalTitleJournal of Experimental Psychology: General 139, 436–463 (2010). https://psycnet.apa.org/doi/10.1037/a0019098.
- [89] Bloomfield, L., Lane, E., Mangalam, M. & Kelty-Stephen, D. G. Perceiving and remembering speech depend on multifractal nonlinearity in movements producing and exploring speech. \JournalTitleJournal of The Royal Society Interface 18, 20210272 (2021). https://doi.org/10.1098/rsif.2021.0272.
- [90] Kelty-Stephen, D. G., Lee, I. C., Carver, N. S., Newell, K. M. & Mangalam, M. Multifractal roots of suprapostural dexterity. \JournalTitleHuman Movement Science 76, 102771 (2021). https://doi.org/10.1016/j.humov.2021.102771.
- [91] Kelty-Stephen, D. G. & Mangalam, M. Turing’s cascade instability supports the coordination of the mind, brain, and behavior. \JournalTitleNeuroscience & Biobehavioral Reviews 141, 104810 (2022). https://doi.org/10.1016/j.neubiorev.2022.104810.
- [92] Kelty-Stephen, D. G., Lee, J., Cole, K. R., Shields, R. K. & Mangalam, M. Multifractal nonlinearity moderates feedforward and feedback responses to suprapostural perturbations. \JournalTitlePerceptual and Motor Skills 130, 622–657 (2023). https://doi.org/10.1177/00315125221149147.
- [93] Mangalam, M., Carver, N. S. & Kelty-Stephen, D. G. Global broadcasting of local fractal fluctuations in a bodywide distributed system supports perception via effortful touch. \JournalTitleChaos, Solitons & Fractals 135, 109740 (2020). https://doi.org/10.1016/j.chaos.2020.109740.
- [94] Mangalam, M., Carver, N. S. & Kelty-Stephen, D. G. Multifractal signatures of perceptual processing on anatomical sleeves of the human body. \JournalTitleJournal of The Royal Society Interface 17, 20200328 (2020). https://doi.org/10.1098/rsif.2020.0328.
- [95] Mangalam, M. & Kelty-Stephen, D. G. Multiplicative-cascade dynamics supports whole-body coordination for perception via effortful touch. \JournalTitleHuman Movement Science 70, 102595 (2020). https://doi.org/10.1016/j.humov.2020.102595.
- [96] Biswas, D., Simões-Capela, N., Van Hoof, C. & Van Helleputte, N. Heart rate estimation from wrist-worn photoplethysmography: A review. \JournalTitleIEEE Sensors Journal 19, 6560–6570 (2019). https://doi.org/10.1109/JSEN.2019.2914166.
- [97] Cajal, D. et al. Effects of missing data on heart rate variability metrics. \JournalTitleSensors 22, 5774 (2022). https://doi.org/10.3390/s22155774.
- [98] Georgiou, K. et al. Can wearable devices accurately measure heart rate variability? A systematic review. \JournalTitleFolia Medica 60, 7–20 (2018). https://doi.org/10.2478/folmed-2018-0012.
- [99] Isakadze, N. & Martin, S. S. How useful is the smartwatch ECG? \JournalTitleTrends in Cardiovascular Medicine 30, 442–448 (2020). https://doi.org/10.1016/j.tcm.2019.10.010.
- [100] Karemaker, J. M. Interpretation of heart rate variability: The art of looking through a keyhole. \JournalTitleFrontiers in Neuroscience 14, 609570 (2020). https://doi.org/10.3389/fnins.2020.609570.
- [101] Karemaker, J. M. The multibranched nerve: Vagal function beyond heart rate variability. \JournalTitleBiological Psychology 172, 108378 (2022). https://doi.org/10.1016/j.biopsycho.2022.108378.
- [102] Nelson, B. W. & Allen, N. B. Accuracy of consumer wearable heart rate measurement during an ecologically valid 24-hour period: Intraindividual validation study. \JournalTitleJMIR mHealth and uHealth 7, e10828 (2019). https://doi.org/10.2196/10828.
- [103] Raja, J. M. et al. Apple watch, wearables, and heart rhythm: Where do we stand? \JournalTitleAnnals of Translational Medicine 7, 417 (2019). https://doi.org/10.21037%2Fatm.2019.06.79.
- [104] Shaffer, F., McCraty, R. & Zerr, C. L. A healthy heart is not a metronome: An integrative review of the heart’s anatomy and heart rate variability. \JournalTitleFrontiers in Psychology 5, 1040 (2014). https://doi.org/10.3389/fpsyg.2014.01040.
- [105] Hayano, J. & Yuda, E. Pitfalls of assessment of autonomic function by heart rate variability. \JournalTitleJournal of Physiological Anthropology 38, 3 (2019). https://doi.org/10.1186/s40101-019-0193-2.
- [106] Shaffer, F. & Ginsberg, J. P. An overview of heart rate variability metrics and norms. \JournalTitleFrontiers in Public Health 5, 258 (2017). https://doi.org/10.3389/fpubh.2017.00258.
- [107] Thomas, B. L., Claassen, N., Becker, P. & Viljoen, M. Validity of commonly used heart rate variability markers of autonomic nervous system function. \JournalTitleNeuropsychobiology 78, 14–26 (2019). https://doi.org/10.1159/000495519.
- [108] Galton, F. Inquiries into Human Faculty and Its Development (Macmillan, New York, NY, 1883).
- [109] Galton, F. Natural inheritance, vol. 42 (Macmillan, New York, NY, 1889).
- [110] Neyman, J. & Pearson, E. S. IX. On the problem of the most efficient tests of statistical hypotheses. \JournalTitlePhilosophical Transactions of the Royal Society A 231, 289–337 (1933). https://doi.org/10.1098/rsta.1933.0009.
- [111] Fisher, R. A. On the mathematical foundations of theoretical statistics. \JournalTitlePhilosophical Transactions of the Royal Society A 222, 309–368 (1922). https://doi.org/10.1098/rsta.1922.0009.
- [112] Fisher, R. A. The Design of Experiments (Oliver & Boyd, Edinburgh, UK, 1949).
- [113] Fisher, R. A. Statistical Methods for Research Workers (Oliver & Boyd, Edinburgh, UK, 1950).
- [114] Aldrich, J. The origins of modern statistics: The english statistical school. In Hájek, A. & Hitchcock, C. (eds.) The Oxford Handbook of Probability and Philosophy, 112–129 (Oxford University Press, Oxford, UK, 2016).
- [115] Molenaar, P. C. A manifesto on psychology as idiographic science: Bringing the person back into scientific psychology, this time forever. \JournalTitleMeasurement 2, 201–218 (2004). https://doi.org/10.1207/s15366359mea0204_1.
- [116] Molenaar, P. C. & Campbell, C. G. The new person-specific paradigm in psychology. \JournalTitleCurrent Directions in Psychological Science 18, 112–117 (2009). https://doi.org/10.1111/j.1467-8721.2009.01619.x.
- [117] Voelkle, M. C., Brose, A., Schmiedek, F. & Lindenberger, U. Toward a unified framework for the study of between-person and within-person structures: Building a bridge between two research paradigms. \JournalTitleMultivariate Behavioral Research 49, 193–213 (2014). https://doi.org/10.1080/00273171.2014.889593.
- [118] Mangalam, M. & Kelty-Stephen, D. G. Point estimates, Simpson’s paradox, and nonergodicity in biological sciences. \JournalTitleNeuroscience & Biobehavioral Reviews 125, 98–107 (2021). https://doi.org/10.1016/j.neubiorev.2021.02.017.
- [119] Kelty-Stephen, D. G. & Mangalam, M. Fractal and multifractal descriptors restore ergodicity broken by non-Gaussianity in time series. \JournalTitleChaos, Solitons & Fractals 163, 112568 (2022). https://doi.org/10.1016/j.chaos.2022.112568.
- [120] Fisher, A. J., Medaglia, J. D. & Jeronimus, B. F. Lack of group-to-individual generalizability is a threat to human subjects research. \JournalTitleProceedings of the National Academy of Sciences 115, E6106–E6115 (2018). https://doi.org/10.1073/pnas.1711978115.
- [121] Li, J. et al. Non-ergodicity of a globular protein extending beyond its functional timescale. \JournalTitleChemical Science 13, 9668–9677 (2022). https://doi.org/10.1039/D2SC03069A.
- [122] Weigel, A. V., Simon, B., Tamkun, M. M. & Krapf, D. Ergodic and nonergodic processes coexist in the plasma membrane as observed by single-molecule tracking. \JournalTitleProceedings of the National Academy of Sciences 108, 6438–6443 (2011). https://doi.org/10.1073/pnas.1016325108.
- [123] Card, K. J., LaBar, T., Gomez, J. B. & Lenski, R. E. Historical contingency in the evolution of antibiotic resistance after decades of relaxed selection. \JournalTitlePLoS Biology 17, e3000397 (2019). https://doi.org/10.1371/journal.pbio.3000397.
- [124] Xie, V. C., Pu, J., Metzger, B. P., Thornton, J. W. & Dickinson, B. C. Contingency and chance erase necessity in the experimental evolution of ancestral proteins. \JournalTitleeLife 10, e67336 (2021). https://doi.org/10.7554/eLife.67336.
- [125] Koenig, J. & Thayer, J. F. Sex differences in healthy human heart rate variability: A meta-analysis. \JournalTitleNeuroscience & Biobehavioral Reviews 64, 288–310 (2016). https://doi.org/10.1016/j.neubiorev.2016.03.007.
- [126] Abhishekh, H. A. et al. Influence of age and gender on autonomic regulation of heart. \JournalTitleJournal of Clinical Monitoring and Computing 27, 259–264 (2013). https://doi.org/10.1007/s10877-012-9424-3.
- [127] Almeida-Santos, M. A. et al. Aging, heart rate variability and patterns of autonomic regulation of the heart. \JournalTitleArchives of Gerontology and Geriatrics 63, 1–8 (2016). https://doi.org/10.1016/j.archger.2015.11.011.
- [128] Bonnemeier, H. et al. Circadian profile of cardiac autonomic nervous modulation in healthy subjects: Differing effects of aging and gender on heart rate variability. \JournalTitleJournal of Cardiovascular Electrophysiology 14, 791–799 (2003). https://doi.org/10.1046/j.1540-8167.2003.03078.x.
- [129] Aubert, A. E., Seps, B. & Beckers, F. Heart rate variability in athletes. \JournalTitleSports Medicine 33, 889–919 (2003). https://doi.org/10.2165/00007256-200333120-00003.
- [130] De Meersman, R. E. Heart rate variability and aerobic fitness. \JournalTitleAmerican Heart Journal 125, 726–731 (1993). https://doi.org/10.1016/0002-8703(93)90164-5.
- [131] Bodin, F. et al. The association of cigarette smoking with high frequency heart rate variability: An ecological momentary assessment study. \JournalTitlePsychosomatic Medicine 79, –1050 (2017). https://doi.org/10.1097/PSY.0000000000000507.
- [132] Uusitalo, A. L. et al. Role of genetic and environmental influences on heart rate variability in middle-aged men. \JournalTitleAmerican Journal of Physiology-Heart and circulatory Physiology 293, H1013–H1022 (2007). https://doi.org/10.1152/ajpheart.00475.2006.
- [133] Schnell, I. et al. The effects of exposure to environmental factors on Heart Rate Variability: An ecological perspective. \JournalTitleEnvironmental Pollution 183, 7–13 (2013). https://doi.org/10.1016/j.envpol.2013.02.005.
- [134] Hirsch, J. A. & Bishop, B. Respiratory sinus arrhythmia in humans: How breathing pattern modulates heart rate. \JournalTitleAmerican Journal of Physiology-Heart and Circulatory Physiology 241, H620–H629 (1981). https://doi.org/10.1152/ajpheart.1981.241.4.H620.
- [135] Nunan, D., Sandercock, G. R. & Brodie, D. A. A quantitative systematic review of normal values for short-term heart rate variability in healthy adults. \JournalTitlePacing and Clinical Electrophysiology 33, 1407–1417 (2010). https://doi.org/10.1111/j.1540-8159.2010.02841.x.
- [136] Faust, L., Feldman, K., Mattingly, S. M., Hachen, D. & V. Chawla, N. Deviations from normal bedtimes are associated with short-term increases in resting heart rate. \JournalTitlenjp Digital Medicine 3, 39 (2020). https://doi.org/10.1038/s41746-020-0250-6.
- [137] da Cruz, C. J. G. et al. Impact of heart rate on reproducibility of heart rate variability analysis in the supine and standing positions in healthy men. \JournalTitleClinics 74, e806 (2019). https://doi.org/10.6061/clinics/2019/e806.
- [138] Porta, A. et al. Changes of the cardiac baroreflex bandwidth during postural challenges. \JournalTitleAmerican Journal of Physiology-Regulatory, Integrative and Comparative Physiology 324, R601–R612 (2023). https://doi.org/10.1152/ajpregu.00305.2022.
- [139] Laborde, S., Mosley, E. & Thayer, J. F. Heart rate variability and cardiac vagal tone in psychophysiological research–Recommendations for experiment planning, data analysis, and data reporting. \JournalTitleFrontiers in Psychology 8, 213 (2017). https://doi.org/10.3389/fpsyg.2017.00213.
- [140] Lord, S. et al. Low-frequency heart rate variability: reproducibility in cardiac transplant recipients and normal subjects. \JournalTitleClinical Science 100, 43–46 (2001). https://doi.org/10.1042/cs1000043.
- [141] Jeyhani, V., Mahdiani, S., Peltokangas, M. & Vehkaoja, A. Comparison of HRV parameters derived from photoplethysmography and electrocardiography signals. In 37th Annual International Conference of the IEEE Engineering in Medicine and Biology Society, 5952–5955 (2015). https://doi.org/10.1109/EMBC.2015.7319747.
- [142] Merri, M., Farden, D. C., Mottley, J. G. & Titlebaum, E. L. Sampling frequency of the electrocardiogram for spectral analysis of the heart rate variability. \JournalTitleIEEE Transactions on Biomedical Engineering 37, 99–106 (1990). https://doi.org/10.1109/10.43621.
- [143] Bassi, D. et al. Inter and intra-rater reliability of short-term measurement of heart rate variability on rest in diabetic type 2 patients. \JournalTitleJournal of Medical Systems 42, 1–7 (2018). https://doi.org/10.1007/s10916-018-1101-8.
- [144] Farah, B. Q. et al. Intra-individuals and inter-and intra-observer reliability of short-term heart rate variability in adolescents. \JournalTitleClinical Physiology and Functional Imaging 36, 33–39 (2016). https://doi.org/10.1111/cpf.12190.
- [145] Peltola, M. A. Role of editing of R–R intervals in the analysis of heart rate variability. \JournalTitleFrontiers in Physiology 3, 148 (2012). https://doi.org/10.3389/fphys.2012.00148.
- [146] Plaza-Florido, A. et al. Inter-and intra-researcher reproducibility of heart rate variability parameters in three human cohorts. \JournalTitleScientific Reports 10, 11399 (2020). https://doi.org/10.1038/s41598-020-68197-7.
- [147] Marcus, G. M. The Apple Watch can detect atrial fibrillation: So what now? \JournalTitleNature Reviews Cardiology 17, 135–136 (2020). https://doi.org/10.1038/s41569-019-0330-y.
- [148] Kelty-Stephen, D. G. & Mangalam, M. Multifractal descriptors ergodically characterize non-ergodic multiplicative cascade processes. \JournalTitlePhysica A: Statistical Mechanics and its Applications 616, 128651 (2023). https://doi.org/10.1016/j.physa.2023.128651.
- [149] Mangalam, M. & Kelty-Stephen, D. G. Ergodic descriptors of non-ergodic stochastic processes. \JournalTitleJournal of the Royal Society Interface 19, 20220095 (2022). https://doi.org/10.1098/rsif.2022.0095.
- [150] Hanin, L. Why statistical inference from clinical trials is likely to generate false and irreproducible results. \JournalTitleBMC Medical Research Methodology 17, 127 (2017). https://doi.org/10.1186/s12874-017-0399-0.
- [151] Ioannidis, J. P. Why most published research findings are false. \JournalTitlePLoS Medicine 2, e124 (2005). https://doi.org/10.1371/journal.pmed.0020124.
- [152] Højgaard, M. V., Holstein-Rathlou, N.-H., Agner, E. & Kanters, J. K. Reproducibility of heart rate variability, blood pressure variability and baroreceptor sensitivity during rest and head-up tilt. \JournalTitleBlood Pressure Monitoring 10, 19–24 (2005). https://doi.org/10.1097/00126097-200502000-00005.
- [153] Leicht, A. & Allen, G. Moderate-term reproducibility of heart rate variability during rest and light to moderate exercise in children. \JournalTitleBrazilian Journal of Medical and Biological Research 41, 627–633 (2008). https://doi.org/10.1590/S0100-879X2008000700013.
- [154] Pitzalis, M. V. et al. Short-and long-term reproducibility of time and frequency domain heart rate variability measurements in normal subjects. \JournalTitleCardiovascular Research 32, 226–233 (1996). https://doi.org/10.1016/0008-6363(96)00086-7.
- [155] Sacha, J., Sobon, J., Sacha, K. & Barabach, S. Heart rate impact on the reproducibility of heart rate variability analysis. \JournalTitleInternational Journal of Cardiology 168, 4257–4259 (2013). https://doi.org/10.1016/j.ijcard.2013.04.160.
- [156] Sandercock, G. R., Bromley, P. D. & Brodie, D. A. The reliability of short-term measurements of heart rate variability. \JournalTitleInternational Journal of Cardiology 103, 238–247 (2005). https://doi.org/10.1016/j.ijcard.2004.09.013.
- [157] Mangalam, M., Metzler, R. & Kelty-Stephen, D. Ergodic characterization of non-ergodic anomalous diffusion. \JournalTitlePhysical Review Research 0, 000000 (2023). https://doi.org/10.1098/rsif.2022.0095.
- [158] Kiyono, K., Struzik, Z. R., Aoyagi, N. & Yamamoto, Y. Multiscale probability density function analysis: Non-Gaussian and scale-invariant fluctuations of healthy human heart rate. \JournalTitleIEEE Transactions on Biomedical Engineering 53, 95–102 (2005). https://doi.org/10.1109/TBME.2005.859804.
- [159] Hayano, J. et al. Increased non-Gaussianity of heart rate variability predicts cardiac mortality after an acute myocardial infarction. \JournalTitleFrontiers in Physiology 2, 65 (2011). https://doi.org/10.3389/fphys.2011.00065.
- [160] Kiyono, K., Struzik, Z. R. & Yamamoto, Y. Estimator of a non-Gaussian parameter in multiplicative log-normal models. \JournalTitlePhysical Review E 76, 041113 (2007). https://doi.org/10.1103/PhysRevE.76.041113.
- [161] Kiyono, K., Hayano, J., Watanabe, E., Struzik, Z. R. & Yamamoto, Y. Non-Gaussian heart rate as an independent predictor of mortality in patients with chronic heart failure. \JournalTitleHeart Rhythm 5, 261–268 (2008). https://doi.org/10.1016/j.hrthm.2007.10.030.
- [162] Kiyono, K. Log-amplitude statistics of intermittent and non-Gaussian time series. \JournalTitlePhysical Review E 79, 031129 (2009). https://doi.org/10.1103/PhysRevE.79.031129.
- [163] Kiyono, K., Hayano, J., Kwak, S., Watanabe, E. & Yamamoto, Y. Non-Gaussianity of low frequency heart rate variability and sympathetic activation: Lack of increases in multiple system atrophy and Parkinson disease. \JournalTitleFrontiers in Physiology 3, 34 (2012). https://doi.org/10.3389/fphys.2012.00034.
- [164] He, Y., Burov, S., Metzler, R. & Barkai, E. Random time-scale invariant diffusion and transport coefficients. \JournalTitlePhysical Review Letters 101, 058101 (2008). https://doi.org/10.1103/PhysRevLett.101.058101.
- [165] Thirumalai, D., Mountain, R. D. & Kirkpatrick, T. Ergodic behavior in supercooled liquids and in glasses. \JournalTitlePhysical Review A 39, 3563 (1989). https://doi.org/10.1103/PhysRevA.39.3563.
- [166] Deng, W. & Barkai, E. Ergodic properties of fractional Brownian-Langevin motion. \JournalTitlePhysical Review E 79, 011112 (2009). https://doi.org/10.1103/PhysRevE.79.011112.
- [167] Wang, W. et al. Fractional Brownian motion with random diffusivity:Emerging residual nonergodicity below the correlation time. \JournalTitleJournal of Physics A: Mathematical and Theoretical 53, 474001 (2020). https://doi.org/10.1088/1751-8121/aba467.
- [168] Lovejoy, S. & Schertzer, D. The Weather and Climate: Emergent Laws and Multifractal Cascades (Cambridge University Press, Cambridge, UK, 2018).
- [169] Kelty-Stephen, D. G., Lane, E., Bloomfield, L. & Mangalam, M. Multifractal test for nonlinearity of interactions across scales in time series. \JournalTitleBehavior Research Methods 1–34 (2022). https://doi.org/10.3758/s13428-022-01866-9.
- [170] Efron, B. Logistic regression, survival analysis, and the Kaplan-Meier curve. \JournalTitleJournal of the American Statistical Association 83, 414–425 (1988).
- [171] Rich, J. T. et al. A practical guide to understanding Kaplan-Meier curves. \JournalTitleOtolaryngology–Head and Neck Surgery 143, 331–336 (2010). https://doi.org/10.1016/j.otohns.2010.05.007.
- [172] Coutts, L. V., Plans, D., Brown, A. W. & Collomosse, J. Deep learning with wearable based heart rate variability for prediction of mental and general health. \JournalTitleJournal of Biomedical Informatics 112, 103610 (2020). https://doi.org/10.1016/j.jbi.2020.103610.
- [173] Hannun, A. Y. et al. Cardiologist-level arrhythmia detection and classification in ambulatory electrocardiograms using a deep neural network. \JournalTitleNature Medicine 25, 65–69 (2019). https://doi.org/10.1038/s41591-018-0268-3.
- [174] Hong, S., Zhou, Y., Shang, J., Xiao, C. & Sun, J. Opportunities and challenges of deep learning methods for electrocardiogram data: A systematic review. \JournalTitleComputers in Biology and Medicine 122, 103801 (2020). https://doi.org/10.1016/j.compbiomed.2020.103801.
- [175] Kim, H., Ishag, M. I. M., Piao, M., Kwon, T. & Ryu, K. H. A data mining approach for cardiovascular disease diagnosis using heart rate variability and images of carotid arteries. \JournalTitleSymmetry 8, 47 (2016). https://doi.org/10.3390/sym8060047.
- [176] Torres-Soto, J. & Ashley, E. A. Multi-task deep learning for cardiac rhythm detection in wearable devices. \JournalTitlenpj Digital Medicine 3, 116 (2020). https://doi.org/10.1038/s41746-020-00320-4.
- [177] Wang, L. & Zhou, X. Detection of congestive heart failure based on LSTM-based deep network via short-term RR intervals. \JournalTitleSensors 19, 1502 (2019). https://doi.org/10.3390/s19071502.
- [178] Baek, H. J. & Shin, J. Effect of missing inter-beat interval data on heart rate variability analysis using wrist-worn wearables. \JournalTitleJournal of Medical Systems 41, 147 (2017). https://doi.org/10.1007/s10916-017-0796-2.
- [179] Kim, K. K., Kim, J. S., Lim, Y. G. & Park, K. S. The effect of missing RR-interval data on heart rate variability analysis in the frequency domain. \JournalTitlePhysiological Measurement 30, 1039 (2009). https://doi.org/10.1111/j.1540-8159.2010.02841.x.
- [180] Kim, K. K., Baek, H. J., Lim, Y. G. & Park, K. S. Effect of missing RR-interval data on nonlinear heart rate variability analysis. \JournalTitleComputer Methods and Programs in Biomedicine 106, 210–218 (2012). https://doi.org/10.1016/j.cmpb.2010.11.011.
- [181] Mäkikallio, T. H. et al. Fractal analysis of heart rate dynamics as a predictor of mortality in patients with depressed left ventricular function after acute myocardial infarction. \JournalTitleAmerican Journal of Cardiology 83, 836–839 (1999). https://doi.org/10.1016/s0002-9149(98)01076-5.
- [182] Huikuri, H. V. et al. Fractal correlation properties of rr interval dynamics and mortality in patients with depressed left ventricular function after an acute myocardial infarction. \JournalTitleCirculation 101, 47–53 (2000). https://doi.org/10.1161/01.cir.101.1.47.
- [183] Maestri, R. et al. Assessing nonlinear properties of heart rate variability from short-term recordings: Are these measurements reliable? \JournalTitlePhysiological Measurement 28, 1067 (2007). https://doi.org/10.1088/0967-3334/28/9/008.
- [184] Perkiömäki, J. S. et al. Fractal and complexity measures of heart rate dynamics after acute myocardial infarction. \JournalTitleAmerican Journal of Cardiology 88, 777–781 (2001). https://doi.org/10.1016/s0002-9149(01)01851-3.
- [185] Pikkujamsa, S. M., Makikallio, T. H., Airaksinen, K. J. & Huikuri, H. V. Determinants and interindividual variation of rr interval dynamics in healthy middle-aged subjects. \JournalTitleAmerican Journal of Physiology-Heart and Circulatory Physiology 280, H1400–H1406 (2001). https://doi.org/10.1152/ajpheart.2001.280.3.H1400.
- [186] Jokinen, V., Tapanainen, J. M., Seppänen, T. & Huikuri, H. V. Temporal changes and prognostic significance of measures of heart rate dynamics after acute myocardial infarction in the beta-blocking era. \JournalTitleAmerican Journal of Cardiology 92, 907–912 (2003). https://doi.org/10.1016/S0002-9149(03)00968-8.
- [187] Mandelbrot, B. B. Intermittent turbulence in self-similar cascades: Divergence of high moments and dimension of the carrier. \JournalTitleJournal of Fluid Mechanics 62, 331–358 (1974). https://doi.org/10.1017/S0022112074000711.
- [188] Mandelbrot, B. B. & Van Ness, J. W. Fractional Brownian motions, fractional noises and applications. \JournalTitleSIAM Review 10, 422–437 (1968). https://doi.org/10.1137/1010093.
- [189] Mandelbrot, B. B. & Mandelbrot, B. B. The Fractal Geometry of Nature (WH Freeman, New York, NY, 1982).
- [190] Partridge, T. & Greenberg, G. Contemporary ideas in physics and biology in Gottlieb’s psychology. In Hood, K. E., Halpern, C. T., Greenberg, G. & Lerner, R. M. (eds.) Handbook of Developmental Science, Behavior, and Genetics, 121–145 (Wiley-Blackwell Oxford, UK, 1976).
- [191] Barkai, E., Garini, Y. & Metzler, R. Strange kinetics of single molecules in living cells. \JournalTitlePhysics Today 65, 29 (2012). http://dx.doi.org/10.1063/PT.3.1677.
- [192] Fuliński, A. Anomalous diffusion and weak nonergodicity. \JournalTitlePhysical Review E 83, 061140 (2011). https://doi.org/10.1103/PhysRevE.83.061140.
- [193] Krapf, D. & Metzler, R. Strange interfacial molecular dynamics. \JournalTitlePhysics Today 72, 48–55 (2019). https://doi.org/10.1063/PT.3.4294.
- [194] Magdziarz, M. & Weron, A. Anomalous diffusion: Testing ergodicity breaking in experimental data. \JournalTitlePhysical Review E 84, 051138 (2011). https://doi.org/10.1103/PhysRevE.84.051138.
- [195] Metzler, R. & Jeon, J.-H. The role of ergodicity in anomalous stochastic processes: Analysis of single-particle trajectories. \JournalTitlePhysica Scripta 86, 058510 (2012). https://doi.org/10.1088/0031-8949/86/05/058510.
- [196] Metzler, R., Jeon, J.-H., Cherstvy, A. G. & Barkai, E. Anomalous diffusion models and their properties: Non-stationarity, non-ergodicity, and ageing at the centenary of single particle tracking. \JournalTitlePhysical Chemistry Chemical Physics 16, 24128–24164 (2014). https://doi.org/10.1039/C4CP03465A.
- [197] Muñoz-Gil, G. et al. Objective comparison of methods to decode anomalous diffusion. \JournalTitleNature Communications 12, 6253 (2021). https://doi.org/10.1038/s41467-021-26320-w.
- [198] Thiel, F. & Sokolov, I. M. Weak ergodicity breaking in an anomalous diffusion process of mixed origins. \JournalTitlePhysical Review E 89, 012136 (2014). https://doi.org/10.1103/PhysRevE.89.012136.
- [199] Vinod, D., Cherstvy, A. G., Wang, W., Metzler, R. & Sokolov, I. M. Nonergodicity of reset geometric Brownian motion. \JournalTitlePhysical Review E 105, L012106 (2022). https://doi.org/10.1103/PhysRevE.105.L012106.
- [200] Wang, W., Cherstvy, A. G., Metzler, R. & Sokolov, I. M. Restoring ergodicity of stochastically reset anomalous-diffusion processes. \JournalTitlePhysical Review Research 4, 013161 (2022). https://doi.org/10.1103/PhysRevResearch.4.013161.
- [201] Peng, C.-K. et al. Mosaic organization of DNA nucleotides. \JournalTitlePhysical Review E 49, 1685 (1994). https://doi.org/10.1103/PhysRevE.49.1685.
- [202] Peng, C.-K., Havlin, S., Stanley, H. E. & Goldberger, A. L. Quantification of scaling exponents and crossover phenomena in nonstationary heartbeat time series. \JournalTitleChaos 5, 82–87 (1995). https://doi.org/10.1063/1.166141.
- [203] Chhabra, A. & Jensen, R. V. Direct determination of the f () singularity spectrum. \JournalTitlePhysical Review Letters 62, 1327 (1989). https://doi.org/10.1103/PhysRevLett.62.1327.
- [204] Halsey, T. C., Jensen, M. H., Kadanoff, L. P., Procaccia, I. & Shraiman, B. I. Fractal measures and their singularities: The characterization of strange sets. \JournalTitlePhysical Review A 33, 1141 (1986). https://doi.org/10.1103/PhysRevA.33.1141.
- [205] Mandelbrot, B. B. Fractals and Scaling in Finance: Discontinuity, Concentration, Risk (Springer, New York, NY, 2013).
- [206] Zamir, M. Critique of the test of multifractality as applied to biological data. \JournalTitleJournal of Theoretical Biology 225, 407–412 (2003). https://doi.org/10.1016/S0022-5193(03)00261-3.
- [207] Veneziano, D., Moglen, G. E. & Bras, R. L. Multifractal analysis: Pitfalls of standard procedures and alternatives. \JournalTitlePhysical Review E 52, 1387 (1995). https://doi.org/10.1103/PhysRevE.52.1387.
- [208] Ihlen, E. A. Introduction to multifractal detrended fluctuation analysis in Matlab. \JournalTitleFrontiers in Physiology 3, 141 (2012). https://doi.org/10.3389/fphys.2012.00141.
- [209] Schreiber, T. & Schmitz, A. Improved surrogate data for nonlinearity tests. \JournalTitlePhysical Review Letters 77, 635 (1996). https://doi.org/10.1103/PhysRevLett.77.635.
- [210] Rytov, S. M., Kravtsov, Y. A. & Tatarskii, V. I. Principles of Statistical Radiophysics: Wave Propagation Through Random Media (Springer, Berlin, Germany, 1989).
- [211] Cherstvy, A. G., Chechkin, A. V. & Metzler, R. Anomalous diffusion and ergodicity breaking in heterogeneous diffusion processes. \JournalTitleNew Journal of Physics 15, 083039 (2013). https://doi.org/10.1088/1367-2630/15/8/083039.
- [212] R Core Team. R: A language and environment for statistical computing (2013). https://www.R-project.org/.
- [213] Therneau, T. M. & Lumley, T. Package ’survival’. \JournalTitleR Top Doc 128, 28–33 (2015). https://cran.r-project.org/package=survival.