Galactic diffuse gamma-ray emission from GeV to PeV energies in light of up-to-date cosmic ray measurements
Abstract
The diffuse -ray emission between 10 and 1000 TeV from the Galactic plane was recently measured by the Large High Altitude Air Shower Observatory (LHAASO). These observations will help tremendously in constraining the propagation and interaction of cosmic rays in the Milky Way. Additionally, new measurements of CR spectra reach a very high precision up to 100 TeV energies, revealing multiple spectral structures of various species. In this work, we confront the model prediction of the diffuse -ray emission, based on up-to-date measurements of the local cosmic ray spectra and simplified propagation setup, with the measurements of diffuse -rays. To better constrain the low-energy part of the model, we analyze the 14.6 years of Fermi-LAT data to extract the Galactic diffuse emission between 1 and 500 GeV from the same sky regions of LHAASO, after subtracting the contribution from known sources and the isotropic diffuse -ray background. The joint Fermi-LAT and LHAASO spectra thus cover a very wide energy range from 1 GeV to 1 PeV with small gaps from 0.5 to 10 TeV. Compared with the prediction, we find that clear excesses between several GeV and TeV of the diffuse emission exist. Possible reasons to explain the excesses may include unresolved sources or more complicated propagation models. We illustrate that an exponential-cutoff-power-law component with an index of and cutoff energy of TeV is able to account for such excesses.
1 Introduction
The origin and propagation of cosmic rays (CRs) are one of the most important questions in astroparticle physics. Except for the ultra-high energy end ( EeV), most CR particles lose their directions due to the deflection in the Galactic magnetic field, resulting in difficulties in understanding their origin. Because measurements of CRs only exist for the location of the Sun, the overall distribution of CRs in the Milky Way can only be inferred indirectly. The diffuse -ray emission produced by interactions between CR particles and the diffuse medium and radiation fields, on the other hand, carries important information of the distribution of CRs far away from the solar location and thus is crucial to constraining the origin and propagation of CRs (Strong et al., 2000, 2004, 2007).
In past years, both the (direct or indirect) measurements of CRs and diffuse rays achieve big progresses. In direct detection experiments, carried out in space or on balloons, CR particles directly enter the detector. This allows to determine not only the energy and direction, but also to measure precisely the charge and mass numbers. Hardening features around hundreds of GV rigidities (Panov et al., 2007; Ahn et al., 2010; Adriani et al., 2011; Aguilar et al., 2015b, a; Adriani et al., 2019; An et al., 2019; Alemanno et al., 2021) and softening features around 10 TV rigidity (Yoon et al., 2017; Atkin et al., 2018; An et al., 2019; Alemanno et al., 2021; Adriani et al., 2022; Choi et al., 2022) were revealed by many direct detection experiments. The indirect measurements by ground-based experiments detect the secondary particles or photons produced when CR particles interact with the atmosphere. This method allows to detect CRs with even higher energies. However, a precise measurement of the particle type is not possible anymore, due to the relatively small differences of secondary particle contents of different primary nuclei with the same energy (Engel et al., 2011), and hence the spectra of individual particle species have relatively large uncertainties (Antoni et al., 2005; Apel et al., 2013; Aartsen et al., 2019). Nevertheless, the understanding of the wide-band energy spectra below the so-called “knee” of CRs111The “knee” is a spectral softening feature at several PeV, which may reflect the maximum acceleration energy of Galactic sources or the leakage of CRs to space out of the Galaxy (Hörandel, 2004)., improves remarkably than before. As for the diffuse -ray emission, the space satellites measured the all-sky emission up to TeV energies (Hunter et al., 1997; Ackermann et al., 2012). It was shown that predictions, based on CR distribution and the diffuse medium and radiation fields, are consistent with the data measured by Fermi-LAT at high and intermediate latitudes but under-predict the data in the inner Galaxy for energies above a few GeV (Ackermann et al., 2012). At very-high-energy (VHE) to ultra-high-energy (UHE) bands, diffuse -ray emission were only detected from selected regions of the Galactic plane by ground-based experiments such as Milagro (Abdo et al., 2007, 2008), H.E.S.S. (Abramowski et al., 2014), ARGO-YBJ (Bartoli et al., 2015), and Tibet AS (Amenomori et al., 2021). The HAWC experiment also reported a preliminary analysis of the diffuse emission from the inner region of the Galactic plane (Abeysekara et al., 2021). Even if the flux points of the VHE diffuse emission are sparse and the uncertainties are large, these results shed new light on the understanding of the production and propagation of Galactic CRs (Fang & Murase, 2021; Liu & Wang, 2021; Koldobskiy et al., 2021b; Tibaldo et al., 2021; Qiao et al., 2022; Dzhatdoev, 2021; Breuhaus et al., 2022; Zhang et al., 2022).
Very recently, significantly improved measurements of the VHE-UHE diffuse emission from 10 TeV to 1000 TeV from both the inner and outer Galactic plane (Cao et al., 2023a) were obtained by the Large High Altitude Air Shower Observatory (LHAASO; Ma et al., 2022). Particularly, LHAASO measured the diffuse emission from the outer Galactic plane for the first time, which can give more comprehensive constraints on the CR distribution in the Galaxy. Based on the improved measurements of the local CR spectra and diffuse emission, one can better constrain the CR injection, propagation, and interaction in the Milky Way (Schwefer et al., 2022; Marinos et al., 2023).
In this work, we re-visit the diffuse -ray emission from the interactions between CRs and the interstellar medium (ISM) or the interstellar radiation field (ISRF), according to the new measurements. The injection and propagation parameters of CRs are tuned to fit the up-to-date measurements of primary and secondary CRs (including electrons and positrons) in a wide energy range. The measurements of low-energy spectra out of the canonical heliosphere by Voyager-1 are also used to constrain the CR spectra in the local interstellar space (Cummings et al., 2016). Diffuse -ray emission from CR interactions is then calculated and compared with the measurements from GeV to sub-PeV energies. To enable a consistent comparison between the model and data, we re-analyze the Fermi-LAT data in the same sky regions as the LHAASO measurements, and apply the same masks to reduce the contamination of resolved sources to the diffuse emission.
The rest of this paper is arranged as follows. In Sec. 2 we present the Fermi-LAT data analysis. In Sec. 3 we describe the model of diffuse -ray emission, including the CR propagation model, the fitting of CR spectra, and the calculation of -ray production and absorption. In Sec. 4 we confront the model predictions of the diffuse emission with the wide-band data. We conclude this work in Sec. 5.
2 Fermi-LAT data analysis
To compare the model prediction of the Galactic diffuse emission with observations in a wide energy band, we analyze the Fermi-LAT data from 1 GeV to 500 GeV in selected sky regions same as those adopted in the LHAASO analysis, i.e., the inner Galaxy region with , and the outer Galaxy region with , . The newest reconstructed P8R3 ULTRACLEANVETO Fermi-LAT data222https://fermi.gsfc.nasa.gov/ssc/data/access/, which have a good CR background rejection performance, are used. We select in total 761 weeks of data recorded from August 4, 2008 to March 2, 2023. To suppress the contamination from -rays generated by CR interactions in the upper layers of the atmosphere, photons with zenith angles larger than 90∘ are removed. Moreover, we filter the data using the specification (DATAQUAL0) (LATCONFIG==1) to select good time intervals in which the satellite was working in the standard data-taking mode and the data quality is good. We bin the data into 15 logarithmically evenly distributed energy bins and take pixel size for the spatial binning. Some of the sources detected by Fermi-LAT are not detected by KM2A, and we need to remove their contribution properly. The source model XML file is generated based on the 4FGL catalog (Abdollahi et al., 2020). For the diffuse background emissions, we take the Galactic diffuse model gll_iem_v07.fits and the isotropic background spectrum iso_P8R3_ULTRACLEANVETO_V3_v1.txt as recommended by the Fermi-LAT collaboration333https://fermi.gsfc.nasa.gov/ssc/data/access/lat/BackgroundModels.html. We employ the binned likelihood analysis method to analyze the data with Fermitools version 2.2.0, to re-fit the contribution from point sources and extended sources within our regions of interest. The instrument response function (IRF) adopted is P8R3_ULTRACLEANVETO_V3. Then we take the best-fitting model and use gtmodel to generate the model cube which includes contributions from point sources, extended sources, and the isotropic background. Through subtracting the model cube obtained above from the data, we get the residual photon counts which are expected to be mainly from the Galactic diffuse emission. To have consistent sky regions with the LHAASO measurements, we use the same mask method adopted in the LHAASO analysis (Cao et al., 2023a). We divide the residual photon counts by the energy interval of the energy bin, the mean exposure, and the solid angle of selected regions, to obtain the fluxes.
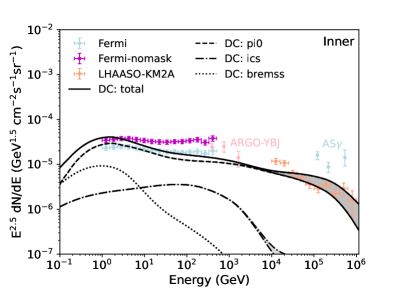
Due to the large photon counts observed by Fermi-LAT, the statistical errors are small. However, there are systematic errors which need to be considered. Our target regions lie in the Galactic plane, therefore the contribution from the isotropic component is expected to be sub-dominant, as indicated in Ackermann et al. (2012) for the Galactic disk region. We use different functional forms of the isotropic component given in Ackermann et al. (2015), and find that this would affect the fluxes by about 2.5%. We also checked the effect of different GDE models on the resulting fluxes, and it is negligible. Since our target regions cover a large portion of the sky, the exposure at different energies in these areas may vary at the 10% level. The systematic errors from the effective area can reach about 5%. Taking all the statistical and systematical errors into account, we report the Fermi-LAT fluxes of the two sky regions in Table 1. For reference, we also give the Fermi-LAT diffuse -ray fluxes in these sky regions without sources masks but just subtracting the source contribution according to Fermi-LAT source catalog. The non-mask fluxes and the comparison with the masked fluxes as well as the model predictions are presented in Appendix A. In the inner region, the masking reduces the resulting fluxes by a noticeable amount.
| GeV) | |||
|---|---|---|---|
| (GeV) | (GeV-1cm-2s-1sr-1) | (GeV-1cm-2s-1sr-1) | |
| 0.00-0.18 | 1.23 | ||
| 0.18-0.36 | 1.86 | ||
| 0.36-0.54 | 2.82 | ||
| 0.54-0.72 | 4.26 | ||
| 0.72-0.90 | 6.45 | ||
| 0.90-1.08 | 9.76 | ||
| 1.08-1.26 | 14.78 | ||
| 1.26-1.44 | 22.36 | ||
| 1.44-1.62 | 33.84 | ||
| 1.62-1.80 | 51.21 | ||
| 1.80-1.98 | 77.50 | ||
| 1.98-2.16 | 117.28 | ||
| 2.16-2.34 | 177.48 | ||
| 2.34-2.52 | 268.58 | ||
| 2.52-2.70 | 406.45 |
3 Model of diffuse emission
3.1 Cosmic ray propagation model
We use the GALPROP package444https://galprop.stanford.edu (Strong & Moskalenko, 1998; Moskalenko & Strong, 1998) to calculate the propagation of CRs and the production of secondary particles and emission. GALPROP solves the propagation equations numerically, with inputs of the ISM, the magnetic and radiation fields from astronomical observations and cross sections from nuclear and particle physics experiments. The three-dimensional ISM distribution is obtained based on surveys of HI and CO emission, together with a modeling of the ionized gas (Gordon & Burton, 1976; Bronfman et al., 1988; Cordes et al., 1991). The ISRF distribution is calculated based on the stellar population and dust absorption and re-emission (Porter & Strong, 2005). The magnetic field is assumed to be an analytical form of (adjusted from Moskalenko & Strong, 1998). More details can be found in the manual of GALPROP555https://galprop.stanford.edu/code.php?option=manual.
In this work we employ a one-zone cylindrically symmetric geometry to describe the propagation volume of CRs in the Milky Way. The radial extension of the propagation cylinder is fixed to be kpc, and the halo height is a free parameter to be fitted using the CR data. The propagation of charged particles in the random magnetic field is characterized by a diffusion process, including possible convection, reacceleration by randomly moving magnetized plasma waves, energy losses and fragmentations due to interactions with the ISM (Ginzburg & Syrovatskii, 1964; Strong et al., 2007).
The diffusion coefficient is parameterized as , where is particle’s rigidity, is dimensionless velocity in unit of light speed, is the slope of rigidity dependence, and is a phenomenological parameter introduced to better fit the low energy secondary-to-primary ratios. The convection velocity is assumed to be perpendicular to the Galactic plane, with magnitude being proportional to coordinate. The convection velocity is assumed to be 0 at , and the gradient is a free parameter. The reacceleration is described by a diffusion in the momentum space, whose strength is characterized by the Alfvenic speed of magnetized disturbances (Seo & Ptuskin, 1994). The parameters , , , or , and are the free parameters of the propagation model.
In this work we assume that the complicated spectral structures are due to the source injection. Alternative models including the change of the diffusion coefficient666For example, breaks of the secondary-to-primary ratios revealed by recent measurements (Aguilar et al., 2021; Alemanno et al., 2022) suggest possible changes of the standard propagation framework of CRs (Ma et al., 2023). (either the spectrum or the spatial distribution; Vladimirov et al., 2012; Génolini et al., 2017; Tomassetti, 2012; Guo & Yuan, 2018; Zhao et al., 2021) or the inclusion of discrete sources (Sveshnikova et al., 2013; Liu et al., 2019; Zhang et al., 2021) are not discussed here. We employ multiple smooth breaks to describe those features. An exponential cutoff with characteristic cutoff rigidity is adopted to describe the knee of those particles. The injection spectrum takes the form of
| (1) |
We fix the smoothness parameter , and choose different values of for different particles. For protons and helium, we choose .
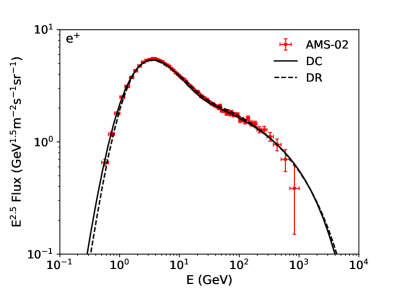
For electrons and positrons, we adopt the three-component model, i.e., primary electrons from CR acceleration sources, secondary electrons and positrons from CR collision with the ISM, and additional positrons and electrons from some new source population such as pulsars to account for the positron (and electron) excesses (Yuan & Feng, 2018). The injection spectrum of primary electrons is parameterized as Eq. (1), but with . For the additional positron and electron component, we use but with an additional low-energy exponential cutoff, and assume a charge symmetry between positrons and electrons. We further multiply a constant factor on the secondary positron and electron spectra in order to better match the low-energy data. Physically the factor may represents potential uncertainties from the inelastic hadronic interaction models or differences of the propagation between leptons and nuclei. The spatial distribution of primary species is assumed to follow that of supernova remnants or pulsars, , with kpc and kpc (Trotta et al., 2011).
3.2 Cosmic ray fitting results
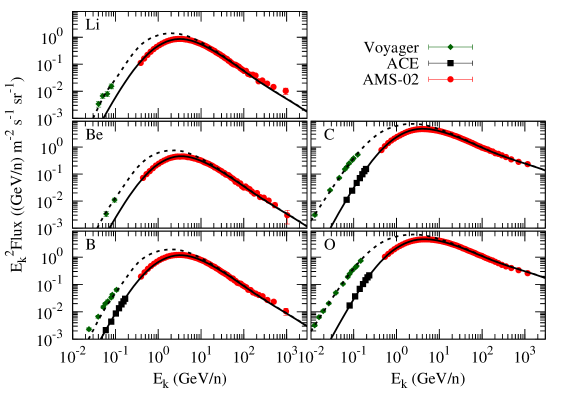
In this work we use the CR propagation parameters obtained in Yuan et al. (2020) which fitted the fluxes of Li, Be, B, C, and O by AMS-02 (Aguilar et al., 2017, 2018), Voyager-1 (Cummings et al., 2016), and ACE777http://www.srl.caltech.edu/ACE/ASC/level2/lvl2DATA_CRIS.html (Yuan, 2019). To link the Voyager-1 measurements which were expected to take place outside the solar system with the measurements on top of the Earth, a force-field solar modulation model (Gleeson & Axford, 1968) is used. Two typical setups of the CR propagation model, the diffusion + convection (DC) one888However, as shown in Yuan et al. (2020), the fitted convection velocity is close to 0 and the model reduces to a plain diffusion model. and the diffusion + reacceleration (DR) one are assumed. The improvement of the fitting for a model including both reacceleration and convection is expected to be limited since a large convection velocity is disfavored by the data and the DR model already fits the data well (Yuan et al., 2020). The best-fitting propagation parameters are given in Table 2 (Yuan et al., 2020), and the comparisons between the best-fitting model predictions and observational data are shown in Fig. A2 of Appendix B. More details about the fitting procedure and results can be found in Yuan et al. (2020).
| Model | ||||||
|---|---|---|---|---|---|---|
| ( cm2 s-1) | (kpc) | (km s-1 kpc-1) | (km s-1) | |||
| DC | (95% C.L.) | — | ||||
| DR | — |
| Proton | Helium | |||||||
|---|---|---|---|---|---|---|---|---|
| DC-high | DC-low | DR-high | DR-low | DC-high | DC-low | DR-high | DR-low | |
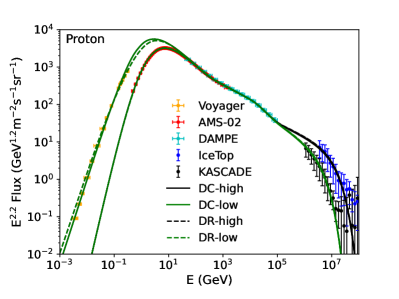
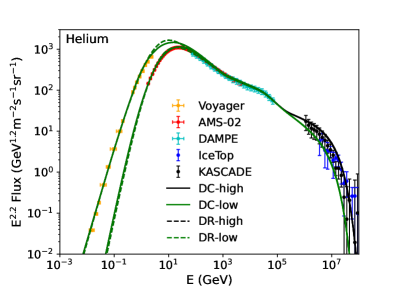
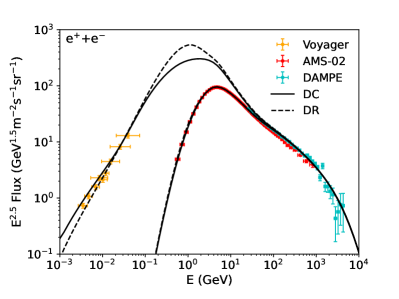
Fixing the propagation parameters derived from fitting to the intermediate mass nuclei, we get the injection spectra of protons, helium nuclei, electrons, and positrons which are most relevant to the calculation of diffuse -rays. The proton and helium data used include those measured by Voyager-1 (Cummings et al., 2016), AMS-02 (Aguilar et al., 2021, 2017), DAMPE (An et al., 2019; Alemanno et al., 2021), IceTop (Aartsen et al., 2019) and KASCADE-Grande (Apel et al., 2013). Since the measurements around the knee region show remarkable differences among different experiments, we try to match the data with high and low flux assumptions to give an uncertainty band of the results. For positrons and electrons we use the positron spectrum measured by AMS-02 (Aguilar et al., 2019b), the total electron plus positron spectra measured by Voyager-1 (Cummings et al., 2016), AMS-02 (Aguilar et al., 2019a), and DAMPE (DAMPE Collaboration et al., 2017). The derived source parameters are given in Tables 3 and 4. Fig. 1 shows the spectra of protons, helium nuclei, positrons, and total electrons plus positrons, compared with the data. The major spectral structures of these particles can be properly reproduced.
| Model | /GV | /GV | /GV | /TV | /GV | ||||
|---|---|---|---|---|---|---|---|---|---|
| DC | 0.876 | ||||||||
| DR | 1.000 | ||||||||
| Model | /GV | /GV | /TV | /GV | |||||
| DC | 0.783 | ||||||||
| DR | 0.950 |
†Pre-propagated normalization of new source population at 1 GeV in unit of cm-3 s-1 MeV-1.
3.3 Calculation of diffuse -ray emission
Using the CR model parameters we calculate the diffuse -ray emission from the neutral pion decay, the bremsstrahlung and inverse Compton scattering components with GALPROP. The gamma-ray production from secondary particles by inelastic hadronic interactions is calculated with the AAfrag package (Kachelrieß et al., 2019), which uses the updated QGSJET-II-04m model for hadronic interactions with parameters tuned based on recent data from the LHCf, LHCb, and NA61 experiments.
For VHE -ray photons, the pair production attenuation due to scattering with the ISRF background is important, which needs to be included. The optical depth of a high-energy photon with energy and location is
| (2) |
where with being the angle between the momenta of the incoming photon and the background photon, and is the number density of the background radiation field. The pair production cross section is (Zhang et al., 2006)
| (3) |
where is the Thomson cross section, and are the energy and momentum of the electron or positron in the center-of-momentum system, is the center-of-momentum energy. An attenuation factor has been multiplied to the calculated -ray emissivity before the line-of-sight integration.
4 Confronting model predictions with measurements
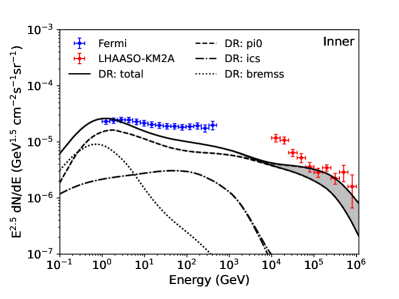
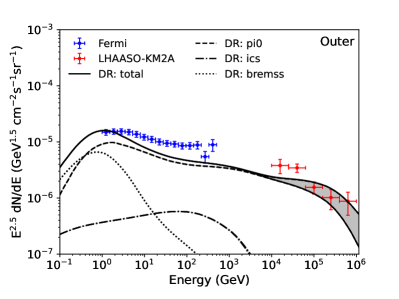
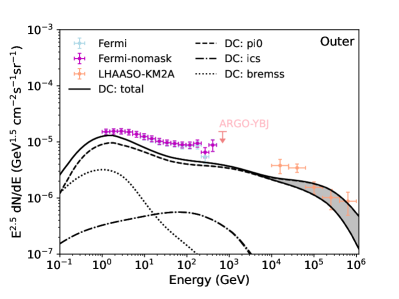
The model predicted diffuse -ray spectra, together with the measurements by LHAASO and Fermi-LAT are shown in Fig. 2. For all the model results, we apply the same masks as shown in Cao et al. (2023a) to enable a self-consistent comparison. We can see that the model predictions are only consistent with the data at the lowest energies (less than a few GeV). Clear excesses of the emission from a few GeV to TeV are visible. At the highest energy end (above TeV), the upper edges of the predicted results are marginally consistent with the data. To see the effect of source masks, we also show the comparison between the DC model predictions with the Fermi-LAT data without source masks in Fig. A1 in Appendix A. Similar excesses above a few GeV can also be seen clearly.
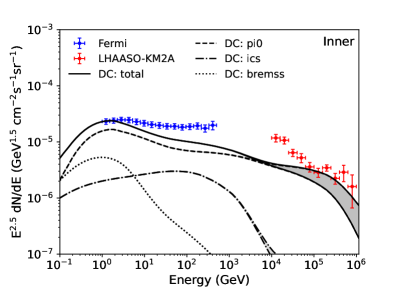
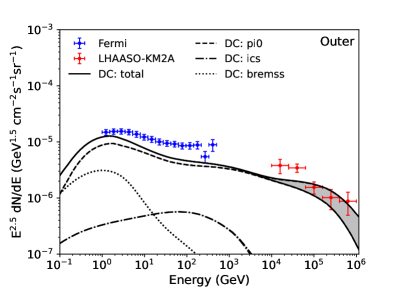
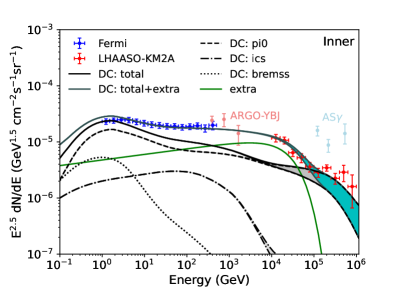
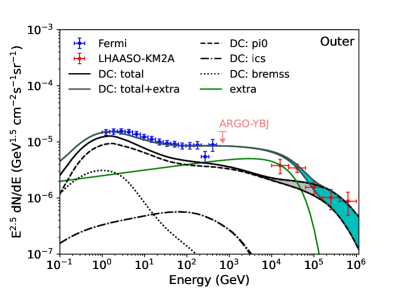
Excesses from the Galactic plane for energies above a few GeV were also revealed through comparing the measurements with the models (Prodanović et al., 2007; Ackermann et al., 2012). One possible origin of those excesses is undetected point-like sources. A widely discussed candidate population of unresolved sources is pulsars or pulsar wind nebulae (Aharonian & Atoyan, 2000; Linden & Buckman, 2018; Vecchiotti et al., 2022; Yan & Liu, 2023). To see whether such an additional component can fit the data, we simply add an exponential-cutoff-power-law (ECPL) function to the total emission for the DC model, with a spectral index of and cutoff energy of TeV. The results can match the data from GeV to PeV well, as shown in Fig. 3. Slight excesses in the inner region for TeV may indicate that unresolved PeVatrons still exist in the data. The normalization of the ECPL component in the inner region is about two times of that in the outer region, which is very close to the expected ratio according to the source distribution as described in Sec. 3.1 (). It indicates that they might be from a single population with spatial distribution close to the supernova remnants or pulsars. We also note that the longitudinal distribution of the observed diffuse emission seems not closely follow the gas distribution (Cao et al., 2023a), which may further support the unresolved source origin of the excesses.
Other scenarios to give higher diffuse fluxes may include hadronic interactions between freshly accelerated CRs and the medium surrounding acceleration sources (Yang & Aharonian, 2019; Zhang et al., 2022), the spatial variations of the CR spectra (Yang et al., 2016; Lipari & Vernetto, 2018; De La Torre Luque et al., 2023), or the transition of different propagation regimes (Reichherzer et al., 2022). However, since the excesses mainly exist in an energy range from several GeV to 60 TeV, the required spectral shape of the excess component is distinct from that of a continuous CR spectrum like the background sea. Whether these models can account for the data needs detailed studies.
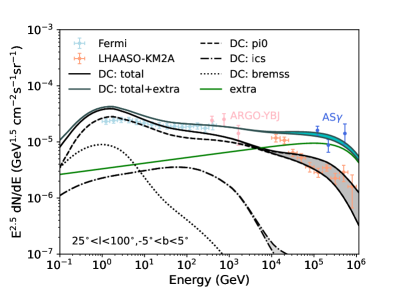
In Fig. 4 we compare the model predictions with the AS data for sky region of and , with the mask adopted in the AS analysis (Amenomori et al., 2021). One can see that the model predictions are significantly lower than the data. Adding an extra ECPL component with index of and cutoff energy of 1 PeV may account for the data. However, it should be noted that the mask region of AS, i.e., radius disks around detected sources, might not be enough to exclude the emission from those sources (Cao et al., 2023b).
5 Conclusion and discussion
Motivated by the recent measurements of diffuse -ray emission from the Galactic plane by LHAASO (Cao et al., 2023a), we study the emission model from interactions between Galactic CRs and the ISM, in a wide energy range from GeV to PeV. We re-analyze the Fermi-LAT data to derive the diffuse emission from 1 to 500 GeV in the two sky regions consistent with those adopted by LHAASO. This will allow us to have a self-consistent wide-band comparison between model and data. Using the latest measurements of local CR spectra, we get improved constraints on the propagation and injection parameters of CRs under the framework of one-zone, homogeneous, and isotropic diffusion scenario. Possible reacceleration or convection transportation of CRs is included in the model. Based on the CR parameters, we obtain the diffuse -ray emission, and compare the model predictions with the Fermi-LAT and LHAASO data. We find that the model under-predicts the diffuse fluxes between several GeV and TeV. Such excesses may be explained by an extra component characterized by an ECPL spectrum ().
In the current LHAASO analysis, a considerable fraction of the sky has been masked to reduce the impact from detected sources. While the diffuse emission is expected to be the brightest toward the central plane of the Galaxy, such masks remove a significant part of the diffuse emission. Refined treatment of the source removal will be helpful in better constraining the modelling of diffuse rays and Galactic CRs. Improved measurements of the variations of energy spectra across the Galactic plane will also be very important.
The propagation model of CRs is under a framework of homogeneous and isotropic diffusion, which may be over-simplified. More sophisticated models with spatially-dependent propagation as inferred from observations of pulsar halos (Abeysekara et al., 2017; Aharonian et al., 2021) or anisotropic diffusion along large-scale magnetic fields (Giacinti & Semikoz, 2023) may give different predictions of the diffuse -ray spectrum. Furthermore, local sources may also contribute to the observed CR spectra (Liu et al., 2019; Zhang et al., 2021), resulting in different CR spectra throughout the Galaxy. Detailed comparison between these alternative models and the data will be interesting for future works.
We note that the direct measurements of CR spectra around PeV have large uncertainties. New measurements of the proton and helium spectra across PeV energies by LHAASO are expected to be very useful in reducing the uncertainties of local CR spectra. Furthermore, the -ray production cross section of inelastic hadronic interactions also experience large uncertainties (Kamae et al., 2006; Kafexhiu et al., 2014; Koldobskiy et al., 2021a). Additional uncertainties may come from the gas distribution used in the model (e.g., Remy et al., 2017). All these uncertainties prevent a precise prediction of the diffuse -ray fluxes, particularly at the highest energies. Joint efforts in improving all these aspects are necessary to better understand the interactions of CRs in the ISM.
The hadronic interaction would also produce diffuse neutrinos associated with -rays, which have recently been detected by IceCube (IceCube Collaboration et al., 2023). The neutrino fluxes measured by IceCube, which are model-dependent, may contain both the diffuse contribution and unresolved sources. Therefore, the comparison between the neutrino data and the -ray data should be done carefully (Yan et al., 2023; Fang & Murase, 2023). In any case, the multi-messenger data should be very helpful in testing the origin of the VHE to UHE emission of the Galactic plane.
Acknowledgements
We thank Jun Li for helpful discussion. This work is supported by the National Natural Science Foundation of China (Nos. 12220101003, 12322302), the Project for Young Scientists in Basic Research of Chinese Academy of Sciences (No. YSBR-061), the Chinese Academy of Sciences, and the Program for Innovative Talents and Entrepreneur in Jiangsu.
References
- Aartsen et al. (2019) Aartsen, M. G., Ackermann, M., Adams, J., et al. 2019, Phys. Rev. D , 100, 082002
- Abdo et al. (2007) Abdo, A. A., Allen, B., Berley, D., et al. 2007, Astrophys. J. Lett. , 658, L33
- Abdo et al. (2008) Abdo, A. A., Allen, B., Aune, T., et al. 2008, Astrophys. J. , 688, 1078
- Abdollahi et al. (2020) Abdollahi, S., Acero, F., Ackermann, M., et al. 2020, Astrophys. J. Supp. , 247, 33
- Abeysekara et al. (2017) Abeysekara, A. U., Albert, A., Alfaro, R., et al. 2017, Science, 358, 911
- Abeysekara et al. (2021) Abeysekara, A. U., et al. 2021, PoS, ICRC2021, 835
- Abramowski et al. (2014) Abramowski, A., Aharonian, F., Ait Benkhali, F., et al. 2014, Phys. Rev. D , 90, 122007
- Ackermann et al. (2012) Ackermann, M., Ajello, M., Atwood, W. B., et al. 2012, Astrophys. J. , 750, 3
- Ackermann et al. (2015) Ackermann, M., Ajello, M., Albert, A., et al. 2015, Astrophys. J. , 799, 86
- Adriani et al. (2011) Adriani, O., Barbarino, G. C., Bazilevskaya, G. A., et al. 2011, Science, 332, 69
- Adriani et al. (2019) Adriani, O., Akaike, Y., Asano, K., et al. 2019, Phys. Rev. Lett. , 122, 181102
- Adriani et al. (2022) —. 2022, Phys. Rev. Lett. , 129, 101102
- Aguilar et al. (2015a) Aguilar, M., Aisa, D., Alpat, B., et al. 2015a, Phys. Rev. Lett. , 115, 211101
- Aguilar et al. (2015b) —. 2015b, Phys. Rev. Lett. , 114, 171103
- Aguilar et al. (2017) Aguilar, M., Ali Cavasonza, L., Alpat, B., et al. 2017, Phys. Rev. Lett. , 119, 251101
- Aguilar et al. (2018) —. 2018, Phys. Rev. Lett. , 120, 021101
- Aguilar et al. (2019a) —. 2019a, Phys. Rev. Lett. , 122, 101101
- Aguilar et al. (2019b) Aguilar, M., Ali Cavasonza, L., Ambrosi, G., et al. 2019b, Phys. Rev. Lett. , 122, 041102
- Aguilar et al. (2021) —. 2021, Phys. Rept. , 894, 1
- Aharonian et al. (2021) Aharonian, F., An, Q., Axikegu, Bai, L. X., et al. 2021, Phys. Rev. Lett. , 126, 241103
- Aharonian & Atoyan (2000) Aharonian, F. A., & Atoyan, A. M. 2000, Astron. Astrophys. , 362, 937
- Ahn et al. (2010) Ahn, H. S., Allison, P., Bagliesi, M. G., et al. 2010, Astrophys. J. Lett. , 714, L89
- Alemanno et al. (2021) Alemanno, F., An, Q., Azzarello, P., et al. 2021, Phys. Rev. Lett. , 126, 201102
- Alemanno et al. (2022) —. 2022, Science Bulletin, 67, 2162
- Amenomori et al. (2021) Amenomori, M., Bao, Y. W., Bi, X. J., et al. 2021, Phys. Rev. Lett. , 126, 141101
- An et al. (2019) An, Q., Asfandiyarov, R., Azzarello, P., et al. 2019, Science Advances, 5, eaax3793
- Antoni et al. (2005) Antoni, T., Apel, W. D., Badea, A. F., et al. 2005, Astropart. Phys., 24, 1
- Apel et al. (2013) Apel, W. D., Arteaga-Velázquez, J. C., Bekk, K., et al. 2013, Astroparticle Physics, 47, 54
- Atkin et al. (2018) Atkin, E., Bulatov, V., Dorokhov, V., et al. 2018, Soviet Journal of Experimental and Theoretical Physics Letters, 108, 5
- Bartoli et al. (2015) Bartoli, B., Bernardini, P., Bi, X. J., et al. 2015, Astrophys. J. , 806, 20
- Breuhaus et al. (2022) Breuhaus, M., Hinton, J. A., Joshi, V., Reville, B., & Schoorlemmer, H. 2022, Astron. Astrophys. , 661, A72
- Bronfman et al. (1988) Bronfman, L., Cohen, R. S., Alvarez, H., May, J., & Thaddeus, P. 1988, Astrophys. J. , 324, 248
- Cao et al. (2023a) Cao, Z., Aharonian, F., An, Q., et al. 2023a, arXiv e-prints, arXiv:2305.05372
- Cao et al. (2023b) —. 2023b, arXiv e-prints, arXiv:2305.17030
- Choi et al. (2022) Choi, G. H., Seo, E. S., Aggarwal, S., et al. 2022, Astrophys. J. , 940, 107
- Cordes et al. (1991) Cordes, J. M., Weisberg, J. M., Frail, D. A., Spangler, S. R., & Ryan, M. 1991, Nature , 354, 121
- Cummings et al. (2016) Cummings, A. C., Stone, E. C., Heikkila, B. C., et al. 2016, Astrophys. J. , 831, 18
- DAMPE Collaboration et al. (2017) DAMPE Collaboration, Ambrosi, G., An, Q., et al. 2017, Nature , 552, 63
- De La Torre Luque et al. (2023) De La Torre Luque, P., Gaggero, D., Grasso, D., et al. 2023, Astron. Astrophys. , 672, A58
- Dzhatdoev (2021) Dzhatdoev, T. 2021, arXiv e-prints, arXiv:2104.02838
- Engel et al. (2011) Engel, R., Heck, D., & Pierog, T. 2011, Ann. Rev. Nucl. Part. Sci., 61, 467
- Fang & Murase (2021) Fang, K., & Murase, K. 2021, Astrophys. J. , 919, 93
- Fang & Murase (2023) —. 2023, arXiv e-prints, arXiv:2307.02905
- Génolini et al. (2017) Génolini, Y., Serpico, P. D., Boudaud, M., et al. 2017, Phys. Rev. Lett. , 119, 241101
- Giacinti & Semikoz (2023) Giacinti, G., & Semikoz, D. 2023, arXiv e-prints, arXiv:2305.10251
- Ginzburg & Syrovatskii (1964) Ginzburg, V. L., & Syrovatskii, S. I. 1964, The Origin of Cosmic Rays (New York: Macmillan)
- Gleeson & Axford (1968) Gleeson, L. J., & Axford, W. I. 1968, Astrophys. J. , 154, 1011
- Gordon & Burton (1976) Gordon, M. A., & Burton, W. B. 1976, Astrophys. J. , 208, 346
- Guo & Yuan (2018) Guo, Y.-Q., & Yuan, Q. 2018, Phys. Rev. D , 97, 063008
- Hörandel (2004) Hörandel, J. R. 2004, Astroparticle Physics, 21, 241
- Hunter et al. (1997) Hunter, S. D., Bertsch, D. L., Catelli, J. R., et al. 1997, Astrophys. J. , 481, 205
- IceCube Collaboration et al. (2023) IceCube Collaboration, Abbasi, R., Ackermann, M., et al. 2023, Science, 380, 1338
- Kachelrieß et al. (2019) Kachelrieß, M., Moskalenko, I. V., & Ostapchenko, S. 2019, Computer Physics Communications, 245, 106846
- Kafexhiu et al. (2014) Kafexhiu, E., Aharonian, F., Taylor, A. M., & Vila, G. S. 2014, Phys. Rev. D , 90, 123014
- Kamae et al. (2006) Kamae, T., Karlsson, N., Mizuno, T., Abe, T., & Koi, T. 2006, Astrophys. J. , 647, 692
- Koldobskiy et al. (2021a) Koldobskiy, S., Kachelrieß, M., Lskavyan, A., et al. 2021a, Phys. Rev. D , 104, 123027
- Koldobskiy et al. (2021b) Koldobskiy, S., Neronov, A., & Semikoz, D. 2021b, Phys. Rev. D , 104, 043010
- Linden & Buckman (2018) Linden, T., & Buckman, B. J. 2018, Phys. Rev. Lett. , 120, 121101
- Lipari & Vernetto (2018) Lipari, P., & Vernetto, S. 2018, Phys. Rev. D , 98, 043003
- Liu & Wang (2021) Liu, R.-Y., & Wang, X.-Y. 2021, Astrophys. J. Lett. , 914, L7
- Liu et al. (2019) Liu, W., Guo, Y.-Q., & Yuan, Q. 2019, J. Cosmol. Astropart. Phys. , 10, 010
- Ma et al. (2023) Ma, P.-X., Xu, Z.-H., Yuan, Q., et al. 2023, Frontiers of Physics, 18, 44301
- Ma et al. (2022) Ma, X.-H., Bi, Y.-J., Cao, Z., et al. 2022, Chinese Physics C, 46, 030001
- Marinos et al. (2023) Marinos, P. D., Rowell, G. P., Porter, T. A., & Jóhannesson, G. 2023, Mon. Not. Roy. Astron. Soc. , 518, 5036
- Moskalenko & Strong (1998) Moskalenko, I. V., & Strong, A. W. 1998, Astrophys. J. , 493, 694
- Panov et al. (2007) Panov, A. D., Adams, Jr., J. H., Ahn, H. S., et al. 2007, Bull. Russ. Acad. Sci. Phys., 71, 494
- Porter & Strong (2005) Porter, T. A., & Strong, A. W. 2005, in International Cosmic Ray Conference, Vol. 4, 29th International Cosmic Ray Conference (ICRC29), Volume 4, 77
- Prodanović et al. (2007) Prodanović, T., Fields, B. D., & Beacom, J. F. 2007, Astroparticle Physics, 27, 10
- Qiao et al. (2022) Qiao, B.-Q., Liu, W., Zhao, M.-J., Bi, X.-J., & Guo, Y.-Q. 2022, Frontiers of Physics, 17, 44501
- Reichherzer et al. (2022) Reichherzer, P., Merten, L., Dörner, J., et al. 2022, SN Applied Sciences, 4, 15
- Remy et al. (2017) Remy, Q., Grenier, I. A., Marshall, D. J., & Casandjian, J. M. 2017, Astron. Astrophys. , 601, A78
- Schwefer et al. (2022) Schwefer, G., Mertsch, P., & Wiebusch, C. 2022, arXiv e-prints, arXiv:2211.15607
- Seo & Ptuskin (1994) Seo, E. S., & Ptuskin, V. S. 1994, Astrophys. J. , 431, 705
- Strong & Moskalenko (1998) Strong, A. W., & Moskalenko, I. V. 1998, Astrophys. J. , 509, 212
- Strong et al. (2007) Strong, A. W., Moskalenko, I. V., & Ptuskin, V. S. 2007, Annu. Rev. Nucl. Part. Sci., 57, 285
- Strong et al. (2000) Strong, A. W., Moskalenko, I. V., & Reimer, O. 2000, Astrophys. J. , 537, 763
- Strong et al. (2004) —. 2004, Astrophys. J. , 613, 962
- Sveshnikova et al. (2013) Sveshnikova, L. G., Strelnikova, O. N., & Ptuskin, V. S. 2013, Astroparticle Physics, 50, 33
- Tibaldo et al. (2021) Tibaldo, L., Gaggero, D., & Martin, P. 2021, Universe, 7, 141
- Tomassetti (2012) Tomassetti, N. 2012, Astrophys. J. Lett. , 752, L13
- Trotta et al. (2011) Trotta, R., Jóhannesson, G., Moskalenko, I. V., et al. 2011, Astrophys. J. , 729, 106
- Vecchiotti et al. (2022) Vecchiotti, V., Zuccarini, F., Villante, F. L., & Pagliaroli, G. 2022, Astrophys. J. , 928, 19
- Vladimirov et al. (2012) Vladimirov, A. E., Jóhannesson, G., Moskalenko, I. V., & Porter, T. A. 2012, Astrophys. J. , 752, 68
- Yan & Liu (2023) Yan, K., & Liu, R.-Y. 2023, arXiv e-prints, arXiv:2304.12574
- Yan et al. (2023) Yan, K., Liu, R.-Y., Zhang, R., et al. 2023, arXiv e-prints, arXiv:2307.12363
- Yang & Aharonian (2019) Yang, R., & Aharonian, F. 2019, Phys. Rev. D , 100, 063020
- Yang et al. (2016) Yang, R., Aharonian, F., & Evoli, C. 2016, Phys. Rev. D , 93, 123007
- Yoon et al. (2017) Yoon, Y. S., Anderson, T., Barrau, A., et al. 2017, Astrophys. J. , 839, 5
- Yuan (2019) Yuan, Q. 2019, Science China Physics, Mechanics, and Astronomy, 62, 49511
- Yuan & Feng (2018) Yuan, Q., & Feng, L. 2018, Science China Physics, Mechanics, and Astronomy, 61, 101002
- Yuan et al. (2020) Yuan, Q., Zhu, C.-R., Bi, X.-J., & Wei, D.-M. 2020, J. Cosmol. Astropart. Phys. , 2020, 027
- Zhang et al. (2006) Zhang, J.-L., Bi, X.-J., & Hu, H.-B. 2006, Astron. Astrophys. , 449, 641
- Zhang et al. (2021) Zhang, P.-P., Qiao, B.-Q., Liu, W., et al. 2021, J. Cosmol. Astropart. Phys. , 2021, 012
- Zhang et al. (2022) Zhang, P.-P., Qiao, B.-Q., Yuan, Q., Cui, S.-W., & Guo, Y.-Q. 2022, Phys. Rev. D , 105, 023002
- Zhao et al. (2021) Zhao, M.-J., Fang, K., & Bi, X.-J. 2021, Phys. Rev. D , 104, 123001
Appendix A Fermi-LAT diffuse emission without masks
The fluxes of diffuse rays in the inner and outer regions without masking sky regions around VHE sources are given in Table A1. The comparison with the DC model predictions are shown in Fig. A1.
| GeV) | |||
|---|---|---|---|
| (GeV) | (GeV-1cm-2s-1sr-1) | (GeV-1cm-2s-1sr-1) | |
| 0.00-0.18 | 1.23 | ||
| 0.18-0.36 | 1.86 | ||
| 0.36-0.54 | 2.82 | ||
| 0.54-0.72 | 4.26 | ||
| 0.72-0.90 | 6.45 | ||
| 0.90-1.08 | 9.76 | ||
| 1.08-1.26 | 14.78 | ||
| 1.26-1.44 | 22.36 | ||
| 1.44-1.62 | 33.84 | ||
| 1.62-1.80 | 51.21 | ||
| 1.80-1.98 | 77.50 | ||
| 1.98-2.16 | 117.28 | ||
| 2.16-2.34 | 177.48 | ||
| 2.34-2.52 | 268.58 | ||
| 2.52-2.70 | 406.45 |
Appendix B Fitting results of primary and secondary spectra of CRs