Ab initio calculations of structural stability, thermodynamic and elastic properties of Ni, Pd, Rh, and Ir at high pressures
Abstract
The paper presents results of a comprehensive study from first principles into the properties of Ni, Pd, Rh, and Ir crystals under pressure. We calculated elastic constants, phonon spectra, isotherms, Hugoniots, sound velocities, relative structural stability, and phase diagrams. It is shown that in nickel and palladium under high pressures (0.14 TPa) and temperatures (4 kK), the body-centered cubic structure is thermodynamically most stable instead of the face-centered cubic one. Calculated results suggest that nickel under Earth-core conditions (0.3 TPa, 6 kK) have a bcc structure. No structural changes were found to occur in Rh and Ir under pressures to 1 TPa at least. The paper also provides estimations for the pressure and temperature at which the metals of interest begin to melt under shock compression.
I Introduction
Persistent interest to the study of materials properties under high pressures and temperatures is determined, on the one hand, by progressive advances in the experimental methods used to study materials under these conditions and, on the other hand, by the discovery of interesting physical effects, for example, superconductivity at near-room temperatures. These studies also help judge the state of materials in the planetary interiors and gain a better understanding of processes in matter in the interest of inertial confinement fusion. Worthy of note is also the fact that the gradual growth of pressure (up to 1 TPa) accessible in experiments on static compression in diamond anvil cells both at room and at high temperatures A01 ; A02 raises the issue related to the appropriate pressure standard for strongly compressed matter. Some noble metals that were earlier used as the pressure standard have recently been found to exhibit polymorphism A03 ; A04 ; A05 ; A06 ; A07 ; A08 under high pressures and temperatures thus limiting their use for that purpose.
Ab initio calculations into the behavior of Ni, Pd, Rh, and Ir under extreme conditions are relatively poor. The most thoroughly studied is nickel because its behavior under high and is of interest in research of planetary interiors. Its structural stability under pressure and zero temperature was studied in theoretical works A09 ; A10 ; A11 . The authors of papers A09 ; A10 performed calculations to pressures about 0.3 TPa and did not discover any structural changes. Much higher pressures were reached in calculations A11 , which showed that at , above 6.3 TPa and 0 K, face-centered cubic Ni must transform into a hexagonal close-packed structure. In turn, static experiments A12 did not reveal any structural transformations up to 0.37 TPa at room temperature.
Phonon spectra, thermodynamic and magnetic properties of nickel up to 0.1 TPa were calculated in paper A13 . The study showed that the magnetic fcc phase remained dynamically stable and its magnetic moment gradually reduced as compression grew. The evolution of the magnetic properties of Ni at higher pressures was investigated theoretically and experimentally in Refs. A11 ; A14 ; A15 . Experiments A14 ; A15 suggest that the metal remains ferromagnetic at least to 0.26 TPa. Calculations A11 estimate the pressure at which Ni completely loses its magnetic properties to be about 1 TPa.
Special attention is given to the melting curve of nickel. Data from early static experiments in laser-heated diamond anvil cells A16 ; A17 (laser-speckle method for detection of melting) disagree with ab initio calculations A18 ; A19 and shock data A20 . The temperatures of melting at above 20 GPa reported in Refs. A18 ; A19 ; A20 are markedly higher than in experiments A16 ; A17 . But new results of static measurements A21 ; A22 taken with an experimental technique (X-ray diffraction, XAS) different from that used in Refs. A16 ; A17 show excellent agreement with data from A18 ; A19 ; A20 . That is, we can see that the optical method used in measurements A16 ; A17 does not give correct values for the melting temperature of nickel at high pressures.
The relative stability of Pd and Rh was studied from first principles in papers A23 ; A24 . These calculations show the fcc phase of Pd and Rh to be thermodynamically most stable at least to pressures about 1 TPa and 0 K. Experimental studies of structural stability at room temperature below 80 GPa also show no phase transitions A25 ; A26 ; A27 . The melting curves of Pd and Rh were measured in papers A17 ; A28 under rather low pressures 30 GPa.
Iridium at high pressures (up to 0.26 TPa) and room temperature was studied in static experiments A29 ; A30 ; A31 . In experiment A29 , additional peaks were found in its diffraction pattern at relatively low which pointed, in the authors’ view, to a transition into a new hexagonal structure. But later experiments did not confirm that A30 ; A31 . It seem so that no structural transitions occur in iridium at room temperature to pressures about 0.26 TPa. Polymorphism in Ir was not also seen in laser-heated diamond anvil cell experiments at 3.1 kK and 50 GPa A32 . Experimental data on the melting curve of Ir under pressure are very poor. The only estimation for its melting point at about 40 GPa is provided in experiments A32 .
The relative stability of Ir phases was theoretically studied in papers A33 ; A34 . Calculations A33 did not predict any structural changes to occur under pressures below 0.1 TPa, but the authors of article A34 found a thermodynamic stability region for the random-stacking hexagonal close-packed structure (rhcp) at high pressures and above-room temperatures. It is claimed that at 0.2 TPa, the fccrhcp transition must occur at 1.6 kK. With the increasing pressure, the rhcp existence region on the phase diagram gradually extends to lower temperatures A34 . It is also predicted that the Hugoniot cross the fcc-rhcp phase boundary at 0.16 TPa. The authors of article A34 demonstrate that the double hexagonal close-packed (dhcp) structure of Ir also has a lower energy than its fcc phase at high pressures and temperatures. In the recent paper A35 an equation of state (EOS) for Ir under pressures up to 0.54 TPa and temperatures up to 3 kK was constructed from quantum molecular dynamics (QMD) calculations but the structural stability of Ir was not considered.
This paper presents ab initio calculations for the relative structural stability for four metals Ni, Pd, Rh, and Ir under high pressures and temperatures. The -diagrams of Ni, Pd, Rh, and Ir constructed from calculated results are provided. The existence of polymorphism in some of them (Ni, Pd) under pressures above hundred GPa is discussed. Thermodynamic and elastic properties of the four metals are calculated in a wide range of compressions and the dependencies of sound velocities on pressure under shock loading are determined. The paper provides estimations for the pressure and temperature at which the metals of interest begin to melt under shock compression.
II Calculation method
In this work calculations were done with the well-known linear muffin-tin orbital method FP-LMTO A36 we have successfully used earlier A03 ; A08 . The method calculates the energy of a crystal as a function of specific volume and the degree of lattice deformation. Also, the FP-LMTO method can be used to calculate the phonon spectra of crystals at 0 K with the help of linear response theory. With this method we determined the dependence of the energy of our metals versus compression for several types of lattices at zero and nonzero electron temperatures. The dependence of pressure on volume was determined through differentiation of an analytical expression that approximated A37 the calculated dependence of energy versus volume.
To determine how the heating of the electron subsystem contributes to the free energy of a crystal it is necessary to calculate electron gas entropy. It is calculated as A38
| (1) |
Here is the Fermi-Dirac function, and () is the electron density of states. With the known entropy and internal energy of electrons it is easy to obtain the free energy of the heated electron gas, .
Lattice vibrations are taken into account in a quasiharmonic approximation with the calculated phonon spectra. The phonon contributions to free and internal energies are written as A38
| (2) |
| (3) |
where is the phonon density of states (PDOS), and is phonon frequency. The well-known Lindemann criterion was used to evaluate the position of the melting curve for the metals of interest. The procedure used to determine the curve is described in Refs. A19 ; A39 . As shown in various calculations A03 ; A08 ; A19 ; A39 ; A40 , the Lindemann criterion performs rather well for different metals.
The valence electrons were 3, 3, 3, 4 for nickel, 4, 4, 4 for palladium, 4, 4, 4, 5 for rhodium, and 5, 5, 4, 5, 6 for iridium. FP-LMTO parameters were chosen so as to ensure high accuracy of ab initio calculations (internal energy accurate to 0.1 mRy/atom). Integration over the Brillouin zone was done with the improved tetrahedron method A41 . Meshes in k-space measured 303030 for the cubic structures and 303018 for the hexagonal ones. For the determination of phonon frequencies, meshes over q-points were 101010 for the cubic structures and 10106 for the hexagonal ones. The cutoff energy for representing the basis functions as a set of plane waves in the interstitial region was scaled with respect to compression but was no lower than 900 eV. The basis set included MT-orbitals with moments to 3. Charge density and potential expansions in terms of spherical harmonics were done to 7. The parameter of hexagonal structures was always optimized. The other FP-LMTO parameters were chosen with an approach similar to that one described in article A03 .
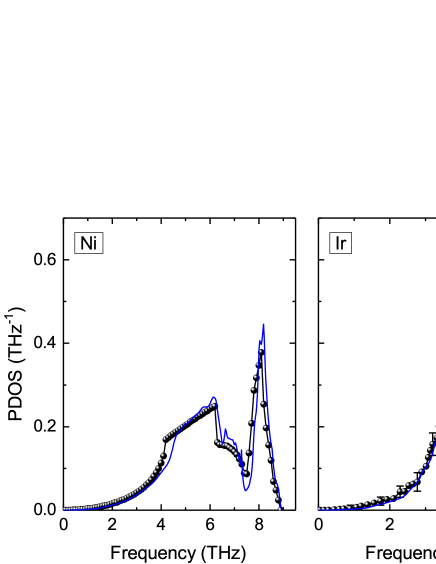
The exchange-correlations (XC) functionals were chosen so as to attain the best description of ground state properties and phonon spectra for the metals. The PBE functional A42 was taken for nickel and the PBEsol A43 was found best for the others. For all the elements, the equilibrium specific volume under ambient conditions was reproduced accurate to better than 1% compared to experiment. The accuracy of our phonon spectrum calculations is demonstrated in Fig. 1 showing the spectra calculated in this work for nickel and iridium in comparison with experiment. They are seen to agree well. A similar comparison for palladium was earlier demonstrated in our paper A44 . Experimental phonon spectrum data for rhodium are absent.
Elastic constants were calculated with an approach A47 based on the calculation of specific energy as a function of the degree of single-crystal deformation. The elastic constants obtained for single crystals were used to calculate longitudinal and bulk sound velocities versus applied compression for polycrystals by Voigt-Reuss-Hill averaging A48 . More details about these calculations can be found in paper A49 .
III Calculated results
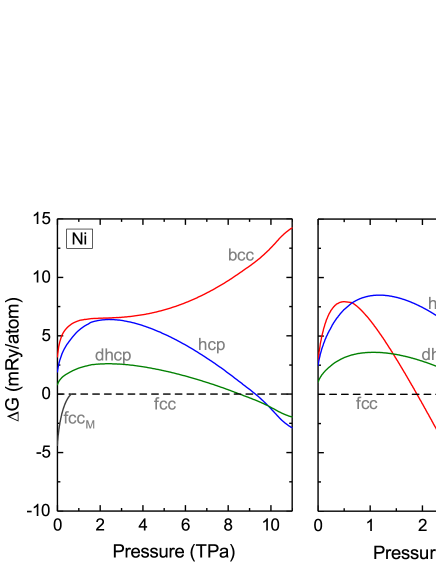
Let’s consider the relative stability of various Ni, Pd, Rh, and Ir crystal phases at zero temperature. Figures 2 and 3 show Gibbs potential differences versus pressure between different structures of the metals relative to the fcc potential. It is seen that with the increasing compression the magnetic fcc structure of nickel (Fig. 2) which is most stable at low transforms into the non-magnetic fcc phase at 0.6 TPa. Further compression results in its transition to dhcp (8.5 TPa) and then to hcp (9.9 TPa) structures. We note here that the bcc phase at 0 K is energetically least preferable compared to the other close-packed phases but at 2 TPa the difference between energies is relatively small (6 mRy/atom). As for palladium, its compression to a few TPa shows only one structural transition to the bcc phase. Its behavior is very similar to that of platinum we have earlier studied in paper A08 . The pressure of the fccbcc transition in Pd equals 1.9 TPa which is close to the value of about 2 TPa for the similar transition in platinum.
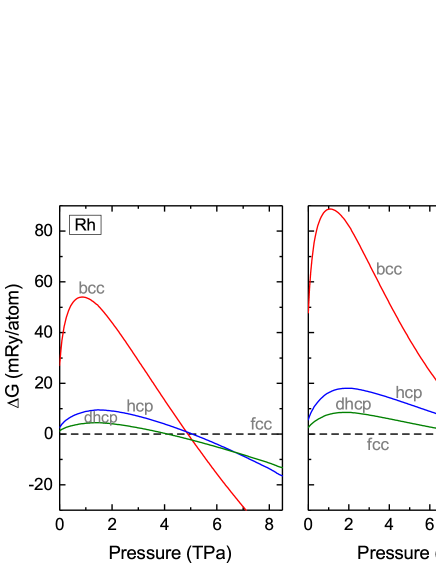
Rhodium and iridium at 0 K (Fig. 3) undergo the same sequence of structural transitions under pressure: first fccdhcp and then dhcpbcc. The pressures of these transitions are about 4.1 and 5 TPa for Rh, and about 8 and 9.2 TPa for Ir, respectively. Note that in three (Pd, Rh, Ir) of the four metals at high compression and 0 K, the bcc structure becomes energetically more preferable than the other close-packed phases. But it will be shown below that the bcc phase of nickel can also be present on its phase diagram even at relatively low pressures.
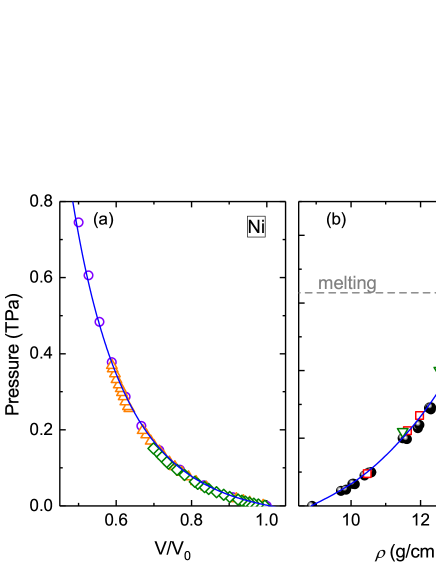
Consider the isothermal and shock compression of Ni, Pd, Rh, and Ir in comparison with available experimental data and other ab initio calculations. Hereafter in all figures stands for the experimental specific volume at room temperature, i.e., 73.82 a.u.3 for Ni, 99.37 a.u.3 for Pd, 92.83 a.u.3 for Rh, and 95.44 a.u.3 for Ir A50 . Figure 4 shows results for nickel. The calculated isotherm 300 K is seen to agree well with available experimental data up to high pressures. The Hugoniot (Fig. 4b) also agrees quite well with experiment. The same is true for palladium (Fig. 5). It should however be noted that ab initio calculations A24 give a somewhat overestimated value of the pressure on the isotherm for compressed Pd in comparison with our results A23 . Calculations presented here and in Ref. A23 were done in the GGA approximation for the XC functional, while those in paper A24 were performed with the LDA approximation which together with other factors could be of effect.
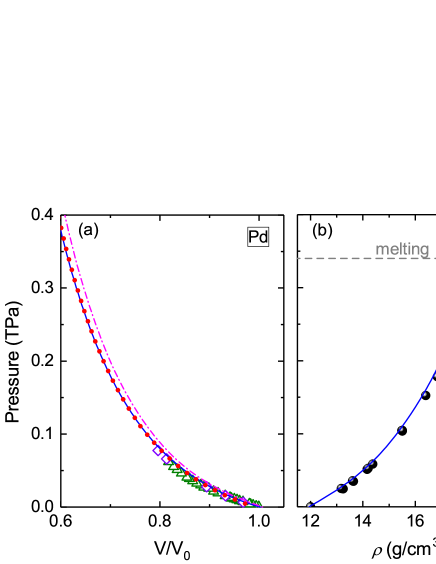
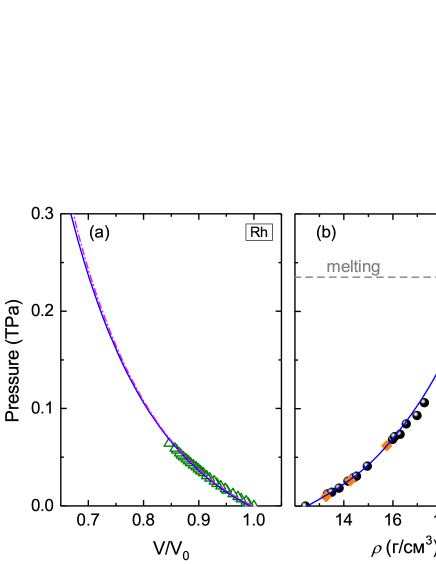
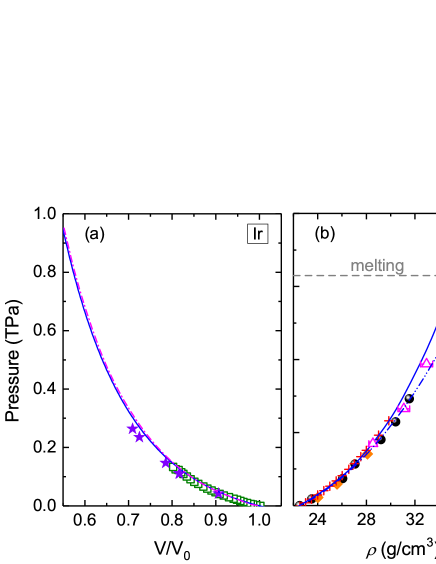
Figure 6 illustrates the isothermal and shock compression of rhodium. The calculated isotherm 300 K agrees well with experimental data from A27 . Also seen is a good agreement with ab initio calculations from A23 despite that the authors used another gradient XC functional A56 . The Hugoniot (Fig. 6b) is also in quite a good agreement with experiment.
Figure 7 demonstrates the comparison for iridium. The isotherm agrees rather well with experiment. At pressures above 0.2 TPa, it is seen to somewhat deviate from experimental results presented in Ref. A31 and obtained with the double-stage diamond anvil technique, whose accuracy of measurement at high pressures remains under debate A59 ; A60 . For shock compression (Fig. 7b), our results are seen to depart from experimental data A57 at 0.3 TPa and to agree rather well with measurements A53 ; A58 . Our calculations are also in excellent agreement with ab initio molecular dynamics data A35 . As for experimental results A57 , they raise some questions about the accuracy of measurements because if one draws the calculated isotherm 300 K of iridium on Fig. 7b, it will be seen to pass, within the limits of error, through the experimental points A57 . The isotherms of the other phases (bcc, hcp, dhcp) are very close to that of the fcc structure (the differences are below 10 GPa) and it is unlikely that so large deviation of the Hugoniot can be caused by a structural transformation.
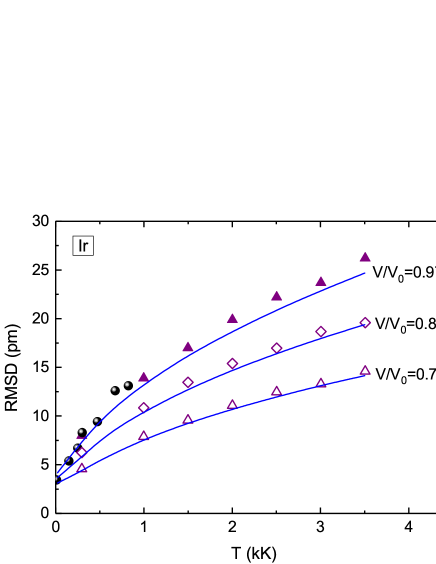
In paper A35 , QMD calculations were done to determine the root-mean-square deviations (RMSD) of Ir atoms from fcc lattice equilibrium positions at different specific volumes and temperatures. Figure 8 compares RMSD from A35 obtained with full anharmonism and the values calculated in this work in quasiharmonic approximation. It is seen that at 0.97 and temperatures above 1 kK, our values lie a bit below the QMD results but the difference is no higher than 6%. With the increasing compression, the difference becomes markedly smaller because under pressure the contribution of high-order anharmonicity effects gradually reduces. At 0.71 (0.3 TPa), our root-mean-square deviations are in very good agreement with QMD data.
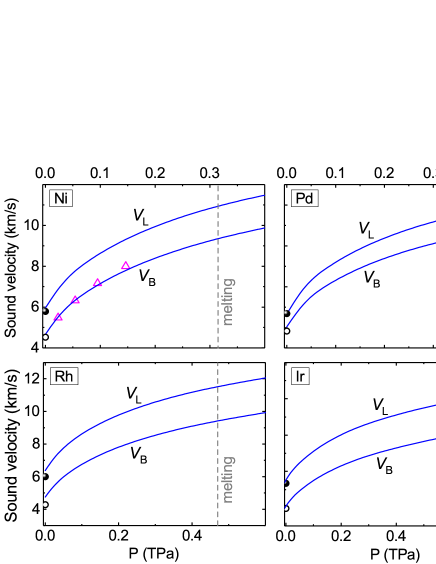
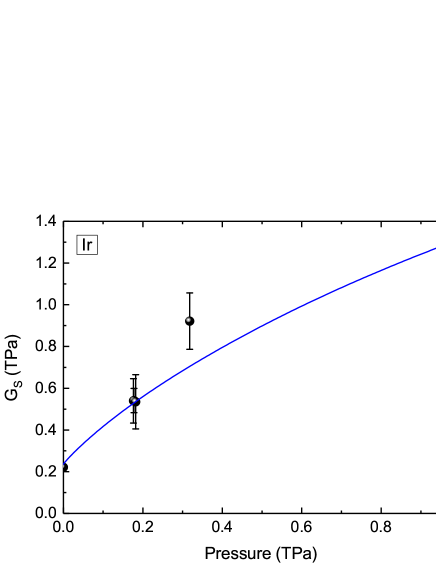
The calculated elastic constants were used to determine sound velocities in the considered metals with the fcc structure under shock compression. The values of elastic constants at different compressions are provided in the Appendix. Our calculations of the elastic constants suggest that the fcc structure of all metals under consideration remains dynamically stable at least to 2 TPa (see the Appendix). Figure 9 shows the calculated longitudinal and bulk sound velocities of polycrystal Ni, Pd, Rh, and Ir versus pressure on the Hugoniot. Their experimental values are most often known only for ambient conditions where agreement with calculation is good (Fig. 9). For nickel, data on bulk sound velocities, , are available. They are obtained from an experimental EOS A52 at zero temperature and also agree well with our calculations. From the calculated elastic constants we can determine the shear modulus for polycrystal A48 ; A49 . Figure 10 compares () calculated in this work for iridium with measurements A61 taken under quasi-isentropic conditions. Up to 0.2 TPa, they agree very well. The experimental point at a higher pressure noticeably deviates from our function () which can be caused by the higher error of measurements A61 under high loading. Further measurements and calculations are needed to clear up the situation.
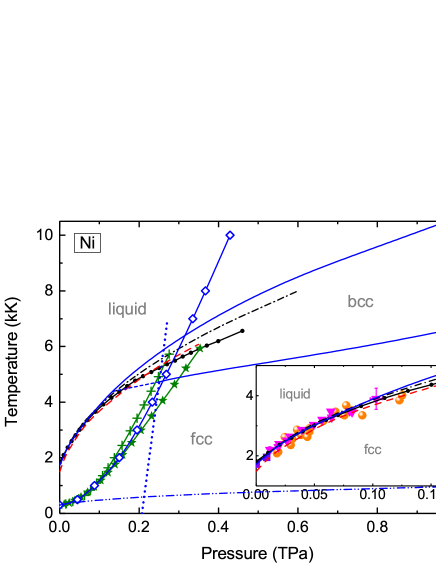
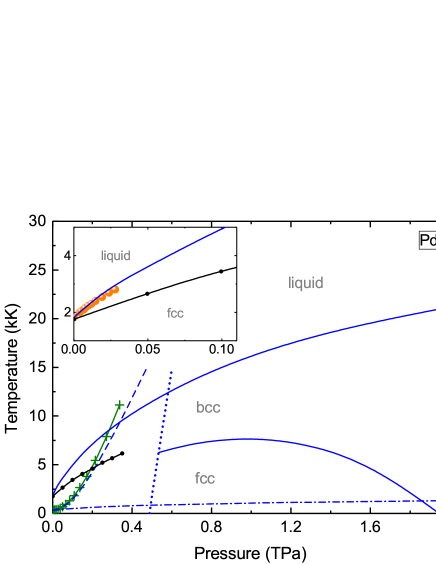
Figure 11 presents the phase diagram of nickel obtained in this work, along with available calculated and experimental results by other authors. Our calculations show that at high pressures and temperatures the bcc structure of nickel is thermodynamically more stable than its fcc structure. The bcc phase stabilizes at 0.14 and 4 kK, which strongly resembles the recently discovered fcc-bcc transformation in copper and silver A05 ; A06 ; A08 ; A65 . Despite that at 0 K the bcc structure has the energy higher than the close-packed phases have (see Fig. 2), it has softer low-frequency phonon modes. Figure 12 (the left panel) shows the phonon densities of states (PDOS) at 0.6 (0.35 TPa) and 0 K for different structures of nickel. Its bcc phase is seen to have a higher PDOS in the low-frequency part of the phonon spectrum compared to the other phases. As a result, the Gibbs energy of the bcc phase with the increasing temperature becomes lower than that of the other phases which is seen in the right panel of Fig. 12. The transition occurs due to higher entropy and a smaller contribution from lattice vibrations to energy compared to other lattices.
It is seen from Fig. 11 that the fcc-bcc boundary crosses the Hugoniot. That is, like in copper and silver, the fccbcc transition in nickel can be detected in state-of-the-art shock experiments which can determine the crystal structure of investigated materials A04 ; A05 ; A06 ; A65 . By our estimates, the transition occur on the Hugoniot at 0.25 TPa. Unfortunately, the bcc structure at 0 K loses its dynamic stability below certain pressure and at low compression it becomes impossible to determine its free energy within quasiharmonic approximation. In Figure 11, the dotted line is the boundary of the dynamic stability of the bcc structure, and the fcc-bcc phase boundary line to the left of this curve is extrapolated to lower pressures (the short dashed line). To determine the phase boundary line at low , more accurate calculations are required with consideration of all anharmonic effects.
The insert in Fig. 11 compares the melting curve () obtained in this work from the Lindemann criterion with available experimental data. The calculated () agrees quite well with experiment. The curves obtained by other authors either from MD calculations A64 or from semiempirical EOSs A20 ; A63 are also in quit a good agreement with our calculations but above 0.15 TPa they begin to depart from each other. However note that the structural transition to a new high pressure phase (bcc) must result in an increase of the melting point compared to a low pressure phase (fcc) A66 . Our calculations suggest that melting in shock-compressed nickel must occur at 0.315 TPa and 6.4 kK. Judging by the position of the fcc-bcc phase boundary, the structural transition will be difficult to observe in ramp experiments if the - trajectory during measurements passes close enough to the principal isentrope (see Fig. 11).
Now consider the phase diagram of palladium calculated in this work (Fig. 13). It was stated earlier that unlike nickel, Pd has a fccbcc structural transition at zero temperature and a pressure of about 1.9 TPa. As shown in Fig. 13, with the increasing temperature the fcc-bcc phase boundary strongly shifts towards low pressures. As a result, at high temperatures the region of thermodynamic stability of the bcc phase extends well below a pressure of 1.9 TPa. The behavior of the fcc-bcc boundary is rather similar to that of platinum determined earlier in paper A08 . But unlike Pt, this line for palladium goes down in pressure much lower than 1.5 TPa. At 0 K, bcc Pd becomes dynamically stable at much lower pressures compared to Pt which leads to the result mentioned above.
Like in nickel, there also exists a bcc dynamic stability boundary in palladium at relatively low pressures (0.5 TPa) (the dotted line in Fig. 13). To its left, bcc palladium is dynamically unstable at 0 which does not allow the determination of the fcc-bcc boundary for low compressions in quasiharmonic approximation. More accurate calculations with full anharmonism are needed A66 . Accounting for the additional entropy contribution from high-order anharmonicity effects may change the potential energy surface and stabilize the bcc structure in this region of the phase diagram A67 . Nevertheless, the entire course of the phase boundary also allows us to suppose that under certain conditions the region where the bcc structure exists may get much lower than 0.5 TPa and intersect the Hugoniot (Fig. 13). Like in nickel, the intersection is very likely to occur at pressures above 0.25 TPa.
Note that the melting curve obtained in this work agrees well with experiment A17 (see the insert in Fig. 13). Calculations with classical molecular dynamics A24 give a curve that lies much lower than the experimental points and our curve. By our estimates, shocked Pd must melt at 0.34 TPa and 9.4 kK. With the existing estimations for temperatures from ramp compression experiments for different metals (2-4 kK for 0.21 TPa) A07 ; A68 , it seems to be quite difficult to detect a new bcc phase of palladium in similar experiments below 1 TPa.
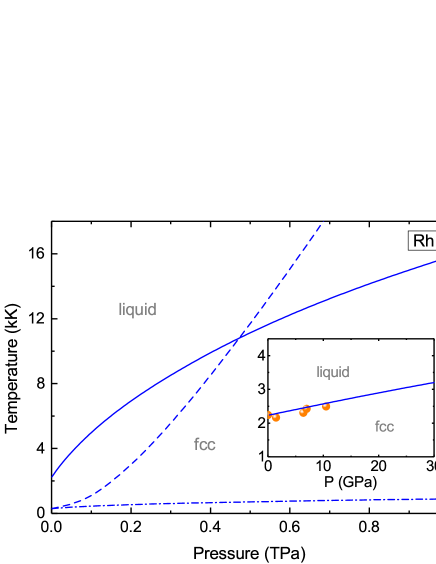
Figures 14 and 15 present phase diagrams calculated in this work for rhodium and iridium. The calculated melting curve of rhodium (the insert in Fig. 14) agrees well with available experimental data. Our study did not reveal on the -diagram of Rh a region where could exist a phase other than fcc below 1 TPa (fig. 14). At zero temperature, bcc Rh remains dynamically unstable at least to pressures about 3 TPa. Our calculations suggest that rhodium crystal under shock compression begins to melt at 0.47 TPa and 10.8 kK.
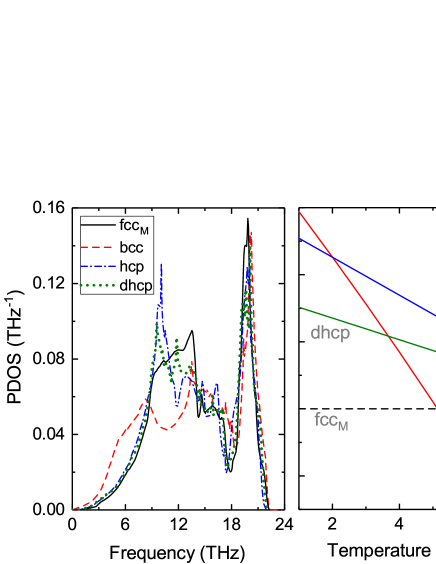
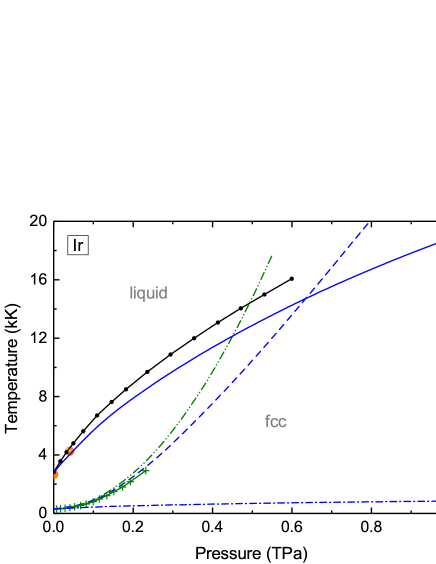
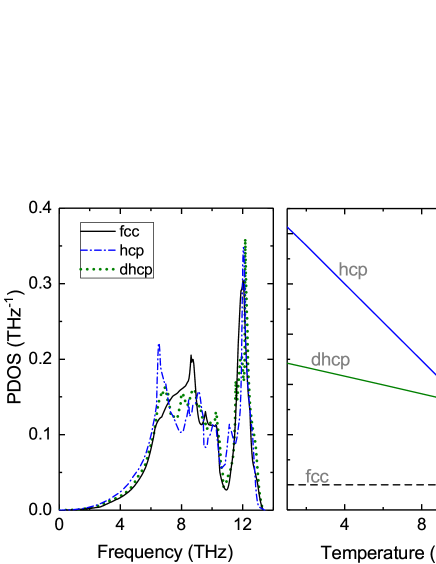
We also did not find any structural transitions in iridium on its -diagram (Fig. 15). Like in rhodium, its bcc structure is dynamically unstable at 0 K to pressures of a few TPa. Calculations done in this work suggest that the hexagonal close-packed structures are not energetically more preferable than the fcc phase at high and . Figure 16 presents the phonon DOS and Gibbs energy differences calculated for iridium phases at 0.32 TPa. PDOS for the close-packed structures are seen to run quite close to each other. As a result, with the increasing temperature the Gibbs energy of the fcc phase remains the lowest up to melting (the left panel of Fig. 16). According to A34 , the energy of the dhcp structure is lower than that of the fcc one at high pressures and temperatures. However, unlike A34 , we have not succeeded to observe a transition to the dhcp structure in iridium with the increasing temperature of crystal under high pressures. Note that the same authors earlier predicted a structural transition from fcc to rhcp to occur in platinum A69 . However the transition was not observed either in dynamic or static experiments A05 ; A70 .
The melting curve calculated in this work agrees well with experiment A32 . QMD calculations A34 by the Z method give higher melting temperatures with the increasing pressure. Our calculations suggest that the melting of shocked iridium must occur at 0.63 TPa and 14.7 kK. Our Hugoniot is in good agreement with QMD results A35 (Fig. 15). Calculations from A34 give a steeper dependence of temperature on pressure under shock compression and, accordingly, a lower value of pressure (by about 30%) at which iridium begins to melt. It is clear that further MD calculations are needed to describe more accurately the behavior of the melting curve and Hugoniot of iridium at high and .
IV Conclusion
The structural stability and thermodynamic and elastic properties of Ni, Pd, Rh, and Ir were studied in this work with the all-electron full-potential LMTO method. From the calculated elastic constants, it is shown for all the metals that their fcc structure remains dynamically stable at least to pressures about 2 TPa. Calculations were done to determine the isotherms, Hugoniots in - and - coordinates, and sound velocities on the Hugoniot. Melting curves were calculated from the Lindemann criterion and parameters of melting under shock compression were estimated to be 0.315 TPa and 6.4 kK for Ni, 0.34 TPa and 9.4 kK for Pd, 0.47 TPa and 10.8 kK for Rh, and 0.63 TPa and 14.7 kK for Ir. Calculated results are shown to agree well with currently available experimental data.
It is shown by calculations for nickel and palladium that their bcc phase be most thermodynamically stable under high pressures and temperatures instead of the fcc phase that is stable near the ambient conditions. It was determined for nickel that its Hugoniot intersect the fcc-bcc phase boundary at a pressure of about 0.25 TPa. Results for palladium are not so unambiguous because of the shortcomings present in the quasiharmonic approximation we used. Here we can only hypothesize that the fccbcc transition may also occur in palladium under shock compression above a couple of hundred GPa. As shown in our calculations, rhodium and iridium do not undergo any structural changes under pressures to a few TPa and temperatures up to melting. Their bcc structure remains dynamically unstable at least to 3 TPa.
The results we obtained in this work and in our earlier studies A03 ; A08 allow us to speak about a common tendency for the metals Ni, Pd, Pt, Cu, Ag, and Au. They all undergo a structural transition from their face-centered to body-centered cubic phase under high temperatures and pressures less than 2 TPa. For Cu, Ag, and Au, this transition has been recently observed in experiments A04 ; A05 ; A06 ; A07 ; A65 . Our calculations show that Pd, Pt, and Au at 2 TPa undergo transition to their bcc phase at zero temperature as well. We predict that nickel under Earth-core conditions (0.3 TPa and 6 kK) will have the bcc structure rather than fcc, as was expected. Possibly, the detection of the fccbcc transition in nickel at high and will help more accurately judge about the structural state of the iron-nickel alloy in the Earth core interior.
V Appendix
Tables 1- 4 present calculated values of elastic constants at different compressions for Ni, Pd, Rh, and Ir.
| 1.05 | 222.0 | 124.2 | 110.5 | -9.018 |
| 1.0 | 274.0 | 162.4 | 132.5 | -0.354 |
| Exp. [71] | 261.2 | 150.8 | 131.7 | 0.0 |
| 0.9 | 420.3 | 272.4 | 192.6 | 26.72 |
| 0.8 | 653.0 | 455.9 | 285.0 | 75.61 |
| 0.7 | 1036.3 | 775.8 | 432.4 | 166.6 |
| 0.6 | 1703.2 | 1361.7 | 675.7 | 343.4 |
| 0.5 | 2932.6 | 2498.5 | 1025.1 | 709.8 |
| 0.4 | 5550.1 | 4849.9 | 1823.4 | 1537.1 |
| 0.35 | 8040.2 | 7156.9 | 2503.5 | 2365.1 |
| 1.05 | 178.7 | 134.6 | 56.5 | -10.28 |
| 1.0 | 231.7 | 177.5 | 73.6 | -1.534 |
| Exp. [72] | 234.1 | 176.1 | 71.2 | 0.0 |
| 0.9 | 388.8 | 305.7 | 123.2 | 26.35 |
| 0.8 | 646.8 | 520.4 | 205.5 | 78.09 |
| 0.7 | 1088.6 | 893.7 | 343.8 | 177.8 |
| 0.6 | 1865.7 | 1570.9 | 584.7 | 376.6 |
| 0.5 | 3370.7 | 2951.8 | 1025.4 | 798.6 |
| 0.4 | 6484.3 | 5898.1 | 1916.6 | 1797.9 |
| 1.05 | 352.8 | 152.9 | 178.2 | -15.81 |
| 1.0 | 435.4 | 203.5 | 216.1 | -3.653 |
| 0.9 | 665.9 | 351.1 | 318.1 | 34.60 |
| 0.8 | 1033.9 | 599.9 | 473.0 | 104.2 |
| 0.7 | 1640.4 | 1037.9 | 713.2 | 234.8 |
| 0.6 | 2675.9 | 1831.7 | 1088.6 | 488.8 |
| 0.5 | 4543.6 | 3356.7 | 1734.1 | 1009.4 |
| 0.4 | 8257.2 | 6641.8 | 2908.4 | 2194.8 |
| 1.05 | 498.5 | 194.1 | 232.4 | -17.59 |
| 1.0 | 614.0 | 262.5 | 284.0 | -1.184 |
| Exp. [73] | 596 | 252 | 270 | 0.0 |
| 0.9 | 938.0 | 465.7 | 424.9 | 50.82 |
| 0.8 | 1442.9 | 801.4 | 640.6 | 145.9 |
| 0.7 | 2255.7 | 1377.1 | 977.9 | 322.3 |
| 0.6 | 3620.3 | 2412.0 | 1517.5 | 661.6 |
| 0.5 | 5989.9 | 4373.0 | 2369.8 | 1346.8 |
| 0.4 | 10849.1 | 8701.3 | 3837.7 | 2899.4 |
References
- (1) A. Dewaele, P. Loubeyre, F. Occelli, O. Marie, M. Mezouar, Toroidal diamond anvil cell for detailed measurements under extreme static pressures, Nat. Commun. 9, 2913 (2018).
- (2) L. Dubrovinsky, S. Khandarkhaeva, T. Fedotenko, D. Laniel, M. Bykov, C. Giacobbe, E. L. Bright, P. Sedmak, S. Chariton, V. Prakapenka, A. V. Ponomareva, E. A. Smirnova, M. P. Belov, F. Tasnadi, N. Shulumba, F. Trybel, I. A. Abrikosov, N. Dubrovinskaia, Materials synthesis at terapascal static pressures, Nature 605, 274 (2022).
- (3) N. A. Smirnov, Ab initio calculations of the elastic and thermodynamic properties of gold under pressure, J. Phys. Condens. Matter 29, 105402 (2017).
- (4) R. Briggs, F. Coppari, M. G. Gorman, R. F. Smith, S. J. Tracy, A. L. Coleman, A. Fernandez-Panella, M. Millot, J. H. Eggert, D. E. Fratanduono, Measurement of Body-Centered Cubic Gold and Melting under Shock Compression, Phys. Rev. Lett. 123, 045701 (2019).
- (5) S. M. Sharma, S. J. Turneaure, J. M. Winey, Y. M. Gupta, What Determines the fcc-bcc Structural Transformation in Shock Compressed Noble Metals?, Phys. Rev. Lett. 124, 235701 (2020).
- (6) S. M. Sharma, S. J. Turneaure, J. M. Winey, Y. M. Gupta, Transformation of shock-compressed copper to the body-centered-cubic structure at 180 GPa, Phys. Rev. B 102, 020103(R) (2020).
- (7) S. K. Han, R. F. Smith, D. Kim, J. K. Wicks, J. R. Rygg, A. Lazicki, J. H. Eggert, T. S. Duffy, Polymorphism of gold under laser-based ramp compression to 690 GPa, Phys. Rev. B 103, 184109 (2021).
- (8) N. A. Smirnov, Relative stability of Cu, Ag, and Pt at high pressures and temperatures from ab initio calculations, Phys. Rev. B 103, 064107 (2021).
- (9) T. Jarlborg, Spin fluctuations, electron-phonon coupling and superconductivity in near-magnetic elementary metals - Fe, Co, Ni and Pd, Physica C 385, 513 (2003).
- (10) Y. S. Mohammed, Y. Yan, H. Wanga, K. Li, X. Dua, Stability of ferromagnetism in Fe, Co, and Ni metals under high pressure with GGA and GGA+U, J. Magn. Magn. Mater. 322, 653 (2010).
- (11) G.V. Sin’ko and N. A. Smirnov, Ab initio calculation of cold curves for fcc, bcc and hcp nickel to ultrahigh pressures, AIP Conference Proceedings 849, 375 (2006).
- (12) N. Hirao, Y. Akahama, Y. Ohishi, Equations of state of iron and nickel to the pressure at the center of the Earth, Matter Radiat. Extremes 7, 038403 (2022).
- (13) J. Xie, S. P. Chen, H. V. Brand, R. L. Rabie, High-pressure thermodynamic, electronic and magnetic properties of Ni, J. Phys.: Condens. Matter 12, 8953 (2000).
- (14) R. Torchio, Y. O. Kvashnin, S. Pascarelli, O. Mathon, C. Marini, L. Genovese, P. Bruno, G. Garbarino, A. Dewaele, F. Occelli, P. Loubeyre, X-Ray magnetic circular dichroism measurements in Ni up to 200 GPa: Resistant ferromagnetism, Phys. Rev. Lett. 107, 237202 (2011).
- (15) I. Sergueev, L. Dubrovinsky, M. Ekholm, O. Yu. Vekilova, A. I. Chumakov, M. Zajac, V. Potapkin, I. Kantor, S. Bornemann, H. Ebert, S. I. Simak, I. A. Abrikosov, R. Rüffer, Hyperfine splitting and room-temperature ferromagnetism of Ni at multimegabar pressure, Phys. Rev. Lett. 111, 157601 (2013).
- (16) P. Lazor, G. Shen, S. K. Saxena, Laser-Heated Diamond Anvil Cell Experiments at High Pressure: Melting Curve of Nickel up to 700 kbar, Phys. Chem. Miner. 20, 86 (1993).
- (17) D. Errandonea, High-pressure melting curves of the transition metals Cu, Ni, Pd, and Pt, Phys. Rev. B 87, 054108 (2013).
- (18) M. Pozzo, D. Alfè, Melting curve of face-centered-cubic nickel from first-principles calculations, Phys. Rev B 88, 024111 (2013).
- (19) D. V. Minakov, P. R. Levashov, Melting curves of metals with excited electrons in the quasiharmonic approximation, Phys. Rev. B 92, 224102 (2015).
- (20) V. D. Urlin, Melting at ultrahigh pressures in a shock wave, Sov. Phys. JETP 22, 341 (1966).
- (21) O. T. Lord, I. G. Wood, D. P. Dobson, L. Vočadlo, W. Wang, A. R. Thomson, E. T. H. Wann, G. Morard, M. Mezouar, M. J. Walter, The melting curve of Ni to 1 Mbar, Earth Planet. Sci. Lett. 408, 226 (2014).
- (22) S. Boccato, R. Torchio, I. Kantor, G. Morard, S. Anzellini, R. Giampaoli, R. Briggs, A. Smareglia, T. Irifune, S. Pascarelli, The Melting Curve of Nickel Up to 100 GPa Explored by XAS, J. Geophys. Res.: Solid Earth 122, B014807 (2017).
- (23) C. Cazorla, D. Alfè, M. J. Gillan, Zero-temperature generalized phase diagram of the 4d transition metals under pressure, Phys. Rev. B 77, 224103 (2008).
- (24) Z. Liu, J. Yang, L. Cai, F. Jing, D. Alfè, Structural and thermodynamic properties of compressed palladium: Ab initio and molecular dynamics study, Phys. Rev. B 83, 144113 (2011).
- (25) H. K. Mao, P. M. Bell, J. W. Shaner, D. J. Steinberg, Specific volume measurements of Cu, Mo, Pd, and Ag and calibration of the ruby R1 fluorescence pressure gauge from 0.06 to 1 Mbar, J. Appl. Phys. 49, 3276 (1978).
- (26) B. Guigue, G. Geneste, B. Leridon, P. Loubeyre, An x-ray study of palladium hydrides up to 100 GPa: Synthesis and isotopic effects, J. Appl. Phys. 127, 075901 (2020).
- (27) K. V. Yusenko, S. Khandarkhaeva, T. Fedotenko, A. Pakhomova, S. A. Gromilov, L. Dubrovinsky, N. Dubrovinskaia, Equations of state of rhodium, iridium and their alloys up to 70 GPa, J. Alloys Compd. 788, 212 (2019).
- (28) H. M. Strong, F. P. Bundy, Fusion Curves of Four Group VIII Metals to 100 000 Atmospheres, Phys. Rev. 115, 278 (1959).
- (29) Y. Cereniusa, L. Dubrovinsky, Compressibility measurements on iridium, J. Alloys Compd. 306, 26 (2000).
- (30) V. Monteseguro, J. A. Sans, V. Cuartero, F. Cova, I. A. Abrikosov, W. Olovsson, C. Popescu, S. Pascarelli, G. Garbarino, H. Johan, M. Jonsson, T. Irifune, Phase stability and electronic structure of iridium metal at the megabar range, Sci. Rep. 9, 8940 (2019).
- (31) S. Khandarkhaeva, T. Fedotenko, A. Krupp, K. Glazyrin, W. Dong, H. Liermann, M. Bykov, A. Kurnosov, N. Dubrovinskaia, L. Dubrovinsky, Testing the performance of secondary anvils shaped with focused ion beam from the single-crystal diamond for use in double-stage diamond anvil cells, Rev. Sci. Instrum. 93, 033904 (2022).
- (32) S. Anzellini, L. Burakovsky, R. Turnbull, E. Bandiello, D. Errandonea, P-V-T Equation of State of Iridium Up to 80 GPa and 3100 K, Crystals 11, 452 (2021).
- (33) S. Grussendorff, N. Chetty, H. Dreysse, Theoretical studies of iridium under pressure, J. Phys.: Condens. Matter 15, 4127 (2003).
- (34) L. Burakovsky, N. Burakovsky, M. J. Cawkwell, D. L. Preston, D. Errandonea, S. I. Simak, Ab initio phase diagram of iridium, Phys. Rev. B 94, 094112 (2016).
- (35) K. Luo, R. Lu, R. E. Cohen, First-principles thermal equation of state of fcc iridium, Phys. Rev. B 107, 014106 (2023).
- (36) S. Yu. Savrasov, Linear-response theory and lattice dynamics: A muffin-tin-orbital approach, Phys. Rev. B 54, 16470 (1996).
- (37) G. Parsafar, E. A. Mason, Universal equation of state for compressed solids, Phys. Rev. B 49, 3049 (1994).
- (38) J. Sólyom, Fundamentals of the Physics of Solids (Springer-Verlag, 2009), vol. 1.
- (39) S. V. Lepeshkin, M. V. Magbitskaya, E. G. Maksimov, Lattice dynamics and melting features of Li and Na, JETP Lett. 89, 586 (2009).
- (40) N. A. Smirnov, Ab initio calculations of the phase diagrams of tin and lead under pressures up to a few TPa, J. Phys.: Condens. Matter 33, 035402 (2021).
- (41) P. Blöchl, O. Jepsen, and O. K. Andersen, Improved tetrahedron method for Brillouin-zone integrations, Phys. Rev. B 49, 16 223 (1994).
- (42) J. P. Perdew, K. Burke, M. Ernzerhof, Generalized gradient approximation made simple, Phys. Rev. Lett. 77, 3865 (1996).
- (43) J. P. Perdew, A. Ruzsinszky, G. I. Csonka, O. A. Vydrov, G. E. Scuseria, L. A. Constantin, X. Zhou, and K. Burke, Restoring the Density-Gradient Expansion for Exchange in Solids and Surfaces, Phys. Rev. Lett. 100, 136406 (2008).
- (44) N. A. Smirnov, Ab initio calculations for the transport properties of metals within Boltzmann transport theory: From equilibrium to nonequilibrium heating regime, Phys. Rev. B 106, 024109 (2022).
- (45) K.-H. Hellwege and O. Madelung (Eds.), Phonon States of Elements. Electron States and Fermi Surfaces of Alloys, Landolt-Börnstein, New Series, Group III, Vol. 13 Pt. a (Springer, Berlin, 1981).
- (46) D. H. Moseley, S. J. Thebaud, L. R. Lindsay, Y. Cheng, D. L. Abernathy, M. E. Manley, R. P. Hermann, Temperature-dependent lattice dynamics in iridium, Phys. Rev. Materials 4, 113608 (2020).
- (47) G. V. Sin’ko, Ab initio calculations of the second-order elastic constants of crystals under arbitrary isotropic pressure, Phys. Rev. B 77, 104118 (2008).
- (48) R. Hill, The Elastic Behaviour of a Crystalline Aggregate, Proc. Phys. Soc. Lond. A 65 349 (1952).
- (49) J. P. Watt, Polyxstal: A fortran program to calculate average elastic properties of minerals from single-crystal elasticity data, Computers and Geosciences 13, 441 (1987).
- (50) K.-H. Hellwege, A. M. Hellwege (Eds.), Structure Data of Elements and Intermetallic Phases, Landolt-Börnstein, Group III, New Series, Vol. 6 (Springer-Verlag, Berlin-Heidelberg, 1971).
- (51) A. Dewaele, M. Torrent, P. Loubeyre, M. Mezouar, Compression curves of transition metals in the Mbar range: Experiments and projector augmented-wave calculations, Phys. Rev. B 78, 104102 (2008).
- (52) S. B. Kormer, A. I. Funtikov, V. D. Urlin, and A. N. Kolesnikova, Dynamic compression of porous metals and the equation of state with variable specific heat at high temperatures, Sov. Phys. JETP 15, 477 (1962).
- (53) S. P. Marsh, LASL Shock Hugoniot Data (University of California Press, Berkeley, CA, 1980).
- (54) R. F. Trunin, L. F. Gudarenko, M. V. Zhernokletov, and G. V. Simakov, Experimental Data on Shock Compression and Adiabatic Expansion of Condensed Matter, 2nd ed. (RFNC-VNIIEF, Sarov, 2006).
- (55) H. van Thiel, LLNL Compendium of Shock Wave Data, UCRL-50108, vol. 1, rev. 1, (1977).
- (56) Z. Wu and R. E. Cohen, More accurate generalized gradient approximation for solids, Phys. Rev. B 73, 235116 (2006).
- (57) C. Seagle, W. Reinhart, S. Alexander, J. Brown, and J.-P. Davis, Shock compression of iridium, in 21st Biennial Conference of the APS Topical Group on Shock Compression of Condensed Matter, 2019, https://www.osti.gov/servlets/purl/1640840.
- (58) L. Al’tshuler, A. Bakanova, I. Dudoladov, E. Dynin, R. Trunin, and B. Chekin, Hugoniots of metals: new data, statistical analysis, and general relationships. J. Appl. Mech. Tech. Phys. 22, 145 (1981).
- (59) T. Sakaia, T. Yagi, T. Irifune, H. Kadobayashi, N Hirao, T. Kunimoto, H. Ohfuji, S. Kawaguchi-Imada, Y. Ohishi, S. Tateno, K. Hirose, High pressure generation using double-stage diamond anvil technique: problems and equations of state of rhenium, High Press. Res. 38, 107 (2018).
- (60) A. Dewaele, P. Loubeyre, F. Occelli, O. Marie, M. Mezouar, Toroidal diamond anvil cell for detailed measurements under extreme static pressures, Nat. Comm. 9, 2913 (2018).
- (61) J. L. Brown, J. P. Davis, C. T. Seagle, Multi-megabar Dynamic Strength Measurements of Ta, Au, Pt, and Ir, J. Dyn. Behav. Mater. 7, 196 (2021).
- (62) M. W. Guinan, D. J. Steinberg, Pressure and temperature derivatives of the isotropic polycrystalline shear modulus for 65 elements, J. Phys. Chem. Solids 35, 1501 (1974).
- (63) G. I. Kerley, Equations of State for Be, Ni, W, and Au, Sandia Report SAND2003-3784 (2003).
- (64) L. Koči, E. M. Bringa, D. S. Ivanov, J. Hawreliak, J. McNaney, A. Higginbotham, L. V. Zhigilei, A. B. Belonoshko, B. A. Remington, R. Ahuja, Simulation of shock-induced melting of Ni using molecular dynamics coupled to a two-temperature model, Phys. Rev. B 74, 012101 (2006).
- (65) M. Sims, R. Briggs, T. J. Volz, S. Singh, S. Hamel, A. L. Coleman, F. Coppari, D. J. Erskine, M. G. Gorman, B. Sadigh, J. Belof, J. H. Eggert, R. F. Smith, J. K. Wicks, Experimental and theoretical examination of shock-compressed copper through the fcc to bcc to melt phase transitions, J. Appl. Phys. 132, 075902 (2022).
- (66) S. R. Baty, L. Burakovsky, D. Errandonea, Ab Initio Phase Diagram of Copper, Crystals 11, 537 (2021).
- (67) P. Souvatzis, O. Eriksson, M. I. Katsnelson, S. P. Rudin, Entropy Driven Stabilization of Energetically Unstable Crystal Structures Explained from First Principles Theory, Phys. Rev. Lett. 100, 095901 (2008).
- (68) M. G. Gorman, S. Elatresh, A. Lazicki, M. M. E. Cormier, S. A. Bonev, D. McGonegle, R. Briggs, A. L. Coleman, S. D. Rothman, L. Peacock, J. V. Bernier, F. Coppari, D. G. Braun, J. R. Rygg, D. E. Fratanduono, R. Hoffmann, G. W. Collins, J. S. Wark, R. F. Smith, J. H. Eggert, M. I. McMahon, Experimental observation of open structures in elemental magnesium at terapascal pressures, Nat. Phys. 18, 1307 (2022).
- (69) L. Burakovsky, S. P. Chen, D. L. Preston, D. G. Sheppard, Z methodology for phase diagram studies: platinum and tantalum as examples, J. Phys.: Conf. Series 500, 162001 (2014).
- (70) S. Anzellini, V. Monteseguro, E. Bandiello, A. Dewaele, L. Burakovsky, D. Errandonea, In situ characterization of the high pressure - high temperature melting curve of platinum, Sci. Rep. 9, 13034 (2019).
- (71) G. A. Alers, J. R. Neighbours, H. Sato, Temperature dependent magnetic contributions to the high field elastic constants of nickel and Fe-Ni alloy, J. Phys. Chem. Solids 13, 40 (1960).
- (72) J. A. Rayne, Elastic Constants of Palladium from 4.2-300 K, Phys. Rev. 118, 1545 (1960).
- (73) R. E. MacFarlane, J. A. Rayne, C. K. Jones, Temperature dependence of elastic moduli of iridium, Phys. Lett. 20, 234 (1966).