New Evidence on the Origin of Solar Wind Microstreams/Switchbacks
Abstract
Microstreams are fluctuations in the solar wind speed and density associated with polarity-reversing folds in the magnetic field (also denoted switchbacks). Despite their long heritage, the origin of these microstreams/switchbacks remains poorly understood. For the first time, we investigated periodicities in microstreams during Parker Solar Probe (PSP) Encounter 10 to understand their origin. Our analysis was focused on the inbound corotation interval on 2021 November 19-21, while the spacecraft dove toward a small area within a coronal hole (CH). Solar Dynamics Observatory remote-sensing observations provide rich context for understanding the PSP in-situ data. Extreme ultraviolet images from the Atmospheric Imaging Assembly reveal numerous recurrent jets occurring within the region that was magnetically connected to PSP during intervals that contained microstreams. The periods derived from the fluctuating radial velocities in the microstreams (approximately 3, 5, 10, and 20 minutes) are consistent with the periods measured in the emission intensity of the jetlets at the base of the CH plumes, as well as in larger coronal jets and in the plume fine structures. Helioseismic and Magnetic Imager magnetograms reveal the presence of myriad embedded bipoles, which are known sources of reconnection-driven jets on all scales. Simultaneous enhancements in the PSP proton flux and ionic (3He, 4He, Fe, O) composition during the microstreams further support the connection with jetlets and jets. In keeping with prior observational and numerical studies of impulsive coronal activity, we conclude that quasiperiodic jets generated by interchange/breakout reconnection at CH bright points and plume bases are the most likely sources of the microstreams/switchbacks observed in the solar wind.
1 INTRODUCTION
It is well known that the fast solar wind (500 km s-1) originates from polar coronal holes (Viall & Borovsky, 2020). Microstreams are the fluctuations in the fast wind radial speed of 20 km s-1above or below the running-average speed, lasting 0.4 days (Neugebauer et al., 1995; Neugebauer & Sterling, 2021). These structures have been detected by Helios at 0.3 AU and Ulysses between 1 and 3 AU (Thieme et al., 1990; Neugebauer et al., 1995). Microstreams are often associated with folds in the magnetic field denoted “switchbacks”, which have been detected by the Parker Solar Probe (PSP; Fox et al. 2016; Raouafi 2022; Raouafi et al. 2023a) in the near-Sun solar wind observations (Bale et al., 2019; Kasper et al., 2019; Horbury et al., 2020). Two theories have been proposed to explain the switchbacks in the solar wind: (i) interchange reconnection in the solar corona (Fisk & Kasper, 2020; Zank et al., 2020; Drake et al., 2021) (ii) in-situ processes in the solar wind (Squire et al., 2020; Ruffolo et al., 2020; Shoda et al., 2021). PSP observations of the switchbacks suggest a correspondence with the typical spatial scale of granules (1000 km), and a correspondence between the switchback patches and the characteristic size of supergranules (30,000 km) (Bale et al., 2021; Fargette et al., 2021).
Coronal holes are populated with omnipresent bright points and plumes (DeForest et al., 2001, 1997; DeForest, 2007; Wang, 2020). With the advent of high spatial and temporal resolution from SDO/AIA, tiny jets (so-called “jetlets”) were found to be associated with “plume transient bright points” occurring at the base of a plume (Raouafi & Stenborg, 2014). This study supported earlier speculation (Raouafi et al., 2008) that jetlets are collectively responsible for the enhanced mass and maintenance of plumes, but the dynamic relationship between jetlets and plumes was not understood until recently. We discovered 3, 5, and 10 minute periods in small, bright EUV bursts and associated outflows (jetlets) at the base of plumes (Kumar et al., 2022). Continuing upward, the plumes are composed of numerous “plumelets” accounting for most of the emission, which are spatially connected to the jetlets and vary on the same timescales (Uritsky et al., 2021). We speculated that p-mode waves possibly play a role in triggering oscillatory reconnection (e.g., Chen & Priest 2006) during the main phase of the plume, and/or modulate the jetlets (Kumar et al., 2022).
The origin of microstreams in CHs is still under debate. It has been suggested that microstreams could be associated with CH jets (Neugebauer et al., 1995; Neugebauer, 2012; Sterling & Moore, 2020; Neugebauer & Sterling, 2021), but jets originating from large coronal bright points (e.g., Sterling & Moore 2020; Kumar et al. 2018) are not frequent enough to account for the quasiperiodic velocity spikes that characterize the microstreams detected by PSP. Therefore big jets are unlikely to be the microstream sources. In contrast, jetlets at the base of plumes and tiny bright points scattered throughout CHs are much more frequent (Raouafi & Stenborg, 2014; Kumar et al., 2019b, 2022; Raouafi et al., 2023b), offering a possible quasiperiodic link to microstreams/switchbacks (for convenience we will refer to this phenomenon as microstreams throughout the remainder of this paper).
A natural question arises here: what constitutes compelling evidence that the patches of solar wind microstreams are due to jetlets? The observed characteristics should be consistent with these features originating in the low corona and subsequently propagated outward into the solar wind, and consistent with the signatures of interchange reconnection. Consequently, we propose that jetlets and microstreams must have similar variability. To test this idea, we analyzed PSP encounter 10 observations and cotemporal SDO/AIA data when PSP was connected to an equatorial CH. Specifically, we extracted jetlet frequencies at the base of a plume in the CH and compared them with the frequencies of solar wind microstreams. Based on microstream observations during encounter 10, Bale et al. (2022) suggested that the fast solar wind is powered by interchange reconnection in CHs. However, a direct connection between dynamic solar activity in the CH and the observed microstreams was not established. Here we report microstream periodicities during the three-day interval of PSP encounter 10 (2021 November 19-21). We have used wavelet analyses of radial wind velocity and EUV intensity to determine the periods in microstreams and jetlets magnetically connected to PSP, respectively, during the same intervals. We find remarkable agreement between the periods measured at the Sun and at 15-30 R☉, as well as compositional signatures at PSP during the microstream patches that are characteristic of coronal jets. These results strongly indicate a causal relationship between jetlets at the Sun and microstreams in the outer corona and heliosphere. In §2, we present the observations and analysis, in §3 we discuss the physical interpretation of the observed periods, and summarize the results in §4.
2 OBSERVATIONS AND RESULTS
We analyzed SDO/AIA (Lemen et al., 2012) full-disk images of the Sun (field-of-view 1.3 ) with a spatial resolution of 1.5 (0.6 pixel-1) and a cadence of 12 s, in the following channels: 304 Å (He II, temperature MK), 171 Å (Fe IX, MK), and 193 Å (Fe XII, Fe XXIV, MK and MK) images. We used cotemporal SDO/HMI (Schou et al., 2012) magnetograms to investigate any photospheric magnetic field changes during the jetlets. The 3D noise-gating technique (DeForest, 2017) was applied to clean the SDO/AIA and HMI images. To determine the underlying magnetic topology for jet source region, we utilized a potential-field extrapolation code (Nakagawa & Raadu, 1972) available in the GX simulator package of SSWIDL (Nita et al., 2015). We analysed PSP (Fox et al., 2016) solar wind and energetic particle observations from Electromagnetic Fields Investigation (FIELDS, Bale et al. 2016), Solar Wind Electron Alpha Proton (SWEAP, Kasper et al. 2016), and Integrated Science Investigation of the Sun (ISIS, McComas et al. 2016) instruments.
During each approach of PSP to its orbital perihelion, there are two intervals of co-rotation (i.e., the spacecraft essentially dives toward a nearly fixed point on the Sun’s surface) separated by an interval around perihelion in which it transits a significant distance across the solar surface. During Encounter 5 studied by Fargette et al. (2021), PSP was transiting, so its magnetic connection to the Sun mapped to a large range of longitudes. Those investigators converted the wide range of coordinates traversed by PSP during that time to a smaller range of coordinates at the Sun and analyzed the spatial distribution of the fluctuations observed. In contrast, on November 19-21 during Encounter 10, PSP was co-rotating while inbound (Bale et al., 2022; Badman et al., 2023), effectively hovering over a coronal hole while orbiting around the Sun. Therefore, the interval analyzed in our study was much longer than the duration of a single jetlet or jet (minutes), in fact, longer than several repeats of jetlet activity. We measured PSP signatures of quasiperiodic microstreams during the co-rotation phase and compared them to the periodicities of jetlets that occurred in the low solar atmosphere and were magnetically connected to PSP during this phase.
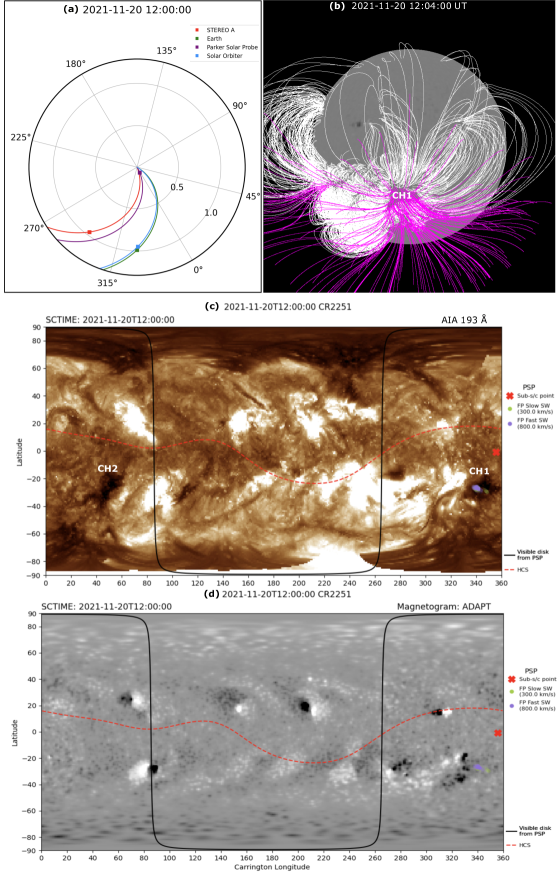
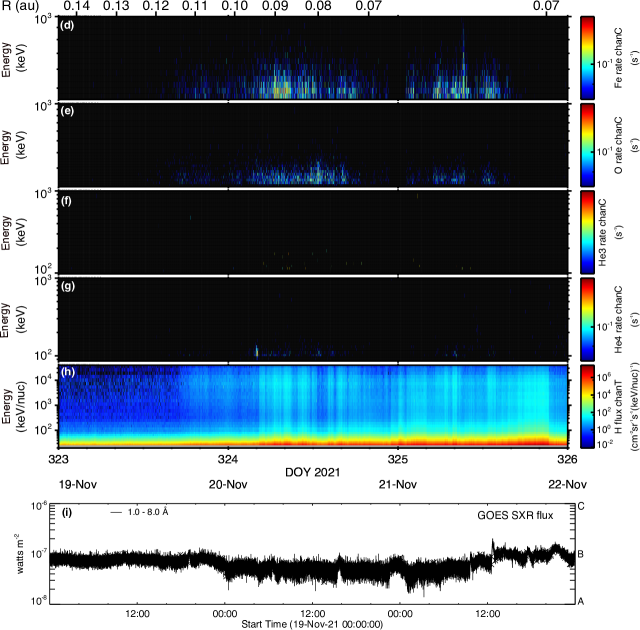
During encounter 10, PSP observed solar wind emanating from two equatorial CHs during 2021 November 19-21 (Bale et al., 2022). The positions of multiple spacecraft including PSP on November 20 are displayed in Figure 1(a) using the Solar-MACH tool (Gieseler et al., 2022). The PSP position varies from 15-30 R☉(0.07-0.14 AU) during this encounter (Figure 2(d)). The Potential Field Source Surface (PFSS (Altschuler & Newkirk, 1969; Schatten et al., 1969; Wang & Sheeley, 1992) extrapolation on November 20 reveals open fields (pink) emerging from CH1 (Figure 1(b)). SDO AIA 193 Å and HMI magnetogram synoptic maps (Figure 1(c,d)) show the footpoint connectivity of PSP on 20 November (Rouillard et al., 2020). The PSP position, represented by a red X, was connected to CH1 during November 19-20 and CH2 on November 21.
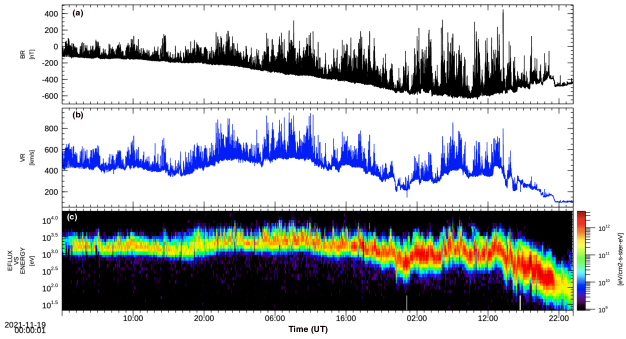
Figure 2(a-c) displays the solar wind radial magnetic field (BR), radial speed (VR), and proton flux vs energy during 2021 November 19-21. PSP detected fast-wind microstreams (VR500 km s-1), associated switchbacks (BR), and enhancements in the proton flux during this interval. More details about this encounter are described in Bale et al. (2022). ISIS Energetic Particle Instrument-Low (EPI-Lo Hill et al. 2020) observes solar energetic particles (SEPs) from 20 keV nucleon-1 to 1.5 MeV -1 over 2 sr. The SEP ion composition is often utilized as a good indicator of the origin of SEPs (Reames, 2021). The SEP ion composition observations from EOI-Lo reveal multi-day enhancement in proton (H), helium (3He, 4He), and heavy ions such as oxygen (O) and iron (Fe) during the microstreams/switchbacks (Figure 2(d-h)). Note that there is a weak enhancement in 3He during the whole interval. The GOES soft X-ray flux profile in 1-8 Å channel shows no flare activity during this microstream interval (Figure 2(i)).
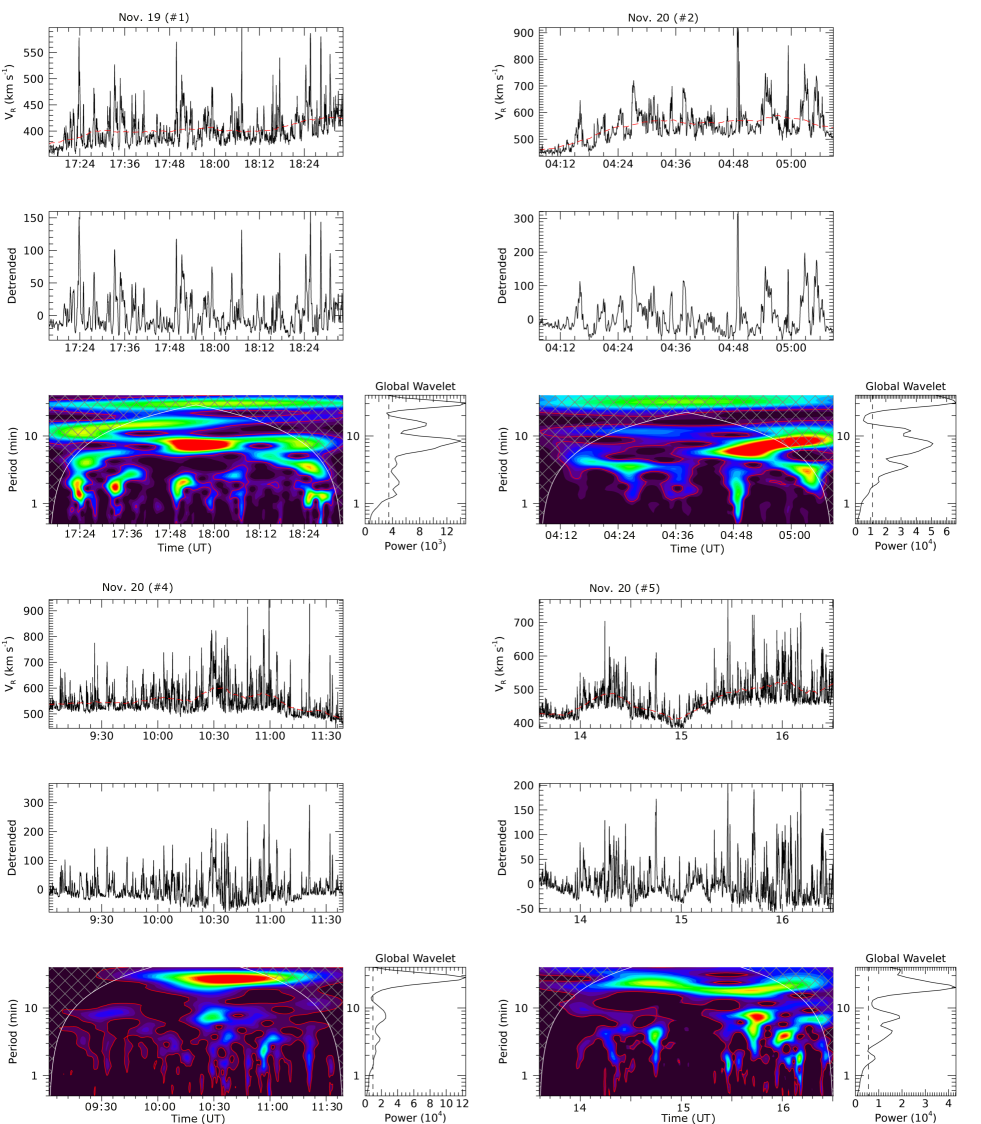
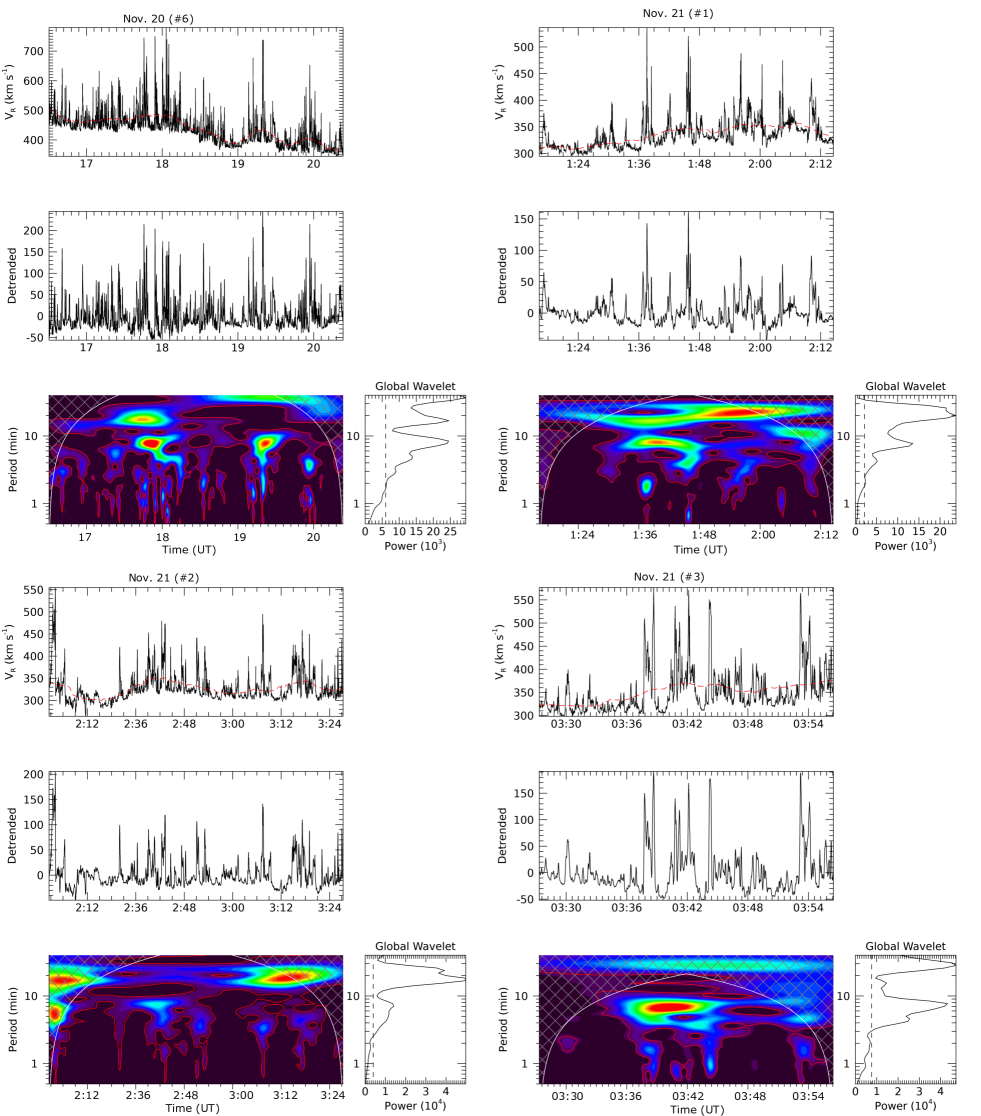
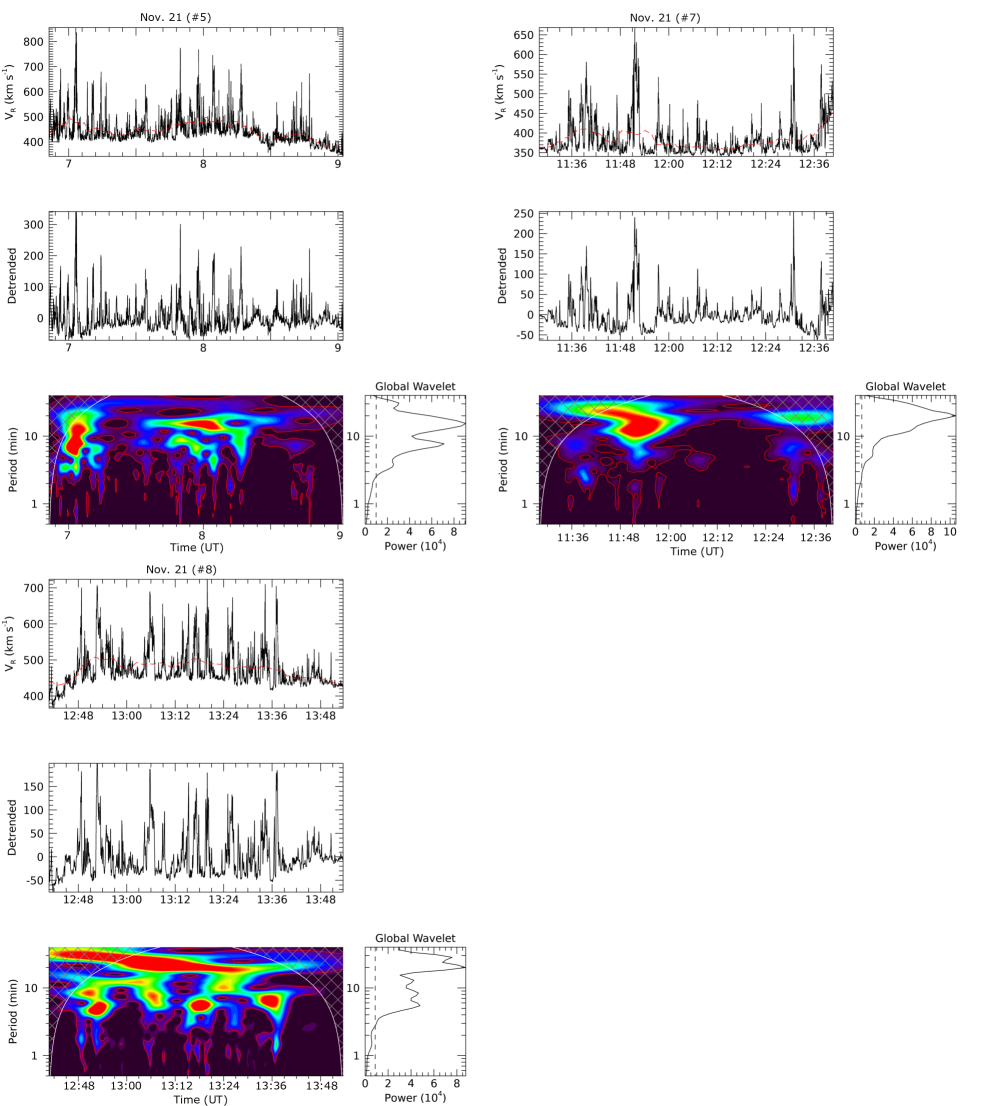
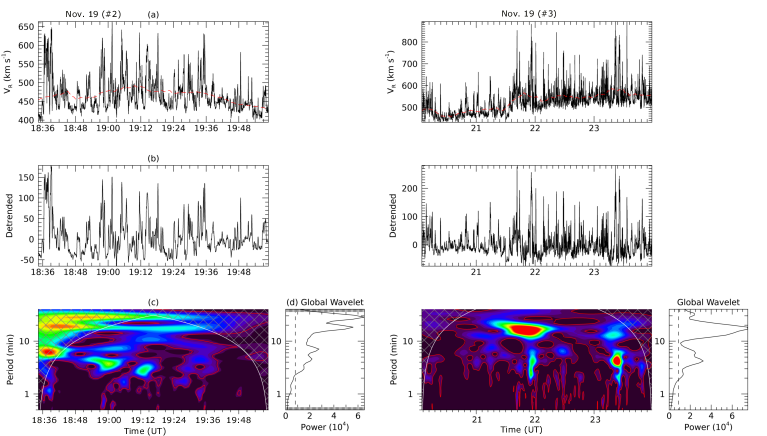
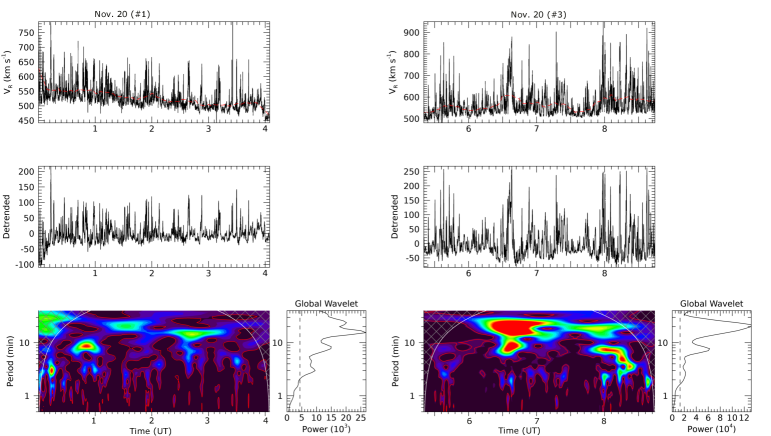
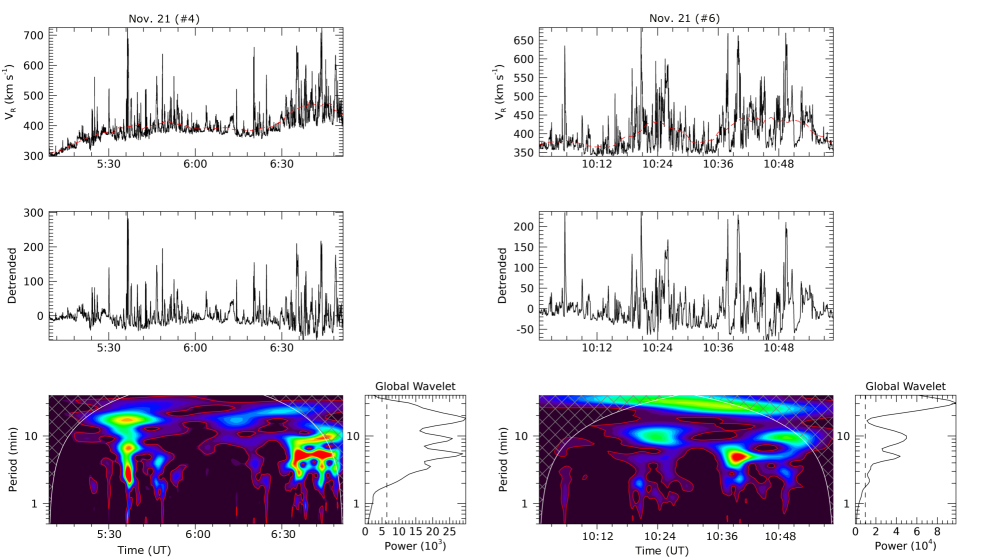
To investigate microstream periodicity, we used several subintervals from November 19 17:00 UT to November 21 14:00 UT. We performed a Morlet wavelet analysis (Torrence & Compo, 1998) of the solar wind radial speed (VR) in each sub-interval. To obtain a detrended light curve for each interval, the speed profile was first smoothed with a boxcar average of width 12 s, using the IDL SMOOTH routine, then a smoothed profile boxcar-averaged at 30 min was subtracted. The wavelet analyses of these subintervals are shown in Figures 3, 4, and Appendix Figures A.1, A.2, and A.3. These plots clearly demonstrate the presence of multiple periods close to 3, 5, 10, and 20 minutes in microstreams with above 99 significance level. The periods in all microstream subintervals are summarized in Table LABEL:tab1. Note that intervals with the same number on different days are not the same interval.
| Date | Interval #1 | #2 | #3 | #4 | #5 | #6 | #7 | #8 |
| (2021) | ||||||||
| Nov. 19 | 2, 4, 8 | 3, 5, 7, 18 | 2, 4, 6, 18 | - | - | - | - | - |
| Nov. 20 | 3, 5, 8, 15, 24 | 2, 3, 8, 12 | 3, 5, 8, 20 | 2, 3.5, 7, 28 | 2, 5, 8, 20 | 3, 5, 8, 16 | - | - |
| Nov. 21 | 2, 4, 20, 25 | 3, 7, 18, 24 | 2, 5, 8, 28 | 3, 5, 9, 19 | 4, 8, 15, 30 | 2.5, 5, 10, 30 | 5, 20 | 5.5, 8.5, 13, 20, 28 |
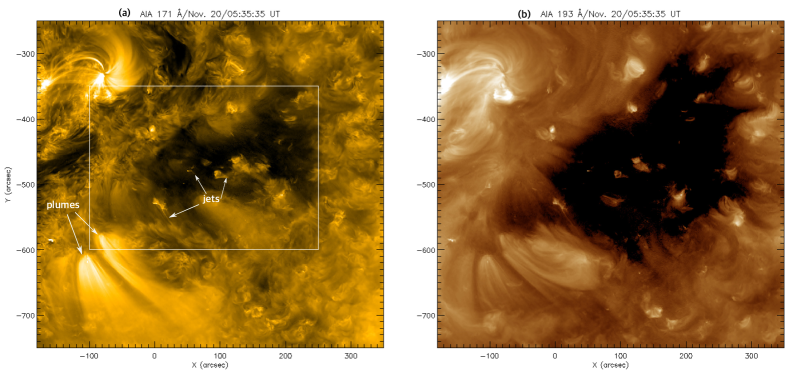
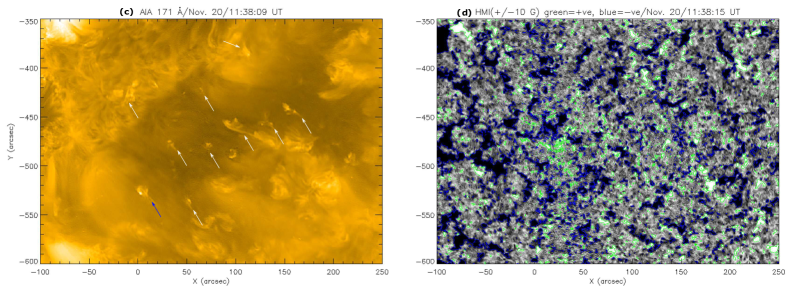
To determine the source region of these solar wind microstreams and low energy SEPs, we analysed PSP and SDO data on November 20, 1-12 UT, while PSP was connected to CH1 (Figures A.4(a,b)). At this time CH1 contained several bright points and bright and faint plumes everywhere. PSP was connected to CH2 on November 21, which went behind the limb from the AIA point of view. Therefore, it was not possible to analyse the jet activities inside CH2.
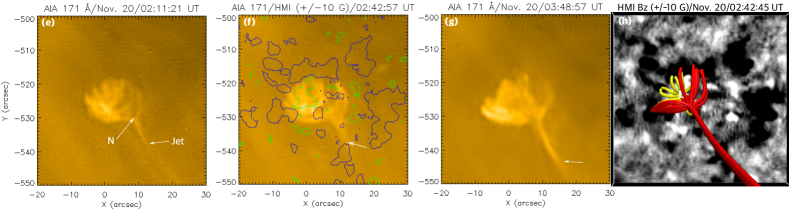
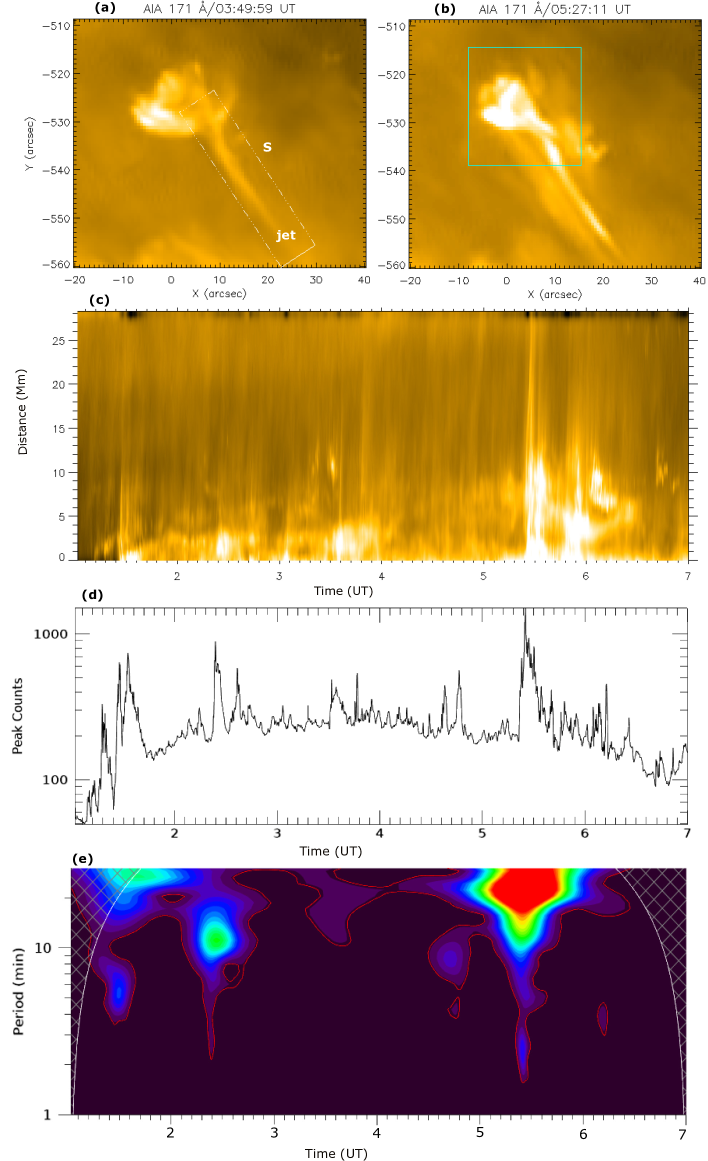
The HMI magnetogram and accompanying animation show the presence of positive (minority) polarity everywhere in the negative (majority) polarity CH1 (Figure A.4(d)). The photospheric magnetic field is saturated at 10 G above the noise level. Interestingly, the AIA 171 Å animation shows quasiperiodic jets everywhere in the CH1 from November 19 20:12:45 UT to November 20 22:41:15 UT (Figure A.4(c), marked by arrows). Microstreams and low-energy SEPs were detected by PSP during the same interval. One example of repetitive jetting from a CH1 bright point is shown in Figure A.4(e-g)). The potential field extrapolation of the source region shows a classic fan-spine topology (Figure A.4(h)). Quasiperiodic jets emanate from the cusp along the outer spine (period 10 and 20 minutes, Figure A.5(d,e)), while the underlying minority-polarity patches interact with adjacent positive polarity and decay. The AIA 171 Å time-distance intensity plot (Figure A.5(c)) and accompanying animation along the rectangular slit S clearly reveal the quasiperiodic jets along the outer spine of this small fan-spine topology during 1-7 UT on November 20. The recurrent jets are associated with quasiperiodic brightenings (Figure A.5(d)) in the fan.
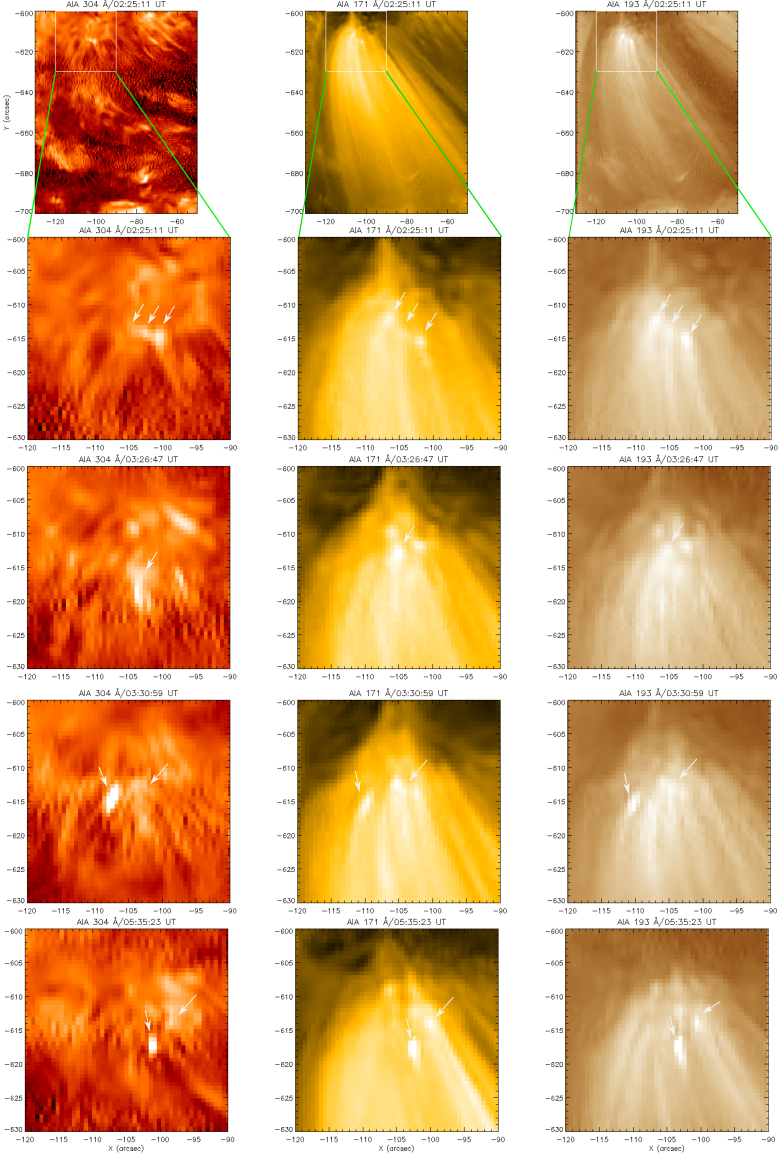
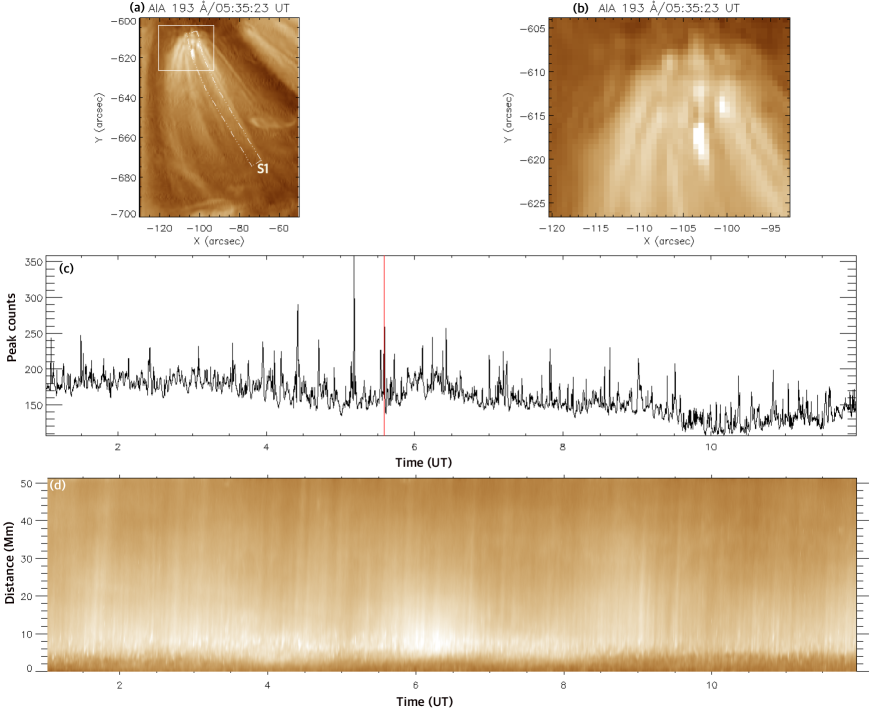
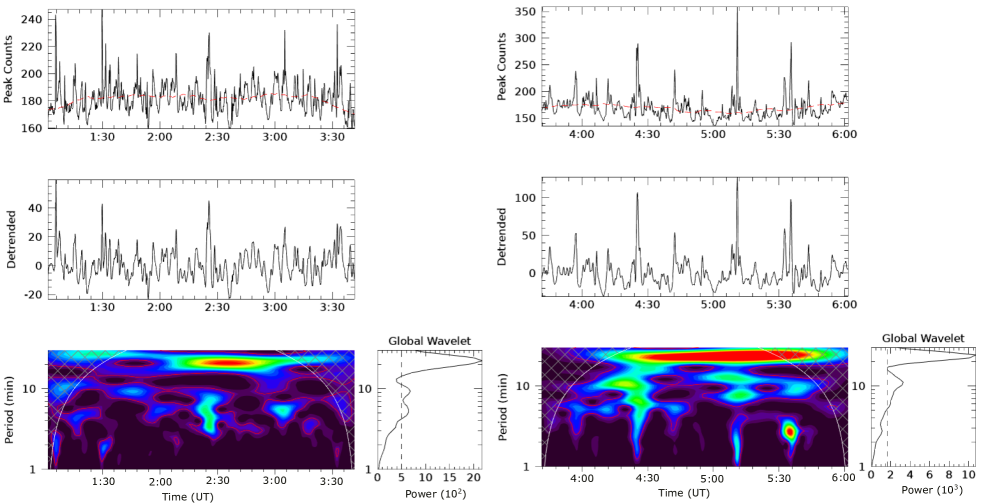
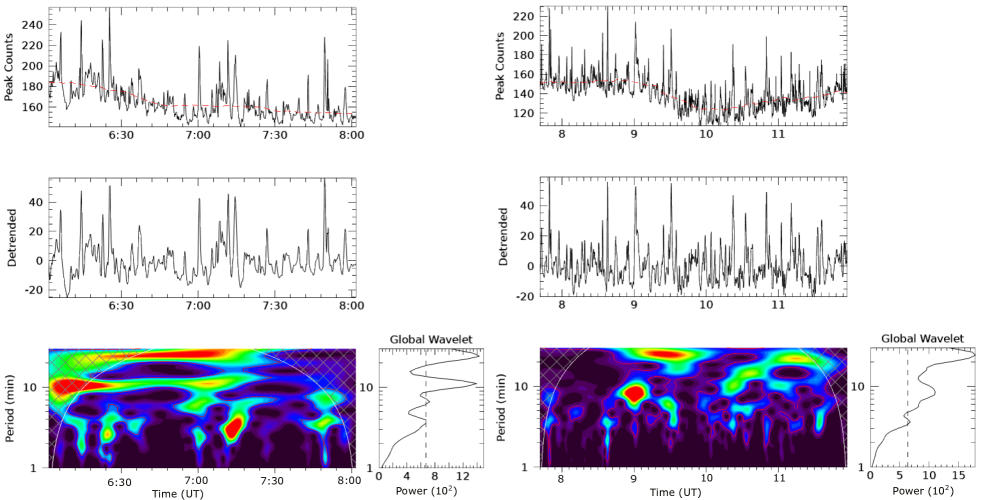
We analyzed AIA 304, 171, and 193 Å images of the jetlets at the base of the brightest plume in CH1 (marked by an arrow in Figure A.4(a)) and larger jets scattered throughout the CH. The accompanying animation reveals quasiperiodic brightenings and associated jetlets (marked by arrows) randomly distributed at the base of the plume (Figure 5). The jetlets are associated with chromospheric/transition region ejections and brightenings in the 304 Å channel that are 2-3 wide. In addition, outflows (jetlets) propagated along the plumelets associated with these brightenings. To estimate the periodicities of these energy-release episodes at the plume base, we extracted peak counts (arbitrary units) within a box (Figure 6(a)) at the footpoint of the plume during 1-12 UT on November 20 (Figure 6(a-c)). The quasiperiodic bursts in the light curve (see accompanying animation) are associated with jetlets and brightenings (Figure 6(d)), most likely generated by interchange reconnection near the base of the plume (e.g., Kumar et al. 2022). The wavelet analysis reveals the presence of 3, 5, 10, and 20 minute periods (99 significance) in the emissions of the brightenings and jetlets (Figure 7).
A low-energy SEP enhancement in proton flux and 3He, 4He, Fe, and O ion compositions was observed by PSP during the November interval discussed here. The field lines linked to PSP were well-connected to footpoints in CH1 and CH2 (Bale et al., 2022), although the inherent uncertainties in tracing magnetic connectivity from the heliosphere to the photosphere prevent identifying these footpoints with specific features. In addition, the GOES soft X-ray data reveal no flare activity during 19-21 November. Therefore we conclude that CH1 and CH2 are the sources of the SEP enhancement.
3 DISCUSSION
We found periodicities in the microstreams observed by PSP during encounter 10 (15-30 R⊙) on 2021 November 19-21, and compared them with AIA observations of impulsive events in the magnetically connected equatorial coronal holes. The estimated microstream periods are approximately 3, 5, 10, and 20 minutes. On November 19-20 PSP was connected to CH1, located on the disk, so we could identify and characterize signatures of energy release inside the CH using AIA observations. Several bright points and plumes were observed everywhere in the equatorial CH; HMI magnetograms show that these features were associated with positive-polarity sites scattered throughout the negative polarity CH. PSP observations also revealed low-energy multiday SEP enhancements while magnetically connected to CH1.
Quasiperiodic jets on a range of spatial scales emanated from the plume bases and from those bright points. Note that jetlets manifesting similar periodicities have been observed at the base of other plumes in four different equatorial CHs (Kumar et al., 2022). We found that the jetlets are heated to 1-2 MK and attain speeds of order 100 km s-1; each impulsive event was estimated to release approximately 1024 erg. Recurrent jets with periods of 6-10 minutes also have been observed in small bright points in other coronal holes (e.g., Kumar et al., 2019b, 2022, see animation 1). Periods of 5-30 minutes have also been observed in outflows from polar plumes (McIntosh et al., 2010; Tian et al., 2011). The present analysis shows that the microstream periods agree well with the periods of the repetitive EUV brightenings and jetlets at plume bases.
In addition, PSP recorded an extended interval of enhanced 3He and heavier ions that coincided with the interval containing the multiperiodic microstreams and jetlets. Ulysses observations showed that microstreams are associated with variations in the helium content (i.e., ratio of alpha particle flux to the proton flux) of the solar wind, indicating their solar origin (Neugebauer et al., 1997). For PSP encounter 10 specifically, Bale et al. (2022) reported fluctuations in the helium content similar to the microstream variations, and suggested the chromospheric origin of the microstreams. Multiday enhancements in 3He, 4He, Fe, and O were detected by ACE at 1 AU on October 12–16, 2005, attributed to AR 10814 (Wang et al., 2006), but it was unclear why the 3He enhancement continued for several days. Mason (2007) suggested that continuous magnetic reconnection would release 3He into the interplanetary medium, but the exact source region was not identified due to insufficient resolution of the available EUV observations. Note that big jets are often associated with impulsive 3He-rich events at 1 AU (Wang et al., 2006; Pick et al., 2006; Mason et al., 2016) along with enhancements in heavy ions (Fe, O etc.). Because the same physical mechanism is responsible for jets on all scales, we conclude that the full panoply of jets, including jetlets, is likely to produce similar ion enhancements. The coexistence of quasiperiodic outflows from numerous positions within CH1, microstreams with the same periods detected at PSP, and enhanced ionic composition at PSP consistent with coronal jets strongly suggests a direct connection between jetlets at the Sun and microstreams in the heliosphere.
Our prior numerical and observational studies of coronal jets provide important clues about the underlying physics linking jetlets and microstreams. Both jets and jetlets emanate from embedded bipoles, which have classic fan-spine topologies (Antiochos, 1998). When stressed by emergence and/or footpoint motions, the null atop the fan is distorted into a current sheet, enabling reconnection between the internal (closed) magnetic flux inside the separatrix and the external (open, in CHs) flux. This interchange reconnection alone tends to produce weak jets (Pariat et al., 2009, 2015; Kumar et al., 2021), whereas the presence of a filament channel inside the fan can yield more energetic and explosive outflows according to the breakout jet model (Wyper et al., 2017, 2018). Our earlier jetlet study found that the fan surface is 2-3 arcsec wide and the height of the null point lies in the chromosphere/transition-region (Kumar et al., 2022). Although most jetlet sources are too small to allow detection of mini-filaments, nearly all larger coronal jets exhibit this and/or other key signatures of filament channels (Sterling et al., 2015; Kumar et al., 2019a). Therefore, we propose that repetitive reconnection in multiple locations beneath plumes and elsewhere in CHs is responsible for initiating and driving outflows that evolve into microstreams.
Our previous and present plume observations show that the jetlet widths lie between 1-2 arcsecs (750-1500 km), while plumes are 30-50 arcsecs (22500-37500 km) wide. Therefore, the scale sizes of individual microstreams and patches projected back to the Sun by previous studies (Bale et al., 2021; Fargette et al., 2021; Bale et al., 2022) are roughly consistent with the sizes of jetlets (granules) and plumes (supergranules). We have also demonstrated that mixed polarities and ubiquitous jetlets/jets from plumes and bright points exist throughout CHs. When PSP co-rotates over a CH, it is magnetically connected to these solar source regions for intervals substantially longer than the duration of individual intensity variations. The recurrent patterns found in jetlets/jets are mirrored in the microstreams, implying that they have a common origin (i.e., interchange reconnection). The discovery of jetlet periods commensurate with p-modes raised fundamental questions about this relationship (Uritsky et al., 2021; Kumar et al., 2022). Two possibilities exist: reconnection could be induced by p-mode waves impinging on the null (Chen & Priest, 2006; Heggland et al., 2009), or the observed flows could be modulated by p-modes. Future numerical simulations will aid in determining which explanation is more likely.
4 CONCLUSIONS
We have demonstrated, for the first time, that periodicities in the radial velocities of microstreams are consistent with the periodicities observed in the EUV emissions of recurrent jetlets at the base of plumes and throughout coronal holes. This evidence, coupled with the coincident enhancement of 3He and heavier ions, suggests a direct link between jetlets and microstreams, including the associated magnetic switchbacks. A significant gap remains, however: we have traced jetlets outward into plumelets, but individual parcels of plasma have not been followed from plumes to the inner heliosphere. Whether these narrow, high-speed injections can transit this crucial zone and produce the characteristic magnetic-field reversals of switchbacks remains to be demonstrated. The Alfvénic fronts and wakes propagating well ahead of the dense jetlet material may play a role in forming the microstream/switchback properties. One approach to solving this problem is to simulate self-consistently the generation and transport of reconnection-driven jets into a more realistic solar wind than has been modeled thus far.
Quasiperiodic jetlets (energy equivalent to nanoflares) can contribute to coronal heating and significant mass flux to the solar wind (Kumar et al., 2022). The omnipresence of jetlets also may explain the origin of the fast solar wind in CHs (Raouafi et al., 2023b). We anticipate more detailed observations and analyses of similar events from the upcoming PSP and SolO (Müller et al., 2013) perihelions in the near future.
References
- Altschuler & Newkirk (1969) Altschuler, M. D., & Newkirk, G. 1969, Sol. Phys., 9, 131, doi: 10.1007/BF00145734
- Antiochos (1998) Antiochos, S. K. 1998, ApJ, 502, L181, doi: 10.1086/311507
- Badman et al. (2023) Badman, S. T., Riley, P., Jones, S. I., et al. 2023, JGRA, 128, e2023JA031359, doi: 10.1029/2023JA031359
- Bale et al. (2016) Bale, S. D., Goetz, K., Harvey, P. R., et al. 2016, Space Sci. Rev., 204, 49, doi: 10.1007/s11214-016-0244-5
- Bale et al. (2019) Bale, S. D., Badman, S. T., Bonnell, J. W., et al. 2019, Nature, 576, 237, doi: 10.1038/s41586-019-1818-7
- Bale et al. (2021) Bale, S. D., Horbury, T. S., Velli, M., et al. 2021, ApJ, 923, 174, doi: 10.3847/1538-4357/ac2d8c
- Bale et al. (2022) Bale, S. D., Drake, J. F., McManus, M. D., et al. 2022, arXiv e-prints, arXiv:2208.07932. https://arxiv.org/abs/2208.07932
- Chen & Priest (2006) Chen, P. F., & Priest, E. R. 2006, Sol. Phys., 238, 313, doi: 10.1007/s11207-006-0215-1
- DeForest (2007) DeForest, C. E. 2007, ApJ, 661, 532, doi: 10.1086/515561
- DeForest (2017) —. 2017, ApJ, 838, 155, doi: 10.3847/1538-4357/aa67f1
- DeForest et al. (1997) DeForest, C. E., Hoeksema, J. T., Gurman, J. B., et al. 1997, Sol. Phys., 175, 393, doi: 10.1023/A:1004955223306
- DeForest et al. (2001) DeForest, C. E., Plunkett, S. P., & Andrews, M. D. 2001, ApJ, 546, 569, doi: 10.1086/318221
- Drake et al. (2021) Drake, J. F., Agapitov, O., Swisdak, M., et al. 2021, A&A, 650, A2, doi: 10.1051/0004-6361/202039432
- Fargette et al. (2021) Fargette, N., Lavraud, B., Rouillard, A. P., et al. 2021, ApJ, 919, 96, doi: 10.3847/1538-4357/ac1112
- Fisk & Kasper (2020) Fisk, L. A., & Kasper, J. C. 2020, ApJ, 894, L4, doi: 10.3847/2041-8213/ab8acd
- Fox et al. (2016) Fox, N. J., Velli, M. C., Bale, S. D., et al. 2016, Space Sci. Rev., 204, 7, doi: 10.1007/s11214-015-0211-6
- Gieseler et al. (2022) Gieseler, J., Dresing, N., Palmroos, C., et al. 2022, Solar-MACH: Multi-spacecraft longitudinal configuration plotter, Astrophysics Source Code Library, record ascl:2210.015. http://ascl.net/2210.015
- Heggland et al. (2009) Heggland, L., De Pontieu, B., & Hansteen, V. H. 2009, ApJ, 702, 1, doi: 10.1088/0004-637X/702/1/1
- Hill et al. (2020) Hill, M. E., Mitchell, D. G., Allen, R. C., et al. 2020, ApJS, 246, 65, doi: 10.3847/1538-4365/ab643d
- Horbury et al. (2020) Horbury, T. S., Woolley, T., Laker, R., et al. 2020, ApJS, 246, 45, doi: 10.3847/1538-4365/ab5b15
- Kasper et al. (2016) Kasper, J. C., Abiad, R., Austin, G., et al. 2016, Space Sci. Rev., 204, 131, doi: 10.1007/s11214-015-0206-3
- Kasper et al. (2019) Kasper, J. C., Bale, S. D., Belcher, J. W., et al. 2019, Nature, 576, 228, doi: 10.1038/s41586-019-1813-z
- Kumar et al. (2019a) Kumar, P., Karpen, J. T., Antiochos, S. K., Wyper, P. F., & DeVore, C. R. 2019a, ApJ, 885, L15, doi: 10.3847/2041-8213/ab45f9
- Kumar et al. (2018) Kumar, P., Karpen, J. T., Antiochos, S. K., et al. 2018, ApJ, 854, 155, doi: 10.3847/1538-4357/aaab4f
- Kumar et al. (2019b) —. 2019b, ApJ, 873, 93, doi: 10.3847/1538-4357/ab04af
- Kumar et al. (2021) —. 2021, ApJ, 907, 41, doi: 10.3847/1538-4357/abca8b
- Kumar et al. (2022) Kumar, P., Karpen, J. T., Uritsky, V. M., et al. 2022, ApJ, 933, 21, doi: 10.3847/1538-4357/ac6c24
- Lemen et al. (2012) Lemen, J. R., Title, A. M., Akin, D. J., et al. 2012, SoPh, 275, 17, doi: 10.1007/s11207-011-9776-8
- Mason (2007) Mason, G. M. 2007, Space Sci. Rev., 130, 231, doi: 10.1007/s11214-007-9156-8
- Mason et al. (2016) Mason, G. M., Nitta, N. V., Wiedenbeck, M. E., & Innes, D. E. 2016, ApJ, 823, 138, doi: 10.3847/0004-637X/823/2/138
- McComas et al. (2016) McComas, D. J., Alexander, N., Angold, N., et al. 2016, Space Sci. Rev., 204, 187, doi: 10.1007/s11214-014-0059-1
- McIntosh et al. (2010) McIntosh, S. W., Innes, D. E., de Pontieu, B., & Leamon, R. J. 2010, A&A, 510, L2, doi: 10.1051/0004-6361/200913699
- Müller et al. (2013) Müller, D., Marsden, R. G., St. Cyr, O. C., & Gilbert, H. R. 2013, Sol. Phys., 285, 25, doi: 10.1007/s11207-012-0085-7
- Nakagawa & Raadu (1972) Nakagawa, Y., & Raadu, M. A. 1972, Sol. Phys., 25, 127, doi: 10.1007/BF00155751
- Neugebauer (2012) Neugebauer, M. 2012, ApJ, 750, 50, doi: 10.1088/0004-637X/750/1/50
- Neugebauer et al. (1995) Neugebauer, M., Goldstein, B. E., McComas, D. J., Suess, S. T., & Balogh, A. 1995, JGRA, 100, 23389, doi: 10.1029/95JA02723
- Neugebauer et al. (1997) Neugebauer, M., Ruzmaikin, A., & McComas, D. J. 1997, in American Institute of Physics Conference Series, Vol. 385, Robotic Exploration Close to the Sun: Scientific Basis, ed. S. R. Habbal, 41–46, doi: 10.1063/1.51765
- Neugebauer & Sterling (2021) Neugebauer, M., & Sterling, A. C. 2021, ApJ, 920, L31, doi: 10.3847/2041-8213/ac2945
- Nita et al. (2015) Nita, G. M., Fleishman, G. D., Kuznetsov, A. A., Kontar, E. P., & Gary, D. E. 2015, ApJ, 799, 236, doi: 10.1088/0004-637X/799/2/236
- Pariat et al. (2009) Pariat, E., Antiochos, S. K., & DeVore, C. R. 2009, ApJ, 691, 61, doi: 10.1088/0004-637X/691/1/61
- Pariat et al. (2015) Pariat, E., Dalmasse, K., DeVore, C. R., Antiochos, S. K., & Karpen, J. T. 2015, A&A, 573, A130, doi: 10.1051/0004-6361/201424209
- Pick et al. (2006) Pick, M., Mason, G. M., Wang, Y. M., Tan, C., & Wang, L. 2006, ApJ, 648, 1247, doi: 10.1086/505926
- Raouafi (2022) Raouafi, N. E. 2022, Physics Today, 75, 28, doi: 10.1063/PT.3.5120
- Raouafi et al. (2008) Raouafi, N. E., Petrie, G. J. D., Norton, A. A., Henney, C. J., & Solanki, S. K. 2008, ApJ, 682, L137, doi: 10.1086/591125
- Raouafi & Stenborg (2014) Raouafi, N. E., & Stenborg, G. 2014, ApJ, 787, 118, doi: 10.1088/0004-637X/787/2/118
- Raouafi et al. (2023a) Raouafi, N. E., Matteini, L., Squire, J., et al. 2023a, Space Sci. Rev., 219, 8, doi: 10.1007/s11214-023-00952-4
- Raouafi et al. (2023b) Raouafi, N. E., Stenborg, G., Seaton, D. B., et al. 2023b, ApJ, 945, 28, doi: 10.3847/1538-4357/acaf6c
- Reames (2021) Reames, D. V. 2021, Solar Energetic Particles. A Modern Primer on Understanding Sources, Acceleration and Propagation, Vol. 978 (Springer Cham), doi: 10.1007/978-3-030-66402-2
- Rouillard et al. (2020) Rouillard, A. P., Pinto, R. F., Vourlidas, A., et al. 2020, A&A, 642, A2, doi: 10.1051/0004-6361/201935305
- Ruffolo et al. (2020) Ruffolo, D., Matthaeus, W. H., Chhiber, R., et al. 2020, ApJ, 902, 94, doi: 10.3847/1538-4357/abb594
- Schatten et al. (1969) Schatten, K. H., Wilcox, J. M., & Ness, N. F. 1969, Sol. Phys., 6, 442, doi: 10.1007/BF00146478
- Schou et al. (2012) Schou, J., Scherrer, P. H., Bush, R. I., et al. 2012, Sol. Phys., 275, 229, doi: 10.1007/s11207-011-9842-2
- Shoda et al. (2021) Shoda, M., Chandran, B. D. G., & Cranmer, S. R. 2021, ApJ, 915, 52, doi: 10.3847/1538-4357/abfdbc
- Squire et al. (2020) Squire, J., Chandran, B. D. G., & Meyrand, R. 2020, ApJ, 891, L2, doi: 10.3847/2041-8213/ab74e1
- Sterling & Moore (2020) Sterling, A. C., & Moore, R. L. 2020, ApJ, 896, L18, doi: 10.3847/2041-8213/ab96be
- Sterling et al. (2015) Sterling, A. C., Moore, R. L., Falconer, D. A., & Adams, M. 2015, Nature, 523, 437, doi: 10.1038/nature14556
- Thieme et al. (1990) Thieme, K. M., Marsch, E., & Schwenn, R. 1990, AnGeo, 8, 713
- Tian et al. (2011) Tian, H., McIntosh, S. W., Habbal, S. R., & He, J. 2011, ApJ, 736, 130, doi: 10.1088/0004-637X/736/2/130
- Torrence & Compo (1998) Torrence, C., & Compo, G. P. 1998, BAMS, 79, 61, doi: 10.1175/1520-0477(1998)079<0061:APGTWA>2.0.CO;2
- Uritsky et al. (2021) Uritsky, V. M., DeForest, C. E., Karpen, J. T., et al. 2021, ApJ, 907, 1, doi: 10.3847/1538-4357/abd186
- Viall & Borovsky (2020) Viall, N. M., & Borovsky, J. E. 2020, JGRA, 125, e26005, doi: 10.1029/2018JA026005
- Wang (2020) Wang, Y. M. 2020, ApJ, 904, 199, doi: 10.3847/1538-4357/abbda6
- Wang et al. (2006) Wang, Y. M., Pick, M., & Mason, G. M. 2006, ApJ, 639, 495, doi: 10.1086/499355
- Wang & Sheeley (1992) Wang, Y. M., & Sheeley, N. R., J. 1992, ApJ, 392, 310, doi: 10.1086/171430
- Wyper et al. (2017) Wyper, P. F., Antiochos, S. K., & DeVore, C. R. 2017, Nature, 544, 452, doi: 10.1038/nature22050
- Wyper et al. (2018) Wyper, P. F., DeVore, C. R., & Antiochos, S. K. 2018, ApJ, 852, 98, doi: 10.3847/1538-4357/aa9ffc
- Zank et al. (2020) Zank, G. P., Nakanotani, M., Zhao, L. L., Adhikari, L., & Kasper, J. 2020, ApJ, 903, 1, doi: 10.3847/1538-4357/abb828
Appendix A Microstream periodicity analysis and CH jets
This section contains supplementary material (additional figures) to support the results described above. The high-quality animations for Figures 5, 6, A4, and A5 are available in the Zenodo repository at doi: 10.5281/zenodo.7924233.