Quantum-enhanced optical beat-note detection
beyond 3-dB noise penalty of image band
Abstract
Optical beat-note detection with two beams at different frequencies is a key sensing technology for various spatial/temporal measurements. However, its sensitivity is inherently susceptible to shot noise due to the extra shot-noise contamination from the image band known as the 3-dB noise penalty, as well as the unavoidable optical power constraints at detectors. Here, we propose a method to remove shot noise from all relevant bands including the extra noise by using squeezed light. We also demonstrate beyond-3-dB noise reduction experimentally. Our work should boost the sensitivity of various spatial/temporal measurements beyond the current limitations.
Optical beat-note detection, which measures the relative phase of two beams at different frequencies through their interference, is a key sensing technology for various spatial/temporal ultra-precise measurements. For example, beat-note detection is essential for high-precision clock comparisons Yamaguchi et al. (2011), frequency measurements in optical frequency combs Endo et al. (2018); Nagano et al. (2009), and space gravitational wave telescopes Izumi and Fujimoto (2021); 2000 LISA: System and Technology Study Report ESA document ESA-SCI . More generally, beat-note detection is advantageous when low-frequency optical signals contain important information Izumi and Fujimoto (2021); Kawamura et al. (2006); Abadie et al. (2011); Chalermsongsak et al. (2015). This is because it can detect low-frequency optical signals as high-frequency electronic signals and thus has immunity to common low-frequency electronic noise Xie and Feng (2018).
The sensitivity of beat-note detection, like other optical sensing methods, is fundamentally limited by noise due to the quantization of light, commonly known as shot noise Yuen and Chan (1983). In fact, beat-note detection is inherently more susceptible to shot-noise limitations than other methods due to the notorious “extra noise penalty,” which doubles the contribution of shot noise Yuen and Chan (1983). This penalty comes from the contamination by the image-band shot noise when measuring signals in the signal band (Fig.1(a)). In general, the effects of shot noise in optical sensing can be reduced by increasing the optical power. However, this strategy is also disadvantageous for beat-note detection because it unavoidably uses large classical beat signals, which make optical detectors saturated or even broken. This can be compared to, for example, homodyne detection, which can extract phase information without large signals by using dark fringe conditions Bond et al. (2016). In addition to the detector issues, the optical power in optical sensing can also be restricted by other constraints, such as the damage threshold of the target object in biological measurements Taylor et al. (2013); Casacio et al. (2021).
It has long been known that shot noise can be reduced by using squeezed light even under optical power constraints Lawrie et al. (2019); Taylor et al. (2013); Troullinou et al. (2021). Such an approach has been demonstrated in homodyne measurement Yonezawa et al. (2012) and phase-sensitive heterodyne measurement Xie and Feng (2018); Marino et al. (2007). However, its application to phase-insensitive heterodyne detection, in which beat-note detection can be categorized, has yet to be proposed or achieved. This is because the simultaneous reduction of both signal- and image-band noise seems nontrivial. The use of the squeezed light for the signal band Yonezawa et al. (2012); Xie and Feng (2018); Marino et al. (2007) can only reduce half shot noise and leave image-band noise intact.
Here, we propose and demonstrate a method to remove shot noise from both the signal and image bands (Fig.1(b)). The key idea is to use squeezed light of two different frequencies, correlate quantum fluctuation in the signal and image bands, and thereby cancel out their effect at the same time. In principle, our method can completely remove shot noise in the limit of infinite squeezing. We experimentally implement this method and reduce shot noise by more than 3 dB at 3 MHz sideband frequency around the 10 MHz beat signal. This beyond-3-dB noise reduction is unachievable only with the signal-band squeezing, and thus clearly demonstrates the shot-noise reduction from both the signal and image bands. Our method can be applied to various applications of beat-note detection, and boost the sensitivity beyond the current limitations.
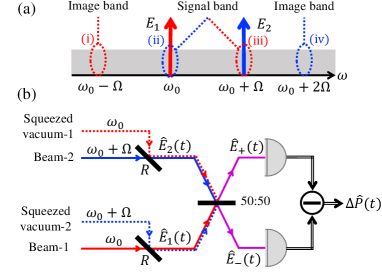
Working principle — In general, optical beat-note detection is used to extract the information encoded in the relative phase of two beams at different frequencies. This detection can be described as follows (Fig.1(a)). First, two incoming beams at angular frequencies of (beam-1) and (beam-2) interfere with each other. The optical power after the interference beats at the angular frequency . By tracking the phase of this beat note, we can continuously measure the relative phase of the initial two beams.
The sensitivity of the beat-note detection depends on the signal-to-noise ratio of the phase component of the beat signal at . This signal is contaminated by quantum fluctuation at optical angular frequencies , , , and because these angular frequencies are away from the angular frequency of beam-1 or beam-2. The angular frequencies around and are called “signal bands,” and their quantum fluctuation is inseparable from the phase signal of interest. On the other hand, the angular frequencies around and are called “image bands,” and their quantum fluctuation also contributes to noise even though these bands have no signal of interest. The contribution of the image-band vacuum in beat-note detection is, therefore, often called the extra noise penalty of 3 dB.
A typical way to reduce shot noise is to use squeezed lights. The straightforward idea is to inject phase-squeezed light to beam-1 (2) so that these two have the same center angular frequency (). As a result, we can suppress the quantum fluctuation of the phase component at the corresponding signal band () while not affecting other bands as long as the bandwidth of the squeezed light is appropriate. In this case, however, quantum fluctuation at the image bands remains. Thus, we can remove only half of shot noise and cannot reduce the shot-noise level by more than 3 dB.
In contrast, our method can simultaneously reduce shot noise in both the signal and image bands. The key idea is to inject squeezed light to beam-1 and 2 in such a way that the frequencies are inversely related; that is, we inject the squeezed light at () to beam-1 (2) with an appropriate phase. The squeezed light makes a quantum correlation between quantum fluctuation at and ( and ) Caves and Schumaker (1985). When this light interferes with beam-2 (1) and is detected, the quantum fluctuation is canceled and reduced due to the quantum correlation. As a result, we can simultaneously suppress the shot noise of both the signal and image bands, and reach beyond-3-dB shot noise reduction. For this purpose, the squeezed light can be injected in a way shown in Fig.1(b). This beat-note detection assumes a situation with optical power constraints, where the beams are picked off by beam splitters with reflectivity to set their power below the upper limit. In this case, we can inject squeezed lights through the other ports of the beam splitters.
Next, we introduce a mathematical formulation of the principle. According to the two-photon formalism Caves and Schumaker (1985), we can define sideband operators with center angular frequency and sideband angular frequency in the frequency domain as , . Here, is a photon annihilation operator of angular frequency . We can then define the operators for quadrature phase amplitudes in the time domain as , where denotes time and . With these operators, beam-1 and beam-2 after the pickoff by the beam splitters in Fig.1(b) are described as
| (1) | ||||
| (2) |
Here, is the classical complex amplitude of beam-1. The term represents quantum fluctuation and its center angular frequency () is intentionally shifted from that of the classical amplitude () for later convenience. Beam-2 is also defined in a similar way with the term representing quantum fluctuation. The goal of the beat-note detection is to measure the relative phase of these two beams. The 50:50 beam splitter transforms these beams into . We then measure their beam-power difference. The measured signal can be described as
| (3) |
by using Eqs. (1) and (2) while neglecting the second-order terms for the quantum fluctuation. Here, represents the classical beat signal, and represents the shot noise which limits the sensitivity of the beat-note detection. In our method, both of the shot-noise terms and can be arbitrarily reduced by using squeezed vacuum-2 () and 1 () at appropriate phases, respectively. This is why we can reduce the shot-noise contributions to zero in the limit of infinite squeezing.
The squeezing of () is also equivalent to canceling out shot noise at and ( and ) by making an Einstein-Podolsky-Rosen (EPR) state Einstein et al. (1935) in these angular frequencies. This can be understood from the relation See Supplemental Material for further details on the relation between squeezing and quantum correlation, filters used in our experiment, the broad spectra without post-processing, and the demodulated spectra without cross-spectrum.
| (4) |
where both the first and second terms of the right-hand side are reduced for the EPR state (the same discussion holds for ). For this reason, our method can be interpreted as the use of a quantum correlation between signal and image bands to reduce noise.
Equation (3) shows that two conjugate observables (amplitude and phase) of the beat signal at can be simultaneously measured below the vacuum-noise level, seemingly violating the uncertainty principle. However, this is not the case since our situation can be interpreted as one of the realizations of the quantum dense metrology Steinlechner et al. (2013) by using the EPR state in the frequency domain.
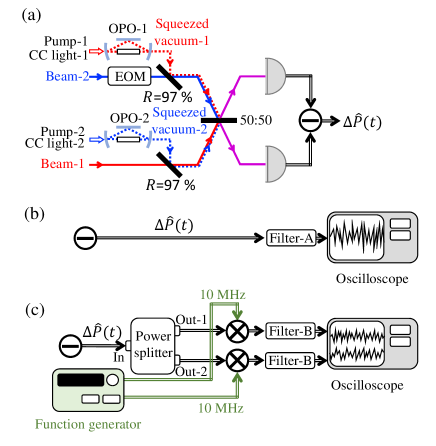
Experimental setup — Figure 2(a) shows our experiental setup. We use a continuous-wave (CW) laser at 1545 nm. The beat frequency is set to 10 MHz and created by the interference of beam-1 and 2, whose frequencies are downshifted by 85 MHz and 75 MHz from that of the source laser, respectively. The power of both beams is set to 0.6 mW before the pickoff beam splitter in order to suppress the unwanted effect of classical phase noise derived from laser line width, etc. while obtaining the measurable shot-noise power See Supplemental Material for further details on the relation between squeezing and quantum correlation, filters used in our experiment, the broad spectra without post-processing, and the demodulated spectra without cross-spectrum. . Beam-2 is phase-modulated at 3.11 MHz by an electro-optic modulator. This modulation mimics the relative-phase signal in the beat-note detection and corresponds to in Eq.(1).
Two squeezed lights are injected at the beam splitters with reflectivity to reduce shot noise in the beat-note detection. These lights are produced by two optical parametric oscillators (OPOs) with a half width at the half maximum of 30 MHz, which sufficiently covers the beat frequency of 10 MHz. The pump beams for the OPOs, pump-1 and 2, are downshifted by MHz and MHz from the second harmonic beam of the source laser and set at 90 mW and 80 mW, respectively. To lock the phase relationship, classical coherent lights are also injected into the OPOs. Such lights are turned off during data acquisition to avoid additional noise by employing the sample-and-hold method Asavanant et al. (2021).
Finally, we detect the beat signal at a photodetector with 60 MHz bandwidth and acquire the signal in two ways as shown in Figs. 2(b) and (c). First, we directly acquire the raw beat signal (Fig. 2(b)) as the simplest setting. In this case, the sum of amplitude and phase noise can be analyzed. Second, we acquire the demodulated signal (Fig. 2(c)) to analyze only phase noise. In this case, a power splitter splits the raw signal into two, which are then separately demodulated by 10-MHz local oscillator signals generated from separate channels of a function generator. Here, the relative phase of the beat and local oscillator signals are adjusted to to retrieve the phase components. We finally take a cross-spectrum of these two demodulated signals to reduce electronic noise Rubiola and Vernotte (2010): we perform the Fourier transform of both signals, compute the product after taking the complex conjugate of one of them, and take its real part. Averaging the cross-spectrum suppresses independent noise generated from electronic components after the power splitter. In the above raw and demodulated measurements, we use an oscilloscope (bandwidth: 1 GHz, sampling rate: 125 MHz) to acquire the data. Several electronic filters are used to exploit the full dynamic range of the oscilloscope See Supplemental Material for further details on the relation between squeezing and quantum correlation, filters used in our experiment, the broad spectra without post-processing, and the demodulated spectra without cross-spectrum. .
Experimental results — As a preliminary measurement, we evaluate the squeezing level of squeezed vacuum-1 (2) using beam-1 (2) as a local oscillator for homodyne detection. During the measurement, beam-2 (1) and squeezed vacuum-2 (1) are blocked. The squeezing level of squeezed vacuum-1 (2) at lower and upper sidebands are 4.5(1) dB and 3.7(1) dB (4.16(8) dB and 4.0(1) dB), respectively. Here, the lower and upper sidebands correspond to the frequency range of MHz around MHz and MHz, respectively. These squeezing levels are limited by the estimated optical loss and the pump power limitation due to the tolerable optical power of acousto-optic modulators for the pump beams. The shot-noise reduction in the beat-note detection should reflect these initial squeezing levels.
Next, the shot-noise reduction in the beat-note detection is evaluated by taking three types of data for both the raw and demodulated measurements. The first is the data of the background electronic noise without any light (background). The second is the data of the unsqueezed shot noise with only beam-1 and beam-2 (reference). The third is the data of the squeezed shot noise with the squeezed lights in addition to beam-1 and beam-2 (target). For each data, we obtain the power spectrum by averaging over 12500 frames of a time-series waveform consisting of 5000 sampling points. In our setting, the power of shot noise to be measured is comparable to that of electronic noise. To analyze the pure noise reduction of shot noise itself, we subtract the power spectrum of electronic noise (background) from those of unsqueezed and squeezed shot noise (reference and target). Then we plot these power spectra after normalizing them by setting the average of the pure unsqueezed-shot-noise level to 0 dB. The details of such post-processing are described in Supplemental Material See Supplemental Material for further details on the relation between squeezing and quantum correlation, filters used in our experiment, the broad spectra without post-processing, and the demodulated spectra without cross-spectrum. .
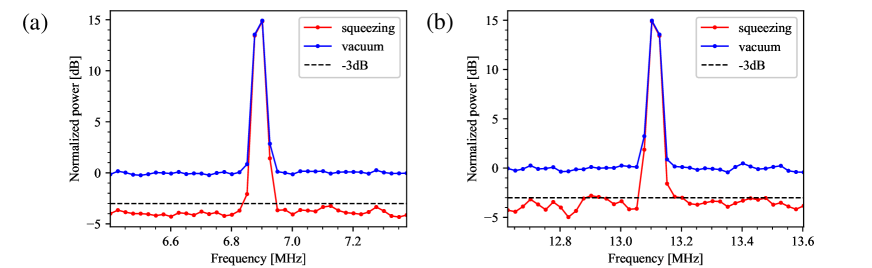
Figure 3 shows the spectra of the raw measurement around the lower and upper sidebands of the 10-MHz beat signal. The phase modulation of beam-2 appears as two sideband peaks at MHz around the 10-MHz beat signal, and the noise floor around these peaks reflects the sum of amplitude and phase noise. In this case, the shot-noise level with squeezed light is reduced by 3.71(4) dB and 3.39(8) dB around the lower and upper sidebands, respectively. Here, the noise levels are calculated by averaging over the frequency range of MHz around the peaks after excluding that of MHz. This result indicates that the reduction in the sum of amplitude and phase noise surpasses the 3-dB noise penalty.
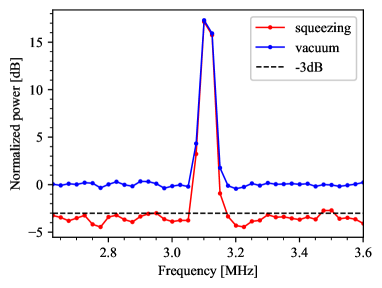
Figure 4 shows the spectra of the demodulated measurement. After the demodulation, two sideband peaks at MHz in Fig. 3 are converted in frequency and appear as a single peak at MHz, and the noise floor around it reflects only phase noise. In this case, the shot-noise level with squeezed light is reduced by 3.35(6) dB. Here, the noise levels are calculated by averaging over the frequency range of MHz around the peak after excluding that of MHz. This result indicates that the reduction in phase noise alone surpasses the 3-dB noise penalty.
Note that the noise-reduction levels expected from the initial squeezing levels of squeezed vacuum-1 and 2 are 4.3 dB (3.8 dB) for the lower (upper) sideband in the raw measurement and 4.1 dB for the demodulated measurement. The actual noise-reduction levels in the raw and demodulated measurements are comparable but slightly smaller than these expected levels. This difference may be attributed to classical phase noise of beam-1 and beam-2 that can be added to shot noise. We estimate that approximately of the shot-noise power in Figs. 3 and 4 can come from classical phase noise. Under this condition, the noise reduction is limited to up to 10 dB even with infinite initial squeezing. This means that our method is more effective for experimental systems and applications where classical noise is sufficiently small compared to shot noise.
Conclusion—We proposed and theoretically proved a method to reduce shot noise in beat-note detection to zero using squeezed light with infinite squeezing level. We also experimentally demonstrated that our method reduced the shot-noise level by more than the extra noise penalty of 3 dB in both raw and demodulated measurements of the beat signal. The noise-level reduction (4 dB) and applicable frequency range (a few tens of MHz) are limited in our specific setup, but can be straightforwardly improved by replacing our squeezers with high-level (up to 15 dB Henning et al. (2016)) or broader-bandwidth (over THz Kashiwazaki et al. (2021)) ones. The beat-note detection in various applications is often limited in shot noise under some optical power constraints, and thus our method is effective for further reducing the noise level. It can be employed in various systems such as high-precision clock comparisons Yamaguchi et al. (2011), frequency measurements in optical frequency combs Endo et al. (2018); Nagano et al. (2009), and space gravitational wave telescopes Izumi and Fujimoto (2021).
Acknowledgements.
This work was partly supported by JSPS KAKENHI Grant Numbers 20H01833, 21K13933, and 21K18593, JST Grant Number JPMJPF2221, JPMJFR223R, and JPMJPR2254, MEXT Leading Initiative for Excellent Young Researchers, the Canon Foundation, UTokyo Foundation, and donations from Nichia Corporation. K. A. acknowledges a financial support from Forefront Physics and Mathematics Program to Drive Transformation (FoPM). M. E. was supported by the Research Foundation for Opto-Science and Technology. The authors thank Takahiro Mitani for the careful proofreading of the manuscript.References
- Yamaguchi et al. (2011) A. Yamaguchi, M. Fujieda, M. Kumagai, H. Hachisu, S. Nagano, Y. Li, T. Ido, T. Takano, M. Takamoto, and H. Katori, Applied Physics Express 4, 082203 (2011).
- Endo et al. (2018) M. Endo, T. D. Shoji, and T. R. Schibli, IEEE Journal of Selected Topics in Quantum Electronics 24, 1102413 (2018).
- Nagano et al. (2009) S. Nagano, H. Ito, Y. Li, K. Matsubara, and M. Hosokawa, Japanese Journal of Applied Physics 48, 042301 (2009).
- Izumi and Fujimoto (2021) K. Izumi and M. K. Fujimoto, Progress of Theoretical and Experimental Physics 2021, 073F01 (2021).
- (5) 2000 LISA: System and Technology Study Report ESA document ESA-SCI.
- Kawamura et al. (2006) S. Kawamura, T. Nakamura, M. Ando, N. Seto, K. Tsubono, K. Numata, R. Takahashi, S. Nagano, T. Ishikawa, M. Musha, et al., Classical and Quantum Gravity 23, S125 (2006).
- Abadie et al. (2011) J. Abadie, B. P. Abbott, R. Abbott, T. D. Abbott, M. Abernathy, C. Adams, R. Adhikari, C. Affeldt, P. Ajith, B. Allen, et al., Nature Physics 7, 962 (2011).
- Chalermsongsak et al. (2015) T. Chalermsongsak, F. Seifert, E. D. Hall, K. Arai, E. K. Gustafson, and R. X. Adhikari, Metrologia 52, 17 (2015).
- Xie and Feng (2018) B. Xie and S. Feng, Optics Letters 43, 6073 (2018).
- Yuen and Chan (1983) H. P. Yuen and V. W. S. Chan, Optics Letters 8, 177 (1983).
- Bond et al. (2016) C. Bond, D. Brown, A. Freise, and K. A. Strain, Living Rev Relativ 19, 3 (2016).
- Taylor et al. (2013) M. A. Taylor, J. Janousek, V. Daria, J. Knittel, B. Hage, H. A. Bachor, and W. P. Bowen, Nature Photonics 7, 229 (2013).
- Casacio et al. (2021) C. A. Casacio, L. S. Madsen, A. Terrasson, M. Waleed, K. Barnscheidt, B. Hage, M. A. Taylor, and W. P. Bowen, Nature 594, 201 (2021).
- Lawrie et al. (2019) B. J. Lawrie, P. D. Lett, A. M. Marino, and R. C. Pooser, ACS Photonics 6, 1307 (2019).
- Troullinou et al. (2021) C. Troullinou, R. Jiménez-MartÃnez, J. Kong, V. G. Lucivero, and M. W. Mitchell, Physical Review Letters 127, 193601 (2021).
- Yonezawa et al. (2012) H. Yonezawa, D. Nakane, T. A. Wheatley, K. Iwasawa, S. Takeda, H. Arao, K. Ohki, K. Tsumura, D. W. Berry, T. C. Ralph, et al., Science 337, 1511 (2012).
- Marino et al. (2007) A. M. Marino, C. R. Stroud, V. Wong, R. S. Bennink, and R. W. Boyd, J. Opt. Soc. Am. B 24, 335 (2007).
- Caves and Schumaker (1985) C. M. Caves and B. L. Schumaker, Physical Review Applied 31, 3068 (1985).
- Einstein et al. (1935) A. Einstein, B. Podolsky, and N. Rosen, Physical Review 47, 777 (1935).
- (20) See Supplemental Material for further details on the relation between squeezing and quantum correlation, filters used in our experiment, the broad spectra without post-processing, and the demodulated spectra without cross-spectrum.
- Steinlechner et al. (2013) S. Steinlechner, J. Bauchrowitz, M. Meinders, H. Müller-Ebhardt, K. Danzmann, and R. Schnabel, Nature Photonics 7, 626 (2013).
- Asavanant et al. (2021) W. Asavanant, B. Charoensombutamon, S. Yokoyama, T. Ebihara, T. Nakamura, R. N. Alexander, M. Endo, J. Yoshikawa, N. C. Menicucci, H. Yonezawa, et al., Physical Review Applied 16, 034005 (2021).
- Rubiola and Vernotte (2010) E. Rubiola and F. Vernotte (2010), URL http://arxiv.org/abs/1003.0113.
- Henning et al. (2016) V. Henning, M. Moritz, D. Karsten, and S. Roman, Physical Review Letters 117, 110801 (2016).
- Kashiwazaki et al. (2021) T. Kashiwazaki, T. Yamashima, N. Takanashi, A. Inoue, T. Umeki, and A. Furusawa, Applied Physics Letters 119, 251104 (2021).