A Wide View of the Galactic Globular Cluster NGC 2808: Red Giant and Horizontal Branch Star Spatial Distributions
Abstract
Wide-field and deep DECam multi-band photometry, combined with HST data for the core of the Galactic globular cluster NGC 2808, allowed us to study the distribution of various stellar sub-populations and stars in different evolutionary phases out to the cluster tidal radius. We used the index to identify three chemically distinct sub-populations along the red giant branch and compared their spatial distributions. The most light-element enriched sub-population (P3) is more centrally concentrated; however, it shows a more extended distribution in the external regions of the cluster compared to the primordial (P1) and intermediate (P2) composition populations. Furthermore, the P3 sub-population centroid is off-center relative to those of the P1 and P2 groups. We also analyzed the spatial distribution of horizontal branch stars and found that the relative fraction of red horizontal branch stars increases for radial distances larger than 1.5′while that of the blue and hotter stars decreases. These new observations, combined with literature spectroscopic measurements, suggest that the red horizontal branch stars are the progeny of all the stellar sub-populations in NGC 2808, i.e. primordial and light-element enhanced, while the blue stars are possibly the result of a combination of the ”hot-flasher” and the ”helium-enhanced” scenarios. A similar distribution of different red giant branch sub-populations and horizontal branch stars was also found for the most massive Galactic globular cluster, Cen, based on combined DECam and HST data, which suggests the two may share a similar origin.
1 Introduction
NGC 2808 is one of the most massive ( = 8.5 , McLaughlin & van der Marel 2005) Galactic globular clusters (GGC) and a very peculiar object. Hubble Space Telescope (HST) photometric investigations revealed that the cluster main-sequence (MS) splits into a blue, an intermediate, and a red sequence. Furthermore, NGC 2808 shows an extended horizontal branch (HB) with distinct components: a red HB (RHB) and a blue tail divided into three groups (Sosin et al., 1997; Bedin et al., 2000). Therefore, it was suggested that NGC 2808 experienced multiple episodes of star formation, each with varying levels of helium enrichment and with the bluest MS representing the most enhanced population (Piotto et al., 2007; Milone et al., 2012, 2015a). The helium enrichment could also explain the observed HB morphology (D’Antona & Caloi, 2004; D’Antona et al., 2005; Lee et al., 2005). Table 1 summarizes the basic properties of NGC 2808.
High-resolution spectroscopic measurements of 140 red giant branch (RGB) stars in the cluster indicate that, while expected in the case of different star formation episodes, no spread in iron content is present in NGC 2808 ( = 1.1920.0040.034, Carretta 2015). This already puzzling picture is complicated by the fact that the RGB evolutionary phase splits into five stellar populations with different light-element abundances (Carretta, 2015).
Iannicola et al. (2009) combined HST and ground-based data covering a field-of-view (FoV) of 15′15′ centered on NGC 2808 to show that the relative fraction of cool (red) and hot (blue tail) HB stars is constant from the center to the outskirts of the cluster. This result supports the lack of radial differentiation among NGC 2808 stellar populations with possible distinct helium abundances. On the other hand, Simioni et al. (2016) showed that the intermediate and blue MS stars in NGC 2808, supposedly more helium-enhanced, are more centrally concentrated compared to red MS stars, at least out to radial distances of 8 (1/3 of the tidal radius).
A proper motion study based on HST data from Bellini et al. (2015) showed that the three MSs in NGC 2808 also have different kinematic behavior. At the outermost distance probed, r 1.5′, the velocity distribution of the intermediate and the blue MS stars is radially anisotropic, but it is isotropic for the stars belonging to the red MS. These findings might indicate the diffusion towards the cluster outskirts of the supposedly helium-enhanced populations, initially more concentrated. According to model predictions of the formation of GGCs with multiple stellar populations, the second generation of stars should form in the inner regions (D’Ercole et al., 2008; Bastian et al., 2013): GGCs with a long relaxation time, such as NGC 2808 and Cen, should still show remnants of this initial spatial segregation.
A consensus on the origin of the different stellar sub-populations in NGC 2808 has not yet been reached. All previous investigations are based either on data for a few small fields across the center of the cluster (HST) or for a FoV covering about half the tidal radius (ground). There is now the need for a deep photometric study covering the entire cluster (tidal radius r 22′, see Table 1, de Boer et al. 2019), with the precision necessary to enable the identification of the different RGB and HB groups.
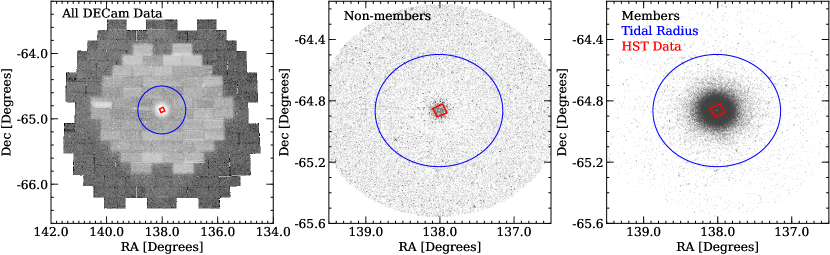
In order to achieve this goal, we combined HST data for the core with deep DECam photometry for NGC 2808. DECam is a wide-field imager covering a 3 square degree sky FoV (Fig. 1). The high photometric quality and wide field covered by the combined DECam + HST photometric catalogs enables us to identify different RGB groups and to study their spatial distribution from the center to the cluster tidal radius. We also analyzed the distribution of red and blue HB stars and compared it to that of RGB, AGB, and MS stars.
Therefore, DECam photometry of NGC 2808 allowed us for the first time to investigate the spatial distribution of the different RGB sub-populations and different evolutionary phases from the core to the tidal radius, and to discover their peculiarities.
| Parameter | Ref.aaReferences: 1) Gaia Collaboration et al. (2018); 2) Vasiliev & Baumgardt (2021); 3) Harris (2010); 4) Trager et al. (1995); 5) de Boer et al. (2019) ; 6) McLaughlin & van der Marel (2005) ; 7) Schlafly & Finkbeiner (2011) a Total Visual magnitude. b Core radius. c Half-mass radius. d Tidal radius. e Log of relaxation time. f Reddening. g True distance modulus. | |
|---|---|---|
| (J2000) | 138.0071 | 1 |
| (J2000) | -64.8645 | 1 |
| (2015) | 0.9940.024 | 2 |
| (2015) | 0.2730.024 | 2 |
| (mag)aaReferences: 1) Gaia Collaboration et al. (2018); 2) Vasiliev & Baumgardt (2021); 3) Harris (2010); 4) Trager et al. (1995); 5) de Boer et al. (2019) ; 6) McLaughlin & van der Marel (2005) ; 7) Schlafly & Finkbeiner (2011) a Total Visual magnitude. b Core radius. c Half-mass radius. d Tidal radius. e Log of relaxation time. f Reddening. g True distance modulus. | -9.4 | 3 |
| (arcmin)bbStar counts based on DECam data. | 0.26 | 4 |
| (arcmin)ccfootnotemark: | 0.86 | 5 |
| (arcmin)ddfootnotemark: | 21.97 | 5 |
| eefootnotemark: | 8.9 | 6 |
| fffootnotemark: | 0.190.03 | 7 |
| (mag)ggfootnotemark: | 15.05 | 3 |
2 Observations and Data Analysis
We collected a set of 207 DECam images for NGC 2808 with NOAO proposals 2014A-0327, 2014B-0378, 2015B-0307, 2016A-0189, 2016A-0191, 2016B-0301, and 2017B-0279 (PI: Rest). In particular, we observed a couple of dozen deep ( = 600s) -band images in good observing conditions in January 2018, reaching a full-width half maximum of 1-1.2″ on the images. The -band photometry, which is sensitive to both effective temperature and metallicity, is critical for the color-color-magnitude method used here to separate cluster and field stars (Calamida et al., 2017, 2020). Moreover, the filter is also fundamental to define the index (Monelli et al., 2013) that we use to separate RGB stars with different light element abundances.
A set of standard fields from SDSS Stripe82 were also observed each night utilizing 15s exposures for the -bands and 30s exposures for the -band. A total of 36 Stripe 82 images were obtained at varying air masses for each filter. These data were used to transform the instrumental magnitudes onto the DECam natural system (see Section 2.1).
A small number of additional, deep DECam exposures of NGC 2808 were also downloaded from the NOIRLab Astro Data Archive111The NOIRLab Astro Data Archive can be accessed at: https://astroarchive.noirlab.edu/. to supplement the data described above. These included 5 -band images from program 2013B-0615 (PI: Carballo-Bello) ranging between 200-300s of integration, 4 -band images from program 2013A-9999 (PI: Walker), each with 200s of integration, and 12 -band images from program 2012B-0001 (PI: Frieman) spanning 200-500s of integration. Typical seeing was 1 for the 2013A-9999 data, 1.5 for the 2013B-0615 data, and 1.1 for the 2012B-0001 data.
We did not download any accompanying standard fields for the archival data, and instead transferred the photometric calibration from our fields onto the archival data using stars in common between both sets. A log of all observations is presented in Table 2.
| File | Obs. Date | Proposal | PI | Filter | Exp. Time | RA | DEC | Seeing | Airmass |
|---|---|---|---|---|---|---|---|---|---|
| (sec) | (degrees) | (degrees) | (arc sec.) | ||||||
| c4d_160303_050811_ooi_i_v1 | 2016-03-03 | 2016A-0189 | Rest | i | 15 | 8:43:00.77 | 0:00:02.3 | 1.122 | 1.430 |
| c4d_160303_050856_ooi_r_v1 | 2016-03-03 | 2016A-0189 | Rest | r | 15 | 8:43:00.50 | 0:00:05.4 | 1.281 | 1.430 |
| c4d_160303_050941_ooi_g_v1 | 2016-03-03 | 2016A-0189 | Rest | g | 15 | 8:43:00.69 | 0:00:01.8 | 1.459 | 1.440 |
| c4d_160303_051040_ooi_u_v1 | 2016-03-03 | 2016A-0189 | Rest | u | 30 | 8:43:00.83 | 0:00:06.4 | 1.604 | 1.440 |
| c4d_160303_052102_ooi_r_v1 | 2016-03-03 | 2016A-0189 | Rest | r | 15 | 14:42:00.34 | -0:04:27.7 | 1.267 | 1.800 |
| c4d_160303_052144_ooi_i_v1 | 2016-03-03 | 2016A-0189 | Rest | i | 15 | 14:42:00.03 | -0:04:28.3 | 1.105 | 1.800 |
| c4d_160303_052227_ooi_g_v1 | 2016-03-03 | 2016A-0189 | Rest | g | 15 | 14:42:00.22 | -0:04:24.2 | 1.404 | 1.790 |
| c4d_160303_052326_ooi_u_v1 | 2016-03-03 | 2016A-0189 | Rest | u | 30 | 14:42:00.14 | -0:04:24.9 | 1.469 | 1.780 |
| The full version of this table is provided in electronic form. | |||||||||
We also downloaded an HST catalog for NGC 2808 from the ”Hubble Space telescope UV legacy survey of galactic globular clusters” (Piotto et al., 2015; Nardiello et al., 2018, GO13297, PI: Piotto). This catalog includes photometry collected with the Wide Field Camera 3 (WFC3) blue filters and combined with ACS photometry in and by Sarajedini et al. (2007), and covers the central 1-2 of NGC 2808222The HST data can be obtained from the Mikulski Archive for Space Telescopes (MAST) at the Space Telescope Science Institute by using: http://dx.doi.org/10.17909/18ex-q697 (catalog DOI: 10.17909/18ex-q697)..
The left panel of Fig. 1 shows a density map of all DECam fields used in this project, and indicates that the exposures extend well beyond the cluster tidal radius. However, the middle and right panels show that the DECam observations have a hole near the cluster core due to the extreme crowding. Fortunately, this region is completely covered by the HST observations, which include both the ultra-violet (UV) bands necessary for identifying stars with different light element abundances and the very high spatial resolution required to separate and photometer stars in the cluster core.
2.1 Photometry Pipeline, Calibration, and Catalog Preparation
The pipeline for generating intermediate catalogs with photometry, astrometry, errors, and associated quality flags closely followed the methods outlined in Johnson et al. (2020). To briefly summarize, the full focal plane DECam images, which were pre-processed with the DECam Community Pipeline (Valdes et al., 2014), were separated into individual CCD files, and then further partitioned based on filter, data set origin, and science/calibration status. All exposures were processed independently with DAOPHOTIV/ALLSTAR (Stetson, 1987) on the science servers at the Space Telescope Science Institute, using an ”embarrassingly parallel” code implementation. Both the science and calibration exposures were processed using quadratically varying point spread functions (PSF) along with a minimum of 25 and 10 PSF reference stars, respectively. Three ”fit and subtract” loops were run on each exposure to identify additional faint stars and those in highly crowded fields.
A final processing step subtracted all photometered objects from each exposure except the bright and relatively isolated stars used for PSF fitting. DAOPHOT’s aperture photometry routine was run on these objects, in the subtracted images only, using a set of 12 sky apertures ranging from about 3 to 40 pixels in radius. The aperture photometry tables were then used to calculate growth-curves via the DAOGROW algorithm from Stetson (1990), and the resulting aperture corrections were applied to the PSF photometry values in all images.
The -band was selected as the astrometric filter since it was observed every night and is in the middle of the wavelength range spanned by our observations. Following the methods outlined in Johnson et al. (2020, see their Section 3.3.1), we combined all of the -band positions into a single table and generated a catalog of unique sources. Using a search threshold of 1, all objects detected in other bands were mapped onto the unique source table. The final list of unique sources totaled approximately 2106 objects. A database was then created that linked all exposure and metadata (e.g., observation date, airmass, etc.) for each unique object so that the photometry could be merged.
Before merging the photometry, one exposure in each band was selected to serve as the zero-point reference frame. We only selected references frames taken on the same nights as our SDSS Stripe 82 calibration fields. Median offset values were calculated between the reference frames and all other exposures of the same band using overlapping stars with magnitudes ranging from 14-18, after applying the necessary airmass corrections. Mean () image-to-image zero-point offsets for the bands relative to the adopted reference frames were: 0.008 (0.024), 0.005 (0.018), 0.007 (0.017), 0.002 (0.015), and 0.014 (0.017), respectively. With all of the data now on the same internal zero-point, the magnitude measurements and errors were combined for each filter via a weighted mean. The weights were determined by the inverse variance returned by DAOPHOT.
The absolute calibration for each filter was determined by comparing the SDSS Stripe 82 magnitudes measured here against a reference set converted onto the natural DECam system following the procedure described in Calamida et al. (2017). As a result, we only needed to calculate and apply a constant offset value for each band and could ignore color corrections. The accuracy of the calibration is 5% for the bluer filters () and 3% for the redder filters ().
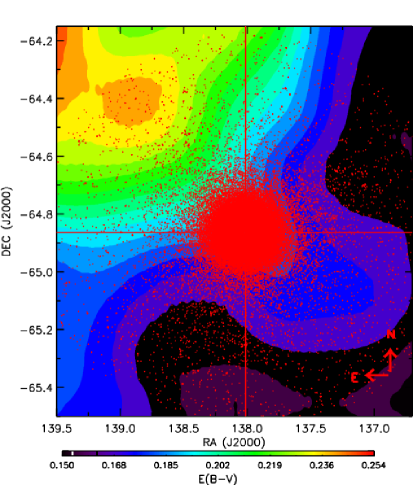
Although NGC 2808 is mildly affected by reddening along the line-of-sight (Bedin et al., 2000, E(B-V) 0.2), the differential reddening is relatively small across our FoV. Fig. 2 shows a reddening map for the FoV towards NGC 2808 based on the extinction values provided by Schlafly & Finkbeiner (2011). Cluster stars are overplotted as red dots in the plot. The figure shows that reddening is quite homogeneous for the central part of the cluster, while it may vary towards the outskirts. In particular, extinction seems slightly higher on the North–East quadrant of the FoV and lower in the South–West one. However, these regions are at and beyond the nominal tidal radius of NGC 2808 (22′) and only include very few cluster stars ( 1 %). Moreover, the extinction for the entire 1.51.5 degree FoV is on average 0.18 mag with a dispersion of 0.03 mag. We also compared these reddening values with those from Gaia DR3 towards the FoV of NGC 2808 and obtained very similar results. Therefore, we did not apply any correction for differential reddening to our photometric catalog.
The final DECam photometric catalog includes 1,990,974 objects measured in the FoV. The largest number of stars was detected in the reddest filter (; ), and the fewest stars were measured in the filter (). The photometric catalog reaches a depth of 21.5 mag with a signal-to-noise ratio () of 50. If we limit the photometry to observations including the filter, the depth is 21 mag with 70.
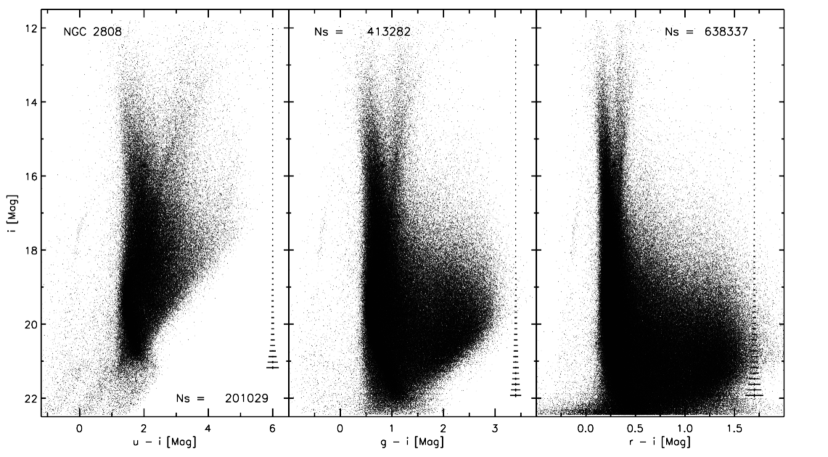
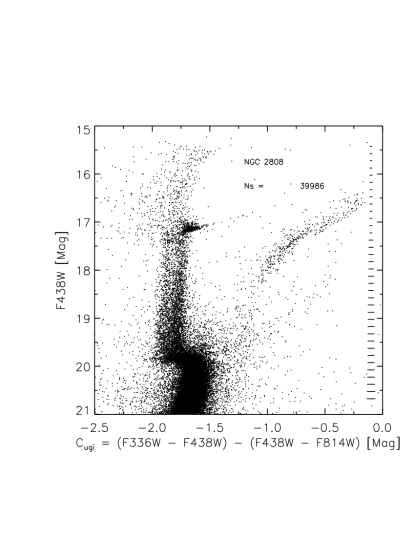
Fig. 3 shows the , the and the color-magnitude diagrams (CMDs) for the entire sample of stars observed with DECam towards NGC 2808. The catalog was filtered by photometric accuracy, and 70% of the best measured stars are plotted. Stars were also filtered by radial distance, to avoid the crowded regions of the cluster center, 1.5′. The number of selected stars for each CMD is labeled in the figure.
Fig. 3 clearly shows that NGC 2808 CMDs are strongly contaminated by field stars. However, some cluster evolutionary sequences are detectable, such as the HB for 16 18.5 and 0.5 mag, and the RGB for 12.0 16.0 and 1.4 2.5 mag. On the other hand, the lower part of the RGB, the main-sequence turn-off (MSTO), and the lower MS are completely mixed with field stars. Gaia DR3 (Gaia collaboration et al. 2022) proper motion data for NGC 2808 are not complete in the more central cluster regions and they have a limiting magnitude of 21, which is only 1 mag below the MSTO. Therefore, to separate the cluster and field components, we used the same approach devised by Calamida et al. (2017, 2020). Briefly, we took advantage of the -band observations to create a color-color-magnitude plane, vs vs , which better separates cluster and field stars due to their different metallicities and gravities. We utilized an iterative procedure to select 74,262 candidate NGC 2808 member stars with at least one measurement in the and filters. The final cleaned catalog has 36,826 candidate cluster members with at least one measurement in all filters, , and the CMDs are shown in Fig. 4.
To verify the accuracy of our selection of cluster and field stars, we took advantage of Gaia DR3 data for the brighter portion of the photometric catalog. By matching using a radius of 0.5″we found 12,702 stars in common with a DECam measurement in all filters and proper motion measurement from Gaia. We then used the proper motion plane to estimate how many stars might have been misidentified by our method as cluster stars. Gaia proper motion for NGC 2808 is = 0.9940.024 and = 0.2730.024 mas/yr (Vasiliev & Baumgardt, 2021) and we selected as candidate cluster members stars with -4 5 and -4 5 mas/yr. Of the 12,702 stars selected as NGC 2808 members with our color-color-magnitude method and in common with Gaia, 1,139 are field stars according to proper motions, i.e. 9%. We repeated the same procedure for stars selected as field members from the color selection and less than 1% are candidate cluster stars according to proper motions.
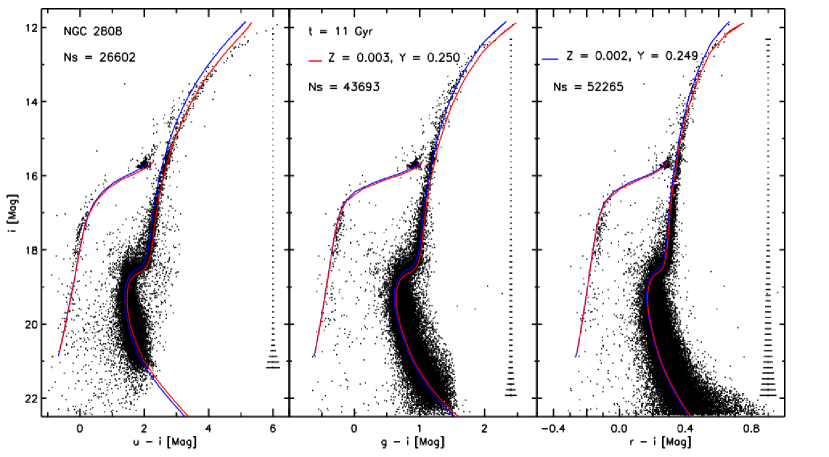
The clean sample of NGC 2808 stars is shown on the , the and the CMDs of Fig. 4. All the cluster sequences are clearly visible now, including the HB, divided into a RHB, clustering at 15.8 mag, and a blue HB, extending down to 20.5 mag. The MSTO is at 19 mag and the RGB extends from its base at 18 up to 12.5 mag. The RGB bump is also visible at 15.5 mag.
In order to verify the accuracy of our photometric calibration, we compared the clean DECam CMD of NGC 2808 with models. We used two -enhanced BASTI333http://basti-iac.oa-abruzzo.inaf.it/index.html isochrones for the same age, t 11 Gyr, two different metallicities, namely Z 0.002 (blue solid line) and 0.003 (red), and two Zero-Age Horizontal Branch (ZAHB) tracks (Pietrinferni et al., 2021). These metallicity values, -1.2 -1.0, bracket the iron abundance estimate from Carretta (2015). As a distance modulus we used 15.05 mag and reddening 0.185 (Schlafly & Finkbeiner, 2011). This reddening value was converted into extinction in the DECam filters by using the Cardelli et al. (1989) reddening law and the available DECam filter throughputs444Information about the DECam filter throughputs can be found at: https://noirlab.edu/science/programs/ctio/filters/Dark-Energy-Camera.. We obtained 0.63 and 2.65, 1.70, and 0.65.
Fig. 4 shows that the agreement between theory and observations is very good over the entire magnitude range in all the three CMDs. The two isochrones bracket the NGC 2808 RGB and closely fit the MSTO, while the ZAHB models reproduce the HB from the red HB down to the blue tail.
3 Gaussian Mixture Models
We identify multiple stellar populations (MSPs) in NGC 2808 by fitting Gaussian mixture models (GMMs) to the distribution of the color index of RGB stars. Color indices involving blue or ultra-violet filters, e.g., = ()(), and the HST equivalent = ()(), are effective diagnostics for separating multiple stellar populations because they are sensitive to light element abundance variations. For example, star-to-star variations in abundance are correlated with a spread in the color since -poor stars are bluer in and redder in , similar to and (Lardo et al., 2011; Monelli et al., 2013). Sample CMDs using the DECam and HST observations are shown in Fig. 5, which highlights that both data sets produce multiple distinct RGB sequences.

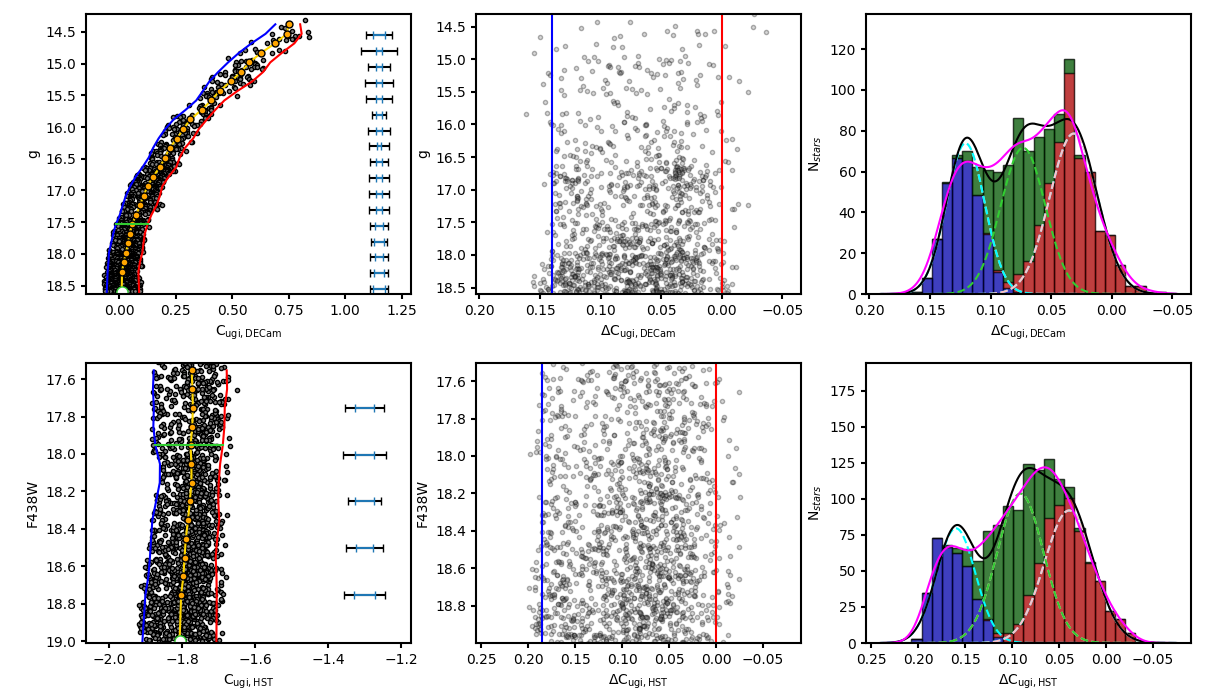
In order to construct the color distribution in the index, it is necessary to first rectify the RGB since the color distribution we are interested in should not include a contribution from the shape of the RGB. The color offset for each star is computed following the equation from Milone et al. (2017):
| (1) |
which is the RGB-width-scaled offset from the red edge of the RGB, where , and the ”fiducial R” and ”fiducial B” correspond to the red and blue fiducial curves. is the width of the RGB measured one magnitude brighter than the faintest RGB star. We determined the red and blue fiducial curves by evenly dividing the RGB into equal-width magnitude bins, and in each bin computing the 4th and 96th percentiles in color. The rectification procedure is summarized schematically in the left and center panels of Fig. 6.
Stars inside and outside of r = 1.5 were analyzed separately using HST and DECam photometry, respectively. Inner cluster stars were selected to have and . The outer cluster stars were selected to have and . In both cases, we cut stars with photometric errors 3 above the median photometric error, and rejected stars with membership probabilities lower than 90%.
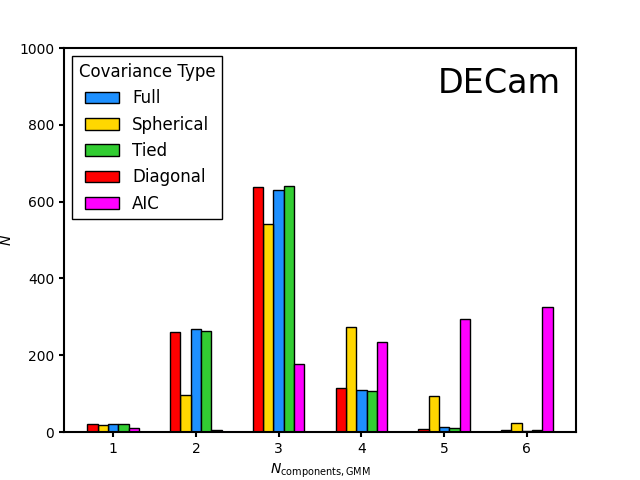
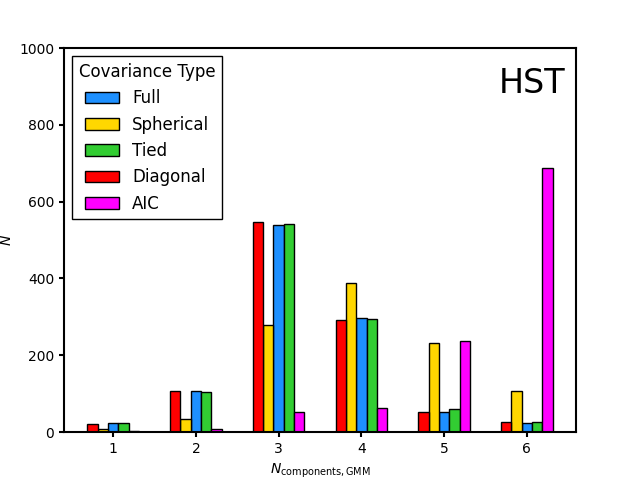
We estimated the number of sequences along the RGB using a Monte Carlo (MC) approach where GMMs are repeatedly fit to the color distribution. At each iteration, we randomize the stellar magnitudes according to the photometric errors in each band. We also iterate over different magnitude bin widths () and the number of sigma clips to the RGB (). The MC simulation resulted in 1000 realizations of the distribution. For each realization, the best of six GMMs (with = 1–6) was determined using the Bayesian Information Criterion (BIC), which is similar to the goodness of fit statistic, but includes a term that penalizes for overfitting. The most frequently occurring value of was taken as our estimate for the number of sequences along the RGB. This procedure was done separately for stars inside 1.5 (using HST photometry), and for stars outside 1.5 (using DECam photometry). Fig. 7 shows that for both data sets we find the three-component GMMs best fit the data.
Population tagging of RGB stars was done using component membership probabilities assigned to the stars according to the best-fitting GMM. The probability that the star is a member of the mixture component () was estimated using the measured value of as input to the probability mass function for the component: . The rightmost panels of Fig. 6 show the distribution for RGB stars inside (bottom) and outside (top) r = 1.5, with the best-fitting GMM overlaid. The HST and DECam photometric decompositions were made using magnitude bins with a width of 0.1 mag. For the HST data, we clipped stars in each bin with colors , while for the DECam data we clipped stars with colors .
4 Literature Comparison
4.1 Stellar sub-population definitions
Although multiple chemically distinct groups have been found in NGC 2808, the nomenclature, separation of stars, and number of groups identified depends strongly on the data and analysis methods. For example, Piotto et al. (2007) identified three MSs with different helium abundances via HST photometry and referred to these populations as ”rMS”, ”mMS”, and ”bMS”. However, Latour et al. (2019) used a combination of HST photometry and MUSE/VLT (ESO) spectroscopy to identify four RGB populations (P1, P2, P3, and P4), while Hong et al. (2021) used CN, CH, and Ca HK spectral indices to also find four RGB groups (G1, G2, G3, and G4). Furthermore, Carretta (2015) used various light element abundance ratios to separate NGC 2808 stars into five groups (P1, P2, I1, I2, and E), and Milone et al. (2015b) used HST ”chromosome maps” to identify five slightly different populations (A, B, C, D, and E).
More recently, Valle et al. (2022) used robust statistical methods to identify the different stellar populations in NGC 2808 by combining the high-resolution spectroscopy of Carretta (2015) and the low-resolution spectroscopy of Hong et al. (2021), and found only two groups along the cluster RGB, further complicating matters.
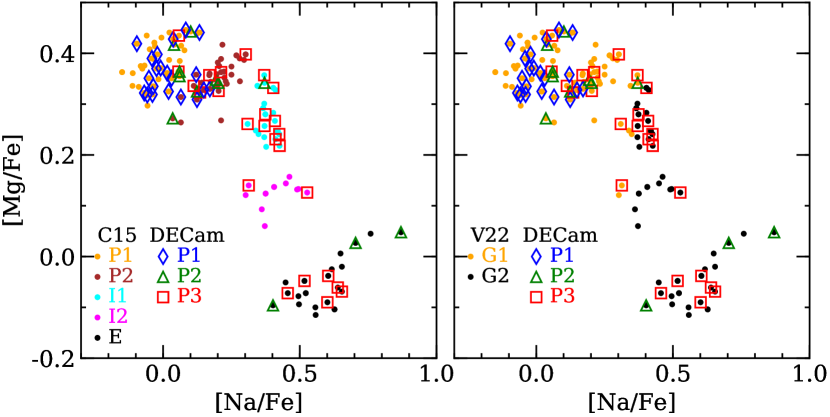
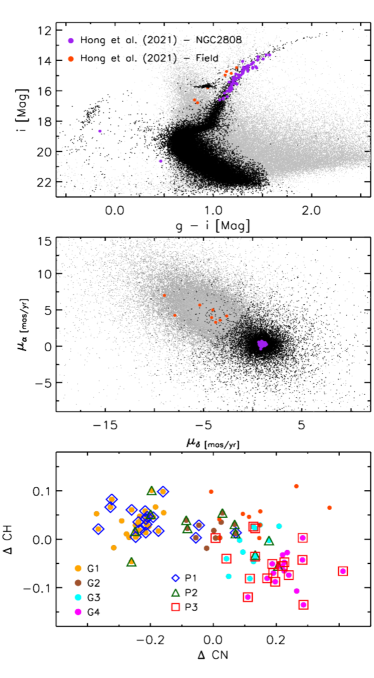
Table 1 of D’Antona et al. (2016) provides an approximate mapping between the Carretta (2015) and Milone et al. (2015b) groups, but the connection to similar nomenclature in other works is not straightforward.
Our GMM grouping algorithm identified three populations as the optimal number, regardless of whether the (ground-based) or (space-based) data were used. We label these three populations as the P1, P2, and P3 groups, which correspond to stars having ”primordial”, ”intermediate”, and ”extreme” chemical compositions. The P1, P2, and P3 populations constitute 31, 38, and 31 of our total RGB sample (3060 stars), respectively. We compared our designations against those of Carretta (2015), Valle et al. (2022), and Hong et al. (2021) in Figs. 8-9, and correlated our populations with those found in Latour et al. (2019) in Fig. 10.
4.2 Stellar sub-population matching
First, comparing our populations against those of Carretta (2015) in Fig. 8, we found that the strongest correlation is between the ”primordial” (P1) groups of both studies. For example, using the stars in common between the two studies we found that 76 (16/21) of our P1 stars overlap with the P1C15 population, the remaining 24 align with the adjacent P2C15 group, and none align with the I1C15, P2C15, or EC15 groups. However, the correlations become more complicated for the enriched populations. Our P2 group, which is more chemically enhanced (lower ; higher ) than the P1 group, mildly overlaps with the P1C15, P2C15, I1C15, and EC15 groups. Similarly, our P3 group overlaps with 25 stars in the Carretta (2015) sample, and these stars are distributed as 8 (2), 24 (6), 36 (9), 8 (2), and 24 (6) in the P1C15, P2C15, I1C15, I2C15, and EC15 populations, respectively. Therefore, we can align our P1 group with the P1C15 population with high confidence, and consider our P2P3 groups to be a combination of the P2C15, I1C15, I2C15, and EC15 populations from Carretta (2015). We note that the poor correlation between and the Carretta (2015) designations, particularly for more enriched stars, is due to the latter work targeting primarily cool, bright RGB stars. Fig. 5 shows that the color separation in is more narrow for stars significantly brighter than the RGB-bump, and also that AGB confusion increases for bright giants.
The right panel of Fig. 8 shows that the correlations are somewhat stronger when adopting the 2 population model from Valle et al. (2022). In this scenario, the Group 1 population from Valle et al. (2022) contains 100 of our overlapping P1 population, 75 of our P2 stars, and 44 of our P3 group while their Group 2 population is almost entirely composed (83; 15/18) of our most chemically enriched P3 stars. Combining the information from both panels of Fig. 8 suggests that the color is highly sensitive for separating primordial and ”second generation” stars from each other, but that more nuanced separations with only these filters are difficult when analyzing only bright RGB stars. Therefore, a comparison between our population separation and that of Hong et al. (2021), which observed warmer stars, may provide more information about how the color separation correlates with populations identified via spectroscopy.
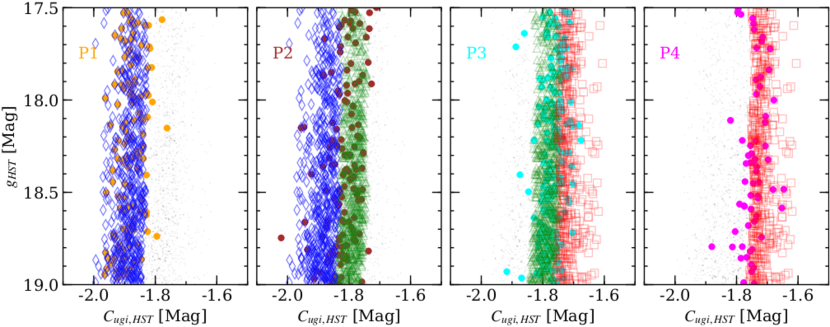
Fig. 9 plots 82 stars in common between the present study and Hong et al. (2021) in the vs plane. We found a good correspondence between the photometry and spectroscopic populations, and a significantly reduced scatter compared to the results shown in Fig. 8 for the brighter sample from Carretta (2015). We found that 83 (15/18) of the stars identified as belonging to the P1 group from photometry align with the G1 group from Hong et al. (2021) with the remaining 3 stars overlapping with the G2 group. Similarly, 94 (17/18) of our P3 stars align with the G3 and G4 populations from Hong et al. (2021). Our P2 population has the largest overlap (42; 5/12 stars) with the G2 group, but also has a handful of stars in the G1 (33; 4/12), G3 (17; 2/12), and G4 (8; 1/12) groups. Therefore, we can associate our P1 and P2 populations with those of the G1 and G2 groups from Hong et al. (2021), and also find that their G3 and G4 groups combine to match our P3 population.
The top and middle panels of Fig. 9 also validate our membership selection procedure for NGC 2808. In these panels, the black and grey circles indicate cluster members and field stars separated using our color-color-magnitude selection, respectively, while the purple and red symbols show stars from Hong et al. (2021) that are cluster members and field stars using the same criteria. The purple circles are located along NGC 2808’s RGB sequence, as expected, and the red dots overlap with field stars. In the proper motion plane (middle panel), the purple circles overlap with the cluster stars while the red circles are clearly offset with the field stars. When the handful of field stars are identified in the CH-CN plane (bottom panel), it becomes clear that these stars cause an artificial enhancement in the scatter of the nominal anti-correlation. Two of the targets from Hong et al. (2021) are members according to their proper motions, but are clearly offset from the cluster sequence. We suspect that these two stars were misidentified in the cross-match and have been removed from the analysis.
Finally, Fig. 10 shows that we found a similar correlation between the populations identified here and those found by Latour et al. (2019), which used the same data but included the filter. Our P1 group is strongly correlated with the P1L19 population, and in general our P2 group aligns well with the P2L19 stars. However, we found some mild overlap between our P2 group and the P3L19 stars. Similarly, our P3 population matches a combination of the P3L19 and P4L19 groups. Therefore, we found a similar result when comparing with Latour et al. (2019) as with Hong et al. (2021) where our P1 group aligns with the P1L19 stars, our P2 group matches the P2L19 group, and our P3 population aligns with a combination of the P3L19 and P4L19 groups.
A summary of the mapping between our three HST and DECam populations and the various groups identified by Carretta (2015), Latour et al. (2019), Hong et al. (2021), and Valle et al. (2022) is provided in Table 3. In the next section, we will examine the radial profiles of the groups listed in this table and investigate differences in their distributions.
5 Radial Distributions
As noted previously, Carretta (2015) used high-resolution spectroscopy to divide a sample of 140 NGC 2808 RGB stars into five stellar populations (labeled P1C15, P2C15, I1C15, I2C15, and EC15 in Section 4.1). The data were further partitioned into three main groups: primordial (P), intermediate (I), and extreme (E), which aligned with the dominant populations identified in Carretta et al. (2009). When the radial distributions of the three main groups were analyzed, the author found that the combined I + E populations were more centrally concentrated than the P group, at least for distances between 1 and 5 from the cluster center, which is nominally in agreement with the cluster formation model described in D’Ercole et al. (2008). However, Carretta (2015) noted that their sample size was too small to draw any firm conclusions regarding radial distance variations between sub-populations.
Simioni et al. (2016) used WFC3 + ACS imaging on HST to photometrically separate the three dominant MS groups, which likely trace populations with different helium abundances (Piotto et al., 2007). The authors found that the blue (most extreme/He-rich) MS is the most centrally concentrated while the middle MS stars are more concentrated than the red MS but less concentrated than the blue MS. Related to this work, Bellini et al. (2015) measured proper motions for a sample of NGC 2808 MS stars using ACS on HST and found no differences in velocity dispersion for the various MS populations as a function of radial distance. However, their primordial MS groups (B and C) are nearly isotropic while the more enriched populations (D and E) are radially anisotropic; these most enriched stars also have smaller tangential velocity dispersions.
Bellini et al. (2015) showed that the strongest deviations from isotropy are in the outer parts of the cluster (for distances larger than 2 rh). Furthermore, the authors provide a simulation that demonstrates how enriched stars that are initially more centrally concentrated disperse with time on preferentially radial orbits (see also Mastrobuono-Battisti & Perets, 2013; Hénault-Brunet et al., 2015; Mastrobuono-Battisti & Perets, 2016). As a result, many enriched stars that are now in the outer parts of the cluster may have initially formed in the core and dispersed outward, and thus a cluster’s various sub-populations may have different kinematic and radial density profiles. As long as a cluster’s dynamical evolution is not too advanced, kinematic and radial density differences between primoridal and enriched stars may still be observable after a Hubble time (e.g., Vesperini et al., 2013; Mastrobuono-Battisti & Perets, 2016; Vesperini et al., 2021; Tiongco et al., 2022).
NGC 2808 has a multi-modal HB, as shown by different ground- and space-based photometric investigations, with a RHB and a blue tail divided in three groups (Sosin et al., 1997; Bedin et al., 2000; Castellani et al., 2006; Iannicola et al., 2009). The origin of this multi-modal HB has been attributed to different ”second” parameters, such as age, mass loss along the RGB due to rotation or binarity, the ”hot-flasher” scenario, and/or to helium enrichment (D’Cruz et al., 1996; Sweigart & Catelan, 1998; Catelan et al., 1998; Brown et al., 2001; Moehler et al., 2004; D’Antona et al., 2005; Lee et al., 2005; Castellani et al., 2006).
Walker (1999) and Bedin et al. (2000) used ground-based photometry of NGC 2808 to study the radial distribution of the different groups of HB stars and found no gradient across most (4-6′) of the cluster body (note that NGC 2808 tidal radius is 22′, see Table 1). However, a subsequent investigation based on UV HST photometry by Castellani et al. (2006) found a radial trend in the ratio of HB stars to the number of RGB stars brighter than the Zero-Age-Horizontal-Branch (ZAHB) luminosity level, the so-called parameter. In particular, this ratio increases from the expected value of 1.4 (Cassisi et al., 2003; Zoccali et al., 2000) in the cluster center to 1.7 at 2′ distance. They propose different hypothesis for the extended distribution of the HB stars, such as high intensity mass loss along the RGB producing ”blue hook” HB stars through the ”hot-flasher” scenario, and/or a dynamical origin. Note that their HST data set do not cover radial distances larger than 2′.
Sohn et al. (1998) found a color gradient when analyzing ground-based photometric observations of NGC 2808, with the central regions ( 70″) being redder than the outskirt. As an explanation, they proposed an excess of RGB stars in the cluster core. On the other hand, Sandquist & Martel (2007) showed that NGC 2808 has a paucity of bright RGB stars compared to model predictions, possibly confirming a larger mass loss during this evolutionary phase, with a delayed or missed helium flash.
Furthermore, Iannicola et al. (2009) confirmed a flat radial distribution of HB stars in NGC 2808, as previously found by Walker (1999) and Bedin et al. (2000), based on HST and ground-based photometry of the cluster. They also found that the parameter increases towards the outskirt of the cluster, and they explain this with a decrease of bright RGBs in these regions. However, their result might be hampered by the contamination of field stars that could artificially increase the number of RHB stars.
All the aforementioned results on the spatial distribution of the different RGB sub-populations and multiple HBs in NGC 2808 are based on heterogeneous photometric catalogs limited to radial distances less than 4′. Our deep and precise combined DECam + HST photometric catalog will now allow us to perform a thorough analysis of the radial distribution of the three different stellar sub-populations we identified on the RGB and the multiple HBs across the entire extent of NGC 2808.
5.1 RGB stars
The RGB radial distribution investigation executed in the present work includes 3000 high membership probability stars brighter than = 18.5 and = 19.0 mag ranging from near the cluster core to about the tidal radius. Since Section 4.2 confirmed that the pseudo-color is strongly correlated with RGB light element composition, we can use this information to analyze the different radial density profiles of the P1, P2, and P3 populations.
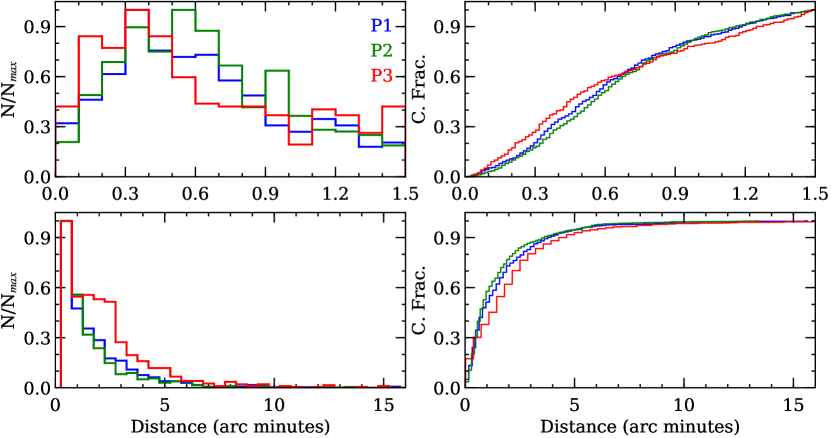
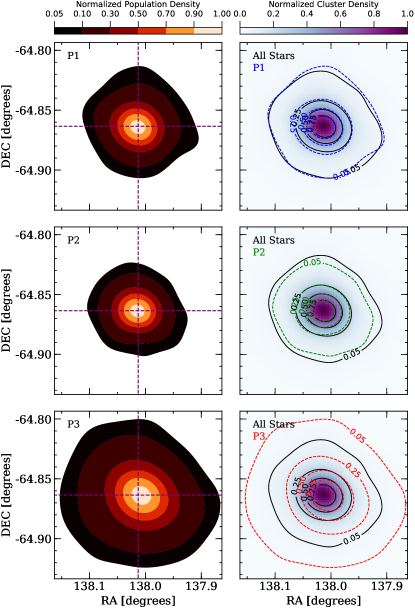
Fig. 11 summarizes the different radial distribution profiles for the three main sub-populations identified from the GMM procedure outlined in Section 3, with the HST and DECam data analyzed separately. The left panels of Fig. 11 show the number of stars for a given sub-population within each radial bin but normalized to the bin of maximum height for each group. Similarly, the right panels show the cumulative distributions of the same data. These panels highlight a few interesting trends. First, the P3 stars (most -rich according to the comparison with spectroscopy) appear to be the most centrally concentrated inside 0.7 ( 0.88rh); however, the P3 trend flattens out substantially at larger radii. For distances ranging from 1-5′ from the cluster core, the P2 (intermediate enrichment) stars are more centrally concentrated than both the P3 and P1 (primordial) populations. The flatter P3 radial density distribution extends out to at least 10 half-mass radii, but the number of stars in each sub-population becomes too small to differentiate trends between the three groups at larger distances.
Fig. 12 compares normalized isodensity contours for the P1, P2, and P3 sub-populations over the full range of radial distances considered here. The panels again highlight that the P2 sub-population is more centrally concentrated than the P1, and especially P3, groups when extending to distances far from the cluster center. Similarly, Fig. 12 shows that the 50 contour level of the P3 group covers an area that is nearly 2 larger than either the P1 or P2 sub-populations. The bottom right panel of Fig. 12 also shows mild evidence that the P3 population may have a slightly different position angle that is rotated northward compared to the P1 and P2 groups. However, one of the most intriguing results from Fig. 12 is that the P3 sub-population centroid appears offset relative to the nominal cluster center, and also relative to the P1 and P2 centroids. A Monte Carlo simulation with 10,000 resamplings of the population designations, based on the probabilities assigned in Section 4.2 to each star, indicates that the P3 group centroid is offset from the P1 and P2 population centers by 6.0-6.5 (0.14rh), with most of the shift coming from the right ascension coordinate.
5.2 HB stars
We used here our DECam + HST deep and precise photometry, which covers more that the entire tidal extent of NGC 2808, to investigate the radial distribution of the HB stars. As a first step, HST photometry in the and filters was converted into the DECam and filters. A sample of bright and well-measured stars in common between the two data sets was selected and the following color transformations were derived:
| (2) |
| (3) |
| (4) |
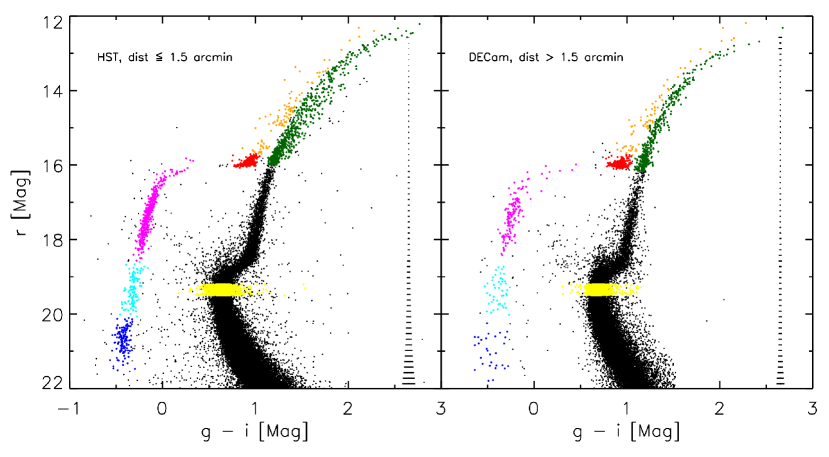
Fig.13 shows the CMDs based on HST photometry for radial distances 1.5′ (left panel) and DECam for 1.5′ (right). NGC 2808 HB stars were divided in four groups, namely RHB, EBT1, EBT2, and EBT3, following the prescriptions of Bedin et al. (2000), Castellani et al. (2006), and Iannicola et al. (2009), and stars were counted; errors were calculated as the square root of the number counts. Table 4 lists the number counts of the HB stars identified in each group and data set with their uncertainties.
Fig. 14 shows the -band luminosity function for NGC 2808 HB based on HST (top panel) and DECam photometry (bottom). Note that the completeness of both catalogs is quite similar at these luminosity levels.
It is interesting to note that the RHB fraction increases in the outskirt of NGC 2808, i.e. for distances larger than 1.5′, i.e. 2; on the other hand, the number of EBT1 and EBT3 stars decreases while the number of EBT2 stars is approximately constant. However, the DECam sample of RHB stars might be more affected by residual contamination of field stars compared to the bluer HB stars. In order to investigate this issue, we matched DECam HBs with Gaia DR3 catalog and found 460 (out of 490) stars in common, and 441 of these have a proper motion measurement. Note that only 6 out of 29 EBT3 stars were found in Gaia, due to their faintness. On the other hand, all except two stars of the RHB group were found; therefore, we used the proper motion of NGC 2808 calculated by the Gaia Collaboration et al. (2018, see Table 1) and selected as candidate cluster members RHB stars with -4 5 mas/yr and -4 5 mas/yr. Of 266 RHBs, 261 are cluster members, resulting in a 2% residual contamination of field stars. In the case of the EBT1 star group, all of the 136 stars with Gaia proper motion measurement are cluster members, with a 0% residual contamination from the field. We could not perform the same calculation for the EBT2 and EBT3 groups, since these are highly incomplete in the Gaia catalog. However, a large residual contamination by field stars is not expected at these very blue colors, 0 mag (see the CMDs in Fig. 3).
We then selected RGB stars brighter than the RHB luminosity level in both CMDs, where the RHB is approximately flat for colors 0.5 mag, and calculated the parameter, i.e. the ratio of the number of HB stars over the number of RGB stars brighter than the RHB, as a function of distance from the cluster center, . Stars were selected in concentric annuli of different thickness, to allow the number of objects per annulus to be always larger than 20. We assumed a Poisson error on the star number counts and we calculated the uncertainty on the ratio as:
| (5) |
where = and and are the number of HB and RGB stars in this case, and and the same for .
The top panel of Fig. 15 shows the parameter, , as a function of radial distance in arcminutes, based on HST photometry for 1.5′ and on DECam photometry for the external regions. In the case of the HST data set we only selected stars for 0.3′, since the catalog is not complete closer to the cluster center due to crowding effects. Regarding DECam photometry, we calculated the parameter up to a radial distance of 6′, since the number of stars greatly decreases for larger distances, with less than 40 RGB and 40 HB stars in the last two annuli, and the uncertainties on the ratios increase.
The parameter is 1.5 (dashed line in the figure) inside the half-mass radius, (dotted line), while it is systematically lower in the external regions, with a mean value of 1.160.27, or 1.050.25, excluding the last two annuli. For radial distances larger than 5′, slightly increases again, but the uncertainty is factor of two larger in these more external regions of NGC 2808.
The decrease of the parameter with radial distance could be due to an increased contamination of the RGB sample by field stars towards the external regions of NGC 2808. To investigate this issue, we matched the RGB stars with the Gaia DR3 catalog and found 434 (out of 444) stars in common and with a proper motion measurement; of these, 419 are cluster members ( 97%). About half of the contaminant stars (7/15) are located at radial distances larger than 9′, so outside the range of distances of our analysis (Fig. 15). Therefore, we can safely claim that contamination by field stars of the RGB sample does not affect the decrease of the parameter with radial distance.
In order to further assess the cause for the decrease of the parameter, we also calculated the ratio of the number of HB and RGB stars over the number of MS stars in the same cluster region. We only selected MS stars in a narrow magnitude range around NGC 2808 MS turn-off (MSTO) point, 19.2 19.5 mag, to avoid the number counts being dependent on the mass function of the cluster (see Fig. 13).
The ratio of the number of RGB and HB stars over the number of MS stars as a function of radial distance is shown in the middle and bottom panels of Fig. 15, respectively: N(RGB/MS) seems to increase at distances 1.7′, and then to decrease attaining a constant value of 0.12 (dashed line in Fig. 15) throughout the extent of the cluster. On the other hand, the N(HB/MS) is about constant, 0.17 (dashed line), until a radial distance of 2.0′, and then it slightly decreases to 0.12 at larger distances.
These ratios suggest that the culprit for the decrease of the parameter at radial distances larger than 1.5′ are the HB stars, in the sense that their total number decreases in the outskirt of NGC 2808.
In order to better understand the trend of the radial distributions of the stars belonging to different evolutionary phases, we also calculated the ratio of the number of AGB stars over the number of RGB stars (brighter than the RHB): N(AGB)/N(RHB) = 0.130.01 for radial distances 1.5′, and 0.160.02 at larger distances. The number of AGB stars is also listed in Table 4. To check for possible field star contamination of the AGB sample in the external regions of NGC 2808, we matched DECam AGB candidates with Gaia DR3 and found 66 stars in common and with proper motion measurements. We applied the same selection criteria as before and found that 88% of these stars are cluster members. By removing the number of possible field contaminants from both the AGB and RGB samples, the ratio of the number of AGB over the number of RGB stars in the external regions of the cluster is 0.150.02, still slightly larger than the value closer to the cluster center. These ratios would suggest a slight increase of the number of AGB stars in the outer regions of NGC 2808. We then calculated the ratio of the number of AGB stars compared to the number of RHB stars in both regions, and obtained N(AGB)/N(RHB) = 0.210.02 and 0.260.03, respectively. When taking into account the possible contamination by field stars of both samples, the ratio of AGB over RHB stars is 0.230.02 in the external regions of the cluster. These data suggest a similar distribution of AGB and RHB stars, which is expected since most RHBs should evolve along the AGB branch.
We were not able, unfortunately, to compare the star counts of the AGB-manqué stars with those of their progenitors, the blue HB stars, since we do not have precise and deep UV photometry for a wide field of view across NGC 2808 that would allows us to identify the AGB-manqué stars (the bluest DECam filter is the band with a central wavelength of 3560 Å).
| Radius | N(RHB) | N(EBT1) | N(EBT2) | N(EBT3) | N(HB) | N(RGB) | N(AGB) | N(MS) | |
|---|---|---|---|---|---|---|---|---|---|
| aaStar counts based on HST data. | 484 (402%) | 416 (352%) | 112 (111%) | 132 (141%) | 114434 | 76126 | 10210 | 672582 | 1.500.03 |
| bbStar counts based on DECam data. | 274 (534%) | 139 (253%) | 48 (132%) | 29 (91%) | 49022 | 43721 | 718 | 340558 | 1.160.27 |
| Total | 75827 | 55523 | 16013 | 16113 | 163440 | 119835 | 17313 | 10130101 | … |
Fig. 14 shows the -band luminosity function of the full HB of NGC 2808 as a function of distance from the cluster center; from this plot it is clear that the number of RHB stars increases in the more external regions of NGC 2808 while the number of EBT1 and EBT3 stars decreases and the EBT2 stars show a flat distribution across the cluster, in agreement with previous results from Bedin et al. (2000) and Iannicola et al. (2009).
A hypothesis to explain the decrease of EBT3 stars at larger cluster radii is that some fraction of them might originate through the ”hot-flasher” scenario; in this case, the stars would be more centrally concentrated as a result of forming in a binary system or as a result of binary interactions (Moehler et al., 2004; Castellani et al., 2006). Moni Bidin et al. (2011) used GIRAFFE/VLT (ESO) spectroscopy for a sample of hot HB stars (17,000 22,000 K) spanning the EBT1 and EBT2 groups to monitor their radial velocities as a sign of binarity. They found no binaries among the EBT1 group, but found the most probable fractions of close (p ¡ 10 days) and intermediate (p ¡ 10-50 days) period binaries among the EBT2 group to be 20 and 30, respectively, thus supporting the ”hot-flasher” scenario. However, we note that this study did not have any EBT3 spectra so its connection to the warmer HB population remains to be confirmed.
Another hypothesis to explain the decrease of EBT1 and/or EBT3 stars toward the outskirts of the cluster is that a fraction of them might be the progeny of a helium-enhanced sub-population in NGC 2808, i.e. the middle or bluest MS; these stars would then be more centrally concentrated as their MS progenitors (D’Antona & Caloi, 2004; Simioni et al., 2016)
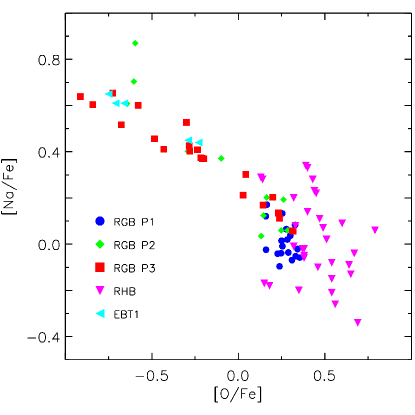
However, a clear correspondence between the different MS and RGB sub-populations and the different HB groups has not been established yet. Gratton et al. (2011) used GIRAFFE/VLT spectroscopy for a sample of 49 RHBs to show that these stars have a similar anti-correlation as the RGB stars, while the EBT1 stars are mostly rich.
We matched the Gratton et al. spectroscopic data with our photometric catalog and found 37 HB stars in common and with both and abundances measured. Fig. 16 shows the RGB stars divided into the , and groups according to our selection and with and measurement from Carretta in the vs plane. The HB stars with and measurements from Gratton et al. are over-plotted, and the figure shows that RHBs have a spread in the and abundances and cover the same region spanned by the and RGB sub-populations and some P3 stars. On the other hand, the EBT1 stars are mostly rich and overlap with the enriched RGB stars and a few P2 stars on this plane. These data suggest that the RHB stars include both the primordial and the light-element enhanced cluster sub-populations, while the EBT1 seems to be the progeny of only the more enriched RGB stars.
It is worth noting that only 5 EBT1 stars have spectroscopic abundances from Gratton et al. and so it is not possible to draw a firm conclusion on the EBT1 group to RGB correspondence. Also, HB stars hotter than 11,500 K (the so-called Grundahl jump) have atmospheric abundances affected by radiative levitation and diffusion and it is not possible to observe their original and abundances.
From these data, it seems that RHBs are the progeny of more than one stellar sub-populations in the cluster, and possibly all three. Their radial distributions based on the DECam + HST catalog shows that they are more numerous in the external regions of NGC 2808, with their number increasing by more than 30% for 1.5′. The AGB stars, which should be the progeny of the RHBs, are also more prevalent in the more external regions. The RHB star spatial distribution is very similar to that of the RGB sub-population, whose stars have a more extended spatial distribution for distances larger than 1.5′. On the other hand, the blue HB stars show an opposite trend, possibly supporting a binary origin.
A similar result for the NGC 2808 RHB was found by Jain et al. (2019) using UV photometry collected with UVIT on Astrosat to study the properties of the cluster HB. Their analysis shows that the RHB is composed of at least two different sub-populations and that it has a more extended spatial distribution compared to the bluer HB stars.
6 Discussion and Conclusions
We have demonstrated that the DECam pseudo-color index, and its HST equivalent, is strongly correlated with an RGB star’s light element composition, in particular the abundance. These data showed that NGC 2808’s RGB population can be decomposed into at least 3 groups, and that these P1, P2, and P3 sub-populations exhibit different spatial density profiles. The P3 group, the most enriched in light-elements, i.e. -rich, is the most centrally concentrated inside about one half-mass radius, but becomes much more dispersed in the outer parts of the cluster. The P3 sub-population centroid is also offset by 6 - 6.5 from that of the P1 and P2 groups, perhaps indicating a different origin or dynamical evolution. The P1 and P2 stars exhibit similar spatial profiles, but the more -enhanced P2 stars are more centrally concentrated out to about 4-5 half-mass radii.
The stronger central concentration of more -enhanced RGB stars found in this study is consistent with the previous analysis by Carretta (2015), which found that the intermediate (I) and enhanced (E) RGB stars were more centrally concentrated compared to the primordial (P) stars; however, their spectroscopic sample only covered distances up to 5′ from the cluster center. Thanks to our wide-field DECam photometric catalog, we were able, for the first time, to show that the more enhanced RGB stars, our P3 group, have a more extended spatial distribution in the outskirt of NGC 2808, almost up to its tidal radius.
Although the method does not efficiently separate HB stars by their light element compositions, the HB morphology, particularly the blue extent of the HB, is thought to be closely connected to the light element spread of stars in a GGC (e.g., Carretta et al., 2007; Gratton et al., 2010a). Therefore, we used our deep and precise DECam + HST photometric catalog to study the spatial distribution of NGC 2808’s multi-modal HB. We showed that the relative fraction of RHB stars increases at radial distances 1.5′ while the blue HB stars decrease towards the outskirt of the cluster. Moreover, the parameter, calculated as the ratio of the number of HB stars and the number of RGB stars brighter than the RHB, decreases from a value of 1.5 down to 1.0 at radial distances 2′. The ratios of the numbers of HB and RGB stars over a selected sample of MS stars showed that the culprit for the correlated decrease of the parameter with increasing radial distance is a deficit of HB stars in the outer parts of the cluster.
The different RGB and HB radial density trends suggest that there is not a direct correspondence between an RGB star’s chemical composition and its post-RGB evolution. For example, the most -rich RGB stars (P3) constitute 39 of our sample at r 1.5 compared to only 23 inside 1.5 from the cluster core. In contrast, the EBT1 and EBT3 stars have their highest concentrations inside 1.5 of the core while the EBT2 population either stays the same or increases slightly outside 1.5. On the other hand, the RHB fractional contribution increases from 40 to 53 when moving from the HST ( 1.5) to DECam (1.5) sample. These results are contradictory to the conventional idea of how RGB and HB stars are connected by light element composition (i.e., that more -rich stars evolve to become bluer HB stars). However, we can reconcile these patterns if more than one evolutionary path exists for creating the warmest blue HB stars.
As noted in Section 5.2, Moni Bidin et al. (2011) found that at least 20-30 of the EBT2 stars (but 0 of the EBT1 stars) in NGC 2808 are in close (p 10 days) or intermediate (p ¡ 10-50 days) binary systems, and their work notes specifically that the warmer blue HB stars could result from both the binary (enhanced mass loss leading to a small HB envelope mass; the ”hot flasher” scenario) and the He-enrichment (high original helium abundances pushing the low mass stars to higher HB temperatures) channels. This scenario implies that the dual formation paths for blue HB stars at least partially erases the expected correlation between and abundance and HB location.
Fig. 16 shows that while the EBT1 stars correlate with the P3 RGB abundances, the RHB stars exhibit an anti-correlation that also reaches [Na/Fe] values as high as +0.4 dex, equivalent to the and some stars from Carretta (2015, see also Fig. 8) and the P3 population here. In other words, the -enriched P2 and P3 RGB stars can feasibly evolve to occupy almost any HB location. Furthermore, a recent analysis from Carlos et al. (2022) found at least one very O-poor AGB star in NGC 2808 that could not have evolved from the blue tail of the HB as those stars have masses that are too low to ascend the AGB (e.g., see the discussion in Gratton et al., 2010b).
Further empirical evidence supporting at least some decoupling between RGB composition and HB evolution can be found when examining ”second parameter clusters”, such as M3 and M13 (see also Lee et al., 1994). In this case, both clusters have similar metallicities, though possibly different ages (e.g., see discussion in Gratton et al. 2010a), along with substantial populations of primordial and enriched stars (e.g., Sneden et al., 2004; Johnson & Pilachowski, 2012, see also D’Antona & Caloi 2008), but M13 contains no RHB stars and a long blue tail while M3 exhibits a strong RHB and a much less extended blue HB. Similarly, NGC 2808 and NGC 6402 are nearly identical in metallicity, age, and mass, both clusters contain stars spanning a wide range of light element abundances, but NGC 2808 has a very prominent RHB and long blue HB while NGC 6402 has almost no RHB stars and a slightly truncated blue HB (Johnson et al., 2019; D’Antona et al., 2022). These two examples highlight that RGB and similar abundances alone cannot predict where a star will evolve to on the HB.
From the information above, we posit that our spatial density results for NGC 2808 may be explained if the RHB stars evolved from a mixture of all three RGB populations, the EBT1 stars evolved mostly from more and -enhanced (P2 and P3) single stars, and the EBT2 EBT3 stars formed from a mixture of ”hot-flasher” binaries and the most enriched P3 stars. Following D’Ercole et al. (2008) and Moni Bidin et al. (2011), the higher masses of the binary systems and initial central formation of and -enhanced stars constrains a significant fraction of these groups and their progeny near the cluster core. At larger radii, mass segregation would cause a decrease in the binary fraction that drives a decline in the EBT2 and EBT3 populations. However, if the ratio of P3 stars evolving onto the EBT2 versus EBT3 groups is high, then the decline in the EBT2 population fraction with increasing radius would be somewhat mitigated. Similarly, dynamical interactions might be expected to drive diffusion of the more and -enhanced P2 and especially P3 stars, which could be as much as 25 (0.2M⊙) less massive than their ”He-normal” counterparts, into the outer parts of the cluster on preferentially radial orbits (Mastrobuono-Battisti & Perets, 2013; Bellini et al., 2015; Hénault-Brunet et al., 2015; Mastrobuono-Battisti & Perets, 2016). This could explain the more dispersed density distribution of P3 stars outside the cluster core, and if a significant fraction of such stars can evolve on to the RHB as well as the blue HB then the diffusion process might explain the increasing RHB fraction with increasing radial distance as well.
These results suggest similarities between NGC 2808 and the most massive, and peculiar, GGC Cen. Calamida et al. (2017) and Calamida et al. (2020) used deep and precise wide-field DECam photometry combined with HST data for the cluster center to show that the most metal-rich RGB stars are centrally concentrated but have a more extended spatial distribution compared to the more metal-poor RGB stars; also, their centroid is shifted by 1′(0.28rh) relative to the centroid of the primordial metal-poor stellar population. Blue MS stars are also more centrally concentrated with a more extended spatial distribution compared to the red MS.
Regarding the HB, Castellani et al. (2007) showed that the bluest HB stars in Cen(EBT3, or EHBs, note that Cendoes not have a RHB) are more centrally concentrated, supporting their origin as hot flashers. This was further confirmed by the spectroscopic analyses of Moehler et al. (2007, 2011) and Latour et al. (2014), which showed EHB stars cannot only be the progeny of the supposedly helium-enhanced sub-population in Censince a large fraction of them also show -enhancement in their atmosphere, resulting from the mixing between the helium- and carbon-rich core and the hydrogen envelope (Sweigart, 1997; Brown et al., 2001; Miller Bertolami et al., 2008; Cassisi et al., 2009). On the other hand, a radial velocity study of 152 EHB stars in Censhowed a close-binary fraction of only 5% (Latour et al., 2018). However, this analysis was not sensitive to intermediate- and long-period binaries, which could be the majority of the EHB binaries, such as Moni Bidin et al. (2011) has shown in NGC 2808.
The analyses presented here and in Calamida et al. (2017, 2020) highlight the power of extending population investigations beyond a few half-light radii with wide-field imagers, especially for massive GGCs. Radial density trends observed in small HST fields are not necessarily representative of a cluster’s global properties, and we do not yet have a clear enough understanding about post-RGB evolution to fully link the different groups identified in MS, RGB, HB, and AGB analyses. However, renewed investigations into the outer parts of clusters, where dynamical evolution times are longer, with space-based UV imaging, ground-based wide-field imaging (e.g., DECam ), and spectroscopic abundance analyses and radial velocity monitoring should provide new insight into the complicated formation histories of the Galaxy’s globular clusters.
Acknowledgements
C.A.P. acknowledges the generosity of the Kirkwood Research Fund at Indiana University. AMB acknowledges funding from the European Union’s Horizon 2020 research and innovation programme under the Marie Skłodowska-Curie grant agreement No 895174. This study was supported by the DDRF grant D0001.82481. This project used data obtained with the Dark Energy Camera (DECam), which was constructed by the Dark Energy Survey (DES) collaboration. Funding for the DES Projects has been provided by the U.S. Department of Energy, the U.S. National Science Foundation, the Ministry of Science and Education of Spain, the Science and Technology Facilities Council of the United Kingdom, the Higher Education Funding Council for England, the National Center for Supercomputing Applications at the University of Illinois at Urbana-Champaign, the Kavli Institute of Cosmological Physics at the University of Chicago, the Center for Cosmology and Astro-Particle Physics at the Ohio State University, the Mitchell Institute for Fundamental Physics and Astronomy at Texas A&M University, Financiadora de Estudos e Projetos, Fundação Carlos Chagas Filho de Amparo à Pesquisa do Estado do Rio de Janeiro, Conselho Nacional de Desenvolvimento Científico e Tecnológico and the Ministério da Ciência, Tecnologia e Inovacão, the Deutsche Forschungsgemeinschaft, and the Collaborating Institutions in the Dark Energy Survey. The Collaborating Institutions are Argonne National Laboratory, the University of California at Santa Cruz, the University of Cambridge, Centro de Investigaciones Enérgeticas, Medioambientales y Tecnológicas-Madrid, the University of Chicago, University College London, the DES-Brazil Consortium, the University of Edinburgh, the Eidgenössische Technische Hochschule (ETH) Zürich, Fermi National Accelerator Laboratory, the University of Illinois at Urbana-Champaign, the Institut de Ciències de l’Espai (IEEC/CSIC), the Institut de Física d’Altes Energies, Lawrence Berkeley National Laboratory, the Ludwig-Maximilians Universität München and the associated Excellence Cluster Universe, the University of Michigan, the National Optical Astronomy Observatory, the University of Nottingham, the Ohio State University, the OzDES Membership Consortium the University of Pennsylvania, the University of Portsmouth, SLAC National Accelerator Laboratory, Stanford University, the University of Sussex, and Texas A&M University. Based on observations at Cerro Tololo Inter-American Observatory, National Optical Astronomy Observatory (2013A-0529;2014A-0480; R.M. Rich), which is operated by the Association of Universities for Research in Astronomy (AURA) under a cooperative agreement with the National Science Foundation. This work has made use of data from the European Space Agency (ESA) mission Gaia (https://www.cosmos.esa.int/gaia), processed by the Gaia Data Processing and Analysis Consortium (DPAC, https://www.cosmos.esa.int/web/gaia/dpac/consortium). Funding for the DPAC has been provided by national institutions, in particular the institutions participating in the Gaia Multilateral Agreement.
References
- Bastian et al. (2013) Bastian, N., Lamers, H. J. G. L. M., de Mink, S. E., et al. 2013, MNRAS, 436, 2398, doi: 10.1093/mnras/stt1745
- Bedin et al. (2000) Bedin, L. R., Piotto, G., Zoccali, M., et al. 2000, A&A, 363, 159
- Bellini et al. (2015) Bellini, A., Vesperini, E., Piotto, G., et al. 2015, ApJ, 810, L13, doi: 10.1088/2041-8205/810/1/L13
- Brown et al. (2001) Brown, T. M., Sweigart, A. V., Lanz, T., Landsman, W. B., & Hubeny, I. 2001, ApJ, 562, 368, doi: 10.1086/323862
- Calamida et al. (2017) Calamida, A., Strampelli, G., Rest, A., et al. 2017, AJ, 153, 175, doi: 10.3847/1538-3881/aa6397
- Calamida et al. (2020) Calamida, A., Zocchi, A., Bono, G., et al. 2020, ApJ, 891, 167, doi: 10.3847/1538-4357/ab77c0
- Cardelli et al. (1989) Cardelli, J. A., Clayton, G. C., & Mathis, J. S. 1989, ApJ, 345, 245, doi: 10.1086/167900
- Carlos et al. (2022) Carlos, M., Marino, A. F., Milone, A. P., et al. 2022, MNRAS, doi: 10.1093/mnras/stac3561
- Carretta (2015) Carretta, E. 2015, ApJ, 810, 148, doi: 10.1088/0004-637X/810/2/148
- Carretta et al. (2007) Carretta, E., Recio-Blanco, A., Gratton, R. G., Piotto, G., & Bragaglia, A. 2007, ApJ, 671, L125, doi: 10.1086/525021
- Carretta et al. (2009) Carretta, E., Bragaglia, A., Gratton, R. G., et al. 2009, A&A, 505, 117, doi: 10.1051/0004-6361/200912096
- Cassisi et al. (2009) Cassisi, S., Salaris, M., Anderson, J., et al. 2009, ApJ, 702, 1530, doi: 10.1088/0004-637X/702/2/1530
- Cassisi et al. (2003) Cassisi, S., Salaris, M., & Irwin, A. W. 2003, ApJ, 588, 862, doi: 10.1086/374218
- Castellani et al. (2006) Castellani, V., Iannicola, G., Bono, G., et al. 2006, A&A, 446, 569, doi: 10.1051/0004-6361:20042170
- Castellani et al. (2007) Castellani, V., Calamida, A., Bono, G., et al. 2007, ApJ, 663, 1021, doi: 10.1086/518209
- Catelan et al. (1998) Catelan, M., Borissova, J., Sweigart, A. V., & Spassova, N. 1998, ApJ, 494, 265, doi: 10.1086/305200
- D’Antona et al. (2005) D’Antona, F., Bellazzini, M., Caloi, V., et al. 2005, ApJ, 631, 868, doi: 10.1086/431968
- D’Antona & Caloi (2004) D’Antona, F., & Caloi, V. 2004, ApJ, 611, 871, doi: 10.1086/422334
- D’Antona & Caloi (2008) —. 2008, MNRAS, 390, 693, doi: 10.1111/j.1365-2966.2008.13760.x
- D’Antona et al. (2016) D’Antona, F., Vesperini, E., D’Ercole, A., et al. 2016, MNRAS, 458, 2122, doi: 10.1093/mnras/stw387
- D’Antona et al. (2022) D’Antona, F., Milone, A. P., Johnson, C. I., et al. 2022, ApJ, 925, 192, doi: 10.3847/1538-4357/ac3a70
- D’Cruz et al. (1996) D’Cruz, N. L., Dorman, B., Rood, R. T., & O’Connell, R. W. 1996, ApJ, 466, 359, doi: 10.1086/177515
- de Boer et al. (2019) de Boer, T. J. L., Gieles, M., Balbinot, E., et al. 2019, MNRAS, 485, 4906, doi: 10.1093/mnras/stz651
- D’Ercole et al. (2008) D’Ercole, A., Vesperini, E., D’Antona, F., McMillan, S. L. W., & Recchi, S. 2008, MNRAS, 391, 825, doi: 10.1111/j.1365-2966.2008.13915.x
- Gaia Collaboration et al. (2018) Gaia Collaboration, Helmi, A., van Leeuwen, F., et al. 2018, A&A, 616, A12, doi: 10.1051/0004-6361/201832698
- Gratton et al. (2010a) Gratton, R. G., Carretta, E., Bragaglia, A., Lucatello, S., & D’Orazi, V. 2010a, A&A, 517, A81, doi: 10.1051/0004-6361/200912572
- Gratton et al. (2010b) Gratton, R. G., D’Orazi, V., Bragaglia, A., Carretta, E., & Lucatello, S. 2010b, A&A, 522, A77, doi: 10.1051/0004-6361/201015405
- Gratton et al. (2011) Gratton, R. G., Lucatello, S., Carretta, E., et al. 2011, A&A, 534, A123, doi: 10.1051/0004-6361/201117690
- Harris (2010) Harris, W. E. 2010, arXiv e-prints, arXiv:1012.3224. https://arxiv.org/abs/1012.3224
- Hénault-Brunet et al. (2015) Hénault-Brunet, V., Gieles, M., Agertz, O., & Read, J. I. 2015, MNRAS, 450, 1164, doi: 10.1093/mnras/stv675
- Hong et al. (2021) Hong, S., Lim, D., Chung, C., et al. 2021, arXiv e-prints, arXiv:2106.12583. https://arxiv.org/abs/2106.12583
- Iannicola et al. (2009) Iannicola, G., Monelli, M., Bono, G., et al. 2009, ApJ, 696, L120, doi: 10.1088/0004-637X/696/2/L120
- Jain et al. (2019) Jain, R., Vig, S., & Ghosh, S. K. 2019, MNRAS, 485, 2877, doi: 10.1093/mnras/stz544
- Johnson et al. (2019) Johnson, C. I., Caldwell, N., Michael Rich, R., Mateo, M., & Bailey, J. I. 2019, MNRAS, 485, 4311, doi: 10.1093/mnras/stz587
- Johnson & Pilachowski (2012) Johnson, C. I., & Pilachowski, C. A. 2012, ApJ, 754, L38, doi: 10.1088/2041-8205/754/2/L38
- Johnson et al. (2020) Johnson, C. I., Rich, R. M., Young, M. D., et al. 2020, MNRAS, 499, 2357, doi: 10.1093/mnras/staa2393
- Lardo et al. (2011) Lardo, C., Bellazzini, M., Pancino, E., et al. 2011, A&A, 525, A114, doi: 10.1051/0004-6361/201015662
- Latour et al. (2018) Latour, M., Randall, S. K., Calamida, A., Geier, S., & Moehler, S. 2018, A&A, 618, A15, doi: 10.1051/0004-6361/201833129
- Latour et al. (2014) Latour, M., Randall, S. K., Fontaine, G., et al. 2014, ApJ, 795, 106, doi: 10.1088/0004-637X/795/2/106
- Latour et al. (2019) Latour, M., Husser, T. O., Giesers, B., et al. 2019, A&A, 631, A14, doi: 10.1051/0004-6361/201936242
- Lee et al. (1994) Lee, Y.-W., Demarque, P., & Zinn, R. 1994, ApJ, 423, 248, doi: 10.1086/173803
- Lee et al. (2005) Lee, Y.-W., Joo, S.-J., Han, S.-I., et al. 2005, ApJ, 621, L57, doi: 10.1086/428944
- Mastrobuono-Battisti & Perets (2013) Mastrobuono-Battisti, A., & Perets, H. B. 2013, ApJ, 779, 85, doi: 10.1088/0004-637X/779/1/85
- Mastrobuono-Battisti & Perets (2016) —. 2016, ApJ, 823, 61, doi: 10.3847/0004-637X/823/1/61
- McLaughlin & van der Marel (2005) McLaughlin, D. E., & van der Marel, R. P. 2005, ApJS, 161, 304, doi: 10.1086/497429
- Miller Bertolami et al. (2008) Miller Bertolami, M. M., Althaus, L. G., Unglaub, K., & Weiss, A. 2008, A&A, 491, 253, doi: 10.1051/0004-6361:200810373
- Milone et al. (2012) Milone, A. P., Marino, A. F., Cassisi, S., et al. 2012, ApJ, 754, L34, doi: 10.1088/2041-8205/754/2/L34
- Milone et al. (2015a) Milone, A. P., Marino, A. F., Piotto, G., et al. 2015a, MNRAS, 447, 927, doi: 10.1093/mnras/stu2446
- Milone et al. (2015b) —. 2015b, ApJ, 808, 51, doi: 10.1088/0004-637X/808/1/51
- Milone et al. (2017) Milone, A. P., Piotto, G., Renzini, A., et al. 2017, MNRAS, 464, 3636, doi: 10.1093/mnras/stw2531
- Moehler et al. (2007) Moehler, S., Dreizler, S., Lanz, T., et al. 2007, A&A, 475, L5, doi: 10.1051/0004-6361:20078509
- Moehler et al. (2011) —. 2011, A&A, 526, A136, doi: 10.1051/0004-6361/201015020
- Moehler et al. (2004) Moehler, S., Sweigart, A. V., Landsman, W. B., Hammer, N. J., & Dreizler, S. 2004, A&A, 415, 313, doi: 10.1051/0004-6361:20034505
- Monelli et al. (2013) Monelli, M., Milone, A. P., Stetson, P. B., et al. 2013, MNRAS, 431, 2126, doi: 10.1093/mnras/stt273
- Moni Bidin et al. (2011) Moni Bidin, C., Villanova, S., Piotto, G., & Momany, Y. 2011, A&A, 528, A127, doi: 10.1051/0004-6361/201016232
- Nardiello et al. (2018) Nardiello, D., Libralato, M., Piotto, G., et al. 2018, MNRAS, 481, 3382, doi: 10.1093/mnras/sty2515
- Pietrinferni et al. (2021) Pietrinferni, A., Hidalgo, S., Cassisi, S., et al. 2021, ApJ, 908, 102, doi: 10.3847/1538-4357/abd4d5
- Piotto et al. (2007) Piotto, G., Bedin, L. R., Anderson, J., et al. 2007, ApJ, 661, L53, doi: 10.1086/518503
- Piotto et al. (2015) Piotto, G., Milone, A. P., Bedin, L. R., et al. 2015, AJ, 149, 91, doi: 10.1088/0004-6256/149/3/91
- Sandquist & Martel (2007) Sandquist, E. L., & Martel, A. R. 2007, ApJ, 654, L65, doi: 10.1086/510722
- Sarajedini et al. (2007) Sarajedini, A., Bedin, L. R., Chaboyer, B., et al. 2007, AJ, 133, 1658, doi: 10.1086/511979
- Schlafly & Finkbeiner (2011) Schlafly, E. F., & Finkbeiner, D. P. 2011, ApJ, 737, 103, doi: 10.1088/0004-637X/737/2/103
- Simioni et al. (2016) Simioni, M., Milone, A. P., Bedin, L. R., et al. 2016, MNRAS, 463, 449, doi: 10.1093/mnras/stw2003
- Sneden et al. (2004) Sneden, C., Kraft, R. P., Guhathakurta, P., Peterson, R. C., & Fulbright, J. P. 2004, AJ, 127, 2162, doi: 10.1086/381907
- Sohn et al. (1998) Sohn, Y.-J., Byun, Y.-I., Yim, H.-S., Rhee, M.-H., & Chun, M.-S. 1998, Journal of Astronomy and Space Sciences, 15, 1
- Sosin et al. (1997) Sosin, C., Dorman, B., Djorgovski, S. G., et al. 1997, ApJ, 480, L35, doi: 10.1086/310606
- Stetson (1987) Stetson, P. B. 1987, PASP, 99, 191, doi: 10.1086/131977
- Stetson (1990) —. 1990, PASP, 102, 932, doi: 10.1086/132719
- Sweigart (1997) Sweigart, A. V. 1997, ApJ, 474, L23, doi: 10.1086/310414
- Sweigart & Catelan (1998) Sweigart, A. V., & Catelan, M. 1998, ApJ, 501, L63, doi: 10.1086/311443
- Tiongco et al. (2022) Tiongco, M. A., Vesperini, E., & Varri, A. L. 2022, MNRAS, 512, 1584, doi: 10.1093/mnras/stac643
- Trager et al. (1995) Trager, S. C., King, I. R., & Djorgovski, S. 1995, AJ, 109, 218, doi: 10.1086/117268
- Valdes et al. (2014) Valdes, F., Gruendl, R., & DES Project. 2014, in Astronomical Society of the Pacific Conference Series, Vol. 485, Astronomical Data Analysis Software and Systems XXIII, ed. N. Manset & P. Forshay, 379
- Valle et al. (2022) Valle, G., Dell’Omodarme, M., & Tognelli, E. 2022, A&A, 658, A141, doi: 10.1051/0004-6361/202142454
- Vasiliev & Baumgardt (2021) Vasiliev, E., & Baumgardt, H. 2021, MNRAS, 505, 5978, doi: 10.1093/mnras/stab1475
- Vesperini et al. (2021) Vesperini, E., Hong, J., Giersz, M., & Hypki, A. 2021, MNRAS, 502, 4290, doi: 10.1093/mnras/stab223
- Vesperini et al. (2013) Vesperini, E., McMillan, S. L. W., D’Antona, F., & D’Ercole, A. 2013, MNRAS, 429, 1913, doi: 10.1093/mnras/sts434
- Walker (1999) Walker, A. R. 1999, AJ, 118, 432, doi: 10.1086/300947
- Zoccali et al. (2000) Zoccali, M., Cassisi, S., Bono, G., et al. 2000, ApJ, 538, 289, doi: 10.1086/309134