Revisiting the Properties of X-ray AGN in the SSA22 Protocluster:
Normal SMBH and Host-Galaxy Growth for AGN in a Overdensity
Abstract
We analyze the physical properties of 8 X-ray selected active galactic nuclei (AGN) and one candidate protoquasar system (ADF22A1) in the SSA22 protocluster by fitting their X-ray-to-IR spectral energy distributions (SEDs) using our SED fitting code, Lightning111https://www.github.com/rafaeleufrasio/lightning. We recover star formation histories (SFH) for 7 of these systems which are well-fit by composite stellar population plus AGN models. We find indications that 4/9 of the SSA22 AGN systems we study have host galaxies below the main sequence, with . The remaining SSA22 systems, including ADF22A1, are consistent with obscured supermassive black hole (SMBH) growth in star forming galaxies. We estimate the SMBH accretion rates and masses, and compare the properties and SFH of the 9 protocluster AGN systems with X-ray detected AGN candidates in the Chandra Deep Fields (CDF), finding that the distributions of SMBH growth rates, star formation rates, SMBH masses, and stellar masses for the protocluster AGN are consistent with field AGN. We constrain the ratio between the sample-averaged SSA22 SMBH mass and CDF SMBH mass to . While the AGN are located near the density peaks of the protocluster, we find no statistically significant trends between the AGN or host galaxy properties and their location in the protocluster. We interpret the similarity of the protocluster and field AGN populations together with existing results as suggesting that the protocluster and field AGN co-evolve with their hosts in the same ways, while AGN-triggering events are more likely in the protocluster.
1 Introduction
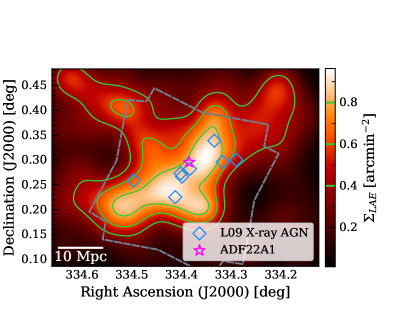
Galaxies hosting X-ray detected active galactic nuclei (AGN) are observed to be more numerous in the progenitors of galaxy clusters (“protoclusters”) than in local galaxy clusters, where the frequency of X-ray AGN (AGN fraction) is suppressed compared to mean-density (“field”) environments. The enhancement of AGN fraction has now been observed in clusters over – Martini et al., 2013; see also Muñoz Rodríguez et al., 2023 for a similar result based on semi-empirical models and numerous protoclusters over – (e.g., Digby-North et al., 2010; Lehmer et al., 2013; Vito et al., 2020; Tozzi et al., 2022), including the SSA22 protocluster, where Lehmer et al. (2009a) (hereafter L09) found a -fold AGN fraction enhancement over the field at the same redshift. The SSA22 protocluster is an intersection of filaments co-moving Mpc (cMpc) across at its widest extent (see Figure 1). It is known to contain an intense overdensity of star forming galaxies (see, e.g., Tamura et al., 2009; Kubo et al., 2013; Umehata et al., 2015) which are found, along with the AGN, to be coincident with intersections of filamentary cold gas reservoirs in the intergalactic medium (IGM) and Lyman-alpha (Ly) nebulae (Umehata et al., 2019). SSA22, then, represents one of our best laboratories for studying how the protocluster environment may drive enhancements of AGN activity.
Observational constraints and the scatter in the AGN fraction–redshift relationship are such that the source of the apparent AGN fraction enhancement in protocluster environments remains uncertain. Simulations of SSA22-like protocluster environments by Yajima et al. (2022) suggest that the super-massive black holes (SMBH) in the protocluster grow rapidly in galaxies with , potentially reaching masses approaching by before quasar feedback stalls the SMBH growth. The observed AGN fraction enhancement over the field could then be due to larger SMBH masses in the protocluster, as we observe a rapid period of SMBH growth with larger average accretion rates. Alternatively, it could be caused by some modification of the AGN duty cycle in overdense, high-redshift environments, possibly due to more frequent accretion episodes caused by mergers. Monson et al. (2021) argued in favor of the former explanation based on finding larger masses among protocluster Lyman-break galaxies (LBGs) compared to field LBGs, and speculated based on non-parametric SFH fitting that the protocluster galaxy population had undergone an earlier period of growth than the field galaxies. However, this sample excluded AGN due to the difficulty of decomposing the stellar population and AGN emission for SED fitting, and hence excluded many of the most massive SSA22 galaxies. In this work, we return to the X-ray detected AGN in SSA22 and fit their SEDs with an improved version of our SED fitting code, Lightning (Eufrasio et al., 2017; Doore et al., 2021, 2023), which now includes models for X-ray to IR AGN emission, allowing us to directly recover SFHs for AGN host galaxies.
The current state-of-the-art SED fitting codes e.g., CIGALE, Boquien et al., 2019; Yang et al., 2020, 2022, and Prospector-/Prospector, Leja et al., 2018; Johnson et al., 2021 now typically include prescriptions for fitting the continuum emission from an AGN alongside the stellar population of the host galaxy, including, in the case of CIGALE and ARXSED (Azadi et al., 2023), X-ray emission. At redshifts where mid-IR observation is difficult, X-ray emission is our primary tool for constraining the AGN luminosity, a necessary step in extracting the SFH of an AGN hosting galaxy. In our updates to Lightning, which we describe in detail in Section 3, we have added the ability to fit binned X-ray spectra with a physically-motivated X-ray AGN model, which we connect directly to a UV-to-IR AGN model. Our X-ray model allows us to estimate the SMBH masses and accretion rates of the SSA22 AGN, and to connect them to the evolution of the host galaxy.
The paper is organized as follows: Section 2 describes the sample selection and data preparation, Section 3 introduces our models and fitting procedures, Section 4 presents our SED fits to the SSA22 X-ray AGN, Section 5 discusses the implications of our results, and Section 6 summarizes our work.
Where necessary we assume a flat CDM cosmology with , , and . In this cosmology, the age of the Universe at is 2.04 Gyr. Coordinates are given in the J2000 epoch. Our stellar population synthesis models assume a Kroupa (2001) IMF.
2 Samples and Data
2.1 SSA22
| ID | Alt. Name(s)aaAGN are numbered as they appear in Lehmer et al. (2009a) and Alexander et al. (2016). | RedshiftbbSpectroscopic redshift. Sources are as follows: 1 – Steidel et al. (2003); 2 – Matsuda et al. (2005); 3 – Saez et al. (2015); 4 – Kubo et al. (2015); 5 – Umehata et al. (2017). | ccRest-frame keV luminosity computed from the Lehmer et al. (2009b) keV flux, assuming the inferred from their catalog. | Chandra R.A.ddPosition of the Chandra detection produced by ACISExtract. | Chandra Dec.ddPosition of the Chandra detection produced by ACISExtract. | ALMA 870µm FluxeeSee Alexander et al. (2016), Tables 1 and 2. Fluxes for offset detections are shown in parentheses; upper limits here are given at . | ALMA R.A.ffFor detected sources we give the position; for non-detected sources with an offset detection, we give the position of the offset detection. | ALMA Dec.ffFor detected sources we give the position; for non-detected sources with an offset detection, we give the position of the offset detection. | Association | |
|---|---|---|---|---|---|---|---|---|---|---|
| (Deg.) | (Deg.) | (mJy) | (Deg.) | (Deg.) | ||||||
| J221736.54+001622.6 | AGN1, ADF22A9 | 3.084(1) | 44.17 | 334.40225 | 0.2729 | 334.40233 | 0.2729 | |||
| J221739.08+001330.7 | AGN2 | 3.091(1) | 43.91 | 334.41279 | 0.2252 | **This is the ALMA Band 7 flux from Ao et al. (2017); this AGN is non-detected at the flux limit of the Alexander et al. (2016) observations. | 334.41187 | 0.2260 | LAB2 | |
| J221709.60+001800.1 | AGN3 | 3.106(2) | 44.03 | 334.29025 | 0.2999 | |||||
| J221720.24+002019.3 | AGN4 | 3.105(2) | 44.61 | 334.33442 | 0.3386 | |||||
| J221735.84+001559.1 | AGN5, ADF22A6 | 3.094(2) | 44.27 | 334.39933 | 0.2664 | 334.39925 | 0.2664 | LAB14 | ||
| J221759.23+001529.7 | AGN6 | 3.096(2) | 44.33 | 334.49675 | 0.2580 | 334.49725 | 0.2589 | LAB3 | ||
| J221716.16+001745.8 | AGN7, ADF22B5 | 3.098(3) | 43.98 | 334.31721 | 0.2958 | 334.31704 | 0.2964 | |||
| J221732.00+001655.6 | AGN8, ADF22A12 | 3.091(4) | 43.96 | 334.38329 | 0.2821 | 334.38308 | 0.2822 | LAB12 | ||
| J221732.41+001743.8 | ADF22A1 | 3.092(5) | 44.33 | 334.38508 | 0.2955 | AzTEC1 |
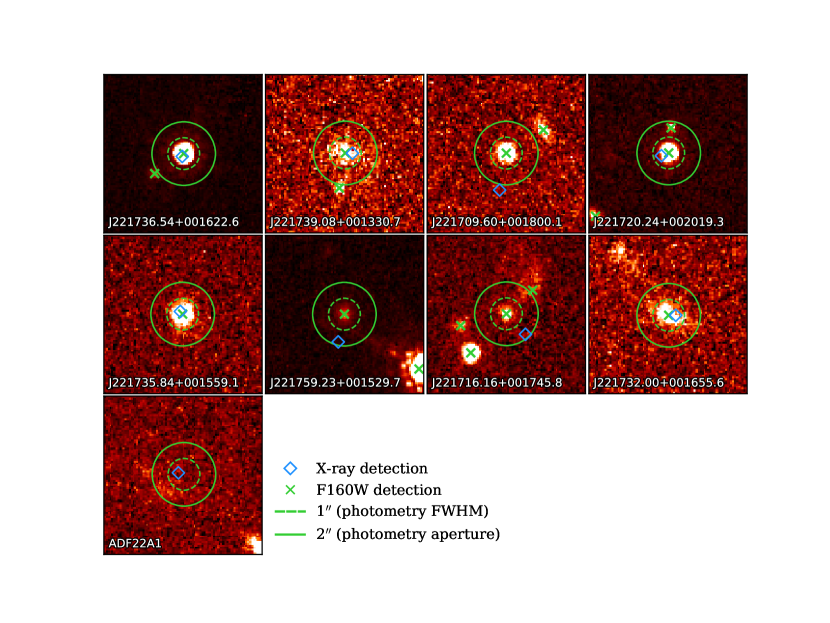
Our sample contains the 8 X-ray detected AGN from L09 associated with the protocluster that were first identified in a 400 ks Chandra survey of the SSA22 field (ObsIDs 8034, 8035, 8036, and 9717). Two of these AGN (J221736.54+001622.6 and J221739.08+001330.7) were first identified as LBGs and spectroscopically confirmed by Steidel et al. (2003); five (J221709.60+001800.1, J221720.24+002019.3, J221735.84+001559.1, J221739.08+001330.7, and J221759.23+001529.7) were detected as Lyman- emitters (LAEs) by Hayashino et al. (2004) with spectroscopic follow-ups from Matsuda et al. (2005). Of the remaining two systems, J221716.16+001745.8 was spectroscopically confirmed as a protocluster member by Saez et al. (2015), and J221732.00+001655.6 by Kubo et al. (2015). The proto-quasar system ADF22A1, identified as an AzTEC 1.1 mm source in Tamura et al. (2010), is also X-ray detected. We include ADF22A1 in our sample as it possibly represents an early phase of AGN growth in the protocluster, and may (given its projected mass and location in the protocluster) evolve into one of the largest galaxies in the protocluster by . The basic observational properties of these 9 sources are given in Table 1. In Figure 2, we show F160W cutouts of the X-ray AGN and ADF22A1, along with the positions of the corresponding X-ray detections from Lehmer et al. (2009b).
For this work the X-ray data were re-reduced using CIAO v4.13 and CALDB v4.9.5222https://cxc.cfa.harvard.edu/ciao/download/, following the procedures described in Lehmer et al. (2017). Source photometry was extracted using the ACIS Extract (AE) pipeline v2020dec17 (Broos et al., 2010)333http://personal.psu.edu/psb6/TARA/code/, following the procedures outlined in Lehmer et al. (2019). For our SED fits (see Section 3), we grouped the X-ray photometry into fixed-width bins from , , and keV. We chose these bins as they were well detected for the majority (6/9) of the sample. In cases where the binomial no-source probability for a bin was , we combined it with the next highest-energy bin, such that the remaining three galaxies have two bins, from and keV.
We use UV–NIR photometry from Kubo et al. (2013) in the bands. These photometry were extracted using a diameter circular aperture from images smoothed to a common FWHM Gaussian PSF. We also use IRAC channel , , , and photometry from Kubo et al. (2013). The IRAC fluxes were not extracted from images smoothed to a common PSF, but were aperture corrected to the same encircled energy as the ground-based photometry. For ADF22A1, we use an additional MIPS measurement calculated by Tamura et al. (2010). We use the HST WFC3 F160W fluxes measured in Monson et al. (2021), which were also extracted in a diameter circular aperture from images smoothed to a common FWHM Gaussian PSF. F160W measurements were available for each of the L09 X-ray AGN, but not ADF22A1, which is non-detected at the threshold of the Monson et al. (2021) catalog.
All of our SSA22 sources of interest have been observed at mm/sub-mm wavelengths. Four of the L09 AGN and ADF22A1 are detected in ALMA Band 6 ( mm) observations from the ALMA Deep Field in SSA22 (ADF22) survey (Umehata et al., 2014, 2015, 2017). Alexander et al. (2016) targeted the 8 X-ray AGN from L09 with ALMA Band 7 (), in which 3 of the AGN are detected and the remaining 5 are given 4.5 upper limits (see Table 1). We use these fluxes and upper limits in our SED fits to those sources. Three of the ALMA Band 7-undetected SSA22 AGN (J221739.08+001330.7, J221759.23+001529.7, and J221716.16+001745.8) have associated, offset ALMA detections from Alexander et al. (2016). In subsequent ALMA Band 7 observations by Ao et al. (2017), a source coincident with the J221739.08+001330.7 X-ray source was detected, indicating that the low-S/N offset source may be spurious. We use the Ao et al. (2017) flux in our fit to J221739.08+001330.7. For the other two AGN with offset detections, we do not account for the offset source in our fits, instead adopting the upper limit associated with the Chandra position. However, in the case of J221716.16+001745.8 we find that the offset detection may be closely associated with the AGN (see Section 3.4 and Appendix A).
We identified photometric issues with two of the AGN, J221720.24+002019.3 and J2217529.23+001529.7. J221720.24+002019.3 has , , and measurements inconsistent with the rest of the observed SED, producing a very flat spectral slope that we cannot reproduce even with our AGN models. These inconsistencies could be caused by line emission (including possibly broad lines; this source is one of three reported Type 1 AGN in the SSA22 sample), but we also find it likely that these measurements are affected by a nearby projected companion, which is inside the photometric aperture for J221720.24+002019.3. The redshift of the projected companion is unknown. We find also that the ground-based -band measurement is larger than the F160W measurement from Monson et al. (2021) by a factor of . The F160W photometry was measured from an image smoothed to the same FWHM and in the same photometric aperture as the ground-based -band measurement, but the companion may be blended with the AGN in the original, lower-resolution ground-based image, accounting for the difference in flux.
J2217529.23+001529.7 has Spitzer IRAC and measurements that are also inconsistent with the remainder of the observed SED. The IRAC 1 and 2 fluxes are very bright; the IRAC flux is the largest in our sample. However, the IRAC colors are inconsistent with AGN emission. The decrement we see between the IRAC and fluxes is more consistent with stellar emission, and this AGN also has a bright foreground star within . We suspect that this foreground star may be blended with the AGN in the IRAC data, given the large IRAC PSF.
Out of an abundance of caution, we treat the measurements listed above for J221720.24+002019.3 and J2217529.23+001529.7 as upper limits in our fits.
We correct all of the fluxes for Galactic extinction using the standard Fitzpatrick (1999) Milky Way extinction curve and the Galactic dust extinction map from Schlafly & Finkbeiner (2011), retrieved from the IRSA DUST web application444https://irsa.ipac.caltech.edu/applications/DUST/. We add instrumental calibration uncertainties to the measured uncertainties for each band, along with a flat 10% model uncertainty in each band. We summarize the bands used for the SSA22 AGN and the fractional calibration uncertainties adopted in Table 2.
| Observatory/Instrument | Bandpass | aaCalibration uncertainty as a fraction of flux: |
|---|---|---|
| SUBARU/SuprimeCam | 0.05 | |
| … | 0.05 | |
| … | 0.05 | |
| … | 0.05 | |
| … | 0.05 | |
| … | 0.05 | |
| SUBARU/MOIRCS | 0.05 | |
| … | 0.05 | |
| … | 0.05 | |
| HST/WFC3 | F160W | 0.02 |
| Spitzer/IRAC | 0.05 | |
| … | 0.05 | |
| … | 0.05 | |
| … | 0.05 | |
| Spitzer/MIPS**ADF22A1 only | 0.05 | |
| ALMA | Band 7 | 0.05 |
| … | Band 6 | 0.05 |
2.2 Chandra Deep Fields
In order to generate a comparison sample for the SSA22 AGN, we utilize the 2 Ms Chandra Deep Field North (CDF-N) catalog (Xue et al., 2016) and 7 Ms Chandra Deep Field South (CDF-S) catalog (Luo et al., 2017). To select candidate AGN in the field, while accounting for the differing X-ray depth between SSA22 and the Chandra deep fields, we converted the rest-frame keV in the deep field catalogs to a rest-frame keV luminosity, assuming a photon index . We then selected sources with , the three-count detection limit from the SSA22 X-ray survey of Lehmer et al. (2009b). We cross matched the Cosmic Assembly Near-Infrared Deep Extragalactic Legacy Survey (CANDELS) counterparts given in the CDF catalogs for these candidate AGN with the CANDELS photometric catalogs in the GOODS-N (Barro et al., 2019) and GOODS-S (Guo et al., 2013) fields to retrieve optical-NIR photometry. We find 93 candidate AGN with unique photometric matches in GOODS-N, and 107 in GOODS-S.
We also included Herschel PACS and SPIRE IR photometry from the CANDELS catalogs (Barro et al., 2019), where available. At , blending of far-IR detections with Herschel PACS and SPIRE is a significant concern. Barro et al. (2019) adopt a prior-based extraction method for their FIR fluxes to mitigate this. To be conservative, we additionally searched for Spitzer MIPS 24 µm detections within a 1 FWHM diameter aperture around each Herschel detection, in each band (the diameters are respectively , , and for PACS 100 µm, PACS 160 µm, and SPIRE 250 µm). We then calculated the total 24 µm flux within the 1 FWHM aperture and the fraction of the total 24 µm flux attributed to the primary source most closely matched to the Herschel detection. If this fraction is less than 0.50, we suspect that the Herschel photometry may be influenced by blending, and exclude it from our fits. This process has the side effect of requiring a MIPS 24 detection555Given our previous selection for highly luminous AGN, the requirement of a 24 µm detection does not appear to introduce significant bias in the X-ray luminosity, AGN obscuration (using hardness ratio as a proxy), or band luminosity of the sample. The distributions of these observational properties before and after imposing the 24 µm requirement are statistically consistent., which leaves 73 AGN candidates in the CDF-N and 76 in the CDF-S. We removed galaxies from the sample for which all three Herschel bands are blended, as this gives us no constraint on the dust emission from the galaxy. This final requirement excludes 1 galaxy from the CDF-N. Our sample thus includes 72 candidate AGN in the CDF-N and 76 in the CDF-S.
In the interest of not biasing our sample toward only high-SFR galaxies, we do not require Herschel detections for CDF AGN candidates. For AGN with no Herschel far-IR detections (i.e., no non-blended detections at observed-frame wavelengths ), we calculated PACS upper limits from the PEP/GOODS-Herschel DR1 (Magnelli et al., 2013) error maps666Retrieved from https://www.mpe.mpg.de/ir/Research/PEP/DR1, using the optimum circular apertures and aperture corrections from Pérez-González et al. (2010). We calculated our own upper limits rather than using published limiting fluxes for the fields due primarily to the variation in PACS depth across the GOODS-S field, which causes the published upper limits to be too restrictive for our purposes for galaxies outside the central, ultra-deep region of the field.
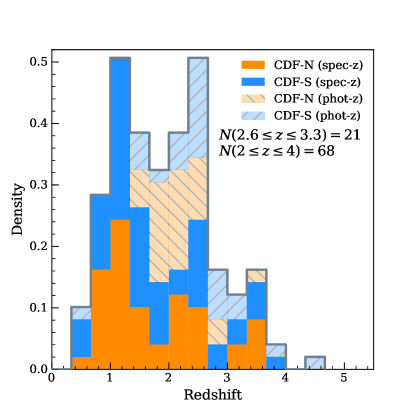
To fit the SEDs of the CDF AGN, we require redshifts. Of the CDF-N (CDF-S) AGN, 45/72 (52/76) have reliable spectroscopic redshifts (quality flag in the CANDELS catalogs). To improve the redshift coverage of our sample we use the photometric redshifts reported in the Guo et al. (2013) and Barro et al. (2019) catalogs where spectroscopic redshifts are unavailable or reported to be unreliable. The Barro et al. (2019) photometric redshifts have three quality tiers, depending on whether they were derived from the broad-band CANDELS photometry (tier 3), CANDELS+SHARDS photometry (tier 2), or CANDELS+SHARDS and grism data (tier 1). Of the 27 CDF-N galaxies in our sample for which we use photometric redshifts, 7 galaxies are at tier 3, 4 at tier 2, and 16 at tier 1. The Guo et al. (2013) photometric redshifts are all derived from broad-band photometry, equivalent to the tier 3 redshifts for CDF-N. We estimate the accuracy of these redshifts by computing for the AGN candidates with spectroscopic redshifts. We find that the outlier fraction of AGN with is in the CDF-N sample and in the CDF-S sample, a factor of 6–8 larger than the outlier fractions reported for the full catalogs in Barro et al. (2019) and Guo et al. (2013), respectively, or approximately for the full sample. The outlier fraction is relatively stable with redshift, increasing slightly to at . We show the distribution of redshifts for each CDF sample in Figure 3. The full sample of CDF-N AGN ranges from –, while the CDF-S AGN range from –. Below, we focus on galaxies with when making comparisons to the protocluster; at these high redshifts the spectroscopic redshift fractions are lower: 17/33 for CDF-N and 17/36 for CDF-S. In what follows we distinguish between galaxies with spectroscopic and photometric redshifts where relevant. We note that despite the large estimated outlier fractions for the spectroscopic redshifts, we do not see systematic differences in the SED-fit derived properties for AGN candidates with spectroscopic and photometric redshifts.
Hereafter we refer to these samples as our CDF-N and CDF-S samples. As with SSA22 (Section 2.1), we added calibration uncertainties and a 10% model uncertainty to the measured uncertainties for each band. We summarize the calibration uncertainties for each field and bandpass in Table 3.
| Sample | Observatory/Instrument | Bandpass | aaCalibration uncertainty as a fraction of flux: | Sample | Observatory/Instrument | Bandpass | |
|---|---|---|---|---|---|---|---|
| CDF-N | LBT/LBC | 0.10 | CDF-S | VLT/VIMOS | 0.10 | ||
| HST/ACS | F435W | 0.02 | HST/ACS | F435W | 0.02 | ||
| … | F606W | 0.02 | … | F606W | 0.02 | ||
| … | F775W | 0.02 | … | F775W | 0.02 | ||
| … | F814W | 0.02 | … | F814W | 0.02 | ||
| … | F850LP | 0.02 | … | F850LP | 0.02 | ||
| HST/WFC3 IR | F105W | 0.02 | HST/WFC3 IR | F098M | 0.02 | ||
| … | F125W | 0.02 | … | F105W | 0.02 | ||
| … | F140W | 0.02 | … | F125W | 0.02 | ||
| … | F160W | 0.02 | … | F160W | 0.02 | ||
| CFHT/WIRCam | 0.05 | VLT/HAWK-I | 0.05 | ||||
| Spitzer/IRAC | 0.05 | Spitzer/IRAC | 0.05 | ||||
| … | 0.05 | … | 0.05 | ||||
| … | 0.05 | … | 0.05 | ||||
| … | 0.05 | … | 0.05 | ||||
| Spitzer/MIPS | 0.05 | Spitzer/MIPS | 0.05 | ||||
| … | 0.10 | … | 0.10 | ||||
| Herschel/PACS | 0.05 | Herschel/PACS | 0.05 | ||||
| … | 0.05 | … | 0.05 | ||||
| Herschel/SPIRE | 0.15 | Herschel/SPIRE | 0.15 |
3 Spectral Energy Distribution Fitting
3.1 Stellar Population and Dust Modeling
The host galaxy stellar populations are modeled using piecewise constant (also called “non-parametric”) SFHs, with constant SFR in each of a number of stellar age bins. For the majority of our sample we use 4 SFH bins, spanning – Myr, – Myr, –, and –, where is the age of the Universe at the redshift of the galaxy. For galaxies with Gyr ( in our assumed cosmology), we use 5 bins, spanning – Myr, – Myr, –, – Gyr, and –. Our single age stellar population models are generated with Pégase (Fioc & Rocca-Volmerange, 1997, 1999), assuming solar metallicity, , and a Kroupa (2001) IMF. These stellar populations also include nebular emission associated with star formation (see section 2.4 of Fioc & Rocca-Volmerange, 1997).
Dust attenuation is modeled with the Noll et al. (2009) modified Calzetti et al. (2000) attenuation curve, which includes a UV bump and variable UV attenuation curve slope. For the SSA22 sample we fix the UV slope to match the featureless Calzetti et al. (2000) law, while for the CDF samples we allow the deviation in the UV slope to vary, as the presence of IR data at the peak of the warm dust emission and the relatively deep optical data allow us to constrain .
Dust emission is modeled using the Draine & Li (2007) templates. We use the “restricted” version of the model set, as recommended by Draine & Li (2007), with the radiation intensity distribution slope fixed at and the maximum intensity fixed at . The minimum intensity, , cannot be well-constrained by our limited IR data for the SSA22 sample, so we (arbitrarily) fix , finding that this choice also results in acceptable fits for the CDF AGN. The mass fraction of polycyclic aromatic hydrocarbons (PAH) in the dust mixture is also fixed for all of our samples at , which is the minimum for the Lightning dust emission implementation, as we do not expect strong PAH emission from the high-redshift galaxies that we are most interested in. We assume energy balance, such that the normalization of the dust emission is set by the UV-optical attenuation of the stellar population and AGN.
3.2 UV-IR Active Galactic Nuclei Modeling
Inspired by the methods adopted in CIGALE (Yang et al., 2020, 2022), we adopt the SKIRTOR UV-IR AGN templates (Stalevski et al., 2016) in our modeling. These models include a broken power law model for the accretion disk emission, which is reprocessed by a two-phase, clumpy torus of dust surrounding the accretion disk. For the accretion disk component, we use the default SKIRTOR broken power law, where
| (1) |
We use a slice of the model set with the geometry and structure of the torus fixed. We adopt a torus opening angle (corresponding to a covering factor of ) based on the findings of Stalevski et al. (2016). The amount of dust in the torus is also fixed: in the SKIRTOR models this is controlled by the parameter , the edge-on optical depth of the torus at (the wavelength of the commonly-seen silicate absorption feature in the spectra of AGN). We adopt ; we lack the IR data to properly constrain this silicate feature, so we choose the midpoint of the gridded values in the SKIRTOR models. To allow treatment of the viewing angle as a continuous parameter (the original models are gridded in 10 degree increments), we interpolate between models in -space.
The UV-optical component of the AGN is attenuated by the same attenuation curve as the stellar population, and we apply energy balance to model heating of the ISM dust by the AGN, such that the power attenuated from the AGN spectrum by ISM dust (integrated over all lines of sight) is added to the luminosity of the dust model.
Our AGN model does not include line emission, which is a strong and ubiquitous feature in the UV-to-IR spectra of AGN. In early tests we found clear discrepancies for some AGN candidates in the CDF between bands probing the Lyman- line and our models, where the observed flux was significantly larger than the model was capable of producing, while the neighboring bands probing continuum emission were well-fit. Our stellar population models include Ly, but could not produce the observed fluxes without extreme star formation rates inconsistent with the other observations. We take this to suggest that Ly emission from the AGN may be contaminating these observations. We note also that X-ray AGN candidates are also often LAEs at redshifts , including in SSA22, where five out of eight of the L09 X-ray AGN were originally discovered as LAEs. Since we do not model AGN line emission, for the CDF samples we exclude bands that contain the Lyman- line (i.e., -band at and ACS F435W at ).
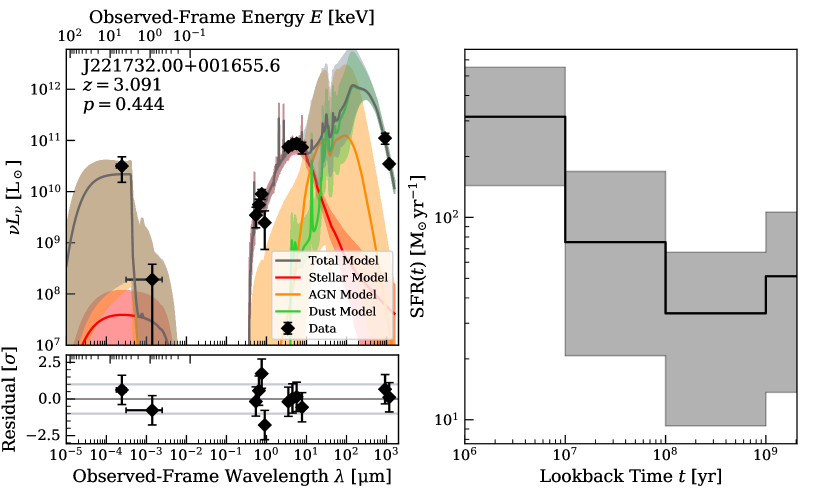
Some of the strongest AGN narrow lines, including H, , and fall in the NIR bandpasses at . One of the SSA22 galaxies, J221732.00+001655.6, has significantly elevated measurements compared to our best-fit models, and in preliminary fits was unacceptably under-fit. Since there is no evidence of a companion galaxy in the F160W image, we speculate that the elevated photometry is due to contamination of the NIR photometry by AGN narrow line emission, and consequently exclude the , , F160W, and bands from the fit. We note that if strong narrow lines alone caused this issue we might also expect the band measurement to be larger than the models could produce, due to contributions from the line. We do not see this in our fits, and we cannot conclusively say that narrow lines are the cause. However, we find that the solution we recover without the , , F160W, and bands is consistent with the preliminary, under-fit solution, though with better sampling and larger uncertainties due to the smaller . Since the SFH solution for this galaxy is apparently robust to the omission of this photometry, we proceed with the second, better-fit solution.
3.3 X-ray Modeling
The relationship between the intrinsic optical and X-ray luminosities of AGN are typically quantified empirically with a two-point spectral index between the and , the intrinsic luminosity densities at 2500 and 2 keV. There are a number of different calibrations for this relationship, including the relationship e.g., Just et al., 2007; as used in CIGALE, Yang et al., 2020, 2022 and the Lusso & Risaliti (2017) relationship. The scatter around and variations between these empirical relationships were modeled physically in Kubota & Done (2018) as variations in the properties of the SMBH, including the SBMH mass and the Eddington ratio, . To model the AGN X-ray emission in Lightning, we adopt the qsosed models from Kubota & Done (2018), which were found to reproduce the Lusso & Risaliti (2017) relationship throughout the parameter space (see Figure 7 in Kubota & Done, 2018). These models, which have previously been applied to X-ray-to-IR SED fitting in Azadi et al. (2023), are a subset of the agnsed family of models, intended to reproduce the soft X-ray excess seen in some AGN spectra with a three-component model including an outer accretion disk, a warm Comptonizing region covering the disk, and a hot Comptonizing region around the central source, which produces the hard X-ray spectrum. The qsosed model fixes the electron temperatures and geometries of the three regions, such that and are the only remaining physical parameters. In Lightning we sample both these parameters, and allow them to set the normalization of the entire X-ray-to-IR AGN model by matching the intrinsic of the SKIRTOR UV-IR AGN model to that of the X-ray model.
The X-ray emission from X-ray binaries within the stellar population of a galaxy can in some cases rival the X-ray emission from an AGN, though in our samples selected by X-ray luminosity they are expected to have small or negligible contributions to the X-ray spectrum. We model the X-ray binary population as a power law with an exponential cutoff at high energies, with photon index and cutoff energy keV. We determine the X-ray binary luminosities using relationships based on the stellar-age-dependent parameterizations provided in Gilbertson et al. (2022):
| (2) |
and
| (3) |
where is the base-10 log of the stellar age in years and is measured from rest-frame keV. We thus calculate the HMXB and LMXB luminosity of each stellar age bin of the SFH and sum them to produce the X-ray binary luminosity of a given galaxy.
We model X-ray absorption with the tbabs absorption model (Wilms et al., 2000). We use three instances of tbabs to model absorption: two tbabs in the rest-frame of the galaxy to model the absorption of the AGN and the X-ray binary population, and one in the observed-frame to account for the absorption by the Milky Way, where the Galactic HI column density along the line of sight (retrieved using the CIAO colden procedure) is held constant. Only the HI column density in the nuclear regions is a free parameter in our fits; the HI column density in the galaxy (modifying only the stellar population absorption) is derived from the band attenuation, (computed in turn from ) assuming that
| (4) |
chosen as an average of observations of the Milky Way relationship (Predehl & Schmitt, 1995; Nowak et al., 2012). We note that the results for our samples, which we selected by to include only AGN-dominated sources, are insensitive to the assumed level of absorption for the X-ray binary population.
Our X-ray fitting procedure in Lightning can use either fluxes, which are widely available in high-level X-ray source catalogs but are dependent on an assumed spectral model, or instrumental counts, which are model-independent but require ancillary products to use in fitting. In the former case, the user need only supply fluxes, uncertainties, and bandpasses. Bandpasses are assumed to have uniform sensitivity across their width. In the latter case, we require a user to supply the net counts in each bandpass, the bandpasses, the exposure time, and the auxiliary response function (ARF), which describes the energy-dependent effective area of the detector. The models are converted to photon flux density, multiplied by the ARF, and integrated over the bandpass to get the counts predicted by the model in each bandpass. In this work, we use instrumental counts for our X-ray photometry.
For the CDF-N and CDF-S, we use the ARF nearest the aimpoint of the field and account for its off-axis variation by using the vignetting-corrected exposure time from the published CDF point source catalogs. In SSA22, we generate an ARF appropriate for each source position, based on our AE runs. Once we have calculated the model counts, we calculate the X-ray model contribution to as
| (5) |
where is the net counts in bandpass . For the SSA22 data, we use
| (6) |
where and are the source and background counts in bandpass , with and the respective areas of the source and background regions. We use the upper error of the Gehrels (1986) approximation for the uncertainties:
| (7) |
For the far deeper CDF data, we assume the source counts dominate over the background counts in both bandpasses, and let
| (8) |
3.4 Fitting
The parameters outlined above and their allowed ranges for our SED fits are summarized in Table 4. We assumed uniform priors on all free parameters. Upper limits are handled in our fitting procedure by setting the observation in the corresponding band to 0, and setting the uncertainty to the 1 limiting flux.777This is only an approximation of the statistically correct handling of upper limits, albeit a widely-used one that produces the expected behavior for upper limits (see, e.g., Figure 4). See Appendix A of Sawicki (2012) for a discussion of the model likelihood in the case of nondetections.
To fit the SEDs of our samples, we made use of an implementation of the Goodman & Weare (2010) affine-invariant MCMC algorithm within Lightning. We use an ensemble of 75 MCMC samplers, which we run for 40000 steps. We use the “stretch move” as described in Goodman & Weare (2010). To achieve acceptance fractions , we change the proposal distribution width parameter to (the original authors recommend using ). For our fits, we find that the integrated autocorrelation times of the parameters can be quite long, approaching steps for some parameters see, e.g., Goodman & Weare, 2010 and Foreman-Mackey et al., 2013 for discussions of the autocorrelation time in MCMC applications.
To produce the final chains, from which we sample the best-fit parameters and uncertainties, we first discard a number of burn-in steps from the beginning of each chain equal to twice the longest autocorrelation time of any parameter of the chain. We then calculate the autocorrelation time again for the new chain minus burn-in, thin the remaining length of the chains by a factor of half the new longest autocorrelation time, and stack the chains of all the samplers. This results in a final chain consisting of independent samples. We take the last 1000 of these samples for each galaxy as the sampled posterior distribution.
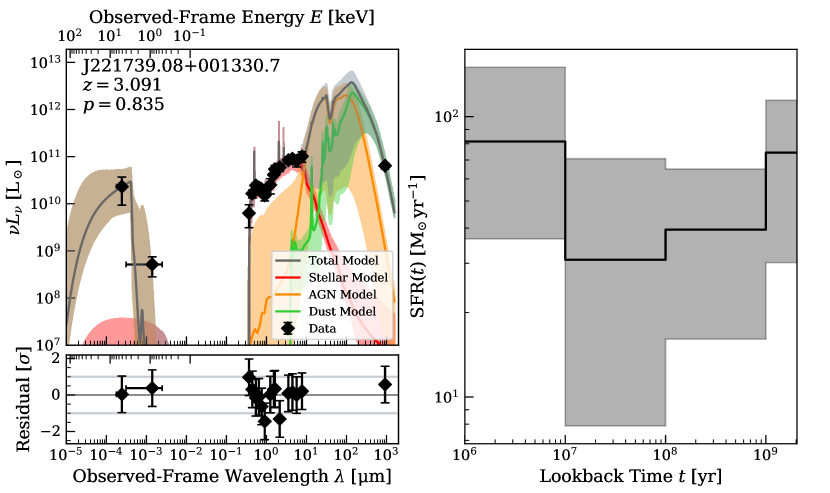
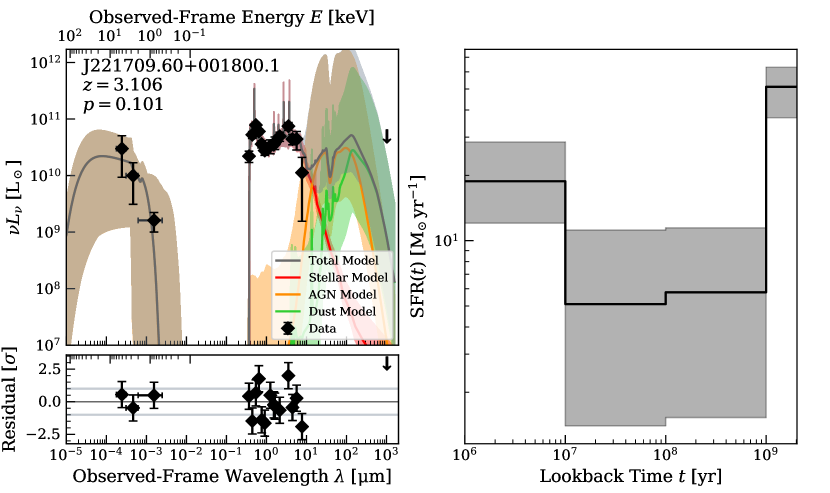
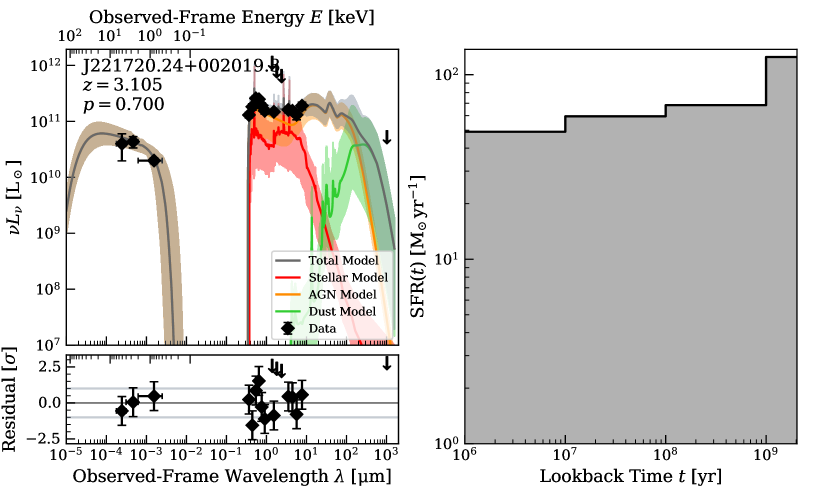
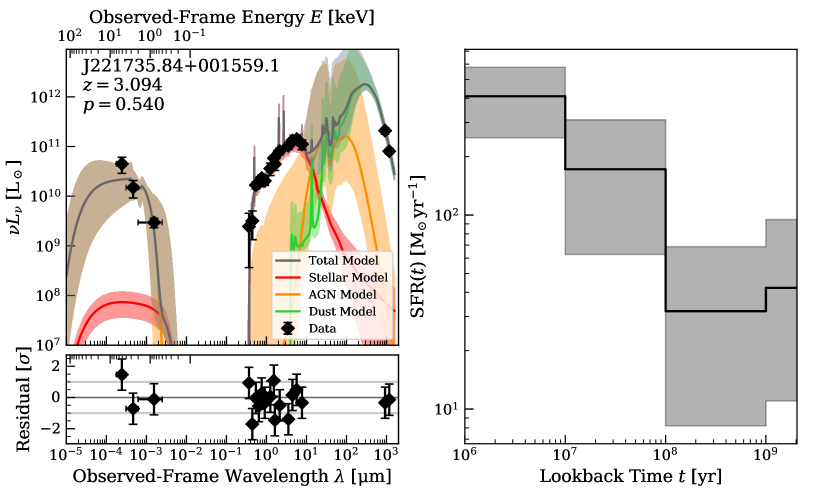
When plotting the SEDs, we show the best fit and the full range of the best 68% of models (in terms of ) drawn from the sampled posterior as the uncertainty in the fit. When quoting individual parameter values and star formation histories, we report the median values from the marginalized posterior distributions, with the 16th to 84th percentile ranges as the uncertainties. We make this distinction to better show the connection between the observational coverage, data uncertainties, and the uncertainties on the fit when plotting the SED.
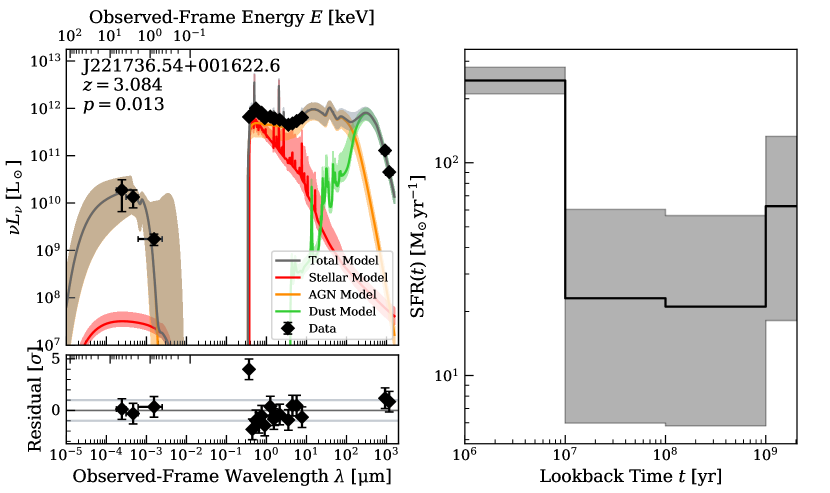
We use posterior predictive checks (PPC) Rubin, 1984; Gelman et al., 1996; see also section 5.1 of Chevallard & Charlot, 2016 for an example of PPC used in SED fitting to assess the suitability of the models used in our fits. Of the SSA22 sample, two galaxies, J221736.54+001622.6 () and J221716.16+001745.8 () have values that suggest poor fits, though we find that these are likely data-driven rather than model-driven.
While the value for J221736.54+001622.6 is not extreme (i.e. it is ), it does suggest under-fitting. Upon inspection, it appears that the under-fitting is due entirely to the measurement. The other galaxies in the SSA22 sample have measurements consistent with either non-detection or a steep fall-off in flux, as expected for galaxies; J221736.54+001622.6 has the largest flux of the SSA22 galaxies (a factor of greater than the next-largest). This suggests that J221736.54+001622.6 is an outlier; given the good agreement between the data and our model for the remainder of the bands, we treat our model as appropriate for this galaxy otherwise.
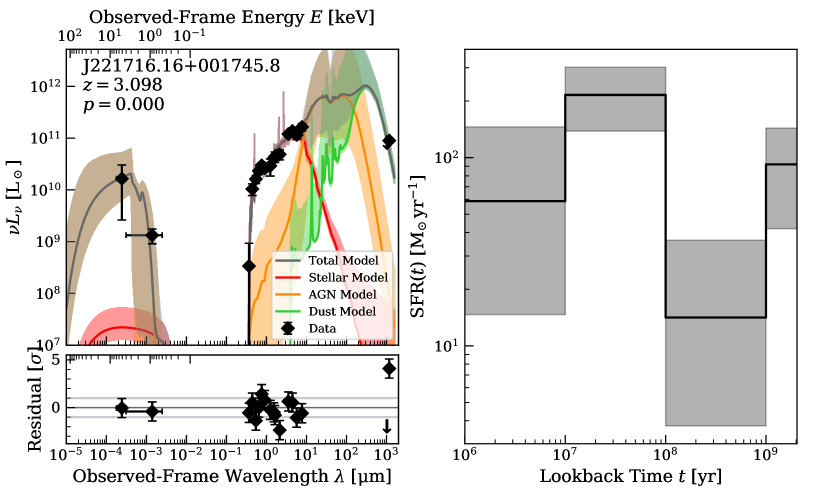
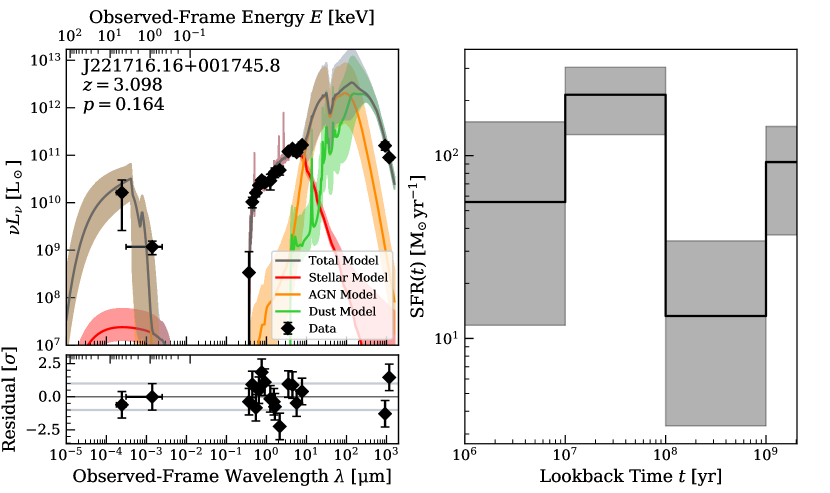
The fit to J221716.16+001745.8 is significantly ruled out according to the PPC, with . Upon inspection, this appears to be driven by the ALMA data: the ALMA Band 6 (1.1 mm) detection is significantly larger than the Band 7 (870 µm) upper limit, suggesting a flat spectral slope that the Rayleigh-Jeans tail of our dust model cannot reproduce. Notably, this source is located close () to an offset ALMA 870 µm detection not originally associated with this source. However, the offset of the 870 µm source is in the direction of the synthesized beam’s major axis, suggesting that it could be a plausible counterpart. We re-fit with the flux of the offset detection in place of the upper limit, finding a much improved fit (), and the same SFR and SFH shape as we recover when fitting with the ALMA Band 7 upper limit. See Appendix A for details on the alternative SED fit to this AGN.
To establish the degree to which we can constrain the stellar population properties of the SSA22 AGN hosts, we also fit their SEDs with an AGN-only model (i.e., with all SFH coefficients set to 0). Details of these AGN-only SED fits and comparisons to the model with a stellar population can be found in Appendix B. For all but two of the SSA22 AGN, the PPC rules out the AGN-only model with . Our model-comparison tests indicate that the AGN-only model is statistically preferred for both of these AGN, J221720.24+002019.3 and J221759.23+001529.7. Given that the data (under our models) are consistent with zero star formation, in what follows we treat the stellar population properties from our original SED fits as upper limits for these two AGN.
As for the CDF sample, the majority of galaxies are well-fit with , though we find 35/151 = (24/151 = ) with (). This under-fitting may be model-driven (i.e. the model is not suitable for the data) or data-driven (if, e.g. the data are blended, mismatched, or the uncertainties are overly-constraining). We have taken steps to mitigate blending of the IR data, and used the carefully cross-matched Barro et al. (2019) catalogs to attempt to mitigate mismatches. We also added calibration uncertainties to the data to avoid overly-constrictive uncertainties. However, we note that our choice of model uncertainty ( in each band) is arbitrary; we may need larger values to appropriately model uncertainties about, e.g. the power law slopes of the AGN accretion disk model, the optical depth of the AGN torus, or the values of any of the other fixed model parameters. To test the effect of model uncertainty on the distribution of values, we re-fit the CDF samples with a model uncertainty of in each band. This decreased the number of galaxies with to 11/151 (). We note also that across the sample, the under-fitting does not appear to be systematically related to any particular component of the model. Given the decrease in under-fitting with a modest and arbitrarily chosen increase in the model uncertainty, and the lack of systematics in the under-fitting, we treat the models as suitable for the CDF sample.
| Model Component | Parameter | Description | Value/RangeaaFor free parameters, the allowed ranges are given in brackets. Priors are uniform on all free parameters. |
|---|---|---|---|
| Stellar Population | Star Formation History coefficients in solar masses per year | ||
| Dust Attenuation | Optical depth of diffuse dust | ||
| UV attenuation curve power-law slope deviation from Calzetti et al. (2000) law | cc is only a free parameter for the CDF sample fits; it is fixed at 0 for the SSA22 sample. | ||
| Dust Emission | Power law slope of intensity distribution | 2.0 | |
| Intensity distribution minimum | 10 | ||
| Intensity distribution maximum | |||
| Mass fraction of PAHs in dust mixture | 0.0047 | ||
| Mass fraction of dust exposed to intensity distribution | |||
| AGN Emission | Edge-on optical depth of AGN torus at | 7.0 | |
| Cosine of AGN torus inclination to the line of sight | |||
| X-ray Emission | Neutral Hydrogen column density along the line of sight | ||
| SMBH mass parameter in solar masses | |||
| of SMBH accretion rate, normalized by the Eddington rate |
4 Results
4.1 L09 Active Galact Nuclei
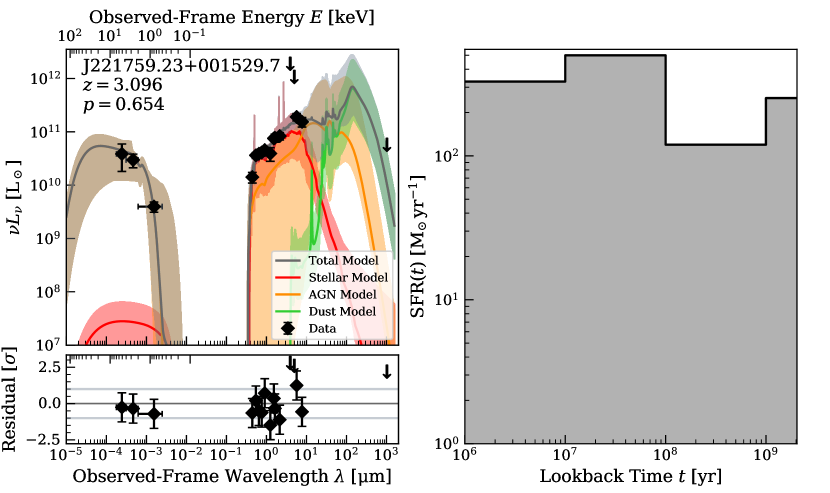
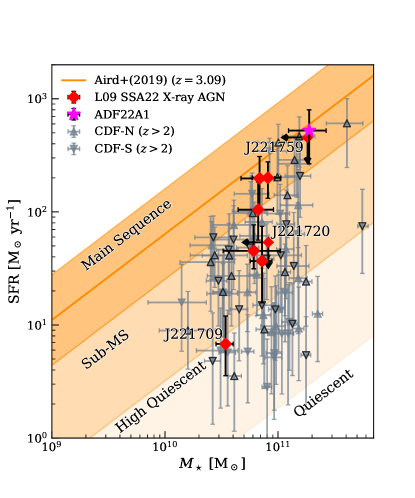
In Table 5 we summarize the SED-fitting derived physical properties of the SSA22 AGN sample. Best-fit SED models and sampled posterior SFHs for the 8 L09 AGN are shown in Figure 4, with ADF22A1 shown in Figure 8 (see Section 4.2). The stellar masses and star formation rates for the SSA22 and CDF samples are shown in Figure 9. We find stellar masses ranging from and black hole masses ranging from for the protocluster AGN, though our measurements of the black hole mass may be complicated by the level of circumnuclear obscuration in the sample. Of the galaxies in the SSA22 sample for which we can successfully constrain the star formation history, half (3/6) are classified as sub-main sequence () or high quiescent () according to the criteria and redshift-dependent main sequence defined by Aird et al. (2019). In particular, J221709.60+001800.1 is identified as a plausible quiescent galaxy, with and . The galaxies consistent with the main sequence (J221735.84+001559.1, J221716.16+001745.8, and J221732.00+001655.6) are typically ALMA-detected, dusty galaxies, with . Of the galaxies with , only J221736.54+001622.6 is ALMA-detected. Our estimates of the SFR for the ALMA Band 7 detected galaxies are compatible with the SFR estimates from Alexander et al. (2016), which were based on a Kennicutt (1998) scaling relationship corrected to a Chabrier (2003) IMF. The Alexander et al. (2016) estimates are systematically larger by a factor of , but this is to be expected when comparing SFR estimates from scaling relations and SED fitting; our fits to these galaxies typically include significant components in the SFH from stars older than 100 Myr, which also heat dust and contribute to the measured . As Alexander et al. (2016) estimated from the flux at 870 µm, well beyond the peak of the AGN IR emission, their SFR estimates are unlikely to be contaminated by AGN emission.
The majority (6/8) of the fits to the SSA22 AGN sample are consistent with heavily obscured AGN growth (), and J221759.23+001529.7 is moderately obscured (–) with . Three of the heavily obscured AGN are Compton-thick (CT) candidates, with (J221709.60+001800.1 is also consistent with Compton-thickness, with ), which makes the estimates of their black hole masses and particularly accretion rates more uncertain, as our X-ray model does not include line emission or reflection, which make important contributions to the X-ray spectra of CT sources. The level of obscuration we measure from our SED fits is consistent with the (typically hard) spectral indices estimated by Lehmer et al. (2009b): notably, they found for J221739.08+001330.7 and for J221732.00+001655.6, both of which we find to be CT candidates.
Only J221720.24+002019.3 is consistent with being lightly obscured or unobscured, with . J221720.24+002019.3 also has low UV-optical attenuation () and our proxy for circumnuclear UV-optical obscuration, , is consistent with an unobscured view of the SMBH, suggesting that this source is a so-called “blue” quasar. This source, along with J221736.54+001622.6 and J221716.16+001745.8 are presented in the literature as Type 1 AGN with broad lines in their rest-frame optical spectra J221720.24+002019.3 in Yamada et al., 2012, J221736.54+001622.6 in Steidel et al., 2003, and J221716.16+001745.8 in Saez et al., 2015. We find that AGN continuum emission makes strong contributions to the optical SED fits for J221720.24+002019.3 and J221736.54+001622.6, but not in the case of J221716.16+001745.8. This may suggest additional dust obscuration along the line of sight in J221716.16+001745.8, beyond the circumnuclear region. The broad line emission from unobscured AGN is one of the primary obstacles to extracting detailed star formation histories; we note that while we fit an AGN continuum component to the rest-frame UV-optical emission, we are unable to account for broad lines, and so the SFH we present here are naturally more uncertain. The ALMA Band 7 detections for J221736.54+001622.6 and J221716.16+001745.8 allow us to place good constraints on their recent star formation, though the constraints on the oldest two stellar age bins are weaker, especially in the case of J221736.54+001622.6, where the strength of the AGN continuum emission dominates over the stellar population at rest-frame wavelengths . In the case of J221720.24+002019.3, the overall shape and normalization of the SFH are not well constrained by our original SED fit, though the non-detection in both ALMA bands suggests low star-formation activity. We find a SFR of (a factor of 3 lower than the upper limit SFR computed from the ALMA limiting flux in Alexander et al. (2016)), and the upper limit on is , suggesting that this galaxy is at most a factor of below the location of the star-forming main sequence at and is likely a sub-MS galaxy. The low SFR is also supported by optical spectroscopy: the SDSS spectrum888Retrieved from http://skyserver.sdss.org/dr17 has a clear, strong 4000 Å break, though at this redshift the 4000 Å break is at the edge of the SDSS sensitivity. The low SFR limits we recover for this source, in combination with the high X-ray luminosity and low obscuration (as measured by both and ), place it in an interesting position in the “story” of AGN growth in the protocluster, as a possible endpoint of AGN evolution, where star formation has stopped and the AGN has blown away obscuring material.
4.2 ADF22A1
| ID | aaTotal stellar mass, integrated over the SFH. | SFRbbStar formation rate, averaged over the last 100 Myr of the SFH. | ccRatio of SFR to the main sequence SFR of Aird et al. (2019). | ddband optical depth of diffuse dust. | eeCosine of the inclination from the AGN axis to the line of sight. | ffSupermassive black hole mass from qsosed model. | ggEddington ratio from qsosed model. | hhNeutral Hydrogen column density along the line of sight. |
|---|---|---|---|---|---|---|---|---|
| () | (dex) | () | ||||||
| J221736.54+001622.6 | ||||||||
| J221739.08+001330.7**Compton-thick (CT) candidates with are highlighted in bold. | ||||||||
| J221709.60+001800.1 | ||||||||
| J221720.24+002019.3 | ${\dagger}$${\dagger}$Upper limits for J221720.24+002019.3 and J221759.23+001529.7 are given at the 99th percentile of the posterior. | |||||||
| J221735.84+001559.1 | ||||||||
| J221759.23+001529.7 | ||||||||
| J221716.16+001745.8 | ||||||||
| J221732.00+001655.6 | ||||||||
| ADF22A1 |
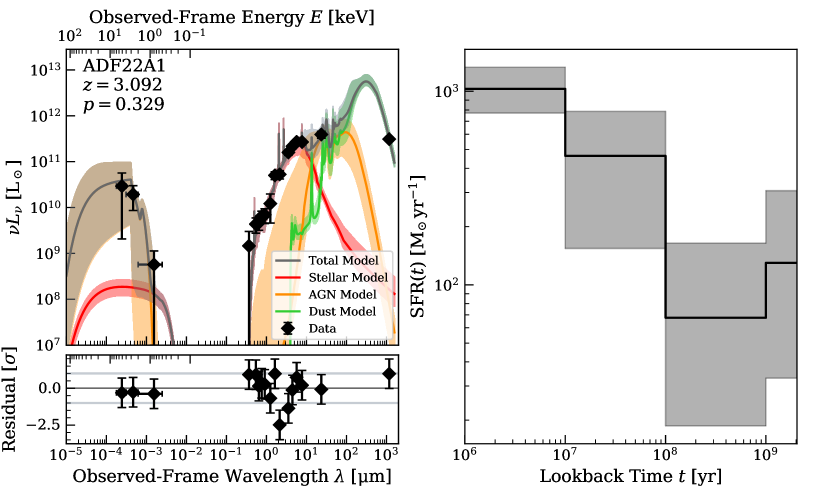
ADF22A1 sits at the opposite end of the typical picture of AGN evolution from J221720.24+002019.3. The ADF22A1 proto-quasar system was identified as an AzTEC 1.1 mm source in Tamura et al. (2010). Further study showed that the system consists at least two optical/NIR sources offset from a millimeter and X-ray source, which is not detected in bands up to a few microns. The smoothed FWHM of the SSA22 photometry we use is larger than the projected offset between the galaxies and the millimeter/X-ray source, so we fit the SED of the entire ADF22A1 system. We show the best-fit model and the sampled posterior SFH in Figure 8. The fit from our models is consistent with the picture of ADF22A1 harboring a heavily obscured/Compton-thick AGN, with , , and . The SFH suggests an initial burst of star formation in the first Gyr after formation, followed by an ongoing, more intense (by a factor of ) burst of star formation in the past Myr. We measure the average star formation over the past Myr as , a factor of smaller than the estimate from the 1.1 mm flux, but still more than twice the SFR of any of the other X-ray selected AGN in our sample. The mass we recover for the system, , is consistent with the high end of the mass estimates from Tamura et al. (2010), . The optical attenuation above is also consistent with the value reported in Tamura et al. (2010) (), and with the level of band attenuation typically measured in SMGs. We note again that our model does not include reflection, and as such the uncertainties on our estimate of are large, though we find that ADF22A1 is likely Compton-thick, as also found by Tamura et al. (2010). As previously mentioned, Compton-thickness renders our estimates of the AGN parameters (particularly ) more uncertain.
The IR emission from the AGN remains highly uncertain due to the lack of mid-IR photometry; JWST observations with MIRI will not only better constrain the AGN IR emission, but allow the resolution of the system into its separate components, including the central X-ray point source, allowing us to separately characterize each component.
5 Discussion
In Section 4 we presented the results of our SED fits to the SSA22 AGN, finding that they are typically obscured main sequence galaxies. In the following sections, we compare the measured properties of the SSA22 AGN to the field AGN, in order to establish whether there are measurable differences in the properties of the protocluster AGN-host galaxy systems that could drive the observed AGN enhancement. We also attempt to connect the properties of the AGN-host galaxy systems to their local environment, and finally to place our results in the context of the ongoing question of what drives the AGN enhancement in the protocluster.
| aaRedshift range of field galaxies. | ||||
|---|---|---|---|---|
| Quantity | No CTbbvalues where galaxies with are excluded from the KS test. | CT Includedccvalues where galaxies with are included in the KS test. | No CT | CT Included |
| 0.086 | 0.114 | |||
| SFR | 0.286 | 0.232 | ||
| 0.094 | 0.013 | 0.205 | 0.104 | |
| 0.984 | 0.716 | 0.990 | 0.351 | |
| 0.489 | 0.276 | 0.735 | 0.599 | |
| 0.480 | 0.210 | 0.998 | 0.300 | |
Note. — ADF22A1 is excluded from all KS tests; J221720.24+002019.3 and J221759.23+001529.7 are excluded from the KS tests on , , and as we cannot effectively constrain their SFH.
5.1 Star Formation and Black Hole Growth in the Protocluster Active Galactic Nuclei
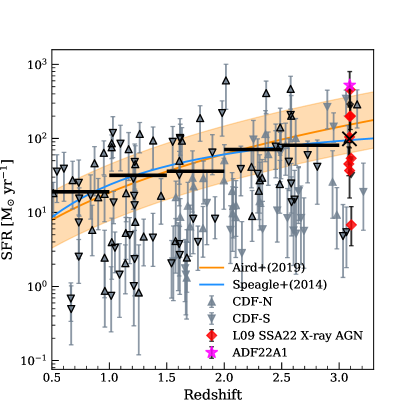
Alexander et al. (2016) previously found, on the basis of IR scaling relations, that the range of SFR of the three IR-detected L09 X-ray AGN is consistent both with AGN in field environments and the overall evolution of the star forming main sequence. On average, we also find that the X-ray detected protocluster AGN hosts are consistent with the star forming main sequence at . In Figure 10 we show the evolution of the main sequence according to both the Speagle et al. (2014) and Aird et al. (2019) prescriptions, along with the SFR of all the GOODS AGN in our sample, up to . We also overlay the SFR of the SSA22 AGN and the sample mean SFR. We find that the average SFR of the L09 X-ray AGN in SSA22 is consistent with both the field AGN in the GOODS fields and the main sequence. While our results suggest that of the L09 X-ray AGN are located below the main sequence (as previously observed in the ADF22-QG1 protocluster AGN by Kubo et al., 2021, 2022), we find that sub-main-sequence evolution is just as common in our sample of -selected AGN in the CDF: of the () AGN, () have . This is consistent also with Aird et al. (2019), which finds a slight preference of X-ray selected AGN to lie below their star-forming main-sequence (see e.g., their Figure 8). The fractions of putative quiescent galaxies with is for the L09 X-ray AGN, and () for the () CDF AGN. We show Kolmogorov-Smirnov (KS) tests on the posterior distributions of SFR and in Table 6, suggesting that the SSA22 AGN are consistent with being drawn from the same underlying population distribution as the high-redshift CDF AGN. We find also that the AGN host galaxies in the protocluster are no more massive on average than AGN hosts in the field with similar X-ray luminosities: excluding the ADF22A1 system and the galaxies for which the AGN-only model is preferred, we find that the ratio of the average stellar mass of the protocluster AGN to the average mass of the GOODS AGN is at most 0.945 ( upper limit) over the redshift range . The CDF comparison samples naturally probe a much larger volume than the SSA22 AGN sample; as such we might expect to find a few more high-mass galaxies in the field sample. When we restrict redshift to we find that the mass ratio is at most 1.020.
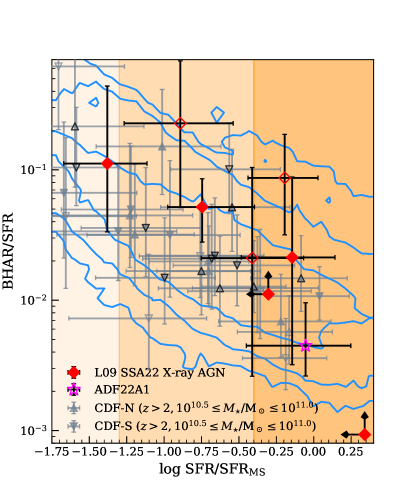
To further establish the relationship between star formation and the black hole growth in the protocluster, we calculated the dimensionless black hole accretion rate (BHAR) to SFR ratio, , for each of our samples. This ratio traces the evolutionary state of the black hole relative to the host galaxy, and may shed light on the accretion history of the AGN, as the BHAR is shown to lag behind the SFR following major accretion episodes, as gas is driven down to the small scales near the nucleus where it can be accreted by the SMBH. is found to be independent of redshift when controlled for mass (e.g. Aird et al., 2019). We calculated the BHAR of our galaxies as , with
| (9) |
and where is the proton mass, is the Thomson scattering cross section, and is the radiative efficiency of the BH. We take and from our SED fits. Following Kubota & Done (2018), we assume a radiative efficiency of . In Figure 11, we show the as a function of , where is computed at the appropriate redshift and stellar mass for each galaxy using the redshift-dependent main sequence from Aird et al. (2019). We find that the SSA22 AGN follow the same trend in as a function of as the field galaxies, indicating that, on the timescales we probe, black hole growth in the protocluster is not proceeding out of pace with galaxy growth at any stage of galaxy evolution. A 1D KS test on the distributions of indicates that protocluster and field galaxies have consistent distributions of regardless of whether we exclude CT candidates () or include them () or whether we limit the test to galaxies within the stellar mass range of the SSA22 AGN, ( without CT candidates and with CT candidates). The stochasticity of AGN accretion produces significant scatter in ; as such it is often useful to calculate the sample average, . We find for the SSA22 AGN, when we exclude CT candidates. For the CDF samples, is consistent with SSA22: over the whole range of mass and , and over and , both excluding CT candidates.
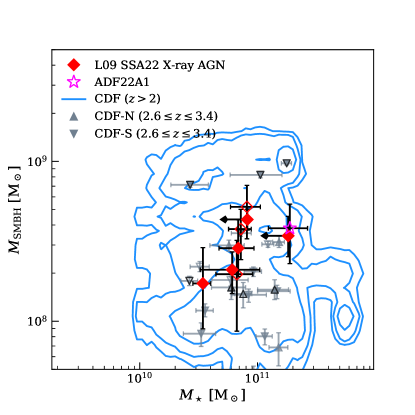
Another possible explanation for the observed AGN fraction enhancement in the protocluster is that the black holes in protocluster AGN may simply be more massive than their field counterparts. In Figure 12 we show the black hole mass of our samples plotted against the stellar mass. Our high-redshift galaxy samples are likely not bulge-dominated (Monson et al. (2021) found that none of the SSA22 X-ray AGN are bulge-dominated by – diagnostics, and that the AGN that are not point-like sources in F160W typically have Sérsic indices ), and as such we lack estimates of the bulge mass. Thus, we are unable to correlate stellar masses strongly with BH masses. We find, however, that the CDF AGN and SSA22 AGN occupy the same general region of the – plane, and that the CDF AGN track very closely with the SSA22 AGN. This is shown also by the KS test results in Table 6; when we limit the field sample to a narrower range of redshifts around , we find that the SMBH mass distributions of the SSA22 and GOODS samples are consistent, with . We additionally computed the posterior distributions on the sample-averaged black hole mass (excluding CT candidates), finding that the upper limit (computed as the 99th percentile of the posterior) on the ratio of the average protocluster SMBH mass (for the 8 L09 AGN) to the average field SMBH mass is 1.43 for field galaxies with . While empirical SBMH mass to stellar mass relationships for local bulge-dominated galaxies may not be applicable to our sample, the recent FOREVER22 suite of SSA22-like protocluster simulations (Yajima et al., 2022) allow us a theoretical point of comparison: we find that our estimates of the SMBH masses of our AGN sample are consistent with the SMBH to stellar mass relationship produced by their sample (see Fig. 11 in Yajima et al., 2022). Finally, we caution that our estimates of the black hole mass are (by necessity, for high- AGN) indirect, based on the theoretical qsosed AGN model, and effectively scale with the AGN luminosity. Thus with weak constraints on the AGN luminosity (as in cases where we have few X-ray counts and no mid-IR observations) the estimated black hole masses may be less reliable.
To examine whether the comparison between the SMBH properties of the SSA22 and CDF AGN is biased by the lack of MIPS fluxes (which constrain the NIR AGN torus emission over a wide range of redshift) in the SSA22 SED fits (excluding ADF22A1), we re-fit the field sample without measurements. We find that the Eddington ratio parameter is the only parameter to show a systematic difference between the two cases: the fits without MIPS have systematically smaller Eddington ratios than those with MIPS. The median offset in is less than 0.3 dex for , increasing to dex as approaches 0.0. However, the uncertainties on also increase with , such that the systematic uncertainty is less than the random uncertainties; we find that the difference between the two measurements is consistent with 0.0 within for the majority of systems. While it is thus likely that we underestimate the Eddington ratio (and consequently BHAR) for some of the SSA22 systems, for which we do not use measurements, we expect the systematic offset to be smaller than the random uncertainties on our measurements of and the additional uncertainties imposed by the heavy obscuration of the highly accreting SSA22 AGN systems. Our overall results should thus be insensitive to the lack of MIPS constraints in our SSA22 SED fits.
5.2 The Possible Role of Local Environment
The SSA22 protocluster is well-suited to attempts at linking galaxy properties to the protocluster environment, largely due to the extent to which the cold-gas features of the intergalactic medium (IGM) have been mapped in the protocluster. A number of star-forming galaxies and AGN in the protocluster are associated with Lyman- blobs (LABs), large scale Ly emission nebulae (Matsuda et al., 2004; Geach et al., 2009), where the Ly emission is believed to be powered by heating from the galaxies embedded within (Geach et al., 2009). The LABs are in turn associated with the large-scale Ly emission filaments imaged with MUSE in Umehata et al. (2019). These reservoirs of cold gas in the IGM could play a role in maintaining the levels of star formation and black hole accretion in the protocluster galaxies by providing a steady supply of cold gas for the galaxies within.
Four of the X-ray AGN, J221739.08+001330.7, J221735.84+001559.1, J221759.23+001529.7, and J221732.00+001655.6, are associated with LABs. These AGN do not clearly deviate from the other AGN in the SSA22 sample in terms of any of the parameters or quantities derived from our model. However, two, J221739.08+001330.7 and J221732.00+001655.6, have the highest of the 8 L09 X-ray AGN. While Geach et al. (2009) also previously noted that the AGN associated with LABs are heavily obscured, whether or not this indicates a greater cold gas density in LAB-associated AGN would require a larger sample and more detailed X-ray modeling, beyond the scope of this work. J221736.54+001622.6 and ADF22A1 (two of the most intrinsically X-ray luminous sources in our sample) are also notably associated with nodes of the IGM filaments.
While it is believed that the Ly emission from these nebulae is likely powered by the AGN embedded within them, it remains unclear whether the reservoirs of cold gas in the IGM traced by the filaments and LABs play any role in the fueling of the AGN. However, the LABs and the large-scale filaments are also consistently associated with star formation - the SMGs detected in Umehata et al. (2014) also co-locate with the filaments, and each of the LABs associated with an AGN in our sample contains an ALMA Band 7 detection, either directly associated with the AGN or offset (Alexander et al., 2016), so it remains likely that the IGM gas reservoirs play some role in supplying the galaxies embedded within them with a supply of cold gas.
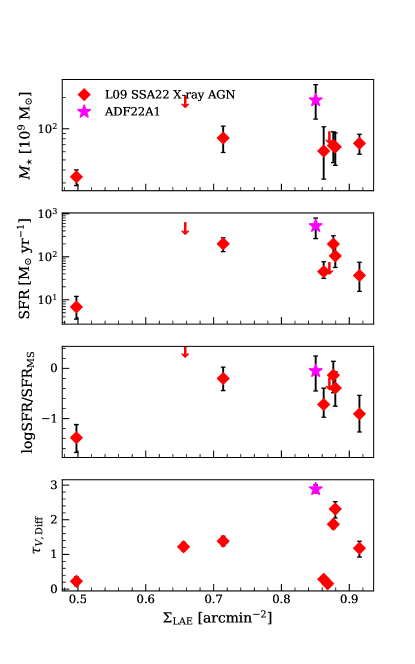
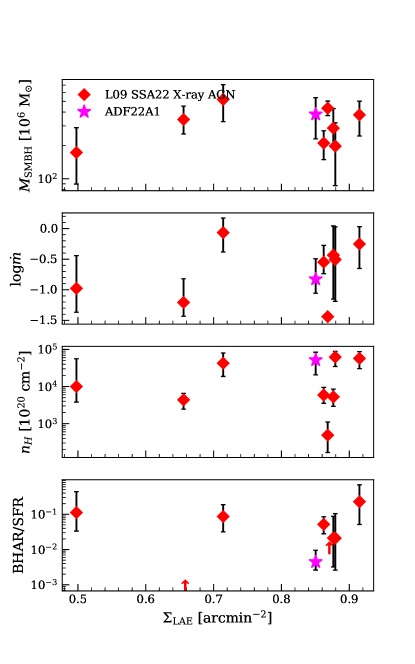
To attempt to correlate the properties of our AGN sample with their location in the protocluster, we calculated , the projected surface density of LAEs from Hayashino et al. (2004), using the same procedure as in Monson et al. (2021) with a Gaussian kernel density estimate with a FWHM999We use a larger FWHM than the used in Monson et al. (2021); we found that a KDE with a FWHM resulted in overestimates of the LAE density near those AGN which are themselves LAEs.. We note, however, that the coherent structure of protocluster LAEs also extends by tens of cMpc along the line of sight (Matsuda et al., 2005). The projected surface density of LAEs does not capture the 3D structure of the protocluster, and can only be used as a general gauge of the protocluster density. In Figure 13 and Figure 14, we show the SED-fitting derived parameters for the SSA22 X-ray AGN and ADF22A1 plotted against the surface density. As previously shown (in, e.g., studies of ADF22: Kubo et al., 2013, 2022; Umehata et al., 2014, 2015), AGN are preferentially found in the denser regions of the protocluster (ADF22A1 is believed to lie near the density peak of the protocluster), though we find that host galaxy properties and SMBH properties are uncorrelated with .
We previously attempted to establish the merger states and recent merger histories of the SSA22 X-ray AGN in Monson et al. (2021). In the Gini- (calculated based on F160W images) plane, which is commonly used as a merger diagnostic, we found that none of the X-ray AGN have the clumpy, uneven flux distributions associated with recent mergers, and are instead consistent with concentrations of light near the center, as might be expected from mainly star-forming galaxies hosting AGN (see Figure 6 in Monson et al., 2021). We also previously employed blind classifications, with our classifiers voting on whether images contained a merger or an isolated galaxy. Based on the presence of close projected companions, 3 of the X-ray AGN (J221736.54+001622.6, J221739.08+001330.7, J221720.24+002019.3) were classified as possible mergers in this way. However, in these cases the redshifts of the projected companions are unknown and the primary galaxies are not exhibiting the disturbed morphologies associated with an interacting companion galaxy. Our updated estimates of the stellar masses for the SSA22 X-ray AGN place them at – (in good agreement with the estimates from Kubo et al., 2015); the EAGLE simulations (McAlpine et al., 2020) suggest that at mergers are most effective at triggering SMBH growth at , so we again find it unlikely that mergers are currently a dominant growth mechanism for SMBHs in the protocluster.
5.3 What Drives the Active Galactic Nuclei Fraction Enhancement in the Protocluster?
We have found that the protocluster environment does not strongly impact the physical properties of the X-ray selected protocluster AGN or their host galaxies, as measured by X-ray-to-IR SED fitting. However, these same X-ray AGN account for a fold increase in the AGN fraction over the field. Given that our results suggest that protocluster AGN and their hosts coevolve in the same way as field AGN, it seems, then, that AGN-triggering events are more common in the protocluster.
SSA22 protocluster galaxies have been shown to be more massive and star forming, on average, than field galaxies, and Monson et al. (2021) found that their SFHs indicated more intense or sustained stellar mass buildup at earlier epochs. As stated above, Monson et al. (2021) previously found that mergers are no more common among the protocluster population than in the field. However, the constraints on the merger fractions from Monson et al. (2021) are weak, and Hine et al. (2016) previously found a marginal merger enhancement based on rest-frame UV visual classifications. We also do not have information about the historic merger fraction in the protocluster, and so it remains possible that past mergers at contributed to the buildup of stellar and BH masses, and to the triggering of the observed AGN. Additionally, the IGM in the protocluster, having been imaged in Ly emission, is known to be denser than in the field, especially in the vicinity of AGN and rapidly growing sub-mm galaxies. Smooth accretion of cold gas from IGM reservoirs leading to secular AGN triggering thus also remains a compelling explanation for the growth of galaxies and their SMBHs in the protocluster.
6 Summary & Conclusions
We have developed a new method for fitting the X-ray to IR SEDs of AGN-hosting galaxies, based on physically-motivated models wherever possible, and implemented it into our SED-fitting code Lightning. We applied our method to the 8 L09 X-ray detected protocluster AGN and the candidate protoquasar ADF22A1 in SSA22, and to a comparison sample of 151 X-ray selected candidate AGN at in the Chandra Deep Fields.
The normal (i.e., non-AGN) star-forming population of the protocluster has previously been shown to host an enhancement of SFR and stellar mass over star-forming galaxies in the field at the same redshift (e.g. Kubo et al., 2015; Kato et al., 2016; Monson et al., 2021). However, we find here that the stellar mass and SFR distribution of the X-ray selected protocluster AGN is consistent with the stellar mass and SFR of X-ray selected field AGN, suggesting that AGN hosts in the mass range we probe grow by the same mechanisms in protocluster and field environments. We also find comparable black hole masses and growth rates in the protocluster and field, suggesting normal black hole growth, and thus normal black hole-galaxy coevolution, in the the X-ray selected protocluster AGN. We interpret these results together with the observed AGN fraction enhancement as suggesting that AGN triggering events are more likely in the protocluster. Given the (albeit weakly constrained) lack of merger enhancement found among protocluster LBGs in Monson et al. (2021), this could indicate secular AGN triggering is more common in the protocluster than the field, possibly due to environmental effects related to the dense IGM in the protocluster.
-
•
We find that SMBH growth in the SSA22 protocluster is largely obscured: 6/8 X-ray selected AGN are heavily obscured, with , and 3/8 are Compton-thick candidates with . The majority of the protocluster AGN, 5/8, also have optical SED fits consistent with optically obscured AGN growth, with .
-
•
At least 3/8 of the SSA22 protocluster AGN have SFHs consistent with sub-MS growth, with . J221720.24+002019.3, which is better-fit by an AGN-only model, is also likely located below the main sequence, with an upper-limit . One of the sub-MS AGN, J221709.60+001800.1 is identified as a probable quiescent galaxy, with .
-
•
The protocluster AGN hosts are no more massive than the field AGN hosts in our sample: in a KS test comparing the stellar mass distributions of the SSA22 and CDF samples, we find a value of at least 0.086, suggesting that the distributions are consistent. Likewise we find a KS value of at least 0.232 for SFR.
-
•
We find that the protocluster AGN hosts are in similar evolutionary states (relative to the main sequence) when compared to the -selected field galaxies: the KS test value on is at least 0.351. Additionally, when controlled for mass, we find that the sample-averaged BHAR/SFR ratio, measuring the rate of SMBH growth relative to host galaxy growth, is also consistent between protocluster and field samples: for the SSA22 protocluster AGN and for the CDF AGN candidates with and .
-
•
Our estimates of the black hole masses of our samples are also consistent () when we limit the field sample to . We constrain the sample-averaged black hole mass of the protocluster AGN to at most 1.43 times that of the the field AGN sample.
-
•
For the ADF22A1 protoquasar system, we find a and a stellar mass . We estimate the black hole mass at , though this estimate is rendered more uncertain by the Compton-thickness of the system; we find . Our new constraints on the properties of this system from panchromatic SED fitting are consistent with the established picture of ADF22A1 as one of the most obscured and highly star-forming systems in the protocluster.
Appendix A Alternative SED Fit for J221716.16+001745.8
| ID | SFR | |||||||
|---|---|---|---|---|---|---|---|---|
| () | (dex) | () | ||||||
| J221716.16+001745.8 |
We show the alternative SED fit for J221716.16+001745.8 in Figure 15 and the derived properties in Table 7, where we have fit using the ALMA Band 7 offset detection rather than the upper limit from the location of the Chandra detection. Our results for this galaxy are not sensitive to this change, with the exception that we recover a much better fit than when we use the upper limit. In the fit discussed in Section 3.4 and Section 4, the uncertainty on the IR contribution of the AGN model (compare the orange bands showing the range of the best of models in Figure 4 and Figure 15) is higher due to the larger uncertainty on the IR emission overall. This results in the alternative fit here having a slightly different and , though both are consistent with the original fit and the uncertainty in due to the heavy X-ray obscuration is larger than the shift in introduced by changing the IR data we use for the fit. The shape of the SFH is only slightly different, in the yr bin, resulting in a slightly smaller SFR, though well within the uncertainties.
Appendix B Active Galactic Nucleus-only Model Fits for SSA22 X-ray AGN
To construct the AGN-only model fits, we set all SFH coefficients in the model to identically 0. The priors, assumptions, and free parameters for the fit are otherwise unchanged from Table 4. We perform the same PPC goodness-of-fit analysis on these fits as described in Section 3.4. For all but two AGN, J221720.24+002019.3, and J221759.23+001529.7, the AGN-only model is ruled out with . The best-fit AGN-only models for these two AGN are shown in Figure 16 and Figure 17.
| AIC | |||
|---|---|---|---|
| ID | w/ stellar pop. | w/o stellar pop. | test value |
| J221720.24+002019.3 | 25.34 | 19.56 | 0.5432 |
| J221759.23+001529.7 | 24.35 | 17.83 | 0.6777 |
To compare these fits to our original model, we use the Akaike information criterion (AIC) and test. AIC values and test values for the galaxies where the AGN-only model is not ruled out are shown in Table 8. As a heuristic, the model with lower AIC should be preferred. The test value represents the probability of the null hypothesis that the more complex model (in our case, the model including stellar population emission) does not provide a significantly improved fit over the simpler model (AGN emission only). We find that the AGN-only model with no stellar population is preferred in both cases.
The recovered , , and , are consistent with the original fits. However, to produce the required amount of optical emission, the AGN-only models necessarily have larger , indicating a less-obscured line-of-sight to the accretion disk, than the models including stellar population emission. While J221720.24+002019.3 is identified in the literature as a spectroscopically confirmed Type 1 AGN, this is not the case for J221759.23+001529.7. The morphology of J221759.23+001529.7 is also extended in F160W, indicating that it is unlikely that AGN continuum emission is dominant across the entire optical-NIR spectrum. Rather, the statistical preference for the AGN-only model may be due to limited NIR constraints.
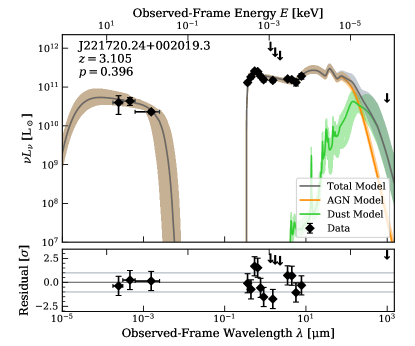

Notably, the AGN for which the AGN-only model is preferred are IR undetected. Our model includes ISM dust heating by the AGN (visible as the green curve in Figure 16 and Figure 17), but heating associated with the AGN produces comparatively little sub-mm emission. For the galaxies in our SSA22 sample with sub-mm detections, the sub-mm constraint gives us an effective handle on the level of star formation, ruling out solutions with zero star formation. J221720.24+002019.3 and J221759.23+001529.7 also have limited NIR constraints. For J221720.24+002019.3 we treat the measurements as upper limits due to possible contamination, such that the stellar emission across the 4000 Å break is poorly constrained. For J221759.23+001529.7 we treat the Spitzer IRAC µm and µm measurements as upper limits, due to contamination by a foreground star, preventing us from clearly separating the tail of the stellar population emission from the AGN torus emission.
References
- Aird et al. (2019) Aird, J., Coil, A. L., & Georgakakis, A. 2019, MNRAS, 484, 4360, doi: 10.1093/mnras/stz125
- Alexander et al. (2016) Alexander, D. M., Simpson, J. M., Harrison, C. M., et al. 2016, MNRAS, 461, 2944, doi: 10.1093/mnras/stw1509
- Ao et al. (2017) Ao, Y., Matsuda, Y., Henkel, C., et al. 2017, ApJ, 850, 178, doi: 10.3847/1538-4357/aa960f
- Astropy Collaboration et al. (2013) Astropy Collaboration, Robitaille, T. P., Tollerud, E. J., et al. 2013, A&A, 558, A33, doi: 10.1051/0004-6361/201322068
- Astropy Collaboration et al. (2018) Astropy Collaboration, Price-Whelan, A. M., Sipőcz, B. M., et al. 2018, AJ, 156, 123, doi: 10.3847/1538-3881/aabc4f
- Azadi et al. (2023) Azadi, M., Wilkes, B., Kuraszkiewicz, J., et al. 2023, ApJ, 945, 145, doi: 10.3847/1538-4357/acbe9c
- Barro et al. (2019) Barro, G., Pérez-González, P. G., Cava, A., et al. 2019, ApJS, 243, 22, doi: 10.3847/1538-4365/ab23f2
- Boquien et al. (2019) Boquien, M., Burgarella, D., Roehlly, Y., et al. 2019, A&A, 622, A103, doi: 10.1051/0004-6361/201834156
- Broos et al. (2012) Broos, P., Townsley, L., Getman, K., & Bauer, F. 2012, AE: ACIS Extract, Astrophysics Source Code Library, record ascl:1203.001. http://ascl.net/1203.001
- Broos et al. (2010) Broos, P. S., Townsley, L. K., Feigelson, E. D., et al. 2010, ApJ, 714, 1582, doi: 10.1088/0004-637X/714/2/1582
- Calzetti et al. (2000) Calzetti, D., Armus, L., Bohlin, R. C., et al. 2000, ApJ, 533, 682, doi: 10.1086/308692
- Chabrier (2003) Chabrier, G. 2003, PASP, 115, 763, doi: 10.1086/376392
- Chevallard & Charlot (2016) Chevallard, J., & Charlot, S. 2016, MNRAS, 462, 1415, doi: 10.1093/mnras/stw1756
- Digby-North et al. (2010) Digby-North, J. A., Nandra, K., Laird, E. S., et al. 2010, MNRAS, 407, 846, doi: 10.1111/j.1365-2966.2010.16977.x
- Doore et al. (2021) Doore, K., Eufrasio, R. T., Lehmer, B. D., et al. 2021, ApJ, 923, 26, doi: 10.3847/1538-4357/ac25f3
- Doore et al. (2023) Doore, K., Monson, E. B., Eufrasio, R. T., et al. 2023, arXiv e-prints, arXiv:2304.06753, doi: 10.48550/arXiv.2304.06753
- Draine & Li (2007) Draine, B. T., & Li, A. 2007, ApJ, 657, 810, doi: 10.1086/511055
- Eufrasio et al. (2017) Eufrasio, R. T., Lehmer, B. D., Zezas, A., et al. 2017, ApJ, 851, 10, doi: 10.3847/1538-4357/aa9569
- Fioc & Rocca-Volmerange (1997) Fioc, M., & Rocca-Volmerange, B. 1997, A&A, 326, 950
- Fioc & Rocca-Volmerange (1999) —. 1999, arXiv e-prints, astro. https://arxiv.org/abs/astro-ph/9912179
- Fitzpatrick (1999) Fitzpatrick, E. L. 1999, PASP, 111, 63, doi: 10.1086/316293
- Foreman-Mackey et al. (2013) Foreman-Mackey, D., Hogg, D. W., Lang, D., & Goodman, J. 2013, Publications of the Astronomical Society of the Pacific, 125, 306, doi: 10.1086/670067
- Fruscione et al. (2006) Fruscione, A., McDowell, J. C., Allen, G. E., et al. 2006, in Society of Photo-Optical Instrumentation Engineers (SPIE) Conference Series, Vol. 6270, Society of Photo-Optical Instrumentation Engineers (SPIE) Conference Series, ed. D. R. Silva & R. E. Doxsey, 62701V, doi: 10.1117/12.671760
- Geach et al. (2009) Geach, J. E., Alexander, D. M., Lehmer, B. D., et al. 2009, ApJ, 700, 1, doi: 10.1088/0004-637X/700/1/1
- Gehrels (1986) Gehrels, N. 1986, ApJ, 303, 336, doi: 10.1086/164079
- Gelman et al. (1996) Gelman, A., Meng, X.-L., & Stern, H. 1996, Statistica Sinica, 6, 733. http://www.jstor.org/stable/24306036
- Gilbertson et al. (2022) Gilbertson, W., Lehmer, B. D., Doore, K., et al. 2022, ApJ, 926, 28, doi: 10.3847/1538-4357/ac4049
- Goodman & Weare (2010) Goodman, J., & Weare, J. 2010, Communications in Applied Mathematics and Computational Science, 5, 65, doi: 10.2140/camcos.2010.5.65
- Guo et al. (2013) Guo, Y., Ferguson, H. C., Giavalisco, M., et al. 2013, ApJS, 207, 24, doi: 10.1088/0067-0049/207/2/24
- Hayashino et al. (2004) Hayashino, T., Matsuda, Y., Tamura, H., et al. 2004, AJ, 128, 2073, doi: 10.1086/424935
- Hine et al. (2016) Hine, N. K., Geach, J. E., Alexander, D. M., et al. 2016, MNRAS, 455, 2363, doi: 10.1093/mnras/stv2448
- Johnson et al. (2021) Johnson, B. D., Leja, J., Conroy, C., & Speagle, J. S. 2021, ApJS, 254, 22, doi: 10.3847/1538-4365/abef67
- Just et al. (2007) Just, D. W., Brandt, W. N., Shemmer, O., et al. 2007, ApJ, 665, 1004, doi: 10.1086/519990
- Kato et al. (2016) Kato, Y., Matsuda, Y., Smail, I., et al. 2016, MNRAS, 460, 3861, doi: 10.1093/mnras/stw1237
- Kennicutt (1998) Kennicutt, Robert C., J. 1998, ApJ, 498, 541, doi: 10.1086/305588
- Kroupa (2001) Kroupa, P. 2001, MNRAS, 322, 231, doi: 10.1046/j.1365-8711.2001.04022.x
- Kubo et al. (2015) Kubo, M., Yamada, T., Ichikawa, T., et al. 2015, ApJ, 799, 38, doi: 10.1088/0004-637x/799/1/38
- Kubo et al. (2013) Kubo, M., Uchimoto, Y. K., Yamada, T., et al. 2013, ApJ, 778, 170, doi: 10.1088/0004-637x/778/2/170
- Kubo et al. (2021) Kubo, M., Umehata, H., Matsuda, Y., et al. 2021, ApJ, 919, 6, doi: 10.3847/1538-4357/ac0cf8
- Kubo et al. (2022) —. 2022, ApJ, 935, 89, doi: 10.3847/1538-4357/ac7f2d
- Kubota & Done (2018) Kubota, A., & Done, C. 2018, MNRAS, 480, 1247, doi: 10.1093/mnras/sty1890
- Lehmer et al. (2009a) Lehmer, B. D., Alexander, D. M., Geach, J. E., et al. 2009a, ApJ, 691, 687, doi: 10.1088/0004-637X/691/1/687
- Lehmer et al. (2009b) Lehmer, B. D., Alexander, D. M., Chapman, S. C., et al. 2009b, MNRAS, 400, 299, doi: 10.1111/j.1365-2966.2009.15449.x
- Lehmer et al. (2013) Lehmer, B. D., Lucy, A. B., Alexander, D. M., et al. 2013, ApJ, 765, 87, doi: 10.1088/0004-637X/765/2/87
- Lehmer et al. (2017) Lehmer, B. D., Eufrasio, R. T., Markwardt, L., et al. 2017, ApJ, 851, 11, doi: 10.3847/1538-4357/aa9578
- Lehmer et al. (2019) Lehmer, B. D., Eufrasio, R. T., Tzanavaris, P., et al. 2019, ApJS, 243, 3, doi: 10.3847/1538-4365/ab22a8
- Leja et al. (2018) Leja, J., Johnson, B. D., Conroy, C., & van Dokkum, P. 2018, ApJ, 854, 62, doi: 10.3847/1538-4357/aaa8db
- Luo et al. (2017) Luo, B., Brandt, W. N., Xue, Y. Q., et al. 2017, ApJS, 228, 2, doi: 10.3847/1538-4365/228/1/2
- Lusso & Risaliti (2017) Lusso, E., & Risaliti, G. 2017, A&A, 602, A79, doi: 10.1051/0004-6361/201630079
- Magnelli et al. (2013) Magnelli, B., Popesso, P., Berta, S., et al. 2013, A&A, 553, A132, doi: 10.1051/0004-6361/201321371
- Martini et al. (2013) Martini, P., Miller, E. D., Brodwin, M., et al. 2013, ApJ, 768, 1, doi: 10.1088/0004-637X/768/1/1
- Matsuda et al. (2004) Matsuda, Y., Yamada, T., Hayashino, T., et al. 2004, AJ, 128, 569, doi: 10.1086/422020
- Matsuda et al. (2005) —. 2005, ApJ, 634, L125, doi: 10.1086/499071
- McAlpine et al. (2020) McAlpine, S., Harrison, C. M., Rosario, D. J., et al. 2020, MNRAS, 494, 5713, doi: 10.1093/mnras/staa1123
- Monson et al. (2021) Monson, E. B., Lehmer, B. D., Doore, K., et al. 2021, ApJ, 919, 51, doi: 10.3847/1538-4357/ac0f84
- Muñoz Rodríguez et al. (2023) Muñoz Rodríguez, I., Georgakakis, A., Shankar, F., et al. 2023, MNRAS, 518, 1041, doi: 10.1093/mnras/stac3114
- Noll et al. (2009) Noll, S., Burgarella, D., Giovannoli, E., et al. 2009, A&A, 507, 1793, doi: 10.1051/0004-6361/200912497
- Nowak et al. (2012) Nowak, M. A., Neilsen, J., Markoff, S. B., et al. 2012, ApJ, 759, 95, doi: 10.1088/0004-637X/759/2/95
- Pérez-González et al. (2010) Pérez-González, P. G., Egami, E., Rex, M., et al. 2010, A&A, 518, L15, doi: 10.1051/0004-6361/201014593
- Predehl & Schmitt (1995) Predehl, P., & Schmitt, J. H. M. M. 1995, A&A, 293, 889
- Rubin (1984) Rubin, D. B. 1984, The Annals of Statistics, 12, 1151. http://www.jstor.org/stable/2240995
- Saez et al. (2015) Saez, C., Lehmer, B. D., Bauer, F. E., et al. 2015, MNRAS, 450, 2615, doi: 10.1093/mnras/stv747
- Sawicki (2012) Sawicki, M. 2012, PASP, 124, 1208, doi: 10.1086/668636
- Schlafly & Finkbeiner (2011) Schlafly, E. F., & Finkbeiner, D. P. 2011, ApJ, 737, 103, doi: 10.1088/0004-637X/737/2/103
- Speagle et al. (2014) Speagle, J. S., Steinhardt, C. L., Capak, P. L., & Silverman, J. D. 2014, ApJS, 214, 15, doi: 10.1088/0067-0049/214/2/15
- Stalevski et al. (2016) Stalevski, M., Ricci, C., Ueda, Y., et al. 2016, MNRAS, 458, 2288, doi: 10.1093/mnras/stw444
- Steidel et al. (2003) Steidel, C. C., Adelberger, K. L., Shapley, A. E., et al. 2003, ApJ, 592, 728, doi: 10.1086/375772
- Tamura et al. (2009) Tamura, Y., Kohno, K., Nakanishi, K., et al. 2009, Nature, 459, 61, doi: 10.1038/nature07947
- Tamura et al. (2010) Tamura, Y., Iono, D., Wilner, D. J., et al. 2010, ApJ, 724, 1270, doi: 10.1088/0004-637X/724/2/1270
- Tozzi et al. (2022) Tozzi, P., Pentericci, L., Gilli, R., et al. 2022, arXiv e-prints, arXiv:2203.02208. https://arxiv.org/abs/2203.02208
- Umehata et al. (2014) Umehata, H., Tamura, Y., Kohno, K., et al. 2014, MNRAS, 440, 3462, doi: 10.1093/mnras/stu447
- Umehata et al. (2015) —. 2015, ApJ, 815, L8, doi: 10.1088/2041-8205/815/1/L8
- Umehata et al. (2017) —. 2017, ApJ, 835, 98, doi: 10.3847/1538-4357/835/1/98
- Umehata et al. (2019) Umehata, H., Fumagalli, M., Smail, I., et al. 2019, Science, 366, 97, doi: 10.1126/science.aaw5949
- Vito et al. (2020) Vito, F., Brandt, W. N., Lehmer, B. D., et al. 2020, A&A, 642, A149, doi: 10.1051/0004-6361/202038848
- Wilms et al. (2000) Wilms, J., Allen, A., & McCray, R. 2000, ApJ, 542, 914, doi: 10.1086/317016
- Xue et al. (2016) Xue, Y. Q., Luo, B., Brandt, W. N., et al. 2016, ApJS, 224, 15, doi: 10.3847/0067-0049/224/2/15
- Yajima et al. (2022) Yajima, H., Abe, M., Khochfar, S., et al. 2022, MNRAS, 509, 4037, doi: 10.1093/mnras/stab3092
- Yamada et al. (2012) Yamada, T., Matsuda, Y., Kousai, K., et al. 2012, ApJ, 751, 29, doi: 10.1088/0004-637X/751/1/29
- Yang et al. (2020) Yang, G., Boquien, M., Buat, V., et al. 2020, MNRAS, 491, 740, doi: 10.1093/mnras/stz3001
- Yang et al. (2022) Yang, G., Boquien, M., Brandt, W. N., et al. 2022, arXiv e-prints, arXiv:2201.03718. https://arxiv.org/abs/2201.03718