ALMA 1.1mm Observations of a Conservative Sample of High Redshift Massive Quiescent Galaxies in SHELA
Abstract
We present a sample of 30 massive (log) quiescent galaxies selected from the Spitzer-HETDEX Exploratory Large Area (SHELA) Survey and observed at 1.1mm with Atacama Large Millimeter/submillimeter Array (ALMA) Band 6 observations. These ALMA observations would detect even modest levels of dust-obscured star-formation, on order of at at a level, allowing us to quantify the amount of contamination from dusty star-forming sources in our quiescent sample. Starting with a parent sample of candidate massive quiescent galaxies from the Stevans et al. (2021) v1 SHELA catalog, we use the Bayesian Bagpipes spectral energy distribution fitting code to derive robust stellar masses () and star-formation rates (SFRs) for these sources, and select a conservative sample of 36 candidate massive () quiescent galaxies, with specific SFRs at below the Salmon et al. (2015) star-forming main sequence at . Based on ALMA imaging, six of these candidate quiescent galaxies have the presence of significant dust-obscured star-formation, thus were removed from our final sample. This implies a contamination rate from dusty star-forming galaxies with our selection criteria using the v1 SHELA catalog. This conservatively-selected quiescent galaxy sample at will provide excellent targets for future observations to better constrain how massive galaxies can both grow and shut-down their star-formation in a relatively short time period.
1 Introduction
Traditionally, it is well established observationally that galaxies follow a strong bimodal color and morphological distribution. Galaxies that are disk dominated and star-forming show strong blue colors, whereas spheroid dominated galaxies that have stopped forming stars and have predominantly old stellar populations are generally red (Baldry et al., 2004; Bell et al., 2004; Balogh et al., 2004). While recent results have pointed to a more nuanced understanding of galaxy colors and populations, and exceptions exist within this bimodality (Fraser-McKelvie & Cortese, 2022; Newman et al., 2018), the majority of galaxy populations still fall within this dichotomy, providing us a powerful tool in characterizing galaxies. The most massive galaxies in the local Universe are also quiescent, forming stars well below the stellar mass and star-formation relation. The stellar mass and number densities of these galaxies has increased significantly since , while the mass density of star-forming galaxies have stayed roughly constant (e.g. Brammer et al., 2011; Kriek et al., 2006; Fang et al., 2012; Muzzin et al., 2013; Faber et al., 2007; Brennan et al., 2015). This implies that there is some physical mechanisms causing star-formation activities to cease, commonly referred to as the process of “quenching”.
To attempt to understand the dominant mechanisms responsible for quenching, one can turn to simulations of galaxy formation. Modern theoretical models are able to reproduce the present day observed quiescent population through a combination of physical effects (e.g. active galactic nuclei (AGN) activity, disk instabilities, mergers). There is now a general consensus that the dominant mechanism leading to the continuation of quenching, suppressing star-formation not only on short timescales but producing galaxies that remain passive through time, is related to feedback from active galactic nuclei (AGN feedback) (e.g. Choi et al., 2014; Springel et al., 2005; Fabian, 2012; King & Pounds, 2015; Somerville & Davé, 2015, and references within).
Historically it has been a challenge for modern theoretical models and simulations to reproduce the observed population of massive quiescent galaxies at higher redshifts (), with most models and simulations severely under-predicting the number densities of quiescent sources compared to observations (Brennan et al., 2015; Merlin et al., 2018, 2019; Valentino et al., 2020; Cecchi et al., 2019). Constraining when these galaxies appear in the Universe and their abundance at high redshifts can provide critical constraints on the physics responsible for forming and evolving massive galaxies in the early Universe.
Many studies have measured the number densities of quiescent galaxies or the quiescent fraction out to high redshifts using selection criteria based on broadband colors and physical properties derived from photometric spectral energy distribution (SED) fitting (e.g. Davé et al., 2019; Muzzin et al., 2013; Spitler et al., 2014; Brennan et al., 2015; Stefanon et al., 2015; Merlin et al., 2018, 2019; Schreiber et al., 2018; Glazebrook et al., 2017; Forrest et al., 2020; Valentino et al., 2020; Dickey et al., 2021), while recent studies with JWST find a significant population of massive quiescent galaxies at (Carnall et al., 2022), implying that star-formation occurs on faster timescales and quenching more efficiently than predicted by most models. However, in order to fully understand the timescale of formation for these galaxies, we not only need to identify these galaxies, we must also gather a consensus of their number densities across redshifts. Currently, number densities for massive quiescent galaxy samples at high redshift often differ from one study to another, largely due to differing definitions of quiescence as well as the fact that these surveys have typically probed relatively small volumes contributing to large statistical uncertainties and high field-to-field variance.
Stevans et al. (2021) attempted to overcome this statistical uncertainty by performing the current largest volume systematic search for massive quiescent galaxies in the early universe using deep multi-wavelength imaging across a wide area within the Spitzer/HETDEX Exploratory Large-Area (SHELA) field (Papovich et al., 2016). Stevans et al. (2021) presented a photometric catalog, along with a catalog of galaxy properties from SED-fitting for massive galaxies () at . Due to the red nature these galaxies in the optical – infrared (IR) range, often times optical-IR selected samples of high-redshift massive quiescent galaxies are contaminated by lower redshift dust obscured star-forming galaxies. Thus, while Stevans et al. (2021) initially selected a sample of 500 quiescent candidate galaxies, in order to limit contamination, they only published an extremely conservative sample of nine candidate massive quiescent galaxies which satisfied all of their cuts even when including a redshift-luminosity prior. This represents a lower limit on the number density in the SHELA field. For this study we seek to improve upon selection by investigating potential contaminants in the Stevans et al. (2021) parent sample, prior to the application of a redshift-luminosity prior.
The somewhat limited depth of the ground-based optical observations mean that many candidate quiescent galaxies have SEDs which are also consistent with dusty star-forming galaxies. The presence of dust suppresses emission at UV and optical ranges, while heating of this dust by massive stars results in increased flux at far-IR (FIR) or sub-millimeter wavelengths, allowing us to easily distinguish between star-forming and quiescent galaxies that may look similar in the optical-IR range. The deployment of the Atacama Large Millimeter Array (ALMA) allows constraints on the dust emission of the massive galaxy population (e.g. Schreiber et al., 2017; Casey et al., 2018; Capak et al., 2015; Maiolino et al., 2015a; Scoville et al., 2016). By looking at candidate massive quiescent galaxies through ALMA, we can confidently constrain the presence of obscured star-formation across large redshift ranges, thus ruling out dusty star-forming sources in samples (Schreiber et al., 2018; Santini et al., 2019).
In this paper we present the results from ALMA followup of 100 of the original sample of quiescent candidates from Stevans et al. (2021). We improve upon their selection by deriving galaxy properties from a conservative and more robust SED-fitting re-analysis of these 100 candidates. Using both eazy and Bagpipes, we constrain photometric redshifts and physical parameters of each galaxy, further honing those which are likely to be truly quiescent. We present ALMA Cycle 7 Band 6 1.1 mm observations for these sources to probe for obscured star-formation, ultimately arriving at a higher-confidence and more complete sample of massive quiescent galaxies. This paper is organized as follows: in Section 2 we present our parent sample from SHELA. Our method of determining photometric redshifts with eazy and deriving galaxy properties with Bagpipes is described in Section 3. Our ALMA data and measurements are detailed in Section 4. We discuss the expected contamination of our selection process based on ALMA results in Sections 5 and 6, and we summarize our work and discuss future work in Section 7. Where applicable, we assume a cosmology of H0=70 km s-1 Mpc-1, =0.3 and = 0.7. All magnitudes given are in the AB system (Oke & Gunn, 1983).
2 Data
We select our sample of massive quiescent galaxies from the SHELA survey. The SHELA dataset includes modest depth (22.6 AB mag, 50% completeness) 3.6 m and 4.5 m imaging from Spitzer/IRAC (Papovich et al., 2016), u’g’r’i’z’ imaging from the Dark Energy Camera over 18 deg2 (DECam; Wold et al. (2019)), VISTA J and Ks photometry from the VICS82 survey (Geach et al. 2017), and a growing database of full-field IFU spectroscopy from Hobby-Eberly Telescope Dark Energy Survey (HETDEX; Hill et al., 2008; Gebhardt et al., 2021), the HETDEX observations in SHELA are presently 20% complete. Stevans et al. (2021) also obtained imaging with NEWFIRM on the KPNO Mayall 4m with the NEWFIRM HETDEX Survey (NHS; PI Finkelstein), a moderately deep (2.1 m) near-infrared imaging survey, adding deeper =22.4 mag (5) imaging across 22 deg2. These -band data reduce the fraction of catastrophic errors in photometric redshifts and measure robust star-formation rates (SFRs) by breaking the age-dust degeneracy. The SHELA field has also been observed by Herschel/SPIRE at 0.25–0.5mm (PI Viero; Viero et al. (2014)), however, these data are very shallow, sensitive to obscured SFRs at , and at , much higher than the expected SFRs of the contaminants we search for here, therefore, these data were not included in the analysis presented.
2.1 Initial Sample
Stevans et al. (2021) constructed a multi-wavelength (0.4-4.5 m) -band-selected catalog, using Tractor (Lang et al., 2016) to deblend the IRAC photometry. To perform their selection of massive galaxies at 3, Stevans et al. (2021) required a or greater detection significance in , a or greater detection in IRAC 3.6 m, and a -band S/N , as well as a measurement in all optical DECam bands to allow for reliable constraints on . Stevans et al. (2021) then used eazy-py 111Version 0.2.0-16-g6ab4498; https://github.com/gbrammer/eazy-py, based on the eazy code (Brammer et al., 2008), to measure photometric redshifts and stellar population properties for all 1.53 million catalogued galaxies in SHELA. To fit galaxy SEDs, eazy-py finds the linear combination of 12 Flexible Stellar Population Synthesis (FSPS) templates (Conroy et al. (2009), Conroy & Gunn (2010)) that minimizes the with respect to the fluxes in all available photometric bands. For this initial sample, Stevans et al. (2021) ran eazy-py with flat priors and selected a parent sample of 3684 massive galaxies (log which have significant detection in and both IRAC bands with of their integrated photometric redshift probability density () at . Of these galaxies, Stevans et al. (2021) found 506 likely quiescent sources, with log(sSFR/yr.
Stevans et al. (2021) also explored the possibility of contamination by red galaxies at low redshift, which can have SED shapes that appear similar to quiescent galaxies within our filter set. They attempted to minimize contamination by using an apparent magnitude prior, which applies a Bayesian prior based on a source’s apparent magnitude. eazy has a built in prior, derived based on the luminosity functions of the De Lucia & Blaizot (2007) semi-analytic model (SAM), which resulted in only nine of the original 506 quiescent candidates being classified as massive quiescent galaxies. Stevans et al. (2021) noted that this likely results in significant incompleteness in the published sample.
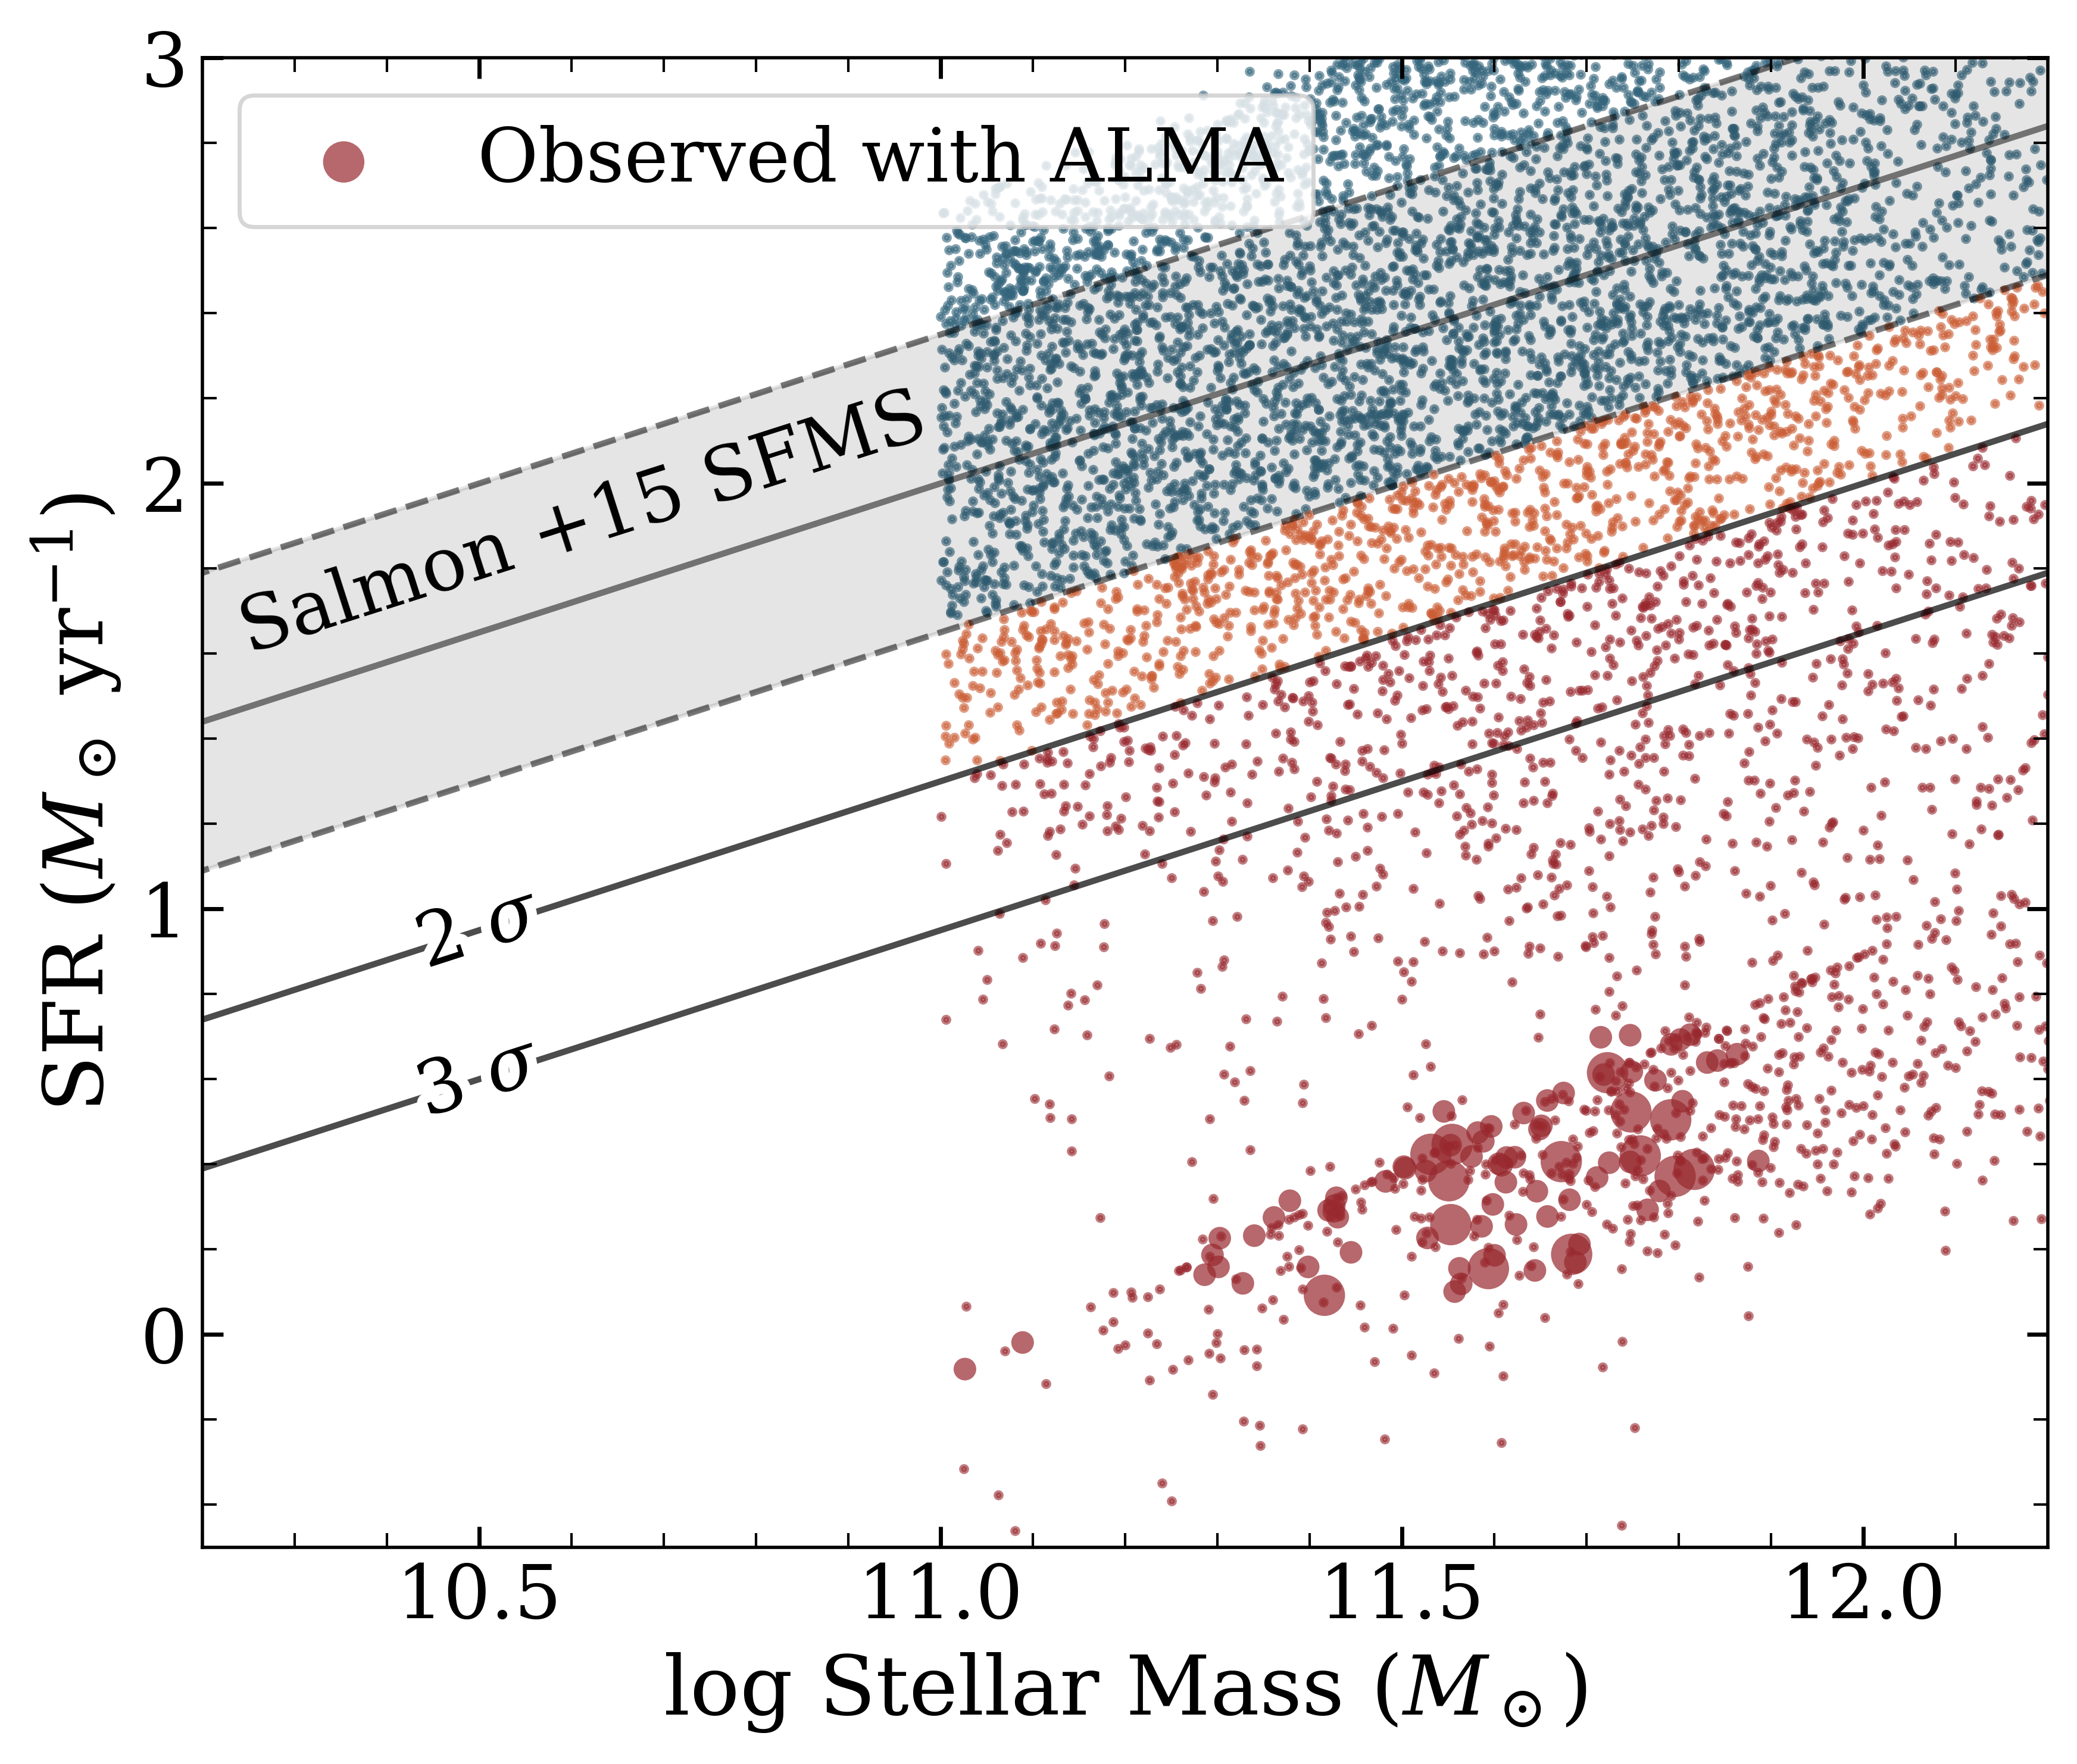
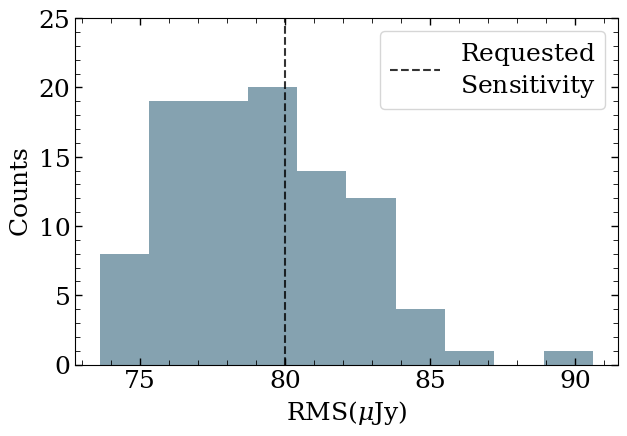
In this study, we chose to revisit their initial parent sample to investigate the contamination by low redshift dusty sources. To achieve this, ALMA Cycle 7 Band 6 1.1 mm observations (rms = 80Jy) were obtained for a selected subsample of 100/506 massive quiescent candidates (P.I. Finkelstein). The target sample is selected to span , log() = 11.1 – 11.9, 20 22, with log(sSFR/yr (Figure 1). We perform the subsequent analysis on this subset of 100 candidate massive quiescent candidates.
| Parameter | Prior | limits | ||
|---|---|---|---|---|
| age / Gyr | Uniform | (0.1, 15) | ||
| Uniform | (1, 15) | |||
| log | Uniform | (-4, 2) | ||
| Uniform | (0, 2.5) | |||
| , timescale of decrease in SFH | Logarithmic | (0.3, 10) | ||
| Uniform | (0, 8) | |||
| , deviation from Calzetti slope | Gaussianμ=0,σ=0.1 | (-0.3, 0.3) | ||
| B, 2175 ÅBump Strength | Uniform | (0, 5) | ||
| eazy P(z) | variable |
3 Selecting Massive Quiescent Galaxies
3.1 Photometric Redshifts with eazy
While Stevans et al. (2021) performed SED fitting using the python version of eazy, eazy-py, we elected to perform an independent photometric redshift selection using the more well-tested command-line version of eazy, using the same set of twelve FSPS (Conroy et al. (2009),
Conroy & Gunn (2010)) templates (“tweak_fsps_QSF_12_v3”) as Stevans et al. (2021), which utilize a Chabrier (2003) initial mass function, Kriek & Conroy (2013) dust law, and solar metallicity. These FSPS models span
a wide range of galaxy types (star-forming, quiescent, dusty), with different realistic star-formation histories (SFH; bursty and slowly rising). The best-fit combination of templates is
determined through minimization.
As described above, Stevans et al. (2021) elected to include a redshift-luminosity prior in their selection of quiescent galaxies. eazy has such a built-in prior, based on the De Lucia & Blaizot (2007) SAM. These priors are typically peaked at low-redshift with a tail to higher redshift, with the tail becoming more prominent at fainter magnitudes. This prior will typically make any low-redshift solution be the dominant solution, even if the higher-redshift solution is a better fit to the photometry. However, the accuracy of luminosity function of galaxies in the De Lucia & Blaizot (2007) SAM is in doubt, as the red () galaxy density at in this SAM under-predicts the observed density by a factor of (Marchesini & van Dokkum, 2007). Therefore, we elect to perform our SED fitting without a redshift-luminosity prior to mitigate the possible effects of an unreliable prior.
To select our candidate high redshift sources, we require the integral of the normalized redshift probability distribution function (PDF) to be for , compared to Stevans et al. (2021) cut of for . Of our initial sample of 100 candidate quiescent galaxies observed with ALMA, 61 satisfied this photometric redshift cut, forming our high-redshift sample.
3.2 SED Fitting with Bagpipes
While eazy provides a robust photometric redshift determination, due to the small set of templates, it has a limited ability to explore the full parameter space of physical properties of galaxies. Thus, in order to determine the stellar mass and star formation rates of our sources, we utilize the Bagpipes modeling code. Bagpipes is a Bayesian spectral fitting code which models the emission from galaxies from the far-ultraviolet to the millimeter regime, allowing the user to build up complex models for fitting, with user-defined stellar population synthesis models, star formation histories, and dust attenuation and emission models. Bagpipes is a Python tool, and can fit these models to arbitrary combinations of spectroscopic and photometric data using the MultiNest nested sampling algorithm (Carnall et al., 2018).
After using eazy to generate our sample of high redshift sources, we run Bagpipes on the SHELA observations. We modify Bagpipes to take as input the redshift probability distribution as determined by eazy as a prior on the modelled redshift. We further force Bagpipes to ignore any potential low-redshift solution (already limited to 30% of the redshift probability density) by setting P( 2.5) to zero. This allows us to assume that the high-redshift solution is generally correct, essentially implementing an additional prior that each source is at , but also to generate a posterior probability distribution of the stellar masses and SFRs of each source with uncertainties inclusive of the photometric redshift uncertainties. We elected to include the photometric redshift prior since eazy is optimized for photometric redshift recovery, whereas Bagpipes is allowed to explore a large range of parameter space. Furthermore, allowing for lower redshift solutions would result in unphysical marginalized uncertainties on the physical parameters of interest, which would combine both low- and high-redshift solutions. Therefore, by constraining the redshift space, we force Bagpipes to explore a wider range of galaxy parameters within the likely redshift of each source.
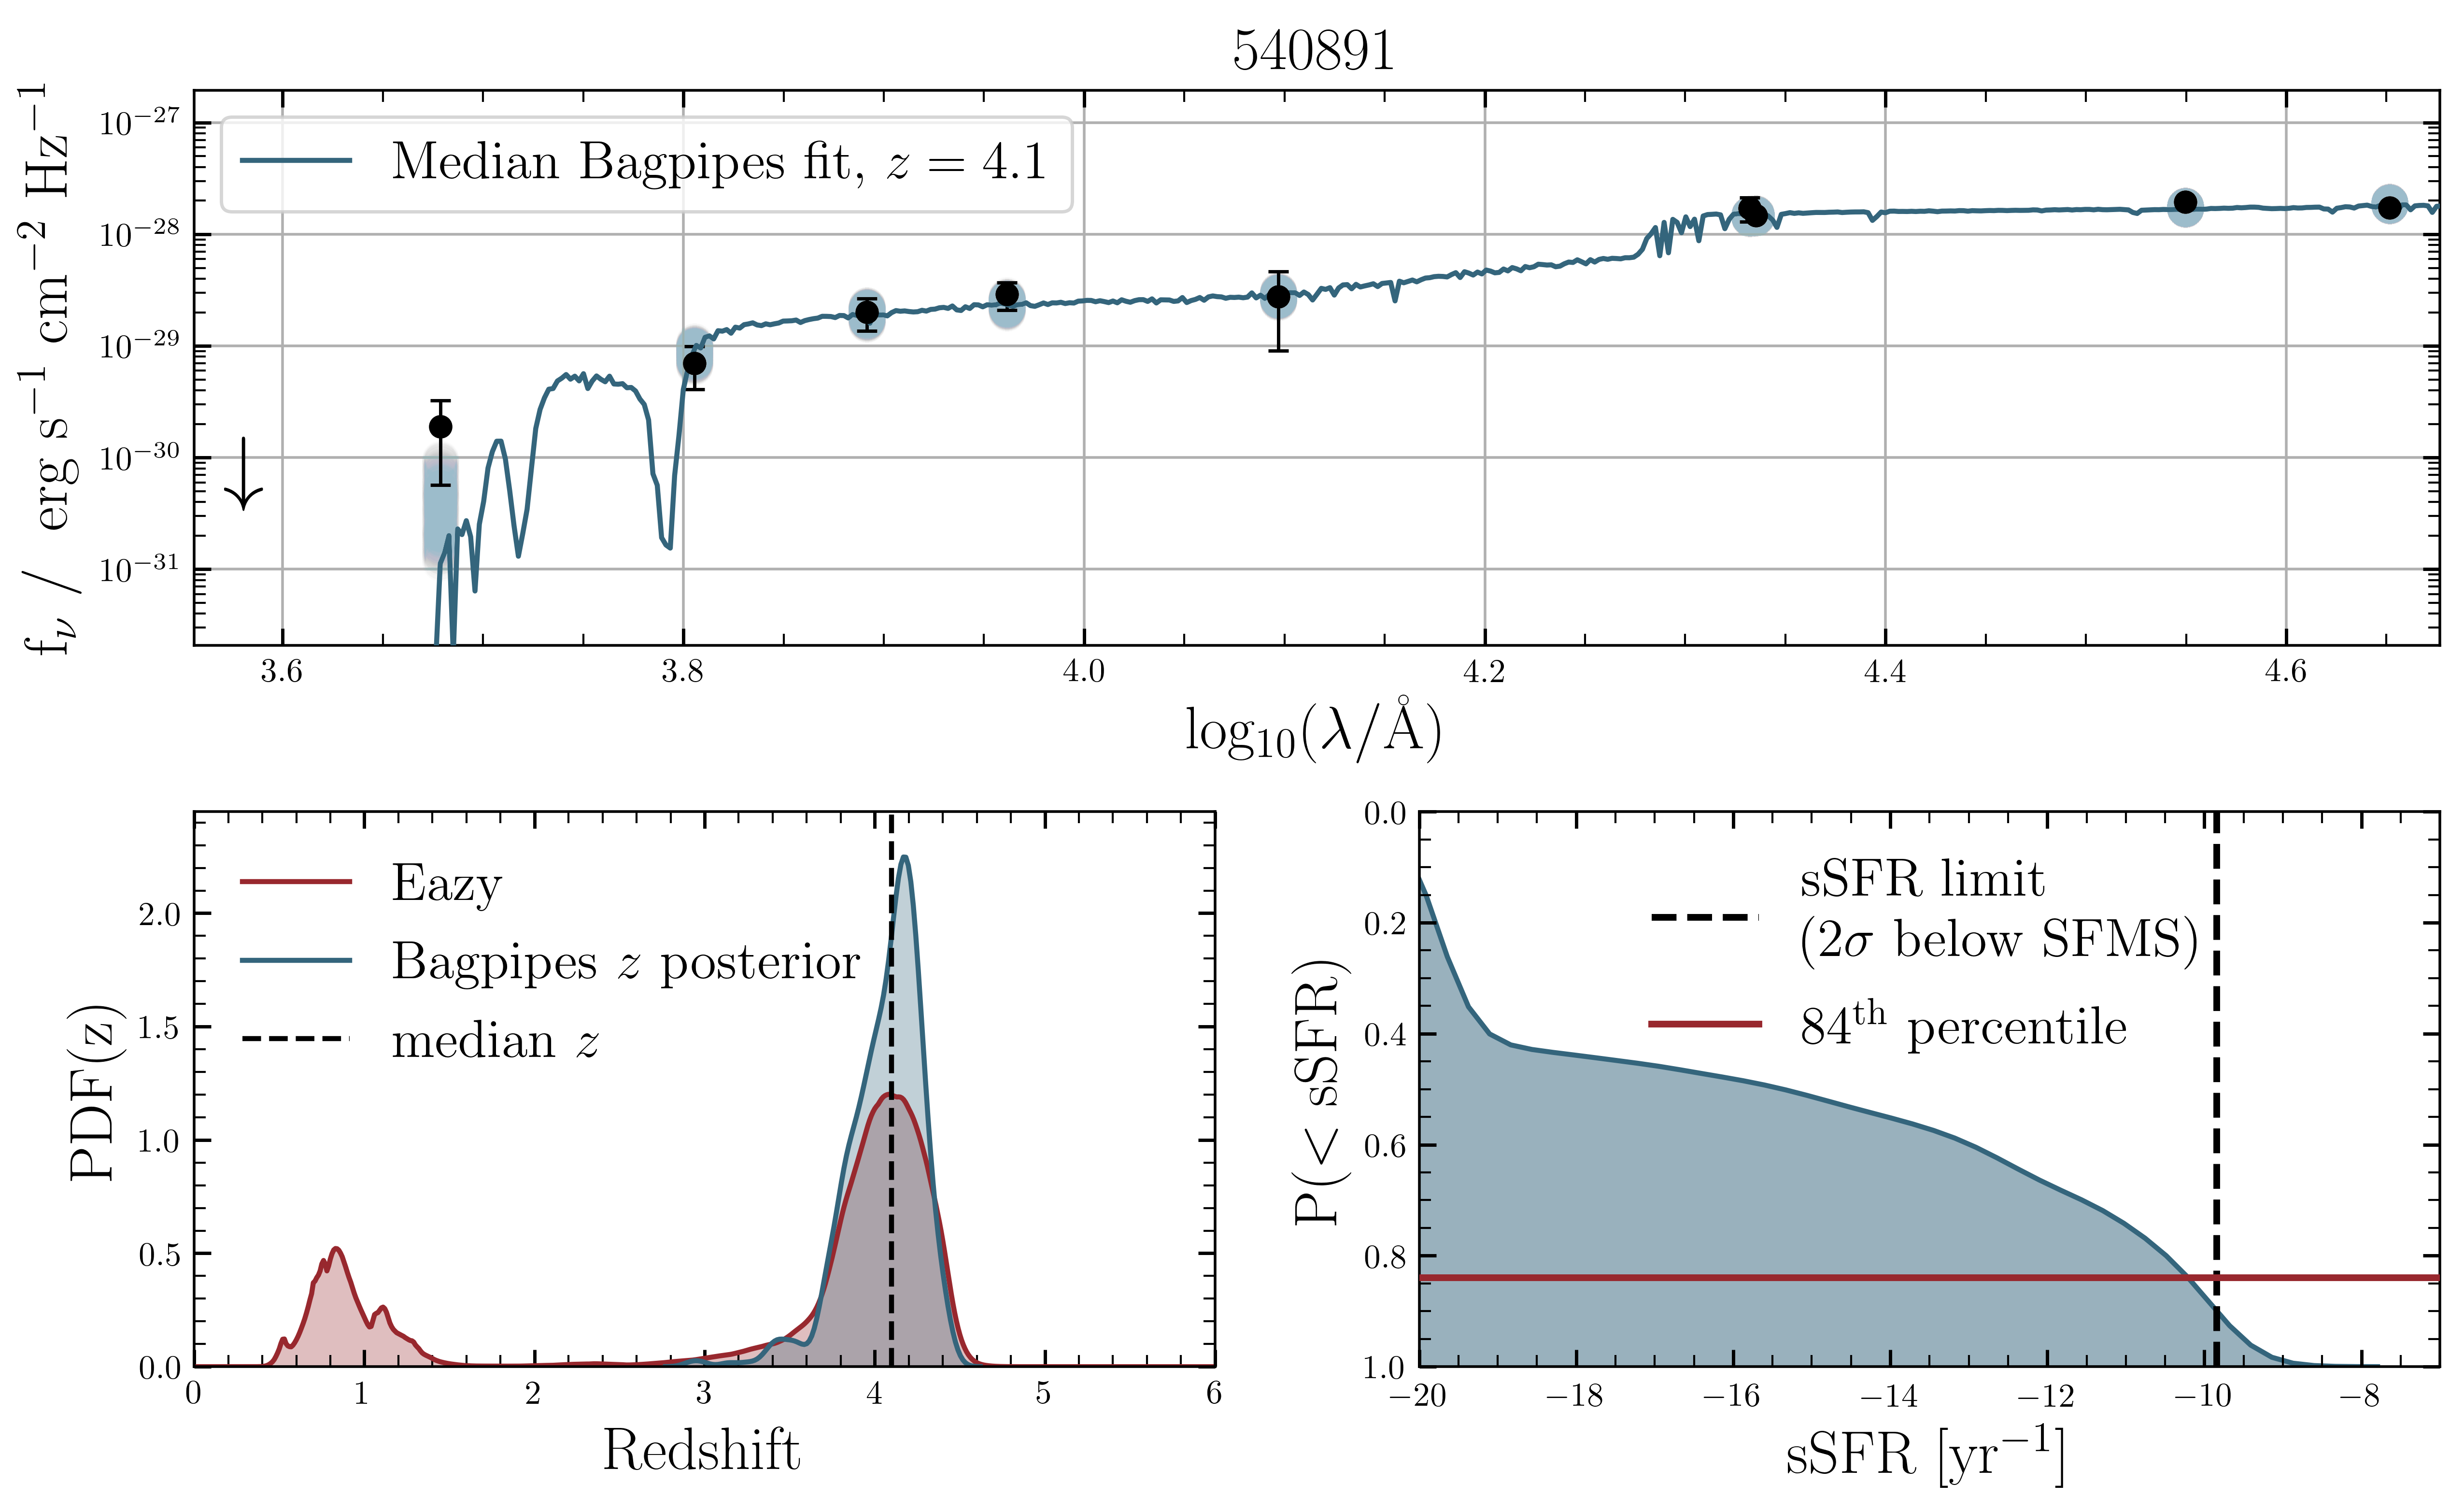
As our parent sample was initially selected to be quiescent, each galaxy was fit with a declining exponential star-formation history with a logarithmic prior on , the timescale of star formation decline; the complete fit parameters are listed in Table 1. We also compared Bagpipes ability to probe the complete parameter space by changing the number of live points (n_live) in the MCMC fit and found that a value of 3000 live points produces the best fit results within a reasonable fit time. Each SED fit is returned with a posterior distribution in mass and SFR (an example is shown in Figure 2), from which we classify sources as quiescent based on the distribution of the sSFR posterior. SEDs for the entire high redshift sample can be seen in Figures 10 and 11 in the Appendix.
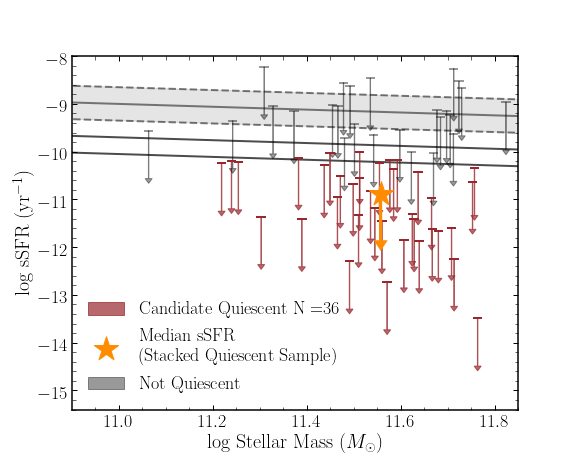
To determine which of our sources are likely quiescent, we compare the derived specific star formation rates to the 4 star-forming main sequence (SFMS) as presented in Salmon et al. (2015). To be classified as quiescent, we require 84% of the sSFR posterior to be below the SFMS at the best-fit photometric redshift. We note that this is a much more conservative selection than the typical process of using best-fit values. In fact, while the majority of our galaxies have a sSFR median well below the SFMS at the best-fit stellar mass, this method allows us to encompass the full uncertainty on the sSFR posterior due to other possible solutions in our SED modeling. We also note the difference from the Stevans et al. (2021) selection, who used a fixed sSFR threshold of log (sSFR/yr11. By using the 4 main-sequence as a threshold, our selection accounts for the evolution of galaxy typical sSFRs to higher values with increasing redshift (Speagle et al., 2014; Rinaldi et al., 2022; Sandles et al., 2022). With this conservative selection, we find that 36 out of the 61 high redshift sources were classified as quiescent based on optical-IR SED fitting. These sources are shown in Figure 3. To summarize, based on our updated photometric redshift and stellar population modeling, we consider 36 of the original 100 ALMA-observed galaxies from Stevans et al. (2021) to be robust candidate massive quiescent 3 galaxies, with the smaller number due to our more advanced selection procedure.
4 ALMA Observations
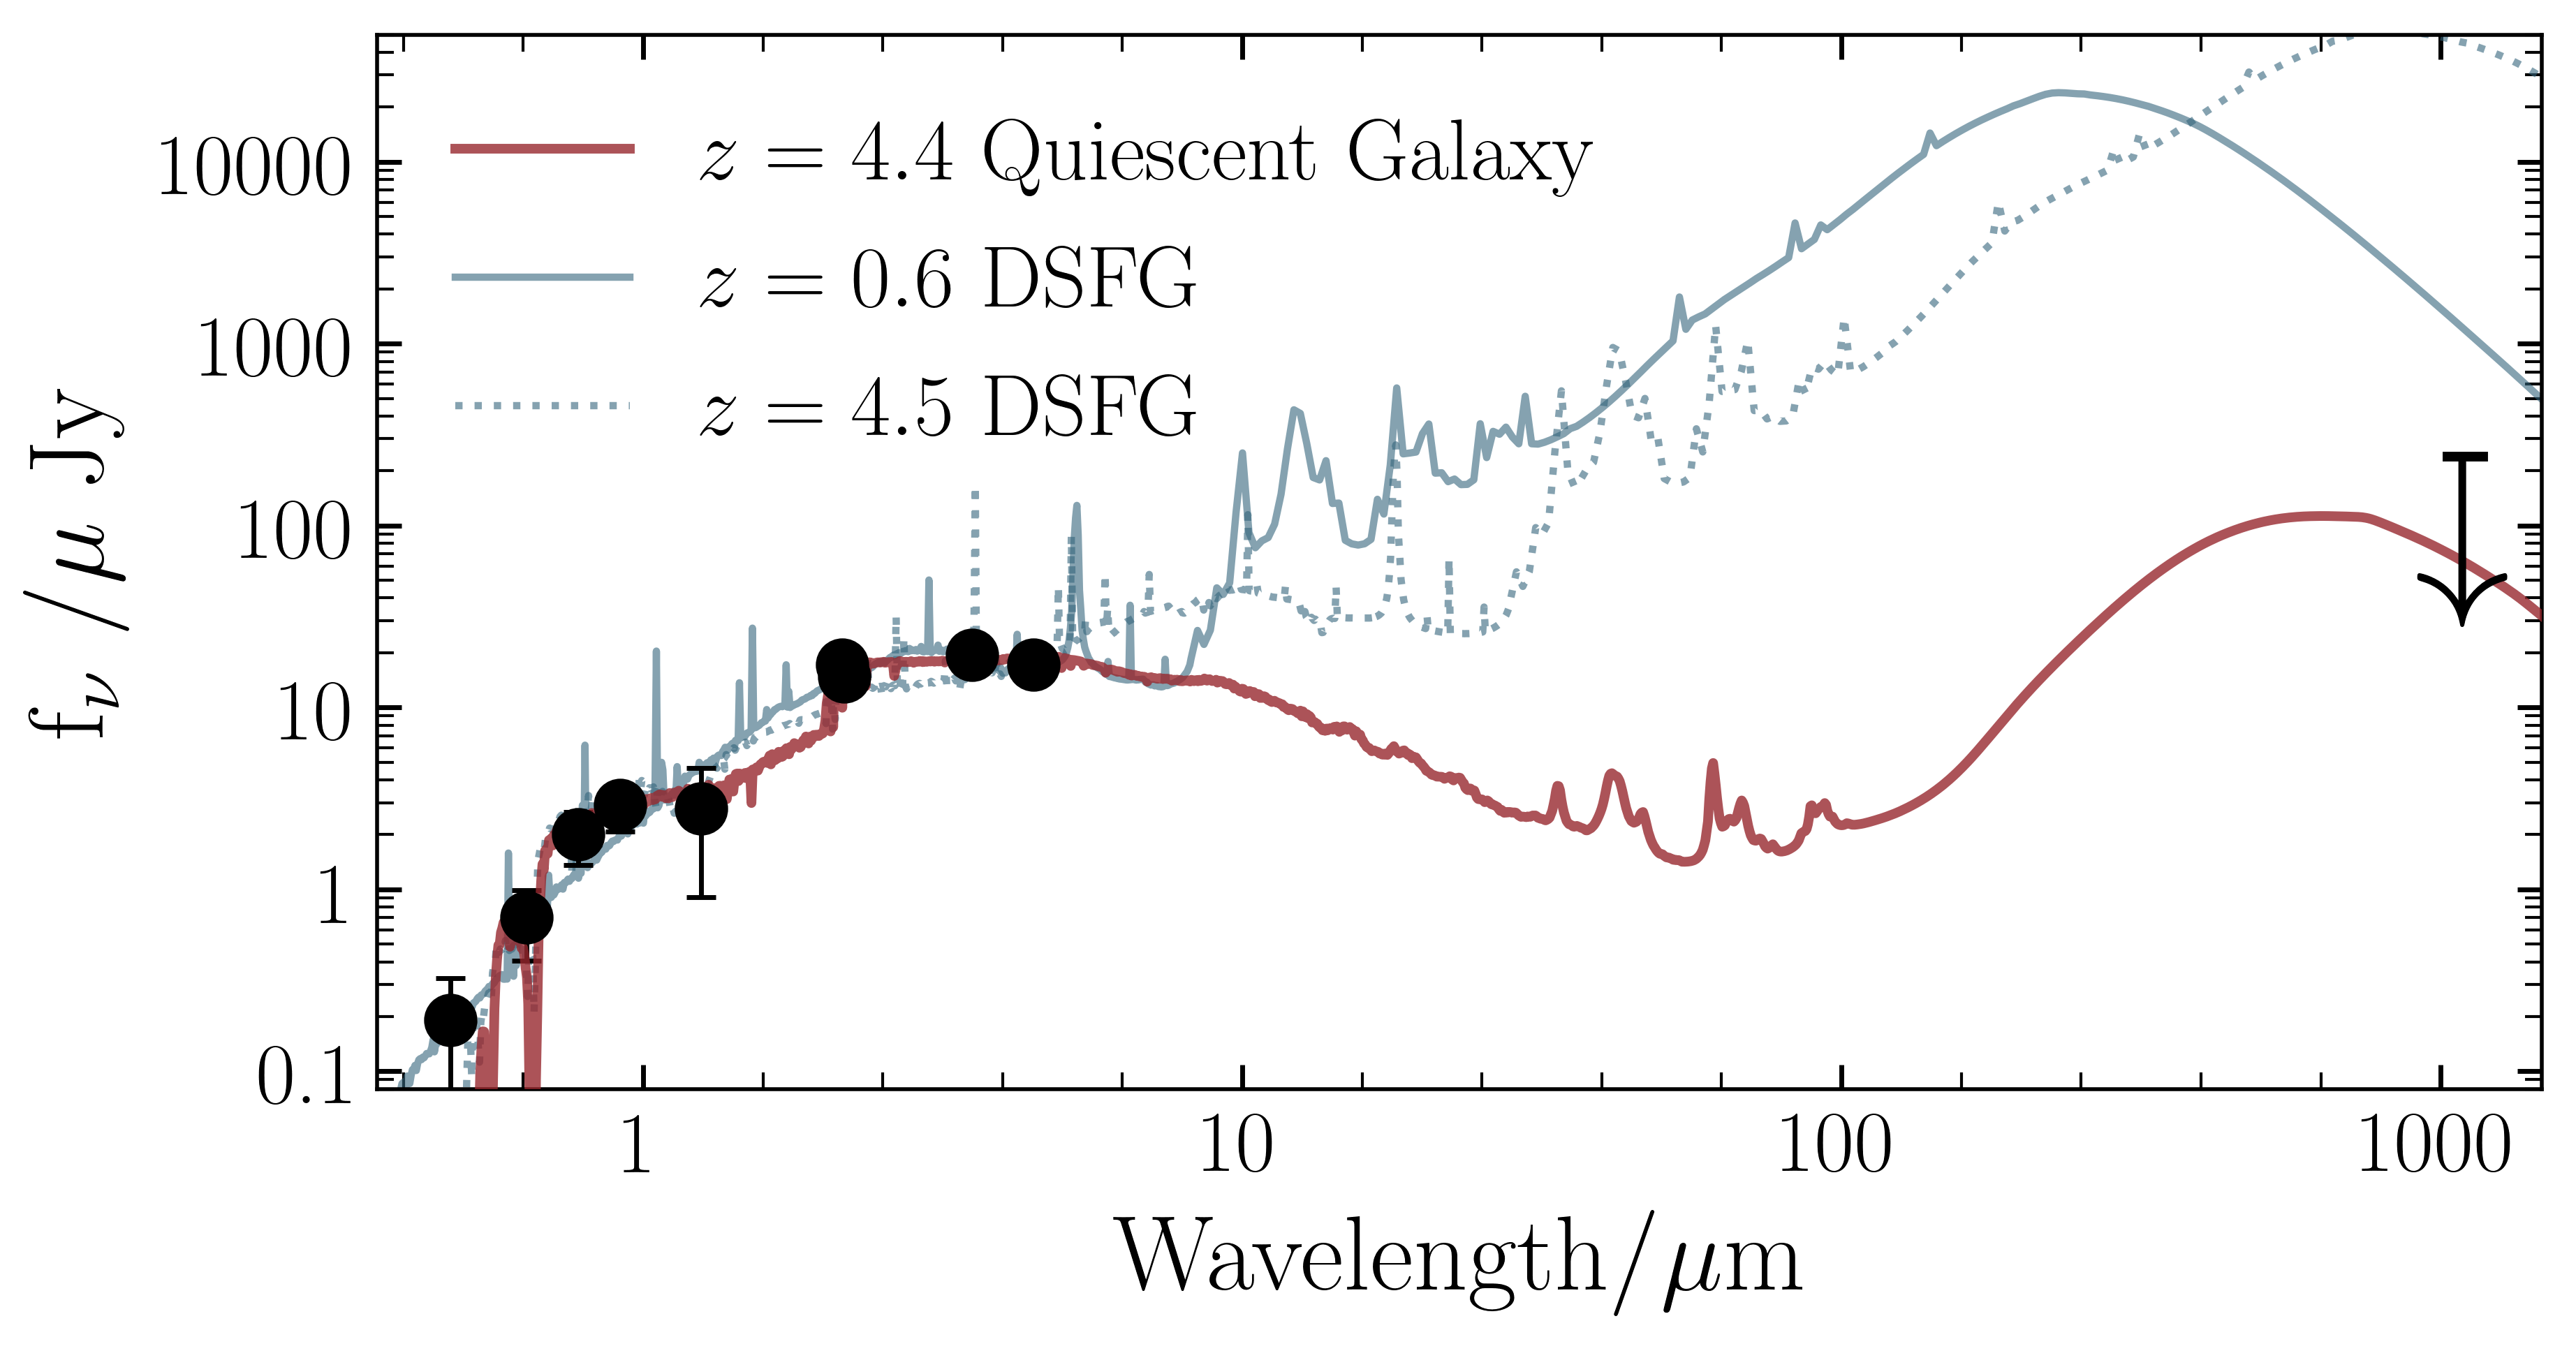
For the sample of galaxies presented here, we have obtained ALMA Band 6 1.1mm observations in Cycle 7 program 2019.1.01219.S (PI Finkelstein). These data were obtained in December 2019. Each source was observed 6 26.4 seconds, for a total integration time of 158 seconds for each source. While relatively short integrations, the sensitivity of ALMA allows us to reach sufficiently deep to robustly detect dust emission from contaminating dusty star-forming galaxies (and possibly detect weak low-level star formation from truly quiescent galaxies). Figure 4 illustrates how the SEDs of quiescent and dusty star-forming galaxies diverge at longer wavelengths, rest-frame far-IR (FIR) observations to a sensitivity of 80 Jy at 1.1mm with ALMA can robustly rule out star-forming solutions for our quiescent candidates.
We use the default continuum images of each source produced by the ALMA pipeline in our analysis. These images use Briggs weighting with robustness parameter 0.5, and reach a typical spatial resolution of 1.30” 0.80” (corresponding to a physical size of order 9 6 kpc at ). For quiescent sources, We do not expect these galaxies to be spatially resolved in our ALMA observations, as high redshift quiescent galaxies are often compact, with half-light sizes of a few kpc (Straatman et al., 2015; Stefanon et al., 2013). For sources with possible IR-emission (i.e. dust obscured star-forming galaxies), previous studies with sufficient resolution in ALMA to measure sizes suggest that dust emission takes place within compact regions of the galaxy, with observed (FIR) to be generally smaller than (optical), on order of kpc at , (Fujimoto et al., 2017; Franco et al., 2018; Ikarashi et al., 2017). In both cases, quiescent or dusty star-forming galaxies, the galaxy is expected to be roughly point-like for the spatial resolution of the presented observations.
From the 100 targets observed, we visually examined each source observation and removed 2 due to observational artifacts, resulting in 98 sources with reliable data. We measured the sensitivity in each observation as the 5 clipped rms of the images from the non primary-beam corrected map. We show the distribution from our 98 observations in Figure 5. The median value of all images is 79 3 Jy/beam. Of the 36 robust candidate high redshift massive quiescent galaxies, all had reliable data, and we perform the following analysis on this subsample. We also present results from the 62 sources not included in our subsample in Appendix B.
4.1 Astrometric Corrections
To determine the source emission, we first match the source location between SHELA and the ALMA observations. The DECam exposures in SHELA were observed through a seven-year period, and the images were reduced using different versions of the NOAO DECam Community Pipeline, therefore, we performed a re-calibration of the astrometry and flux scaling of each image uniformly prior to stacking. The process is summarized here, but details can be found in the updated SHELA catalog paper (Leung et al., 2023). The astrometry of each image is tied to the Gaia EDR3 catalog (Marrese et al., 2018). For each image, an initial source catalog is generated using SEP (Barbary, 2016) and matched to the reported coordinates of astrometry stars in the Gaia EDR3 catalog. The median - and -offset required to match the good stars to the Gaia coordinates in each image was determined and applied to SHELA to correct the astrometry. We use these astrometric corrected coordinates as the source position in our measurements on the ALMA band 6 imaging.
4.2 Source Flux Determination
In order to determine the integrated flux of each ALMA observed source, we employed the Common Astronomy Software Applications package (CASA) imfit222https://casa.nrao.edu/docs/taskref/imfit-task.html task, which attempts to fit one or more elliptical Gaussian components on an image region. We performed two iterations of imfit. For the first iteration, we fix the elliptical Gaussian to the ALMA synthesized beam shape with the center of the beam allowed to move freely (beam-fixed). This method allows us to recover accurate fluxes accounting for slight deviations of the source position due to astrometry in the SHELA catalog. In the second iteration, we fix both the elliptical Gaussian to the ALMA synthesized beam shape, and the center to the Right Ascension and Declination of the source (beamposition-fixed), accounting for non-detections. The initial estimates provided to imfit are chosen to be the astrometrically corrected center of the quiescent candidate and the flux of the pixel at that location, since the sources of interest are unresolved by ALMA.
We use the integrated flux as determined from the beam-fixed fit as our fiducial flux value if the fit returns a source with S/N 3. Our tests show that at that significance level, imfit is able to accurately find the source center. Four sources (out of the full selected parent sample of 36) were found to have a source with S/N 3, and thus were fit in this way. Within these images, we then determine the separation of the imfit determined source from the expected source RA and Dec. We determine that if the fitted center is within the K-band PSF (FWHM ), that the emission is indeed coming from the quiescent candidate. All four images with S/N were determined to be consistent with the quiescent candidates from the parent sample.
For the sources for which the beam-fixed fit found a S/N 3, we chose to use the integrated flux as calculated from the beam+position-fixed fit as the flux of our source, since the reliability of the fitted position for a source with such low S/N is questionable. The remaining 32 candidate massive quiescent galaxies were all found to have a S/N 3 at the center, therefore we chose to report the flux calculated from the beam+position-fixed fits.
5 Obscured Star-Formation Rates & Contamination
ALMA 1.1mm observations measures dust emission corresponding to dust obscured star-formation, allowing us to remove obvious contaminants from our quiescent sample. In order to determine the obscured SFR of each source, we generate model dust SEDs at our ALMA sensitivity limit based on the prescription of Drew & Casey (2022): we adopt a range of dust temperatures and fit the ALMA 1.1mm flux to a modified optically thin black-body with a mid-infrared powerlaw of index . We take three sample SEDs at the wavelength of the peak dust temperature () and the upper and lower 1 range, based on our ALMA sensitivity. For the quiescent candidates, this corresponds to = 25 5K. We then scale each dust SED to the ALMA observations to calculate each galaxies’ infrared luminosity () by integrating each scaled dust SED from m and assuming each source is at the best fit redshift (also the peak of , ) from eazy. From this , we then approximate the level of obscured star-formation following Kennicutt & Evans (2012), which assumes the Kroupa & Weidner (2003) IMF with a Salpeter slope of from and from :
| (1) |
Where SFR is given in and is in .
To determine , each of the 36 sources is fit with a 20, 25, and 30 K (characteristic dust temperature = 25 5K) modified black-body as described above. For these dust temperatures, a 1 detection ALMA 1.1mm flux at our sensitivity limit (Jy) would result in an obscured SFR upper limit of 15, 21, 27 , respectively.
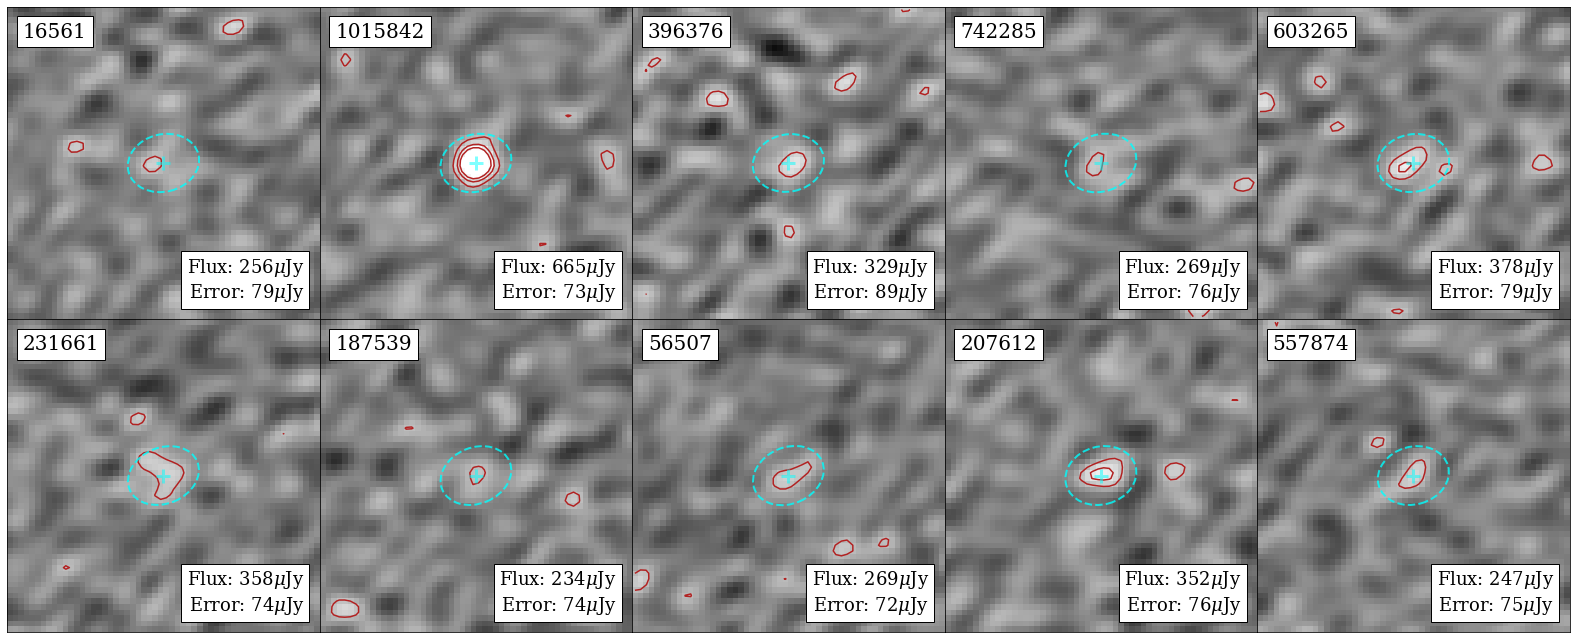
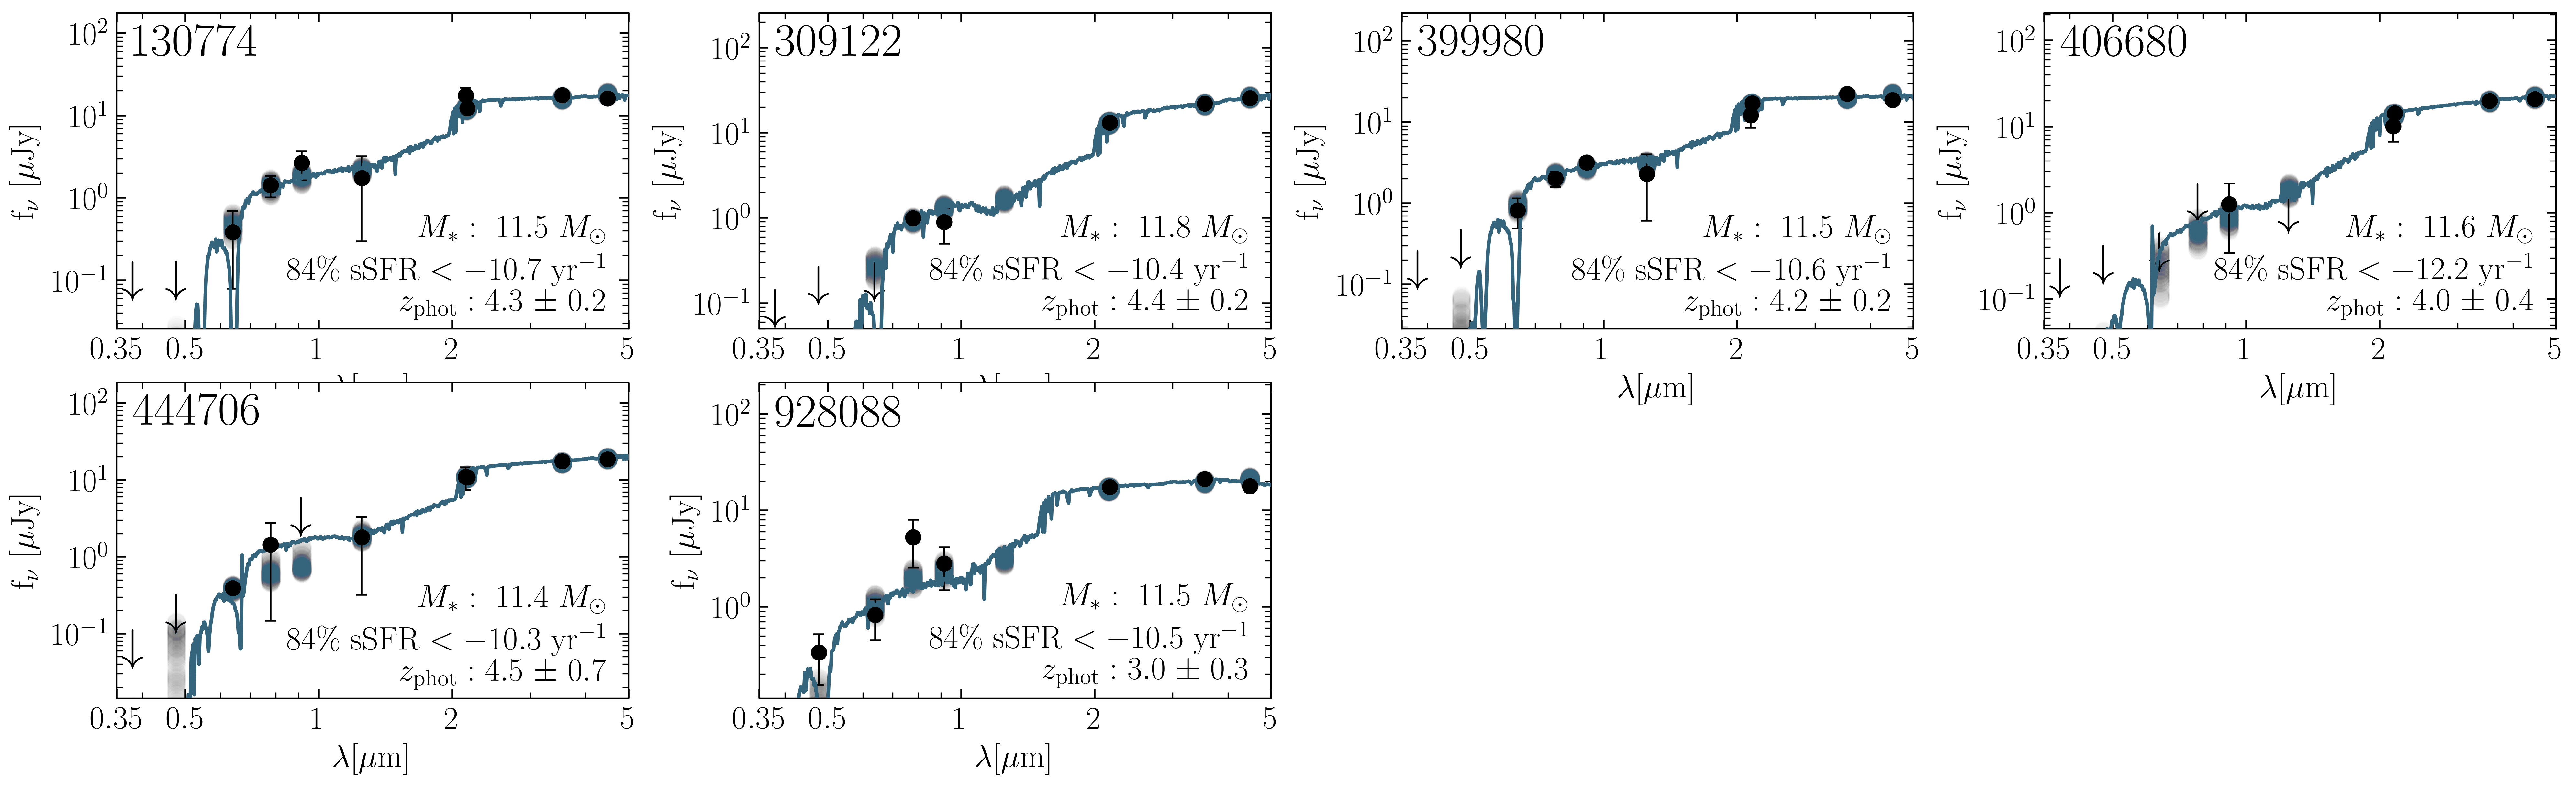
Six sources that satisfy our massive quiescent selection have measured dust-obscured SFRs that place them above our sSFR selection threshold using these characteristic dust temperatures. We thus refit these sources using dust models more typical of dusty star-forming galaxies at , with =405 (Sommovigo et al., 2022) and recalculate the dust-obscured SFRs. The ALMA Band 6 images of these sources are shown in Figure 7, the ALMA fluxes as well as estimated obscured SFRs for these sources are reported in Table 2. We note that detections in ALMA do not necessarily imply that these are not high redshift sources, instead it only speaks to the existence of significant star-formation activity, therefore are no longer characterized as quiescent in this conservative sample.
5.1 Quiescent Sample
The removal of the six sources with significant obscured SFRs from our quiescent sample leaves us with a final sample of 30 candidate massive quiescent galaxies, images for these sources are shown in Figure 8, the reported errors are the 5-clipped rms of the images. This implies that we expect a contamination rate of 6/36, or 17%, based on SED fitting using only SHELA photometry for selecting massive high redshift quiescent galaxies.
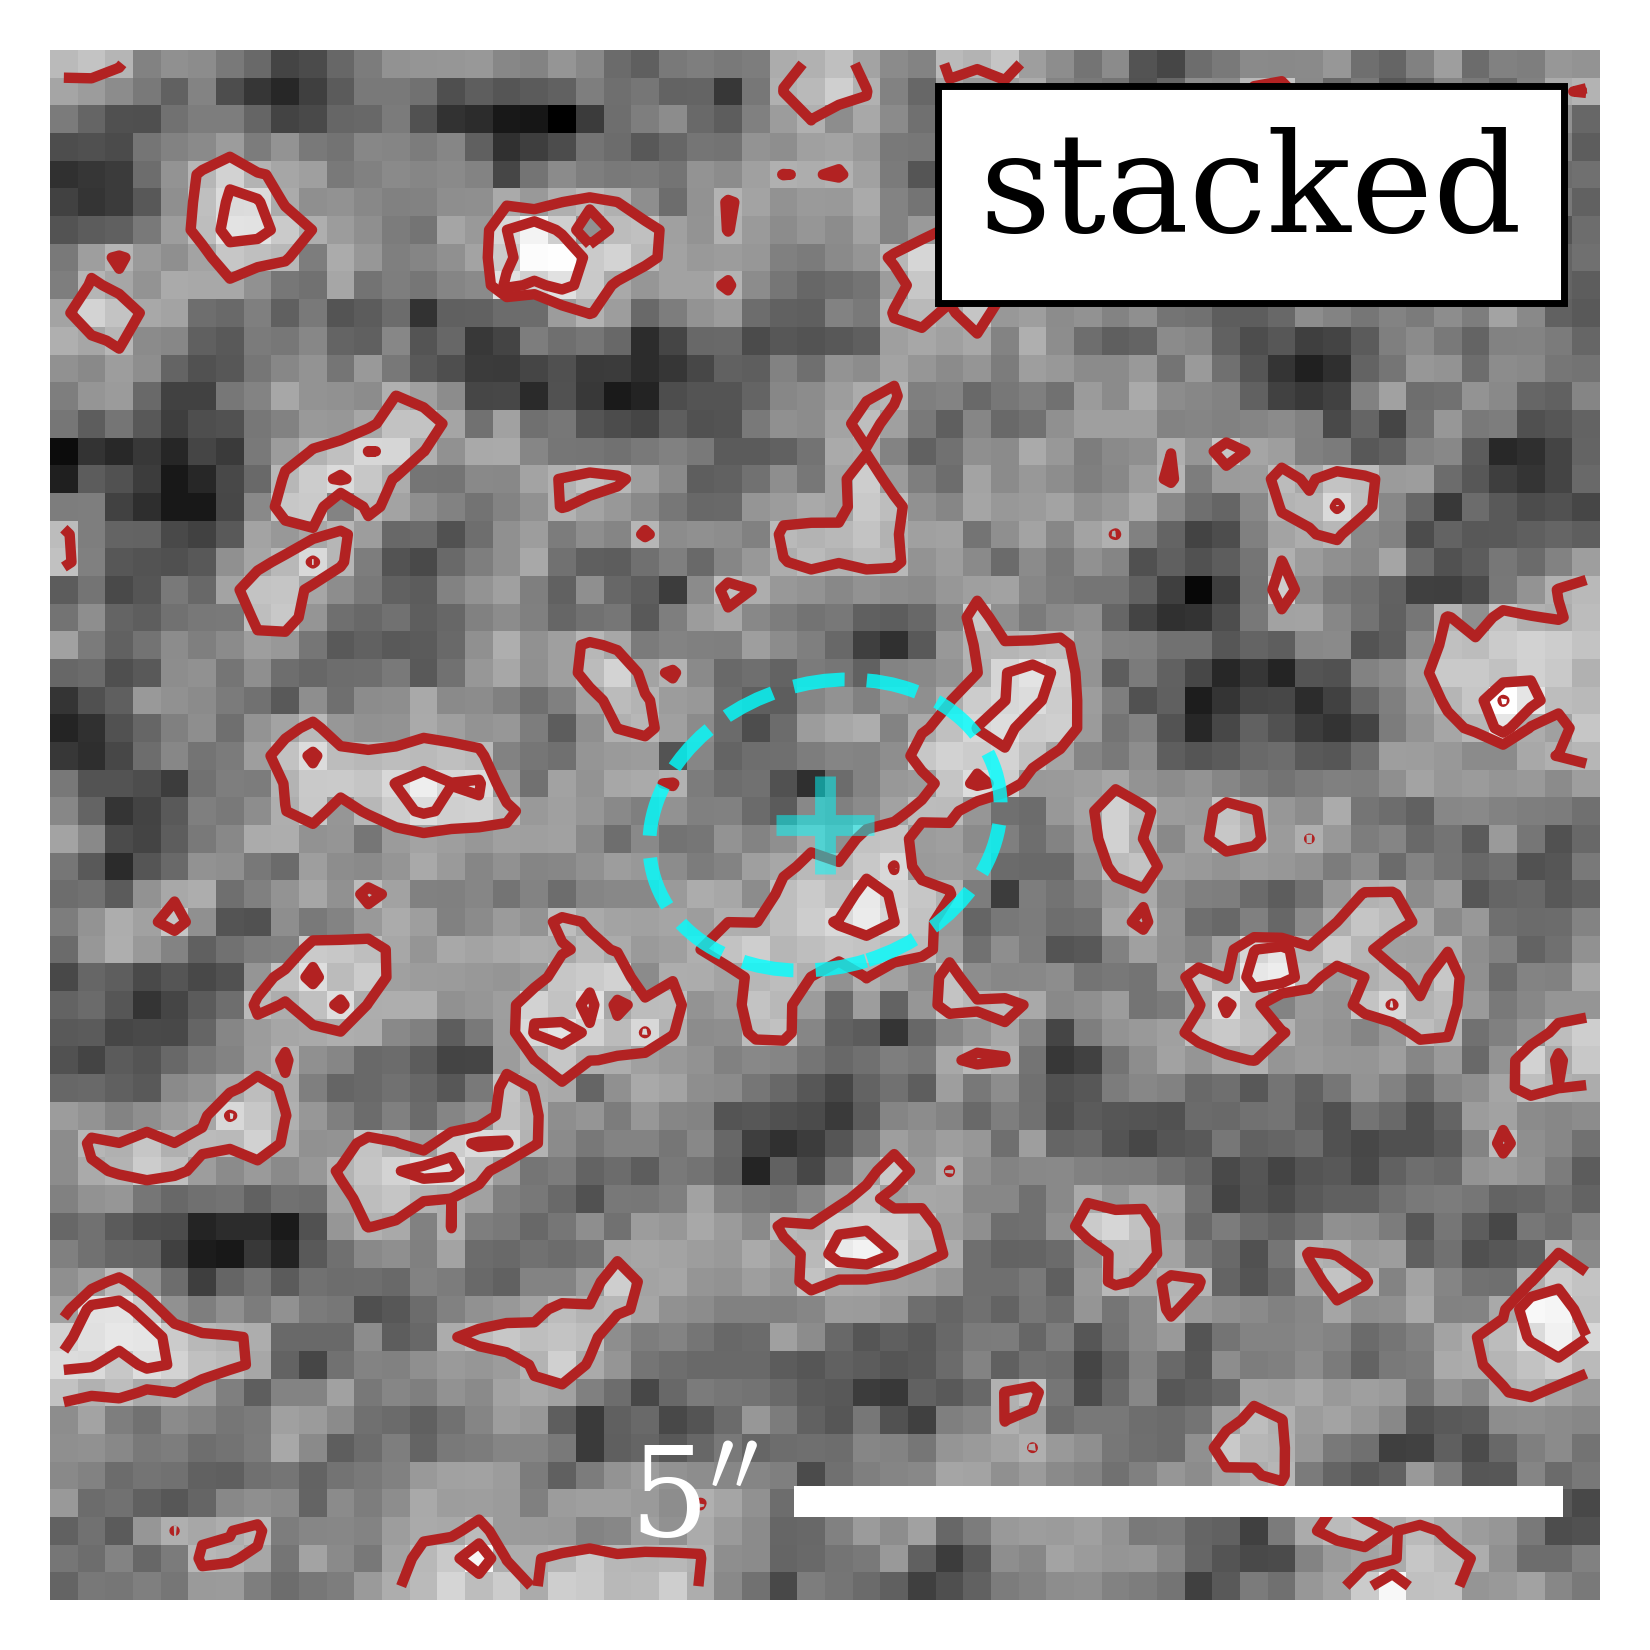
To explore the constraints on the obscured SFR made possible from the ALMA imaging, we create a median stack of the 30 quiescent galaxies, shown in Figure 6. We show the distribution of the measured dust-obscured star formation with respect to the SFMS of our sample in Figure 9. We determine the median flux of our final quiescent sample by repeating the analysis detailed in §4.2 using a beam+position fixed imfit fit on the stacked image, finding a flux density of 9 17 Jy, a detection.
We thus calculate the corresponding obscured SFR at the median redshift of our sample in the same way as above, using the 1 flux error of 17 Jy as the flux, and find an obscured SFR upper limit of 4 /yr-1. At the median mass of our sample of log() = 11.5, this corresponds to a sSFR of yr-1. We show the median stellar mass and upper limit in obscured SFRs of our final sample in Figure 9.
| SHELA ID | K-band Mag | ALMA 1.1mm flux [] | Obscured SFR [] | log sSFR [] | |||
|---|---|---|---|---|---|---|---|
| 406680 | 3.2 | 21.2 | 251 79 | 66 25 | -9.8 0.2 | ||
| 130774 | 3.2 | 21.1 | 254 80 | 60 21 | -9.7 0.1 | ||
| 309122 | 3.1 | 20.0 | 236 76 | 56 20 | -10.0 0.2 | ||
| 928088 | 3.1 | 20.8 | 249 82 | 62 22 | -9.7 0.2 | ||
| 399980 | 4.2 | 20.8 | 204 77 | 46 16 | -9.8 0.1 | ||
| 444706 | 4.5 | 21.3 | 225 80 | 50 18 | -9.7 0.2 |
6 Discussion
This work presents a robust exploration into the contamination rate in a sample of 3 massive quiescent galaxy candidates. The primary contaminants of massive quiescent galaxies at , particularly in the optical-IR range, are lower redshift () dust obscured star-forming galaxies. However, these galaxies will be easily distinguishable at longer wavelengths as this dust will be detected in emission with submm/mm observatories such as ALMA.
In this work, we develop a methodology to robustly select high-redshift ( 3) massive quiescent galaxies from broadband imaging (in the SHELA field). We show that by examining ALMA observations for our samples of candidate high redshift quiescent galaxies only 6/36 sources have significant ALMA flux. This implies a contamination rate of from dust obscured star-forming galaxies with SFRs of (calculated from a 1 detection of 80 Jy, corresponding to a log (sSFR/yr at log(). This relatively low contamination rate indicates that future work in the SHELA field using these selection criteria can compose a robust sample of massive quiescent galaxies with limited contamination from dusty star-forming galaxies. This lays the groundwork to leverage the extraordinary volume made available by SHELA to measure robust number densities of these sources across .
7 Summary & Future Work
We present a robust selection of high redshift massive quiescent galaxies based on photometric fitting, with a goal of exploring contamination via ALMA Band 6 1.1 mm imaging. We begin with a parent sample of 100 sources in the SHELA catalog, fit their photometric redshifts using eazy, and limit ourselves to a sample of 61 high redshift sources using a conservative photometric-redshift selection criteria of 70% of the redshift probability integral .
From these sources, we perform SED fitting using Bagpipes to constrain the physical properties of each source, and select likely quiescent sources. We found that 36/61 high redshift sources were quiescent (with SFR below the SFMS from Salmon et al. (2015) at ). We then examine ALMA Band 6 1.1mm imaging, which allows us to rule out significant dust obscured star-formation activity and found 6/36 sources were likely star-forming. We determined the obscured SFR by fitting model dust SEDs at our ALMA sensitivity limit based on the prescription of Drew & Casey (2022) to obtain a . We then approximate the level of obscured star-formation following Kennicutt & Evans (2012). We report the sSFR of these six sources, confirming that they lie above our quiescent threshold, and removed them from our final sample of massive quiescent galaxies. These results imply that the selection of massive quiescent sources based on SED fitting of the SHELA catalog will have an expected contamination rate of 17% by dusty star-forming galaxies.
This results in a final sample of 30 massive (log) quiescent galaxies at . It is important to note that this is a preliminary sample, the goal of this paper is to determine a selection criteria and measure the contamination by dusty star-forming galaxies by utilizing ALMA observations. We intend to repeat this SED fitting process with the updated SHELA catalog (Leung et al., 2023), which will be 1-1.3 mag deeper across all bands, as well as include newly acquired Y-band imaging to better constrain our future sample.
This sample of 30 massive high redshift quiescent galaxies also provide excellent potential targets for follow-up spectroscopy with JWST NIRSpec spectroscopy. Deep spectroscopy from JWST will be able to detect Balmer absorption features at these redshifts and provide the all-important redshift confirmation for these extreme sources. With NIRSpec, observations of key star-formation features (H-alpha emission, Balmer absorption, Dn4000, UV/IR slopes) will also allow investigations into the details of the formation and subsequent quenching of high redshift massive quiescent galaxies, which are encoded in their stellar populations.
References
- Baldry et al. (2004) Baldry, I. K., Glazebrook, K., Brinkmann, J., et al. 2004, ApJ, 600, 681, doi: 10.1086/380092
- Balogh et al. (2004) Balogh, M. L., Baldry, I. K., Nichol, R., et al. 2004, ApJ, 615, L101, doi: 10.1086/426079
- Barbary (2016) Barbary, K. 2016, Journal of Open Source Software, 1, 58, doi: 10.21105/joss.00058
- Bell et al. (2004) Bell, E. F., Wolf, C., Meisenheimer, K., et al. 2004, ApJ, 608, 752, doi: 10.1086/420778
- Brammer et al. (2008) Brammer, G. B., van Dokkum, P. G., & Coppi, P. 2008, The Astrophysical journal, 686, 1503
- Brammer et al. (2011) Brammer, G. B., Whitaker, K. E., van Dokkum, P. G., et al. 2011, ApJ, 739, 24, doi: 10.1088/0004-637X/739/1/24
- Brennan et al. (2015) Brennan, R., Pandya, V., Somerville, R. S., et al. 2015, Monthly notices of the Royal Astronomical Society, 451, 2933
- Capak et al. (2015) Capak, P. L., Carilli, C., Jones, G., et al. 2015, Nature, 522, 455, doi: 10.1038/nature14500
- Carnall et al. (2018) Carnall, A. C., McLure, R. J., Dunlop, J. S., & Davé , R. 2018, Monthly Notices of the Royal Astronomical Society, 480, 4379, doi: 10.1093/mnras/sty2169
- Carnall et al. (2022) Carnall, A. C., McLeod, D. J., McLure, R. J., et al. 2022, A first look at JWST CEERS: massive quiescent galaxies from 3 < z < 5, arXiv, doi: 10.48550/ARXIV.2208.00986
- Casey et al. (2018) Casey, C. M., Hodge, J., Zavala, J. A., et al. 2018, The Astrophysical Journal, 862, 78, doi: 10.3847/1538-4357/aacd11
- Cecchi et al. (2019) Cecchi, R., Bolzonella, M., Cimatti, A., & Girelli, G. 2019, The Astrophysical Journal, 880, L14, doi: 10.3847/2041-8213/ab2c80
- Choi et al. (2014) Choi, K., Rott, C., & Itow, Y. 2014, J. Cosmology Astropart. Phys, 2014, 049, doi: 10.1088/1475-7516/2014/05/049
- Conroy & Gunn (2010) Conroy, C., & Gunn, J. E. 2010, ApJ, 712, 833, doi: 10.1088/0004-637X/712/2/833
- Conroy et al. (2009) Conroy, C., Gunn, J. E., & White, M. 2009, ApJ, 699, 486, doi: 10.1088/0004-637X/699/1/486
- Davé et al. (2019) Davé, R., Anglés-Alcázar, D., Narayanan, D., et al. 2019, Monthly Notices of the Royal Astronomical Society, 486, 2827, doi: 10.1093/mnras/stz937
- De Lucia & Blaizot (2007) De Lucia, G., & Blaizot, J. 2007, Monthly notices of the Royal Astronomical Society, 375, 2
- Dickey et al. (2021) Dickey, C. M., Starkenburg, T. K., Geha, M., et al. 2021, ApJ, 915, 53, doi: 10.3847/1538-4357/abc014
- Drew & Casey (2022) Drew, P. M., & Casey, C. M. 2022, The Astrophysical Journal, 930, 142, doi: 10.3847/1538-4357/ac6270
- Faber et al. (2007) Faber, S. M., Willmer, C. N. A., Wolf, C., et al. 2007, ApJ, 665, 265, doi: 10.1086/519294
- Fabian (2012) Fabian, A. 2012, Annual Review of Astronomy and Astrophysics, 50, 455, doi: 10.1146/annurev-astro-081811-125521
- Fang et al. (2012) Fang, G., Kong, X., Chen, Y., & Lin, X. 2012, ApJ, 751, 109, doi: 10.1088/0004-637X/751/2/109
- Forrest et al. (2020) Forrest, B., Annunziatella, M., Wilson, G., et al. 2020, Astrophysical journal. Letters, 890, L1
- Franco et al. (2018) Franco, M., Elbaz, D., Béthermin, M., et al. 2018, A&A, 620, A152, doi: 10.1051/0004-6361/201832928
- Fraser-McKelvie & Cortese (2022) Fraser-McKelvie, A., & Cortese, L. 2022, The Astrophysical Journal, 937, 117, doi: 10.3847/1538-4357/ac874d
- Fujimoto et al. (2017) Fujimoto, S., Ouchi, M., Shibuya, T., & Nagai, H. 2017, The Astrophysical Journal, 850, 83, doi: 10.3847/1538-4357/aa93e6
- Fujimoto et al. (2020) Fujimoto, S., Silverman, J. D., Bethermin, M., et al. 2020, ApJ, 900, 1, doi: 10.3847/1538-4357/ab94b3
- Gebhardt et al. (2021) Gebhardt, K., Cooper, E. M., Ciardullo, R., et al. 2021, The Astrophysical Journal, 923, 217, doi: 10.3847/1538-4357/ac2e03
- Glazebrook et al. (2017) Glazebrook, K., Schreiber, C., Labbé, I., et al. 2017, Nature (London), 544, 71
- Hill et al. (2008) Hill, G. J., Gebhardt, K., Komatsu, E., et al. 2008, in Astronomical Society of the Pacific Conference Series, Vol. 399, Panoramic Views of Galaxy Formation and Evolution, ed. T. Kodama, T. Yamada, & K. Aoki, 115, doi: 10.48550/arXiv.0806.0183
- Ikarashi et al. (2017) Ikarashi, S., Caputi, K. I., Ohta, K., et al. 2017, ApJ, 849, L36, doi: 10.3847/2041-8213/aa9572
- Kennicutt & Evans (2012) Kennicutt, R. C., & Evans, N. J. 2012, Annual Review of Astronomy and Astrophysics, 50, 531, doi: 10.1146/annurev-astro-081811-125610
- King & Pounds (2015) King, A., & Pounds, K. 2015, Annual Review of Astronomy and Astrophysics, 53, 115, doi: 10.1146/annurev-astro-082214-122316
- Kriek & Conroy (2013) Kriek, M., & Conroy, C. 2013, The Astrophysical Journal, 775, L16, doi: 10.1088/2041-8205/775/1/l16
- Kriek et al. (2006) Kriek, M., van Dokkum, P. G., Franx, M., et al. 2006, ApJ, 649, L71, doi: 10.1086/508371
- Kroupa & Weidner (2003) Kroupa, P., & Weidner, C. 2003, ApJ, 598, 1076, doi: 10.1086/379105
- Lang et al. (2016) Lang, D., Hogg, D. W., & Mykytyn, D. 2016, The Tractor: Probabilistic astronomical source detection and measurement, Astrophysics Source Code Library, record ascl:1604.008. http://ascl.net/1604.008
- Leung et al. (2023) Leung, G. C. K., Finkelstein, S., Weaver, J., et al. 2023, arXiv e-prints, arXiv:2301.00908, doi: 10.48550/arXiv.2301.00908
- Maiolino et al. (2015a) Maiolino, R., Carniani, S., Fontana, A., et al. 2015a, MNRAS, 452, 54, doi: 10.1093/mnras/stv1194
- Maiolino et al. (2015b) —. 2015b, MNRAS, 452, 54, doi: 10.1093/mnras/stv1194
- Marchesini & van Dokkum (2007) Marchesini, D., & van Dokkum, P. G. 2007, The Astrophysical journal, 663, L89
- Marrese et al. (2018) Marrese, P., Marinoni, S., Fabrizio, M., & Altavilla, G. 2018, Astronomy & Astrophysics, 621, doi: 10.1051/0004-6361/201834142
- Merlin et al. (2018) Merlin, E., Fontana, A., Castellano, M., et al. 2018, Monthly notices of the Royal Astronomical Society, 473, 2098
- Merlin et al. (2019) Merlin, E., Fortuni, F., Torelli, M., et al. 2019, Monthly Notices of the Royal Astronomical Society, 490, 3309, doi: 10.1093/mnras/stz2615
- Muzzin et al. (2013) Muzzin, A., Marchesini, D., Stefanon, M., et al. 2013, The Astrophysical journal, 777, 18
- Newman et al. (2018) Newman, A. B., Belli, S., Ellis, R. S., & Patel, S. G. 2018, ApJ, 862, 125, doi: 10.3847/1538-4357/aacd4d
- Oke & Gunn (1983) Oke, J. B., & Gunn, J. E. 1983, ApJ, 266, 713, doi: 10.1086/160817
- Papovich et al. (2016) Papovich, C., Shipley, H. V., Mehrtens, N., et al. 2016, The Astrophysical Journal Supplement Series, 224, 28, doi: 10.3847/0067-0049/224/2/28
- Rinaldi et al. (2022) Rinaldi, P., Caputi, K. I., van Mierlo, S. E., et al. 2022, ApJ, 930, 128, doi: 10.3847/1538-4357/ac5d39
- Salim et al. (2018) Salim, S., Boquien, M., & Lee, J. C. 2018, ApJ, 859, 11, doi: 10.3847/1538-4357/aabf3c
- Salmon et al. (2015) Salmon, B., Papovich, C., Finkelstein, S. L., et al. 2015, The Astrophysical journal, 799, 183
- Sandles et al. (2022) Sandles, L., Curtis-Lake, E., Charlot, S., Chevallard, J., & Maiolino, R. 2022, Monthly Notices of the Royal Astronomical Society, 515, 2951, doi: 10.1093/mnras/stac1999
- Santini et al. (2019) Santini, P., Merlin, E., Fontana, A., et al. 2019, MNRAS, 486, 560, doi: 10.1093/mnras/stz801
- Schreiber et al. (2017) Schreiber, C., Pannella, M., Leiton, R., et al. 2017, Astronomy & Astrophysics, 599, A134, doi: 10.1051/0004-6361/201629155
- Schreiber et al. (2018) Schreiber, C., Glazebrook, K., Nanayakkara, T., et al. 2018, Astronomy and astrophysics (Berlin), 618, A85
- Scoville et al. (2016) Scoville, N., Sheth, K., Aussel, H., et al. 2016, ApJ, 820, 83, doi: 10.3847/0004-637X/820/2/83
- Somerville & Davé (2015) Somerville, R. S., & Davé, R. 2015, Annual review of astronomy and astrophysics, 53, 51
- Sommovigo et al. (2022) Sommovigo, L., Ferrara, A., Carniani, S., et al. 2022, Monthly Notices of the Royal Astronomical Society, 517, 5930, doi: 10.1093/mnras/stac2997
- Speagle et al. (2014) Speagle, J. S., Steinhardt, C. L., Capak, P. L., & Silverman, J. D. 2014, The Astrophysical Journal Supplement Series, 214, 15, doi: 10.1088/0067-0049/214/2/15
- Spitler et al. (2014) Spitler, L. R., Straatman, C. M. S., Labbé, I., et al. 2014, Astrophysical journal. Letters, 787, L36
- Springel et al. (2005) Springel, V., White, S. D. M., Jenkins, A., et al. 2005, Nature, 435, 629, doi: 10.1038/nature03597
- Stefanon et al. (2013) Stefanon, M., Rudnick, G. H., Marchesini, D., Brammer, G. B., & Whitaker, K. E. 2013, The Astrophysical journal, 768
- Stefanon et al. (2015) Stefanon, M., Marchesini, D., Muzzin, A., et al. 2015, The Astrophysical Journal, 803, 11, doi: 10.1088/0004-637x/803/1/11
- Stevans et al. (2021) Stevans, M. L., Finkelstein, S. L., Kawinwanichakij, L., et al. 2021, ApJ, 921, 58, doi: 10.3847/1538-4357/ac0cf6
- Straatman et al. (2015) Straatman, C. M. S., Labbé , I., Spitler, L. R., et al. 2015, The Astrophysical Journal, 808, L29, doi: 10.1088/2041-8205/808/1/l29
- Valentino et al. (2020) Valentino, F., Tanaka, M., Davidzon, I., et al. 2020, The Astrophysical journal, 889, 93
- Viero et al. (2014) Viero, M. P., Asboth, V., Roseboom, I. G., et al. 2014, The Astrophysical Journal Supplement Series, 210, 22, doi: 10.1088/0067-0049/210/2/22
- Wold et al. (2019) Wold, I. G. B., Kawinwanichakij, L., Stevans, M. L., et al. 2019, ApJS, 240, 5, doi: 10.3847/1538-4365/aaee85
Appendix A Bagpipes Fits
Appendix B ALMA observations
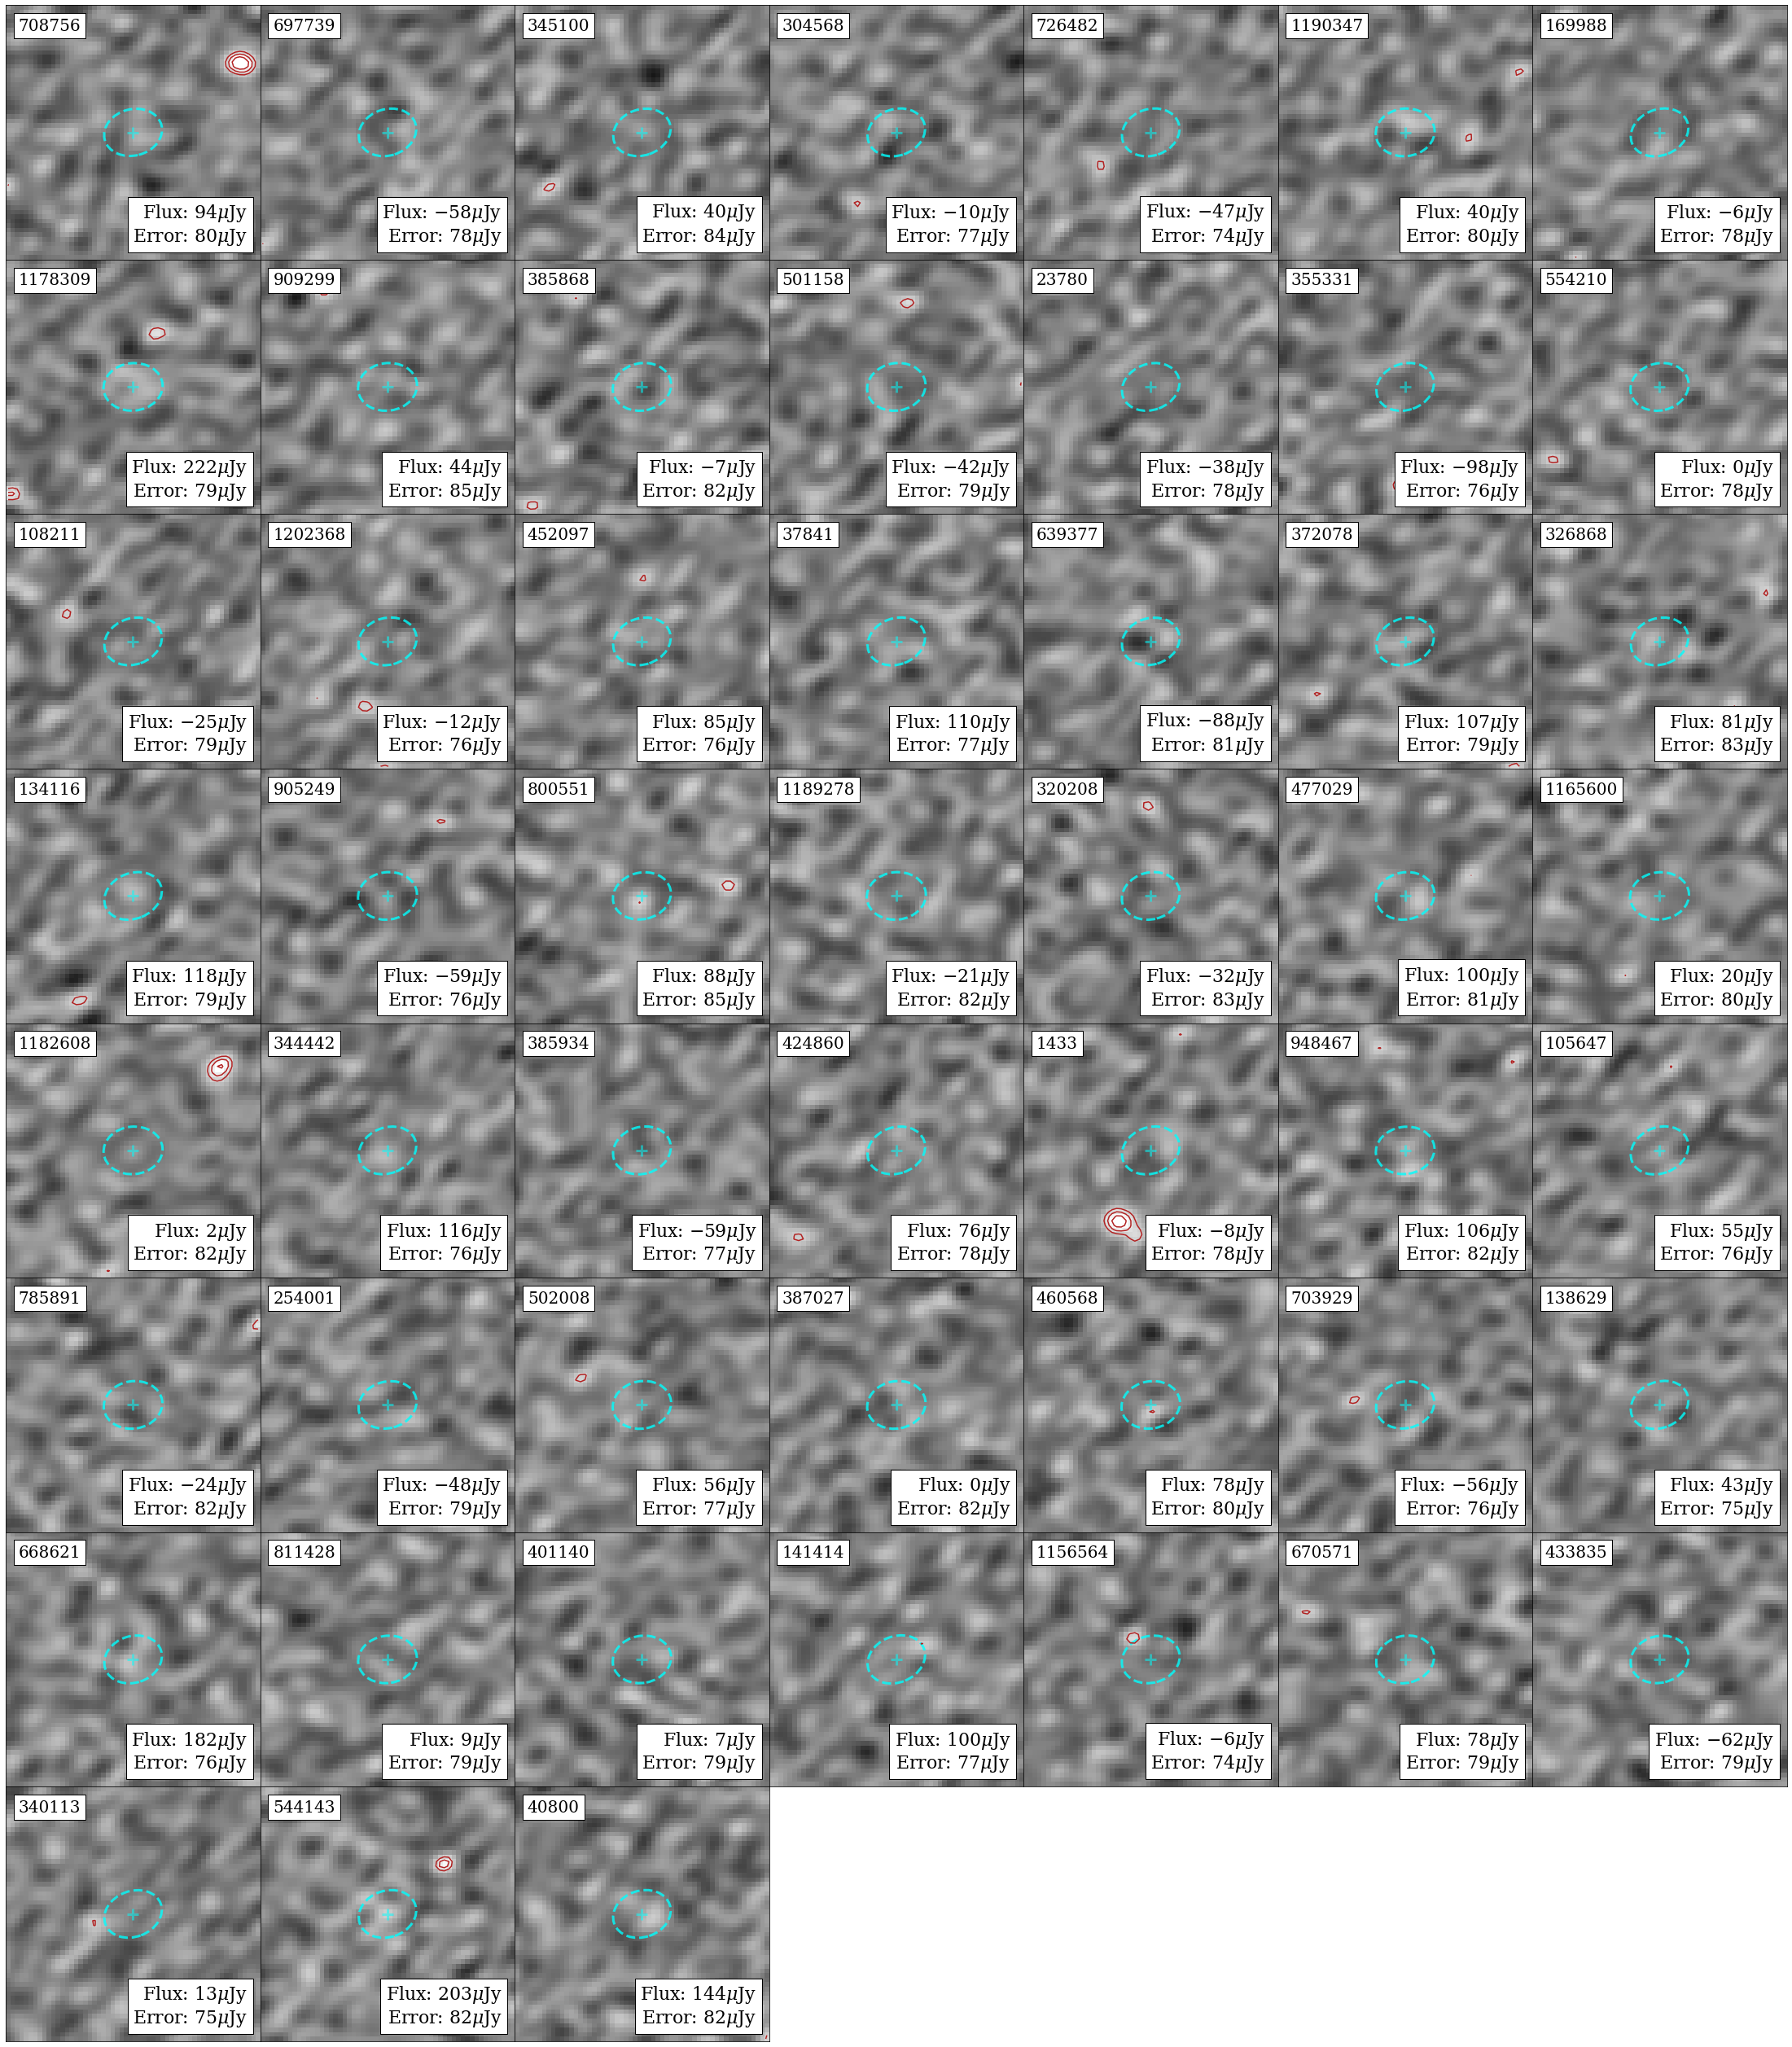
Here we present ALMA observations for the 62 sources which did not satisfy our selection criteria to be considered high redshift and quiescent. 52 of these sources had no significant detection in ALMA 1.1mm imaging, shown in Figure 13. While the other 10 sources were determined to have a detection in 1.1m, these are shown in Figure 12.