Joint Metrics Matter: A Better Standard for Trajectory Forecasting
Abstract
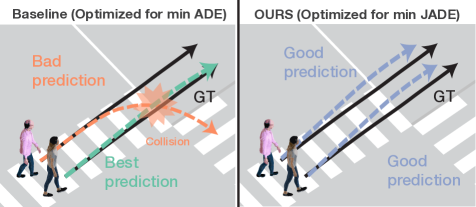
Multi-modal trajectory forecasting methods commonly evaluate using single-agent metrics (marginal metrics), such as minimum Average Displacement Error (ADE) and Final Displacement Error (FDE), which fail to capture joint performance of multiple interacting agents. Only focusing on marginal metrics can lead to unnatural predictions, such as colliding trajectories or diverging trajectories for people who are clearly walking together as a group. Consequently, methods optimized for marginal metrics lead to overly-optimistic estimations of performance, which is detrimental to progress in trajectory forecasting research. In response to the limitations of marginal metrics, we present the first comprehensive evaluation of state-of-the-art (SOTA) trajectory forecasting methods with respect to multi-agent metrics (joint metrics): JADE, JFDE, and collision rate. We demonstrate the importance of joint metrics as opposed to marginal metrics with quantitative evidence and qualitative examples drawn from the ETH / UCY and Stanford Drone datasets. We introduce a new loss function incorporating joint metrics that, when applied to a SOTA trajectory forecasting method, achieves a 7% improvement in JADE / JFDE on the ETH / UCY datasets with respect to the previous SOTA. Our results also indicate that optimizing for joint metrics naturally leads to an improvement in interaction modeling, as evidenced by a 16% decrease in mean collision rate on the ETH / UCY datasets with respect to the previous SOTA. Code is available at github.com/ericaweng/joint-metrics-matter.
1 Introduction
Because the future is inherently multi-modal, the trajectory forecasting community has adopted the use of top-K metrics, average displacement error (ADE) and final displacement error (FDE), to evaluate and optimize methods. Under this evaluation, stochastic trajectory forecasting models generate a set of different possible futures for each target sequence of a certain time length. Each possible future represents a set of x-y position predictions for all agents in the sequence; we call each set of predictions a “sample.” Min ADE / FDE is then calculated by finding, for each agent, the lowest-error prediction across the samples when compared to the ground-truth. Unfortunately, ADE / FDE do not explicitly account for interacting futures. The future is not only multi-modal but also interacting; the future trajectories of each agent depend on one another. For example, a car merging into a busy road may either choose to push its way in, or wait passively for an opening. If the car merges, other vehicles on the road will slow down to let it in. If the car waits, others will maintain their speed. A scenario where the car merges but the vehicles on the road maintain their speed and crash into the car would not be a likely future.
Most trajectory forecasting methods produce predictions for all agents in the sequence jointly, in order to better model these interactive scenarios. However, under standard top- evaluation, the predictions are considered for each agent marginally, and thus the predictions used in evaluation need not come from the same sample. A method may achieve good ADE / FDE simply by producing an accurate prediction for each agent in any one of its samples, and then mixing-and-matching the best predictions for each agent; it need not accurately model the joint future within a single sample.
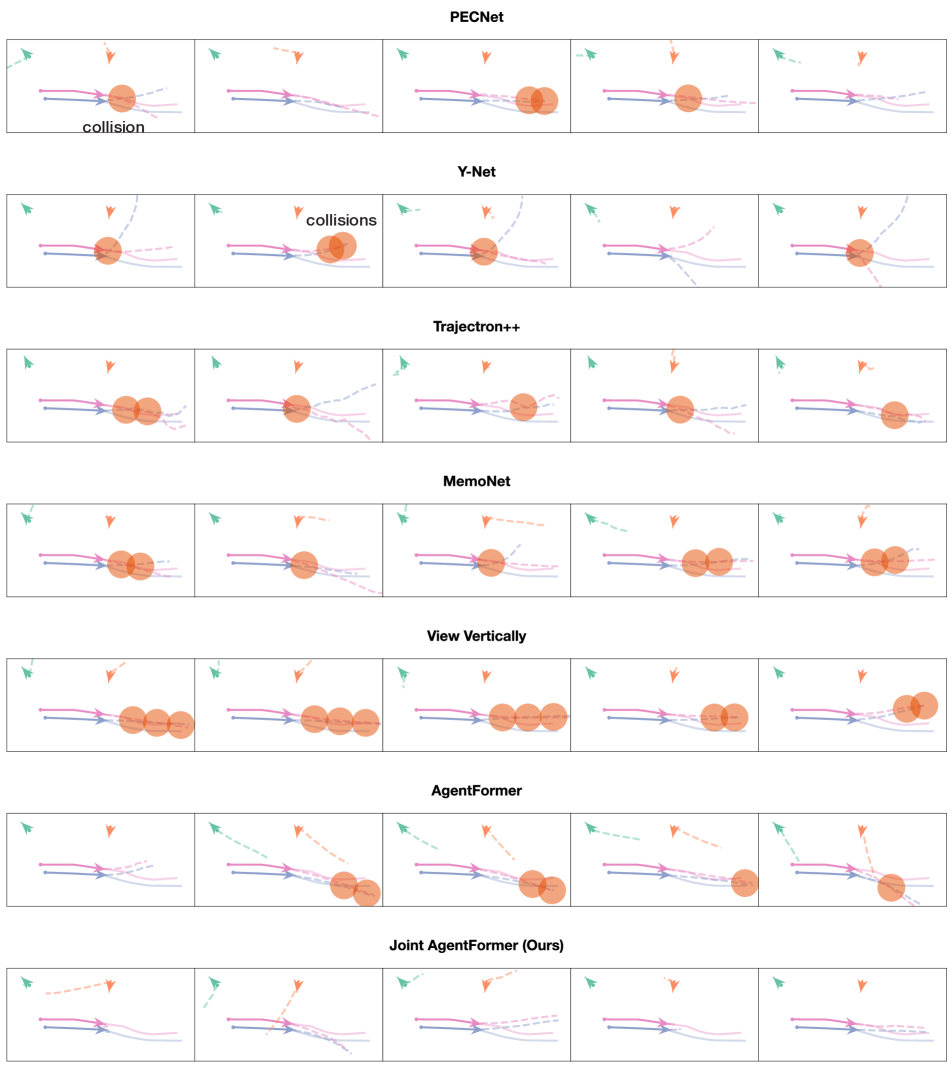
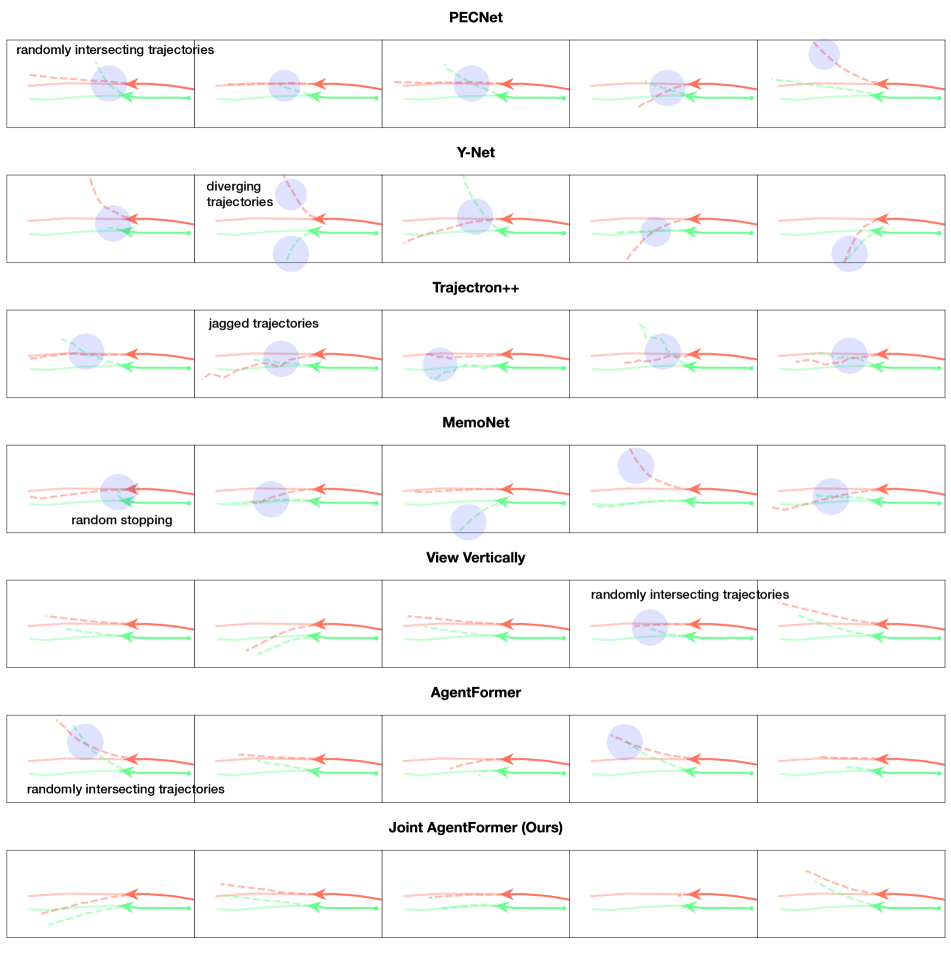
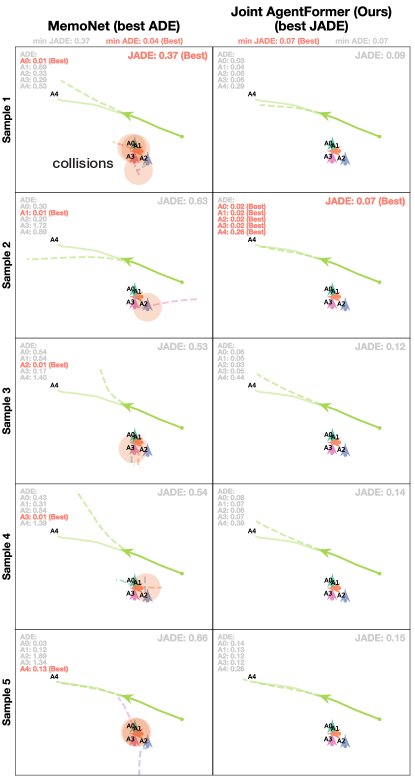
Only considering marginal metrics during evaluation can result in an overly optimistic estimation of performance. A method may achieve excellent ADE / FDE yet still fail at joint interaction modeling, such as predicting collision-free trajectories, as seen in Figure 1. After crossing the crosswalk, it is reasonable that a pedestrian either continues straight down the sidewalk, turns left onto the sidewalk, or turns right to cross the other crosswalk. Supposing all three possibilities are equally likely and well-represented by the ground truth data, a model that has been trained relying on standard min ADE / FDE metrics (e.g. that shown in left panel of figure) may predict any one of these three futures. However, since the method is optimized for each agent individually, it may not enforce the correct group behavior; two pedestrians walking side-by-side are likely to choose the same mode.
A work from the vehicle forecasting community [49] introduced joint metrics, which they called “scene-level” ADE and FDE. These metrics, rather than mix-and-match the minimum ADE / FDE prediction per-agent, instead average over all agents within a sample before taking the minimum-error sample as the one that “counts.” Performing well with respect to joint metrics necessitates not only predicting accurate marginal futures, but also accurate joint futures. Joint metrics are also reported in the Waymo Motion Prediction challenge and several other vehicle forecasting works; however, they have failed to gain traction in pedestrian forecasting evaluation, and few if any methods that evaluate on pedestrian datasets report them.
Diverging from the names used by [49], we shall instead refer to “scene-level” ADE / FDE as “joint” ADE / FDE (JADE / JFDE) in order to avoid confusion with the overloaded term “scene,” which is also used in trajectory forecasting literature to refer to environment information such as semantic maps or the location of a dataset. We define these metrics and compare the differences with their marginal counterpart ADE / FDE in Section 3.
In theory, current forecasting architectures may already be capable of modeling joint futures and multi-agent interactions through the use of graph and attention-based architectures such as GNNs and Transformers. These architectures are designed to explicitly model social interactions between agents so as to predict realistic joint futures, and have led to great improvements in ADE / FDE. However, increasing studies show that adversarial attacks can cause methods to produce unrealistic joint futures and poor results [44, 5, 63]. For example, [44] showed that “socially-aware” models may not be as socially-aware as they claim to be, because well-placed attacks can cause predictions with colliding trajectories. To more realistically assess the performance of multi-agent forecasting, we advocate for the use of joint metrics over marginal metrics in method evaluation. Furthermore, we hypothesize that multi-agent architectures fall short in modeling realistic agent interactions because they are optimized with respect to only marginal losses (that are driven by the field’s focus on marginal metrics). To test this hypothesis, we modify the loss function on a popular SOTA method to include a joint loss term. We show with this simple and straightforward modification, SOTA methods become far more accurate at modeling multi-agent interactions.
Our contribution is thus two-fold:
-
•
We present the first comprehensive evaluation of SOTA trajectory forecasting methods with respect to joint metrics: JADE, JFDE, and collision rate. We show that ADE / FDE are an overestimation of performance on joint agent behavior; JADE / JFDE is often 2x worse than the reported ADE / FDE across methods for samples. We illustrate the importance of joint metrics over marginal metrics with quantitative evidence as well as qualitative examples drawn from SOTA methods on the ETH [39] / UCY [28] and SDD [43] datasets.
-
•
We introduce a simple multi-agent joint loss function that, when used to optimize a SOTA trajectory forecasting method, achieves a improvement of 7% over the previous SOTA with respect to the joint metrics JADE / JFDE on the ETH / UCY datasets. We show that this lower JADE / JFDE is also linked with a 16% reduction in collision rate as compared with the previous SOTA, substantiating the hypothesis that optimizing with respect to joint metrics also improves collision-avoidance modeling.
2 Related Work
Joint Evaluation Metrics. JADE / JFDE was introduced in [49], but few papers in either the vehicle or pedestrian forecasting have evaluated and reported performance on it. As far as we know, the only papers that report on it are [49, 12, 50], all from the vehicle forecasting community. In pedestrian forecasting, JADE / JFDE is overlooked in favor of ADE / FDE.
Collision Rate (CR) is a joint evaluation metric that has seen greater attention in more recent works as members of the trajectory forecasting community begin to pay more attention to social compliance and effective joint modeling [25, 47, 23, 26, 34, 44].
In the autonomous vehicle setup, other joint evaluation metrics have been proposed, including Driveable Area Compliance [9], Miss Rate [9, 49, 12], and mean Average Precision [49, 12], the latter two taking inspiration from the object detection evaluation setup. These metrics all measure “realism” aspects of predicted trajectories, but have still not become widespread in the pedestrian trajectory forecasting space.
The NLL metric captures joint-agent performance because it averages over all pedestrians , but it is insufficient for capturing best-of- multi-modality because it averages over samples instead of taking the minimum:
Thus, when used to report performance on real datasets with only one ground truth future mode, NLL does not reward plausible but unrepresented modes.
Precision / Recall can only be calculated on datasets that report multiple ground truth modes, such as the Forking Paths Dataset [30], so that is a limitation.
Multi-modal Joint Trajectory Forecasting. Modern trajectory forecasting methods typically learn to predict trajectory distributions using deep models trained to imitate real datasets. In order to capture multiple possible futures, many methods are based on deep generative architectures [20, 13, 40], such as conditional variational autoencoders (CVAEs) [27, 57, 19, 51, 52], generative adversarial networks (GANs) [15, 45, 22, 66, 23], and normalizing flows (NFs) [41, 42, 14]. To model the joint behavior of multiple socially interacting agents, many methods have made use of graph-based computation structures with attention and pooling layers such as GNNs and transformers [19, 36, 46, 21, 2, 31, 10, 48, 38, 56, 58, 60, 3, 6, 4, 18]. SOTA methods have employed a variety of techniques for better modeling, such as using waypoints and goals to break the forecasting problem into a series of hierarchical steps [11, 35, 64, 7, 8, 62, 65, 55, 53], mathematical and physical modeling techniques such as social forces [17] alongside deep architectures [62, 53, 32], and other paradigms and techniques such as memory retrieval [54], contrastive learning [34], and causal disentanglement [33]. Despite the large improvements made with respect to ADE / FDE, progress with respect to JADE / JFDE is still unknown, as none of the aforementioned methods evaluate with respect to JADE / JFDE.
3 Metrics Definitions
We formulate the multi-agent trajectory forecasting problem as predicting the future trajectories of agents conditioned on their past trajectories. For observed history timesteps , we represent the state for agent at timestep as , which includes the position, velocity, and (in some methods) the heading angle of the agent. We denote the joint observation history for all agents over all timesteps as . For future timesteps , we represent the ground-truth positions of agent at timestep as , which includes a 2D x-y position. We denote the ground-truth trajectories of over all agent-timesteps as . Similarly, we represent the joint position predictions for agent at timestep in prediction sample as , and the position predictions over all agent-timestep-samples as y.
We define the marginal and joint metrics used in evaluation. The standard used in evaluations is history or observation timesteps and future timesteps for a total of frames per sequence sampled at fps; thus of history observation and of future. is the number of samples, or possible futures, produced by the model for a single -frame sequence; the standard used in evaluations is . is the number of agents, which varies by sequence.
Marginal Metrics (ADE / FDE). Throughout the paper we use ADE / FDE to refer to top- minimum error rather than average error, as this is the standard notation used in multi-modal human trajectory forecasting evaluation.
| (1) |
| (2) |
Joint Metrics (JADE / JFDE). The difference between the calculation of ADE / FDE and JADE / JFDE is small but significant: swapping the order of taking the minimum over samples and taking the average over agents . This difference means we cannot mix-and-match agents between different samples; rather we must take the average error over all agents within a sample before we select the best one to use in performance evaluation.
| (3) |
| (4) |
Collision Rate (CR). Collision Rate is the proportion of agents whose path intersects in time and space (by a certain threshold) with at least one other predicted agent future in a -frame prediction sample.
If we adopt top- evaluation and use the minimum-JADE sample as an optimistic measure of the method’s prediction ability, then the collision rate of that sample provides an optimistic estimate of the model’s collision-avoidance ability. Thus, we define , the collision rate of the minimum-JADE sample:
| (5) | ||||
where represents all predictions for , and is a function that returns True if any two line segments formed by and come within of each other, and False otherwise. For our evaluations, we use an agent radius of meters, as used in [24]. Adversarial examples discounted, should be lower than , the mean collision rate across all samples. This is because the sample with the best JADE is that which is closest to the ground-truth, which has few collisions, as seen in the last row of Table 1b.
Because proper learning of social interactions should result in low collision rate, we would ideally like all samples produced by a model to avoid collisions. Thus, we also define as defined in past work [24, 47]:
| (6) |
As it considers the mean over samples, rather than the min as in top- evaluation, provides a holistic rather than optimistic evaluation of a model’s collision-avoidance ability.
4 Joint Optimization of SOTA Methods
We introduce an improvement upon AgentFormer [61] and View Vertically [53] that improves performance with respect to JADE / JFDE and, in the case of AgentFormer, Collision Rate. We selected two trajectory prediction models to show our methods’ broad applicability.
4.1 AgentFormer
The AgentFormer architecture is a CVAE structure with transformer layers that factorizes the trajectory forecasting problem into a prediction over a latent space of possible futures z conditional on the trajectory histories x, and a prediction over decoded possible futures y conditional on the latent z. We make no modifications to the AgentFormer architecture, and thus refer readers to the original paper [61] for more detail.
AgentFormer training involves a two-step procedure: a first step to learn accurate trajectory decoding, and a second tuning step to learn to produce diverse prediction samples. During the first step, AgentFormer makes use of the negative evidence lower bound (ELBO) loss function to encourage the CVAE model’s predictions to match the ground-truth positions while maintaining that the latent space of possible futures adhere to the Gaussian distribution.
| (7) |
This loss can be rewritten as the three terms in black:
| (8) | ||||
The first and second terms are reconstruction terms resulting from the first term of equation 7 (the ELBO likelihood term). The first term is a general reconstruction loss that encourages a single predicted future to be close to the ground-truth . The second term is a marginal sample reconstruction loss that encourages the min ADE prediction for agent , , to be close to the ground-truth . The fourth term is equivalent to the second term of equation 7 (the KL divergence term), which encourages the CVAE Prior network, , to learn the latent distribution encoded by the posterior network .
In our joint optimization, we modify the objective function by adding the third term in blue, a joint sample reconstruction loss that encourages the min JADE prediction to be close to the ground-truth .
While the first training step learns a latent space that maximizes the probability that decoded predictions match the ground-truth, AgentFormer makes use of a second training step that is designed to encourage the decoded predictions to be diverse. Here, the CVAE weights are fixed, and the CVAE Prior network’s latent sampler is swapped out for a DLow Trajectory Sampler. This new sampler module learns a fixed set of linear transformations of the latent z that are trained to be different from one another via a DLow diversity loss [59]. We signify the new prior network with the DLow Trajectory Sampler as . In our joint optimization, we modify AgentFormer’s objective function by adding a joint sample reconstruction term, just as we did in the first training step. The final objective function for the second training step is therefore:
| (9) | ||||
The first term is the marginal sample reconstruction loss, analogous to the second term of Equation 8. The blue second term, our addition, is equivalent to the joint sample reconstruction loss we added to the first training step. The third term is a KL term which encourages the new prior network (with the new Trajectory Sampler module), to be near the distribution of the original prior network (with the old CVAE Prior sampler, which was learned in the first training step). The fourth term is the diversity loss, which encourages the fixed set of futures to be diverse from one another.
4.2 View Vertically
View Vertically is a simple hierarchical method with two modules: a coarse-level waypoint prediction module, and a fine-level trajectory prediction module. The coarse-level module forecasts the future waypoints in the spectrum domain, and the fine-level module interpolates waypoints in the spectrum domain, and then decodes full trajectories in coordinate space. We make no modifications to the architecture, and thus refer readers to the original paper [53] for more detail.
Each module is trained independently. The coarse-level module is optimized according to the loss written in black:
| (10) | ||||
Here, is the set of waypoint timesteps used for coarse prediction, optimized as a hyperparameter. Similar to how we do with AgentFormer, to optimized View Vertically with joint metrics, we add the blue second term, the joint optimization term. Here, is a weighting hyperparameter that balances how much the to consider the marginal term vs. the joint term.
The fine-level module is optimized according to the loss written in black:
| (11) | ||||
We add in the term in blue, analogous to the term we add for the coarse-level module.
5 Evaluation Setup
Datasets. We evaluate on the commonly-used pedestrian trajectory datasets ETH [39] / UCY [29], used across the field in nearly all pedestrian trajectory forecasting works. ETH / UCY features bird’s eye views trajectories of pedestrians in 5 different environment scenes given in real-world coordinates (meters). Following [1, 16, 61, 35, 36, 46], we use the leave-one-out training and evaluation setup, where we train on all but one of the 5 environment scenes, and evaluate on the left-out scene.
We also evaluate on the Stanford Drone Dataset (SDD) [43], which features trajectories captured via drone from a bird’s eye viewpoint across 20 different scenes on Stanford University’s campus given in image pixel coordinates. Instead of using the raw data, we chose to use the TrajNet split [25] of SDD, a downsampled and smaller subset of the original data considering only pedestrian trajectories, following the training and evaluation setup of [46, 45].
Baselines. We compare our approach with current state-of-the-art methods: View Vertically [53], MemoNet [54], Y-Net [35], and AgentFormer [61]; and other standard baselines from recent years: Trajectron++ [46], PECNet [36], and S-GAN [16]. We re-evaluate using pre-trained models if provided, or retrain and re-evaluate using available source code if not. For fair comparison between methods, we provide the model only ground-truth trajectory histories, and do not provide scene context information such as images or semantic maps. Y-Net is the only baseline in our evaluation that used semantic map information in the original work [36]; the reason the results we report for Y-Net are not as performant as those reported in their paper is because we retrain without using map information. There are a few other reasons for differences between our results and that reported in the original papers: the numbers originally reported in Trajectron++ were incorrect due to a data snooping bug; thus we re-train and re-evaluate on a corrected version of the code. View Vertically used a different sample rate on the eth scene and a slightly different split of the hotel scene in the ETH dataset; thus, we retrain and re-evaluate it on the standard split used by most other methods ([46, 36, 35, 54, 16, 61]). To ensure fair comparison across methods on SDD, we re-train and re-evaluate methods which either used a different split instead of the TrajNet [24] split (View Vertically used the original raw dataset and downsampled / preprocessed the data themselves) or did not originally train and report results on SDD (AgentFormer and Trajectron++).
6 Results and Analyses
| (m), samples | |||||||
| Dataset (mean # peds) | ETH (1.4) | HOTEL (2.7) | UNIV (25.7) | ZARA1 (3.3) | ZARA2 (5.9) | ETH / UCY Avg. | SDD TrajNet (1.5) |
| S-GAN [16] | 0.919 / 1.742 | 0.480 / 0.950 | 0.744 / 1.573 | 0.438 / 1.001 | 0.362 / 0.794 | 0.589 / 1.212 | 13.76 / 24.84 |
| Trajectron++ [46] | 0.726 / 1.299 | 0.237 / 0.418 | 0.609 / 1.316 | 0.359 / 0.712 | 0.294 / 0.625 | 0.445 / 0.874 | 11.36 / 18.21 |
| PECNet [37] | 0.618 / 1.097 | 0.291 / 0.587 | 0.666 / 1.417 | 0.408 / 0.896 | 0.372 / 0.840 | 0.471 / 0.967 | 10.82 / 19.48 |
| Y-Net [35] | 0.495 / 0.781 | 0.205 / 0.386 | 0.695 / 1.559 | 0.487 / 1.045 | 0.492 / 1.101 | 0.475 / 0.974 | 9.67 / 16.01 |
| MemoNet [54] | 0.499 / 0.859 | 0.222 / 0.416 | 0.686 / 1.466 | 0.349 / 0.723 | 0.385 / 0.864 | 0.428 / 0.866 | 9.59 / 16.43 |
| View Vertically [53] | 0.561 / 0.776 | 0.196 / 0.332 | 0.654 / 1.307 | 0.328 / 0.654 | 0.298 / 0.602 | 0.408 / 0.734 | 10.75 / 17.45 |
| Joint View Vertically (Ours) | 0.652 / 0.839 | 0.186 / 0.309 | 0.523 / 1.091 | 0.331 / 0.634 | 0.267 / 0.547 | 0.392 / 0.684 | 10.92 / 17.70 |
| AgentFormer [61] | 0.482 / 0.794 | 0.237 / 0.456 | 0.622 / 1.310 | 0.285 / 0.564 | 0.296 / 0.624 | 0.384 / 0.749 | 9.67 / 16.92 |
| Joint AgentFormer (Ours) | 0.485 / 0.798 | 0.186 / 0.320 | 0.590 / 1.219 | 0.271 / 0.513 | 0.252 / 0.509 | 0.357 / 0.672 | 9.56 / 16.59 |
| (m), samples | |||||||
| Dataset (mean # peds) | ETH (1.4) | HOTEL (2.7) | UNIV (25.7) | ZARA1 (3.3) | ZARA2 (5.9) | ETH / UCY Avg. | SDD TrajNet (1.5) |
| S-GAN [16] | 0.015 / 0.045 | 0.031 / 0.090 | 0.165 / 0.251 | 0.060 / 0.185 | 0.083 / 0.195 | 0.071 / 0.153 | 0.00 / 0.00 |
| Trajectron++ [46] | 0.025 / 0.137 | 0.044 / 0.271 | 0.281 / 0.489 | 0.088 / 0.466 | 0.126 / 0.456 | 0.113 / 0.364 | 0.00 / 0.00 |
| PECNet [37] | 0.014 / 0.115 | 0.043 / 0.269 | 0.218 / 0.409 | 0.059 / 0.396 | 0.128 / 0.455 | 0.092 / 0.329 | 0.00 / 0.03 |
| Y-Net [35] | 0.016 / 0.141 | 0.039 / 0.250 | 0.265 / 0.482 | 0.100 / 0.513 | 0.134 / 0.480 | 0.111 / 0.373 | 0.00 / 0.00 |
| MemoNet [54] | 0.014 / 0.160 | 0.040 / 0.301 | 0.206 / 0.415 | 0.065 / 0.445 | 0.136 / 0.483 | 0.092 / 0.361 | 0.00 / 0.00 |
| View Vertically [53] | 0.014 / 0.090 | 0.029 / 0.203 | 0.212 / 0.428 | 0.045 / 0.233 | 0.082 / 0.316 | 0.077 / 0.254 | 0.00 / 0.00 |
| Joint View Vertically (Ours) | 0.011 / 0.076 | 0.026 / 0.168 | 0.276 / 0.484 | 0.045 / 0.262 | 0.081 / 0.349 | 0.088 / 0.268 | 0.00 / 0.00 |
| AgentFormer [61] | 0.016 / 0.068 | 0.022 / 0.084 | 0.204 / 0.362 | 0.021 / 0.088 | 0.054 / 0.139 | 0.063 / 0.148 | 0.00 / 0.00 |
| Joint AgentFormer (Ours) | 0.013 / 0.064 | 0.019 / 0.094 | 0.163 / 0.333 | 0.021 / 0.100 | 0.055 / 0.203 | 0.054 / 0.159 | 0.00 / 0.00 |
| Ground Truth | 0.000 | 0.001 | 0.021 | 0.000 | 0.002 | 0.005 | 0.00 |
| (m), samples | |||||||
| Dataset (mean # peds) | ETH (1.4) | HOTEL (2.7) | UNIV (25.7) | ZARA1 (3.3) | ZARA2 (5.9) | ETH / UCY Avg. | SDD TrajNet (1.5) |
| S-GAN [16] | 0.876 / 1.656 | 0.461 / 0.920 | 0.639 / 1.343 | 0.379 / 0.816 | 0.285 / 0.600 | 0.528 / 1.067 | 12.74 / 22.65 |
| Trajectron++ [46] | 0.669 / 1.183 | 0.185 / 0.283 | 0.303 / 0.541 | 0.249 / 0.414 | 0.175 / 0.319 | 0.316 / 0.548 | 10.18 / 15.76 |
| PECNet [37] | 0.562 / 0.985 | 0.192 / 0.332 | 0.336 / 0.630 | 0.243 / 0.468 | 0.179 / 0.345 | 0.302 / 0.552 | 9.34 / 16.10 |
| Y-Net [35] | 0.398 / 0.571 | 0.123 / 0.189 | 0.310 / 0.598 | 0.258 / 0.491 | 0.198 / 0.389 | 0.257 / 0.448 | 8.15 / 12.80 |
| MemoNet [54] | 0.410 / 0.636 | 0.113 / 0.173 | 0.244 / 0.433 | 0.184 / 0.320 | 0.143 / 0.248 | 0.219 / 0.362 | 7.97 / 12.82 |
| View Vertically [53] | 0.569 / 0.691 | 0.124 / 0.188 | 0.290 / 0.499 | 0.202 / 0.356 | 0.147 / 0.257 | 0.267 / 0.398 | 9.34 / 14.67 |
| Joint View Vertically (Ours) | 0.700 / 0.792 | 0.129 / 0.196 | 0.267 / 0.474 | 0.219 / 0.359 | 0.144 / 0.247 | 0.292 / 0.414 | 9.62 / 15.07 |
| AgentFormer [61] | 0.451 / 0.748 | 0.142 / 0.225 | 0.254 / 0.454 | 0.177 / 0.304 | 0.140 / 0.236 | 0.233 / 0.393 | 8.01 / 13.24 |
| Joint AgentFormer (Ours) | 0.473 / 0.792 | 0.135 / 0.212 | 0.285 / 0.505 | 0.189 / 0.321 | 0.144 / 0.242 | 0.245 / 0.414 | 8.25 / 13.74 |
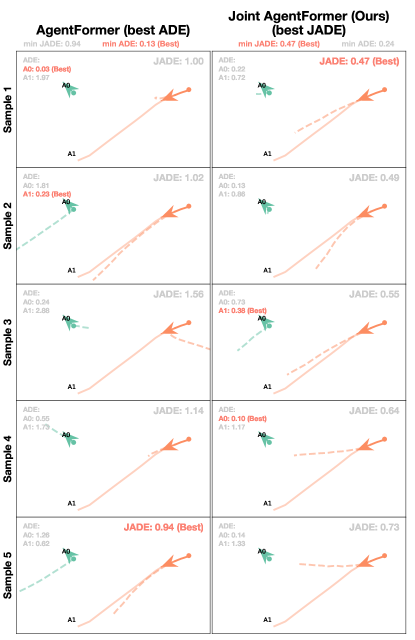
JADE / JFDE. Joint metrics (Table 1a) perform about 2x worse across the board as compared to marginal metrics (Table 1c). This means that while methods can achieve excellent predictions for individual agents across different prediction samples, they perform a lot worse at producing good predictions for all agents within a single prediction sample. This provides evidence that marginal metrics are overly optimistic estimations of trajectory forecasting performance.
Our Joint AgentFormer achieves the best JADE and JFDE of all methods: 7% better in JADE and 10% better in JFDE over AgentFormer, the next-best method in ETH / UCY. Our Joint View Vertically also achieves a 4% boost in JADE and a 7% boost in JFDE over vanilla View Vertically. The performance of all methods wrt JADE / JFDE is summarized in Table 1a. For both of our methods, there is a significantly large improvement in JADE / JFDE performance (18% for Joint AgentFormer and for 10% for Joint View Vertically) in the zara2 scene, an environment with plenty of interactions caused by medium-density sequences (about 6 pedestrians per 20-frame sequence). We hypothesize that our optimization method causes increased performance particularly on high-density sequences, in which there exist more interactions than in low-density sequences. Another example is in the univ scene, the densest scene, in which Joint View Vertically achieves a 20% improvement, and Joint AgentFormer achieves a 5% improvement. It is worthy to note that joint optimization results on a smaller improvement margin on scenes with few interactions (eth, hotel, and SDD TrajNet). Perhaps adding in consideration of joint dynamics in these simple scenes may confuse the model and impede accurate prediction.
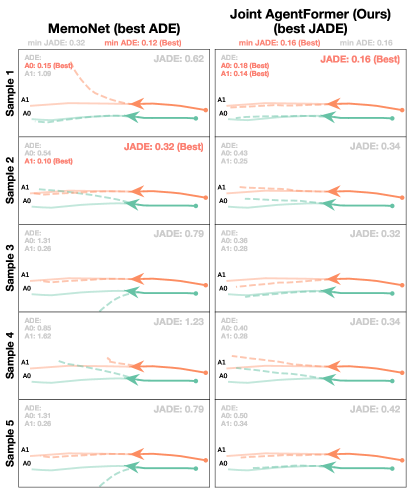
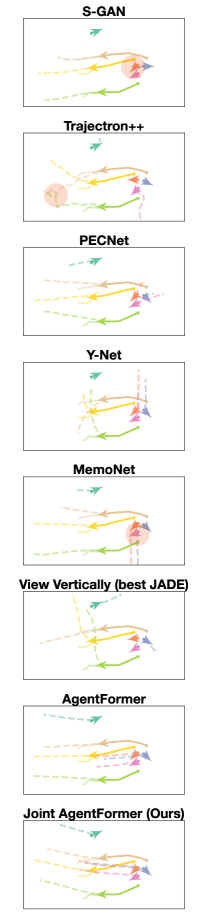
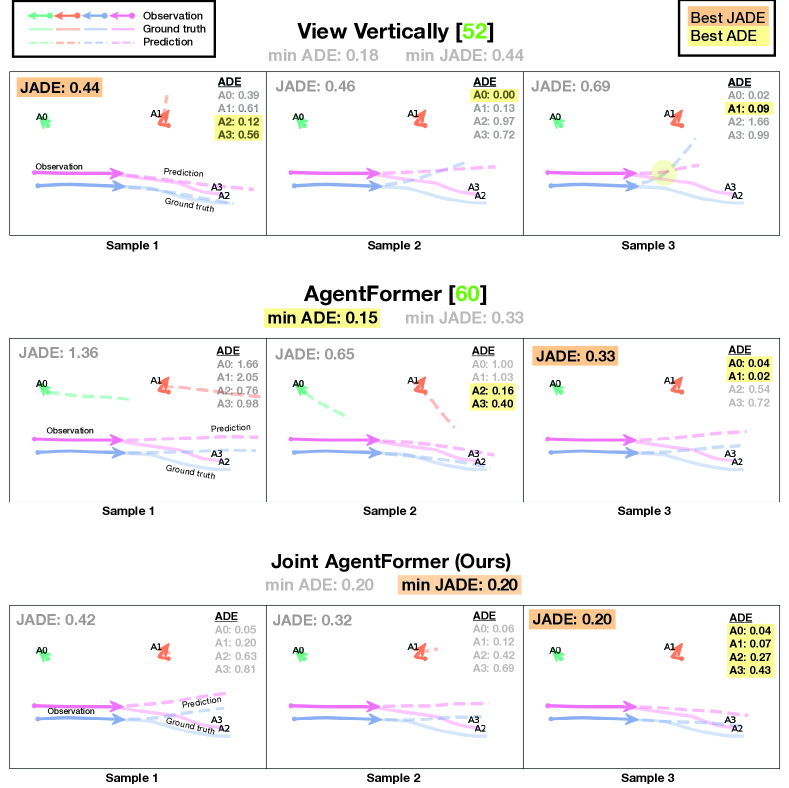
While our method does not achieve the best ADE / FDE (Table 1c), we argue that the decrease in ADE / FDE is worth the improvement in JADE / JFDE. As seen in the trajectory visualizations in Figure 2, which compares predictions from our method to that of View Vertically, a method may achieve excellent ADE / FDE yet still fall short at producing natural and socially-compliant trajectories for certain agents.
Collision Rate. Our Joint AgentFormer performs best across the board with respect to collision rate, as seen in Table 1b. We gain an improvement in collision rate as compared with the baselines although we do not optimize explicitly with respect to it, substantiating our claim that optimizing for joint performance also leads naturally to a decrease in collision rate.
| Interaction Category (proportion peds in category) | group (0.44) | collison avoidance (0.61) | leader- follower (0.03) | ETH / UCY aggregate (1.0) |
|---|---|---|---|---|
| AgentFormer [61] | 0.103 | 0.201 | 0.124 | 0.063 |
| Joint AgentFormer (Ours) | 0.084 | 0.180 | 0.103 | 0.053 |
| ground-truth | 0.010 | 0.011 | 0.028 | 0.005 |
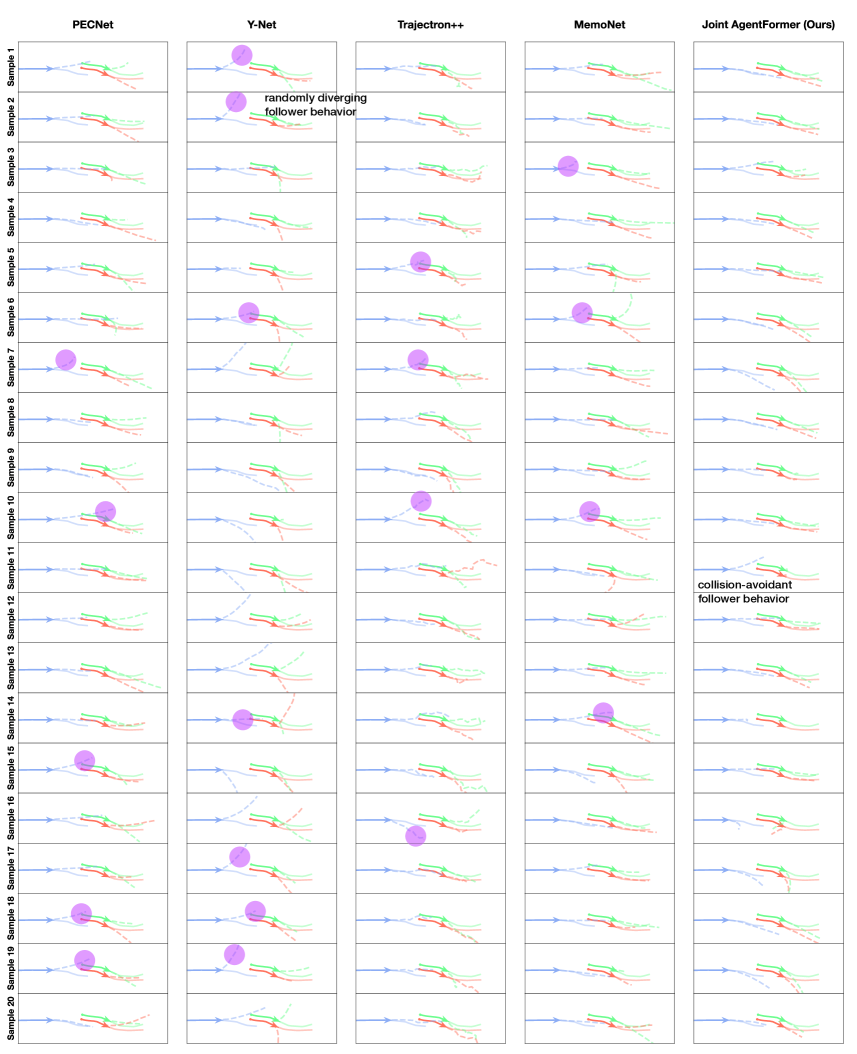
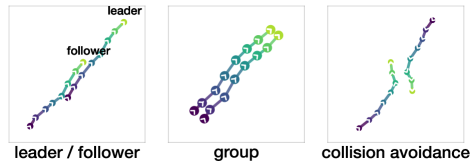
Interaction Categories. We studied the effect of our improvements across different cross sections of the data. Specifically, we heuristically define 3 different categories of interactions present within the data: group, leader-follower, and collision-avoidance. These interaction categories are used to categorize individual agents based on whether that agent interacts in a certain way with at least one other agent within a 20-frame sequence. The categories are not disjoint, so each agent may fall into none, one, or multiple categories. Group defines an agent who moves in parallel with another agent; leader-follower defines an agent who either is moving behind or before another agent in the same direction as that other agent; collision-avoidance defines an agent that comes within a distance threshold to another agent that is not moving in the same direction. Definitions of the heuristics used to create these categories can be found in the supplementary material; we take inspiration from and modify the heuristics used in [25]. Figure 3 shows examples of pedestrians within each category.
Using our defined categories, we examine collision rate performance on the ETH / UCY dataset. We highlight the success of our method with respect to modeling of pedestrians involved in interactions, as seen in Table 2: a 23% decrease in group, a 19% decrease in collision-avoidance, and a 24% decrease in leader-follower. These results substantiate our claim that our method improves social compliance.
| (meters) | |||||
| training step 1 | training step 2 | ||||
| Marginal term | Joint term | Marginal term | Joint term | ETH / UCY Average | |
|---|---|---|---|---|---|
| AgentFormer [61] | 0.384 / 0.749 | ||||
| - | 0.365 / 0.694 | ||||
| - | 0.386 / 0.734 | ||||
| - | 0.358 / 0.672 | ||||
| Ours | 0.357 / 0.672 | ||||
| ; samples | |||||
| training step 1 | training step 2 | ||||
| Marginal term | Joint term | Marginal term | Joint term | ETH / UCY Average | |
|---|---|---|---|---|---|
| AgentFormer [61] | 0.063 | ||||
| - | 0.064 | ||||
| - | 0.051 | ||||
| - | 0.053 | ||||
| Ours | 0.054 | ||||
| ; samples | |||||
| training step 1 | training step 2 | ||||
| Marginal term | Joint term | Marginal term | Joint term | ETH / UCY Average | |
|---|---|---|---|---|---|
| AgentFormer [61] | 0.233 / 0.393 | ||||
| - | 0.255 / 0.436 | ||||
| - | 0.293 / 0.516 | ||||
| - | 0.258 / 0.439 | ||||
| Ours | 0.245 / 0.414 | ||||
Ablation Studies. We perform ablations to study the effect on joint metric performance of using the marginal reconstruction loss and / or the joint reconstruction loss in both steps of AgentFormer training, as seen in Table 3.
An interesting observation is that training AgentFormer with only joint loss during both training steps (line 3 of Table 3a) does not result in as good JADE / JFDE as compared with training with both marginal and joint loss in the first step, and then only joint loss in the second (as we do in Our Joint AgentFormer, line 4 of Table 3a). A possible reason for this is because the joint prediction problem is inherently more difficult than the marginal prediction problem, due to having to optimize for joint performance of multiple agents rather than individual agents independently. As the joint loss function more naturally captures social compliance for the joint prediction problem than the marginal loss function, as previously established, optimizing it acquires the difficulty of the joint prediction problem.
Another point of interest with regard to the two-step training procedure of AgentFormer is that models trained with joint loss during the first AgentFormer training step show greater improvement in mean collision rate (Line 3 and 4 in Table 3b). This may be due to the fact that the first training step accounts for the majority of AgentFormer training, as that is when most weights of the CVAE are trained; the second training step only learns the weights of the Trajectory Sampler, which account for only a small fraction of the entire network.
7 Conclusion
In this paper, we illustrated the importance of joint metrics in addition to marginal metrics, presenting a comprehensive benchmark evaluation of SOTA methods in multi-agent trajectory forecasting with respect to JADE / JFDE and collision rate. Further, we proposed a new approach that optimizes for joint performance rather than only marginal performance. Our Joint AgentFormer achieves state-of-the-art results with respect to JADE / JFDE, outperforming all previous methods. Our Joint View Vertically also outperforms the original View Vertically. We also highlight the improvements achieved in collision rate, showing that joint optimization may also lead to improved interaction modeling. Finally, we push for the widespread adoption of joint metrics in trajectory forecasting evaluation, so we can achieve more realistic estimation of method performance; as well as the adoption of joint loss functions in optimization, so we can achieve better interaction modeling of multi-modal futures.
Acknowledgements. This work is supported in part by the Ford Foundation Fellowship. Thank you also to Ye Yuan and Aaditya Singh for their feedback on the manuscript.
References
- [1] Alexandre Alahi, Kratarth Goel, Vignesh Ramanathan, Alexandre Robicquet, Li Fei-Fei, and Silvio Savarese. Social LSTM: Human Trajectory Prediction in Crowded Spaces. In 2016 IEEE Conference on Computer Vision and Pattern Recognition (CVPR), pages 961–971, Las Vegas, NV, USA, June 2016. IEEE.
- [2] Ferran Alet, Erica Weng, Tomás Lozano-Pérez, and Leslie Pack Kaelbling. Neural Relational Inference with Fast Modular Meta-learning. page 12.
- [3] Elmira Amirloo, Amir Rasouli, Peter Lakner, Mohsen Rohani, and Jun Luo. LatentFormer: Multi-Agent Transformer-Based interaction modeling and trajectory prediction. Mar. 2022.
- [4] Mohammadhossein Bahari, Vahid Zehtab, Sadegh Khorasani, Sana Ayromlou, Saeed Saadatnejad, and Alexandre Alahi. SVG-Net: An SVG-based Trajectory Prediction Model. arXiv:2110.03706 [cs], Oct. 2021. arXiv: 2110.03706.
- [5] Yulong Cao, Chaowei Xiao, Anima Anandkumar, Danfei Xu, and Marco Pavone. AdvDO: Realistic adversarial attacks for trajectory prediction. In Computer Vision – ECCV 2022, pages 36–52. Springer Nature Switzerland, 2022.
- [6] Zhangjie Cao, Erdem Bıyık, Guy Rosman, and Dorsa Sadigh. Leveraging smooth attention prior for Multi-Agent trajectory prediction. Mar. 2022.
- [7] Yuning Chai, Benjamin Sapp, Mayank Bansal, and Dragomir Anguelov. MultiPath: Multiple Probabilistic Anchor Trajectory Hypotheses for Behavior Prediction. arXiv:1910.05449 [cs, stat], Oct. 2019. arXiv: 1910.05449.
- [8] Yuning Chai, Benjamin Sapp, Mayank Bansal, and Dragomir Anguelov. Multipath: Multiple probabilistic anchor trajectory hypotheses for behavior prediction. In Conference on Robot Learning, pages 86–99. PMLR, 2020.
- [9] Ming-Fang Chang, Deva Ramanan, James Hays, John Lambert, Patsorn Sangkloy, Jagjeet Singh, Slawomir Bak, Andrew Hartnett, De Wang, Peter Carr, and Simon Lucey. Argoverse: 3D Tracking and Forecasting With Rich Maps. In 2019 IEEE/CVF Conference on Computer Vision and Pattern Recognition (CVPR), pages 8740–8749, Long Beach, CA, USA, June 2019. IEEE.
- [10] Changan Chen, Sha Hu, Payam Nikdel, Greg Mori, and Manolis Savva. Relational Graph Learning for Crowd Navigation. arXiv:1909.13165 [cs], Aug. 2020. arXiv: 1909.13165.
- [11] Luigi Filippo Chiara, Pasquale Coscia, Sourav Das, Simone Calderara, Rita Cucchiara, and Lamberto Ballan. Goal-driven self-attentive recurrent networks for trajectory prediction. pages 2518–2527, Apr. 2022.
- [12] Scott Ettinger, Shuyang Cheng, Benjamin Caine, Chenxi Liu, Hang Zhao, Sabeek Pradhan, Yuning Chai, Ben Sapp, Charles Qi, Yin Zhou, Zoey Yang, Aurelien Chouard, Pei Sun, Jiquan Ngiam, Vijay Vasudevan, Alexander McCauley, Jonathon Shlens, and Dragomir Anguelov. Large scale interactive motion forecasting for autonomous driving : The waymo open motion dataset. Apr. 2021.
- [13] Ian J Goodfellow, Jean Pouget-Abadie, Mehdi Mirza, Bing Xu, David Warde-Farley, Sherjil Ozair, Aaron Courville, and Yoshua Bengio. Generative adversarial networks. arXiv preprint arXiv:1406.2661, 2014.
- [14] Jiaqi Guan, Ye Yuan, Kris M Kitani, and Nicholas Rhinehart. Generative hybrid representations for activity forecasting with no-regret learning. In Proceedings of the IEEE/CVF Conference on Computer Vision and Pattern Recognition, pages 173–182, 2020.
- [15] Agrim Gupta, Justin Johnson, Li Fei-Fei, Silvio Savarese, and Alexandre Alahi. Social gan: Socially acceptable trajectories with generative adversarial networks. In Proceedings of the IEEE Conference on Computer Vision and Pattern Recognition, pages 2255–2264, 2018.
- [16] Agrim Gupta, Justin Johnson, Li Fei-Fei, Silvio Savarese, and Alexandre Alahi. Social GAN: Socially Acceptable Trajectories With Generative Adversarial Networks. pages 2255–2264, 2018.
- [17] Dirk Helbing and Peter Molnar. Social Force Model for Pedestrian Dynamics. Physical Review E, 51(5):4282–4286, May 1995. arXiv: cond-mat/9805244.
- [18] Zhiyu Huang, Xiaoyu Mo, and Chen Lv. Multi-modal motion prediction with transformer-based neural network for autonomous driving. Sept. 2021.
- [19] Boris Ivanovic and Marco Pavone. The trajectron: Probabilistic multi-agent trajectory modeling with dynamic spatiotemporal graphs. In Proceedings of the IEEE/CVF International Conference on Computer Vision, pages 2375–2384, 2019.
- [20] Diederik P Kingma and Max Welling. Auto-encoding variational bayes. arXiv preprint arXiv:1312.6114, 2013.
- [21] Thomas Kipf, Ethan Fetaya, Kuan-Chieh Wang, Max Welling, and Richard Zemel. Neural relational inference for interacting systems. In International Conference on Machine Learning, pages 2688–2697. PMLR, 2018.
- [22] Vineet Kosaraju, Amir Sadeghian, Roberto Martín-Martín, Ian D Reid, Hamid Rezatofighi, and Silvio Savarese. Social-bigat: multimodal trajectory forecasting using bicycle-gan and graph attention networks. In Advances in Neural Information Processing Systems 2019. Neural Information Processing Systems (NIPS), 2019.
- [23] Parth Kothari and Alexandre Alahi. Safety-compliant generative adversarial networks for human trajectory forecasting. Sept. 2022.
- [24] Parth Kothari, Sven Kreiss, and Alexandre Alahi. Human Trajectory Forecasting in Crowds: A Deep Learning Perspective. arXiv:2007.03639 [cs], Jan. 2021. arXiv: 2007.03639.
- [25] Parth Kothari, Sven Kreiss, and Alexandre Alahi. Human trajectory forecasting in crowds: A deep learning perspective. IEEE Trans. Intell. Transp. Syst., 23(7):7386–7400, July 2022.
- [26] Parth Kothari, Brian Sifringer, and Alexandre Alahi. Interpretable Social Anchors for Human Trajectory Forecasting in Crowds. arXiv:2105.03136 [cs], May 2021. arXiv: 2105.03136.
- [27] Namhoon Lee, Wongun Choi, Paul Vernaza, Christopher B Choy, Philip HS Torr, and Manmohan Chandraker. Desire: Distant future prediction in dynamic scenes with interacting agents. In Proceedings of the IEEE Conference on Computer Vision and Pattern Recognition, pages 336–345, 2017.
- [28] Alon Lerner, Yiorgos Chrysanthou, and Dani Lischinski. Crowds by example. In Computer graphics forum, volume 26, pages 655–664. Wiley Online Library, 2007.
- [29] Alon Lerner, Yiorgos Chrysanthou, and Dani Lischinski. Crowds by Example. Computer Graphics Forum, 26(3):655–664, 2007. _eprint: https://onlinelibrary.wiley.com/doi/pdf/10.1111/j.1467-8659.2007.01089.x.
- [30] Junwei Liang, Lu Jiang, Kevin Murphy, Ting Yu, and Alexander Hauptmann. The Garden of Forking Paths: Towards Multi-Future Trajectory Prediction. arXiv:1912.06445 [cs], Mar. 2020. arXiv: 1912.06445.
- [31] Ming Liang, Bin Yang, Rui Hu, Yun Chen, Renjie Liao, Song Feng, and Raquel Urtasun. Learning lane graph representations for motion forecasting. July 2020.
- [32] Minghuan Liu, Tairan He, Minkai Xu, and Weinan Zhang. Energy-Based Imitation Learning. arXiv:2004.09395 [cs, stat], Apr. 2021. arXiv: 2004.09395.
- [33] Yuejiang Liu, Riccardo Cadei, Jonas Schweizer, Sherwin Bahmani, and Alexandre Alahi. Towards Robust and Adaptive Motion Forecasting: A Causal Representation Perspective. arXiv:2111.14820 [cs], Nov. 2021. arXiv: 2111.14820.
- [34] Yuejiang Liu, Qi Yan, and Alexandre Alahi. Social NCE: Contrastive Learning of Socially-aware Motion Representations. arXiv:2012.11717 [cs], Aug. 2021. arXiv: 2012.11717.
- [35] Karttikeya Mangalam, Yang An, Harshayu Girase, and Jitendra Malik. From Goals, Waypoints & Paths To Long Term Human Trajectory Forecasting. arXiv:2012.01526 [cs], Dec. 2020. arXiv: 2012.01526.
- [36] Karttikeya Mangalam, Harshayu Girase, Shreyas Agarwal, Kuan-Hui Lee, Ehsan Adeli, Jitendra Malik, and Adrien Gaidon. It Is Not the Journey but the Destination: Endpoint Conditioned Trajectory Prediction. arXiv:2004.02025 [cs], July 2020. arXiv: 2004.02025.
- [37] Karttikeya Mangalam, Harshayu Girase, Shreyas Agarwal, Kuan-Hui Lee, Ehsan Adeli, Jitendra Malik, and Adrien Gaidon. It is not the journey but the destination: Endpoint conditioned trajectory prediction. In European Conference on Computer Vision, pages 759–776. Springer, 2020.
- [38] Abduallah Mohamed, Kun Qian, Mohamed Elhoseiny, and Christian Claudel. Social-STGCNN: A Social Spatio-Temporal Graph Convolutional Neural Network for Human Trajectory Prediction. arXiv:2002.11927 [cs], Mar. 2020. arXiv: 2002.11927 version: 3.
- [39] S. Pellegrini, A. Ess, K. Schindler, and L. van Gool. You’ll never walk alone: Modeling social behavior for multi-target tracking. In 2009 IEEE 12th International Conference on Computer Vision, pages 261–268, Sept. 2009. ISSN: 2380-7504.
- [40] Danilo Rezende and Shakir Mohamed. Variational inference with normalizing flows. In International Conference on Machine Learning, pages 1530–1538. PMLR, 2015.
- [41] Nicholas Rhinehart, Kris M Kitani, and Paul Vernaza. R2p2: A reparameterized pushforward policy for diverse, precise generative path forecasting. In Proceedings of the European Conference on Computer Vision (ECCV), pages 772–788, 2018.
- [42] Nicholas Rhinehart, Rowan McAllister, Kris Kitani, and Sergey Levine. Precog: Prediction conditioned on goals in visual multi-agent settings. In Proceedings of the IEEE/CVF International Conference on Computer Vision, pages 2821–2830, 2019.
- [43] Alexandre Robicquet, Amir Sadeghian, Alexandre Alahi, and S. Savarese. Learning Social Etiquette: Human Trajectory Understanding In Crowded Scenes. In ECCV, 2016.
- [44] Saeed Saadatnejad, Mohammadhossein Bahari, Pedram Khorsandi, Mohammad Saneian, Seyed-Mohsen Moosavi-Dezfooli, and Alexandre Alahi. Are socially-aware trajectory prediction models really socially-aware? arXiv:2108.10879 [cs], Aug. 2021. arXiv: 2108.10879.
- [45] Amir Sadeghian, Vineet Kosaraju, Ali Sadeghian, Noriaki Hirose, Hamid Rezatofighi, and Silvio Savarese. Sophie: An attentive gan for predicting paths compliant to social and physical constraints. In Proceedings of the IEEE/CVF Conference on Computer Vision and Pattern Recognition, pages 1349–1358, 2019.
- [46] Tim Salzmann, Boris Ivanovic, Punarjay Chakravarty, and Marco Pavone. Trajectron++: Dynamically-Feasible Trajectory Forecasting With Heterogeneous Data. arXiv:2001.03093 [cs], Jan. 2021. arXiv: 2001.03093.
- [47] Samuel S. Sohn, Mihee Lee, Seonghyeon Moon, Gang Qiao, Muhammad Usman, Sejong Yoon, Vladimir Pavlovic, and Mubbasir Kapadia. A2X: An Agent and Environment Interaction Benchmark for Multimodal Human Trajectory Prediction. In Motion, Interaction and Games, pages 1–9, Virtual Event Switzerland, Nov. 2021. ACM.
- [48] Yuchao Su, Jie Du, Yuanman Li, Xia Li, Rongqin Liang, Zhongyun Hua, and Jiantao Zhou. Trajectory Forecasting Based on Prior-Aware Directed Graph Convolutional Neural Network. IEEE Transactions on Intelligent Transportation Systems, pages 1–13, 2022. Conference Name: IEEE Transactions on Intelligent Transportation Systems.
- [49] Pei Sun, Henrik Kretzschmar, Xerxes Dotiwalla, Aurelien Chouard, Vijaysai Patnaik, Paul Tsui, James Guo, Yin Zhou, Yuning Chai, Benjamin Caine, Vijay Vasudevan, Wei Han, Jiquan Ngiam, Hang Zhao, Aleksei Timofeev, Scott Ettinger, Maxim Krivokon, Amy Gao, Aditya Joshi, Yu Zhang, Jonathon Shlens, Zhifeng Chen, and Dragomir Anguelov. Scalability in Perception for Autonomous Driving: Waymo Open Dataset. In 2020 IEEE/CVF Conference on Computer Vision and Pattern Recognition (CVPR), pages 2443–2451, Seattle, WA, USA, June 2020. IEEE.
- [50] Qiao Sun, Xin Huang, Junru Gu, Brian C Williams, and Hang Zhao. M2I: From factored marginal trajectory prediction to interactive prediction. Feb. 2022.
- [51] Yichuan Charlie Tang and Ruslan Salakhutdinov. Multiple futures prediction. arXiv preprint arXiv:1911.00997, 2019.
- [52] Xinshuo Weng, Ye Yuan, and Kris Kitani. Joint 3d tracking and forecasting with graph neural network and diversity sampling. arXiv preprint arXiv:2003.07847, 2020.
- [53] Conghao Wong, Beihao Xia, Ziming Hong, Qinmu Peng, Wei Yuan, Qiong Cao, Yibo Yang, and Xinge You. View vertically: A hierarchical network for trajectory prediction via fourier spectrums. In Computer Vision – ECCV 2022, pages 682–700. Springer Nature Switzerland, 2022.
- [54] Chenxin Xu, Weibo Mao, Wenjun Zhang, and Siheng Chen. Remember intentions: Retrospective-Memory-based trajectory prediction. Mar. 2022.
- [55] Yu Yao, Ella Atkins, Matthew Johnson-Roberson, Ram Vasudevan, and Xiaoxiao Du. BiTraP: Bi-Directional pedestrian trajectory prediction with Multi-Modal goal estimation. IEEE Robotics and Automation Letters, 6(2):1463–1470, Apr. 2021.
- [56] Cunjun Yu, Xiao Ma, Jiawei Ren, Haiyu Zhao, and Shuai Yi. Spatio-Temporal graph transformer networks for pedestrian trajectory prediction. In Computer Vision – ECCV 2020, pages 507–523. Springer International Publishing, 2020.
- [57] Ye Yuan and Kris Kitani. Diverse trajectory forecasting with determinantal point processes. arXiv preprint arXiv:1907.04967, 2019.
- [58] Ye Yuan and Kris Kitani. DLow: Diversifying latent flows for diverse human motion prediction. Mar. 2020.
- [59] Ye Yuan and Kris Kitani. Dlow: Diversifying latent flows for diverse human motion prediction. In European Conference on Computer Vision, pages 346–364. Springer, 2020.
- [60] Ye Yuan, Xinshuo Weng, Yanglan Ou, and Kris Kitani. AgentFormer: Agent-Aware transformers for Socio-Temporal Multi-Agent forecasting. pages 9813–9823, Mar. 2021.
- [61] Ye Yuan, Xinshuo Weng, Yanglan Ou, and Kris Kitani. AgentFormer: Agent-Aware Transformers for Socio-Temporal Multi-Agent Forecasting. arXiv:2103.14023 [cs], Oct. 2021. arXiv: 2103.14023.
- [62] Jiangbei Yue, Dinesh Manocha, and He Wang. Human trajectory prediction via neural social physics. July 2022.
- [63] Qingzhao Zhang, Shengtuo Hu, Jiachen Sun, Qi Alfred Chen, and Z Morley Mao. On adversarial robustness of trajectory prediction for autonomous vehicles. pages 15159–15168, Jan. 2022.
- [64] Hang Zhao, Jiyang Gao, Tian Lan, Chen Sun, Benjamin Sapp, Balakrishnan Varadarajan, Yue Shen, Yi Shen, Yuning Chai, Cordelia Schmid, Congcong Li, and Dragomir Anguelov. TNT: Target-driveN Trajectory Prediction. arXiv:2008.08294 [cs], Aug. 2020. arXiv: 2008.08294.
- [65] He Zhao and Richard P Wildes. Where are you heading? dynamic trajectory prediction with expert goal examples. In 2021 IEEE/CVF International Conference on Computer Vision (ICCV), pages 7629–7638. IEEE, Oct. 2021.
- [66] Tianyang Zhao, Yifei Xu, Mathew Monfort, Wongun Choi, Chris Baker, Yibiao Zhao, Yizhou Wang, and Ying Nian Wu. Multi-agent tensor fusion for contextual trajectory prediction. In Proceedings of the IEEE/CVF Conference on Computer Vision and Pattern Recognition, pages 12126–12134, 2019.
Appendix A Additional Trajectory Visualizations across Methods
Additional examples in the style of Figure 2 of performance comparisons across methods on specific trajectory sequences can be seen in Figures 4-10.