Auditing Cross-Cultural Consistency of Human-Annotated Labels for Recommendation Systems
Abstract.
Recommendation systems increasingly depend on massive human-labeled datasets; however, the human annotators hired to generate these labels increasingly come from homogeneous backgrounds. This poses an issue when downstream predictive models—based on these labels—are applied globally to a heterogeneous set of users. We study this disconnect with respect to the labels themselves, asking whether they are “consistently conceptualized” across annotators of different demographics. In a case study of video game labels, we conduct a survey on 5,174 gamers, identify a subset of inconsistently conceptualized game labels, perform causal analyses, and suggest both cultural and linguistic reasons for cross-country differences in label annotation. We further demonstrate that predictive models of game annotations perform better on global train sets as opposed to homogeneous (single-country) train sets. Finally, we provide a generalizable framework for practitioners to audit their own data annotation processes for consistent label conceptualization, and encourage practitioners to consider global inclusivity in recommendation systems starting from the early stages of annotator recruitment and data-labeling.
1. Introduction
Labels are used for genre construction and assignment across modes of entertainment like movies, music, and games. Labeling is similarly the goal of many prediction tasks across domains, including computer vision (e.g., art classification (Lecoutre et al., 2017) and scene understanding (Patterson et al., 2014)), speech (e.g., accent classification (Faria, 2006) and sound event annotation (Kim, Bongjun, 2021)), and natural language processing (e.g., identifying personal attacks (Wulczyn et al., 2017), emotionally manipulative language (Huffaker et al., 2020), and misinformation (Mitra and Gilbert, 2021)).
In order to generate predictions of labels, recommendation systems are often built on extensive datasets labeled by human annotators, which are in turn used to train and evaluate these predictive machine learning (ML) models. To curate a massive labeled dataset, practitioners commonly leverage crowdsourcing, which distributes data labeling microtasks cheaply and efficiently to online crowdworkers (Buhrmester et al., 2011). Crowdsourcing is similarly used by entertainment platforms to highlight user-generated labels for shopping or games (Perez, 2017; Steam, 2023). While much research has historically been conducted on the variable quality of crowdsourced annotators—for example, on popular crowdsourcing platform Amazon Mechanical Turk (Snow et al., 2008; Ipeirotis et al., 2010; Kees et al., 2017; Peer et al., 2013)—only recently have researchers turned to studying the demographic makeup of human annotators.
This newer body of work stresses that an annotator’s demographic identity shapes their understanding of the world, leading to different labeling outcomes (Posch et al., 2022; Ghosh et al., 2021; Reinecke and Gajos, 2015; Northcutt et al., 2021), and that responsible data labeling should consider who the labelers are (Díaz et al., 2022). However, crowdsourcing platforms often lack diversity across annotators. On Amazon Mechanical Turk, over 91% of the annotators come from either the US or India (Difallah et al., 2018; Ross et al., 2010). The broader data-labeling industry increasingly outsources labeling tasks to specific developing countries where hiring annotators costs significantly less (Chen, 2022; Pak, 2021; Murgia, 2019; Hale, 2019).
The resulting labels, as part of massive labeled datasets, are then used to train predictive models that in turn predict new labels that are often applied to a global audience. However, problems arise when the demographic makeup of the annotators (often hailing from only one or two countries) is not representative of the demographic makeup of the end users of the ML-predicted labels. For example, an American company found a 30% label error rate when auditing Google’s “GoEmotion” dataset wherein English language text comments were each labeled with emotions; while Google’s annotators were all native English speakers from India, there was a cultural divide over linguistic interpretations of the American-centric English in the text (Chen, 2022).
With non-representative annotators, predictive models overfit training data generated by a limited number of countries and/or languages. In turn, the same models are then used to generate labels for broader global populations. This global reach often takes the form of recommendation systems (Pu et al., 2012; Resnick et al., 1994), which take as input human-annotated labels that may carry cultural assumptions, and generate recommendations for users assuming the same cultural assumptions hold. This allows the annotators’ cultural biases to percolate through the recommendation system. For example, when Netflix first developed its recommendations of “genre rows” using a global algorithm in 2015 (Gomez-Uribe and Hunt, 2015)—at which point it had not yet reached substantial viewership in smaller countries—Netflix used recommendations trained on viewers predominantly from the US and developed Western countries (Gaw, 2021) to generate recommendations in smaller countries.
We refer to the group-based differences in annotator’s labels—e.g., between English speakers from India vs. English speakers from America, or between Netflix watchers in small countries vs. Netflix watchers in large countries—as “inconsistent conceptualization” of labels. When presenting labels to a global audience, whether the labels reflect a movie genre or a game tag, it is ideal to ensure that labels are “consistently conceptualized” across countries and languages to minimize user confusion. Additionally, consistent conceptualization is useful to ensure consistent interpretation of predicted label outputs from a recommendation system across different countries and languages. Meanwhile, a label that is not consistently conceptualized is not necessarily unusable; however, it may require additional effort to interpret and correct for appropriate country- or language-biased label predictions. Evaluating a label for consistent conceptualization allows stakeholders to explain and/or mitigate discrepancies in global user behavior.
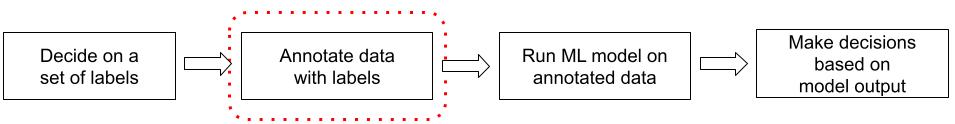
Given the high impact of global-scale recommendations, our research question is: how can we audit label annotations for better generalization to a global audience? Per Figure 1, our paper’s focus is on auditing the annotation process for bias—before labels are input to any predictive ML models such as recommendation systems.
In this paper, we examine the upstream labeling process by focusing on a case study of video game labels annotated by 5,174 survey participants spanning 16 countries and 9 languages. We first audit whether game labels are conceptualized consistently across demographics, and explore why inconsistent conceptualization may occur—due to cultural and translation-based phenomena. We then quantify the bias that would arise from using homogeneous annotators from only one country, and find that models predicting label annotations perform better when they are trained on data labeled by heterogeneous annotators—especially so for inconsistently conceptualized game labels. Finally, we provide a framework for practitioners to follow when auditing analogous labels and suggest methods to mitigate bias across demographics.
2. Related Work
As recommendation predictions increasingly influence numerous aspects of our daily lives (Mehrabi et al., 2021), more concerns have been raised about the robustness of human-annotated datasets (Aroyo and Welty, 2015; Parmar et al., 2023), and more research has been conducted on their potential to reinforce bias in society (Zou and Schiebinger, 2018), which can arise at any of the four stages in the ML pipeline illustrated in Figure 1. In this section, we review the prior work on measuring bias in machine learning following Figure 1, focusing on challenges specific to game genre labels and recommendation systems.
First, deciding on the labels themselves is a difficult task prone to bias. A preliminary question is who generates the labels; the answer could range from the platform themselves, to users on a platform, to an external board. For any of these parties, the following concerns must be considered; we focus on game labels as a running example.
-
(1)
Generating overly broad labels (such as Action-Adventure, which is so wide-ranging that it becomes less meaningful) (Clarke et al., 2017)
-
(2)
Generating overlapping labels such that an annotator could over-apply labels to a game—such as tagging a single game with labels for Action, Adventure, and First-Person Action, hence confusing users and making game marketing more difficult (Clarke et al., 2017)
-
(3)
Being overly defined by social conventions, so that understanding labels is challenging for users unfamiliar with the domain or from different cultures (Lee et al., 2005)
-
(4)
Changing label definitions due to “genre colonization,” occurring when elements of one label are used to rationalize and legitimize changes in another label over time (Beghtol, 2005)
-
(5)
Crowdsourcing label generation, yielding noisy data that represents unrelated aspects to the desired labels (Clarke et al., 2017)
-
(6)
Choosing relevant levels of a label (e.g., “Is this an action game?” versus “On a scale of 1-5, how much do you believe this is an action game?”), usually through absolute rating scales, often in the form of a binary or Likert scale (Kittross, 1959). Divergent interpretations of a scale based on abstract text descriptions can become a source of disagreement and inconsistency across annotators (Weijters et al., 2016).
Second, annotating the data using the labels determined in the first stage is a non-trivial task that includes recruiting annotators, which is prone to bias along with the annotators’ potentially inconsistent conceptualization of labels. Prior work has been conducted to account for the demographic makeup of annotators. Barbosa and Chen (Barbosa and Chen, 2019) created a crowdsourcing framework that allocates microtasks considering crowdworkers’ demographics and compensation. Gordon et al. (Gordon et al., 2022) contributed a deep learning architecture that models every annotator in the dataset, amplifying minority groups’ labels based on the model context through a metaphor of a jury. Our work, while also examining this second piece of the pipeline, differentiates from this earlier work by focusing on the specific interactions between annotator groups and the conceptualization of the label itself arising from cultural and linguistic differences.
Third, there may be bias in the model itself. This step involves bias mitigation strategies including pre-, in-, and post-processing. Pre-processing transforms training data to reduce potential sources of bias (d’Alessandro et al., 2017; Mehrabi et al., 2021); in-processing often modifies the learning objective in the training process (Berk et al., 2017; Mehrabi et al., 2021); and post-processing takes place after training by accessing a holdout set and transforming model scores (d’Alessandro et al., 2017; Mehrabi et al., 2021).
Fourth, there may be bias in the decision-making that arises as a result of model outputs. For example, an ML model may output predictions for whether different games are classified as ’action’ games or not. A recommendation system might then take those predictions as input, and decide how to rank them in order to recommend games to users (Schafer et al., 2007). Much progress has been made in measuring the ranking effectiveness of recommender systems on diverse groups (Ekstrand et al., 2018; Mehrotra et al., 2017). Numerous related bias mitigation techniques have been proposed specifically for recommendation systems (Zhu and Caverlee, 2022; Zhu et al., 2020; Burke, 2017; Abdollahpouri and Burke, 2019; Chen et al., 2023; Li et al., 2021).
This paper focuses on the second stage of the pipeline in Figure 1: auditing the data annotation process. However, the other three pieces of the pipeline are similarly critical to evaluating bias, and any biases arising from the first stage of the pipeline would necessarily confound the second stage. As such, a critical assumption of the case study presented in this work is that our game labels from the first stage were appropriately conceived to minimize the concerns itemized above.
3. Case Study: Video Game Labels
To illustrate how we examine the consistent conceptualization of labels, we present a case study of video game labels. Game labels are not only pertinent for understanding the landscape of the video game industry (forecasted to grow by 50% over the next five years (Christofferson et al., 2022)), but also lead to better user experiences on gaming platforms (Abhishek, 2022). Appropriate game labels allow for more direct searches, and can feed into more accurate recommendation systems for users.
We conducted a large-scale survey in the Xbox gaming ecosystem wherein respondents annotated different games using given labels (e.g., “Is [game] an action game?”). Our analysis reveals that we can identify inconsistently conceptualized labels across countries, and we use one such label as a running example throughout the case study. We then present two explanations for why certain labels are inconsistently conceptualized, based on (1) cultural differences and (2) translation differences. Finally, we show that label predictions can be improved if trained on a dataset of a heterogeneous global population of annotators rather than a small homogeneous population from a single country.
3.1. Data
Our analysis is based on an email survey conducted in May-June 2022 targeting Xbox gamers. The survey was run in 16 countries: Argentina, Chile, Colombia, Mexico, Brazil, Germany, Greece, Japan, Poland, Saudi Arabia, South Korea, India, Nigeria, Singapore, South Africa, and the United States. These countries were selected to provide coverage of all distinct regions in the Inglehart–Welzel Cultural Map (Inglehart, 2006).
The survey first allowed the respondent to select which of 11 popular video games they had played in the past year. Then, for the games the respondent selected, they were asked to annotate the game using any of 28 labels presented (such as “action”, “cozy”, etc.). We also collected respondent demographic information such as age, gender, gaming frequency, and gaming device.
For respondents in countries where English is not an official language, the entire survey text was translated to their local language.111The non-English survey languages were: Spanish, Portuguese, German, Greek, Japanese, Polish, Arabic, and Korean. In this process, we performed translation and back-translation by native speakers to ensure translation consistency across languages (Brislin, 1970). We additionally recruited a smaller sample of global Xbox Ambassadors (Xbox, 2023)—individuals who are known to be bilingual and opt-in to additional communications from Xbox—to respond to the survey in English; the Xbox Ambassadors were primarily based in the US, Brazil, German, Mexico, and Poland. To summarize, all individuals with IP addresses in India, Nigeria, Singapore, South Africa, and the US were served only surveys in English; individuals in all other countries were served surveys either in their local language or—if they are an Xbox Ambassador known to be bilingual—English.
In total, we received 5,174 survey responses with complete demographic information; the dominant respondent demographic was US-based men in the 25-44 age range, which is reflective of both the demographics of individuals who opt in to receive emails from Xbox, and the selection bias arising from individuals who choose to proactively fill out the survey for no reward. We explore and statistically correct for the respondents’ demographic skew relative to overall gamer populations in subsection 3.2. Full details of our survey, including respondent demographics and survey question phrasing, can be found in Appendix A.
3.2. Evaluating Labels for Consistent Conceptualization
We begin by examining game labels that are inconsistently conceptualized across different demographic groups, and to what extent. To do so, we perform multilevel regression and post-stratification (MRP) (Little, 1993; Wang et al., 2015) to address the imbalanced nature of our dataset. We first run a Bayesian logistic regression using survey respondents’ demographic attributes as covariates to generate a distribution of predictions for whether or not a certain label would be annotated for each game. Then, the ensuing predictions are weighted via post-stratification to resemble the known joint distributions of age, gender, and country demographics for Xbox players writ large.222Further implementation details can be found in Appendix C; data is proprietary to Microsoft. Code to reproduce our methods can be found at https://github.com/koenecke/crosscultural_labelconsistency/. In doing so, our post-stratified estimates of label selection are more accurate over subgroups (Park et al., 2004)—specifically, upweighting respondents with smaller sample sizes such as female or non-US respondents (Wang et al., 2015; Koenecke et al., 2023). Note that for the ensuing analyses, we remove respondents from India and Saudi Arabia, as well as non-binary individuals, due to recruiting only 1 or fewer respondents answering the survey for multiple games; however, we comment on extensions of our model to these subgroups in subsection 3.4. We similarly exclude anonymized Game 11 from our analysis due to low survey response rates detailed in Appendix A.
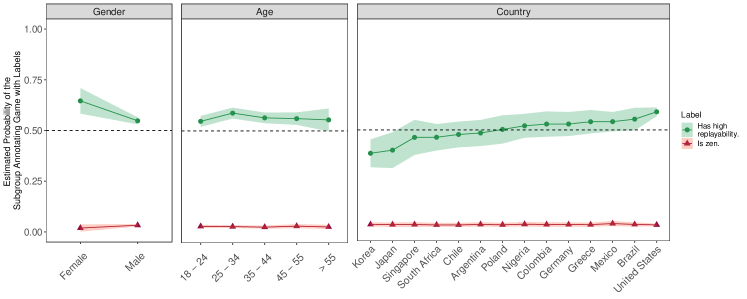
As a running example, in Figure 2 we show the post-stratified predictions of the “high replayability” label for each demographic subgroup regarding a certain popular action game (anonymized in this paper). We consider the “high replayability” label for this game to be inconsistently conceptualized per the green line in Figure 2: our model estimates less than a 39% probability that gender- and age-representative Korean gamers would consider the game to be highly replayable; in a majority vote among Koreans, this game would not be given the “high replayability” label. In contrast, we estimate a 59% probability that gender- and age-representative American gamers would consider the game to be highly replayable; in a majority vote among Americans, the game would be labeled with the inverse of the Korean consensus.333Estimated shares in Figure 2 are aggregated for each x-axis value; for example, the roughly 40% likelihood of a Korean gamer annotating the game as highly replayable is a weighted average based on the true underlying Xbox population of Korean gamers, based on the proportions in each age, and gender intersection—e.g., weighted by the share of 18-24 year old Korean men, the share of 25-34 year old Korean women, and so on. Similarly, the post-stratified estimate for female gamers is based on a weighted average of of underlying Xbox population data on each country and age breakdown, among women; the post-stratified estimate for gamers aged 18-24 is based on a weighted average of underlying Xbox population data on each country and gender breakdown, among 18-24 year olds. A majority vote would result in this action game being annotated with the “high replayability” label in some countries (Poland, Nigeria, Germany, Colombia, Greece, Mexico, Brazil, and the US), but not it would not be annotated as such in other countries (Korea, Japan, Singapore, South Africa, Chile, and Argentina).
In contrast, Figure 2 also presents an example of a consistently conceptualized label, “zen” (red line): all country subgroups—and gender and age subgroups—agree that the action game should not be annotated with this label. We further note that consistent conceptualization of labels is dependent on game. For example, the “zen” label is more likely to be consistently conceptualized (and not be annotated) for an action game than, say, a cozy game. As such, we consider inconsistently and consistently conceptualized labels on the basis of game-label pairs (of which there are 280 in total). We recognize that deciding whether a label is inconsistently conceptualized is inherently a source of bias, given that the practitioner must decide which subgroups to examine for inconsistency, and what threshold cutoffs are relevant.
While we cannot provide a one-size-fits-all formal mathematical definition for inconsistent conceptualization for all domains, we use this terminology to describe labels that have high variance across and within demographic subgroups, and when the subgroup mean straddles the 50% mark for binary labels. For the ensuing analyses in this paper, we categorize 55 game-label pairs as “inconsistently conceptualized” labels, having cross-country standard deviations greater than 0.05 among post-stratified estimates (calculated from the “Country” facet of Figure 2) and with post-stratified country-level estimates both over and under the majority 50% line. Cross-country standard deviations for our surveyed labels and anonymized games are presented in Figure 10 in Appendix D.
Our designation of inconsistent labels is robust across reasonable definitions. The post-stratified estimates presented in Figure 2 are similar to the unweighted raw survey results (Figure 7 in Appendix B), indicating that our survey respondent pool is reflective of the true underlying gamer demographic distribution from which we sampled.444Our analyses are robust to choice of standard deviation size and threshold-crossing; results hold directionally (though in smaller magnitudes) even when 132 (nearly half of) game-label pairs are categorized as “inconsistently conceptualized.” We further confirm that our 55 “inconsistently conceptualized” labels are reasonable by calculating the Spearman correlations of the rankings of post-stratified estimates from Figure 2. For example, for a certain action game, we can rank the 28 labels in order of most-annotated to least-annotated for the game among one country’s annotators (e.g., “action” has rank 1, “zen” has rank 28). We can then compare those rankings to the rankings elicited from another country’s annotators. We find that while the overall ranking similarity is quite high between country pairs (Spearman correlation seeing a minimum of 0.7 and mode of 0.97, histogram provided in Appendix C), the inconsistently conceptualized labels are more prone to be ranked out-of-order between country pairs: the median rank-difference among inconsistently conceptualized labels is 1.5, whereas the median rank-difference among consistently conceptualized labels was only 1.0.
Our case study focuses on the inconsistent conceptualizations across countries, where there tends to be higher variance across game labels relative to age- or gender-groups of label annotations. For example, in the “high replayability” example in Figure 2, we see a 20-percentage-point spread of estimates across countries versus a roughly 10-percentage-point spread of estimates by gender. We now turn to understanding why country-level differences arise.
3.3. Explanations for Inconsistent Conceptualization
We present two explanations for the country-level differences in label conceptualization across our surveyed labels. The first invokes cultural frameworks from the sociology literature, and the second involves semantic differences in language translations.
3.3.1. Cultural Distances
Much prior work has been conducted across sociology to measure cross-cultural similarities via indices, including the World Value Survey (Inglehart, 2006) used for our country selection process per Section 3.1, and the Hofstede Model of Culture (Hofstede, 1980). The Hofstede Model of Culture consists of six dimensions of national cultures (developed over the course of 1991 (Hofstede, 1980) to 2010 (Hofstede and Minkov, 2010; Bond, 1991)): power distance, uncertainty avoidance, individualism/collectivism, masculinity/feminity, long/short-term orientation, and indulgence/restraints. Each country is mapped to six numeric indices ranging from 0 to 100%.
First, we generate a Cultural Distance Index based on the subset of Hofstede dimensions that we hypothesize can explain different countries’ label annotations. To determine which dimensions are relevant, we run a logistic regression similar to subsection 3.2 across all survey responses on all games and labels, but replace the country categorical covariate with the six Hofstede dimensions. We find that the coefficients on two dimensions are significant at the p ¡ 0.001 level and have the highest magnitude of all dimensions; these two dimensions are “uncertainty” and “orientation” (regression results are presented in Table 3 in Appendix C).555A third Hofstede dimension, “individualism,” is weakly significant (p ¡ 0.1) with small coefficient magnitude in the regression specification. Individualism/Collectivism refers to the “integration of individuals into primary groups,” where individualism aligns with cultures wherein “ties between individuals are loose: everyone is expected to look after him/herself and his/her immediate family” (Hofstede, 1980). Our analyses are robust to including the individualism dimension in our cultural distance index, though the relationship plotted in Figure 4 is very slightly weaker when including “individualism”, still yielding a Spearman correlation of -0.4.
The uncertainty Hofstede dimension is based on the concept of “uncertainty avoidance,” defined as “the extent to which the members of a culture feel threatened by ambiguous or unknown situations” (Hofstede, 1980) under the premise that “extreme ambiguity creates intolerable anxiety.” Hofstede’s uncertainty dimension measures how much or little a society copes with anxiety by minimizing uncertainty (a high Hofstede uncertainty dimension indicates low tolerance for uncertainty). This is considered a proxy for the threat of change to a culture. Meanwhile, the orientation Hofstede dimension is on the spectrum between short-term and long-term orientation. Short-term orientation is defined as “the fostering of virtues related to the past and present—in particular, respect for tradition, preservation of ‘face,’ and fulfilling social obligations”; meanwhile, long-term orientation is defined as “the fostering of virtues oriented towards future rewards—in particular, perseverance and thrift.” (Hofstede, 1980). Both uncertainty and orientation dimensions are highly relevant to the labels with which one might annotate video games, wherein ambiguity, surprise, patience, and reward-seeking behaviors are often key components (Lukosch et al., 2017; Kuo et al., 2022).
We hence calculate a Cultural Distance Index (CDI) defined as the Euclidean distance between country pairs in the uncertainty and orientation dimensions; for example, Argentina and Mexico have a very close CDI of 0.06, whereas Korea and Nigeria have a nearly polar opposite CDI of 0.92. We then explore whether countries that are more culturally similar—i.e., have a smaller CDI—also annotate game labels more similarly.
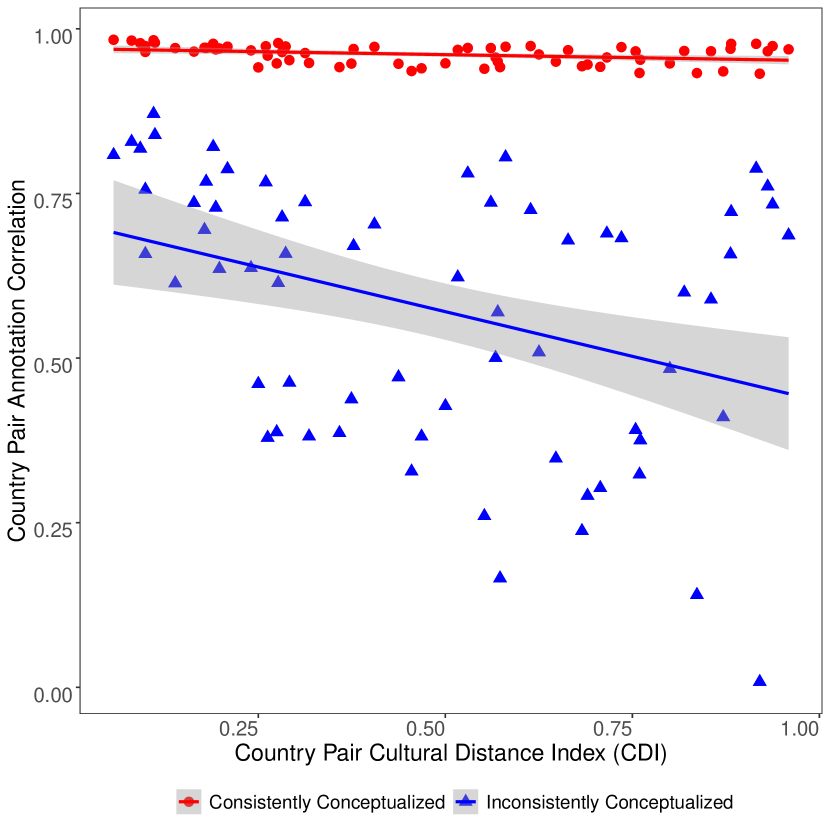
To determine game label annotation similarity by country pairs, we calculate the Pearson correlation between each country’s post-stratified estimates across games and labels. Specifically, for each game and label combination, we calculate one post-stratified estimate of each country’s likelihood of annotating the game with that label (e.g., roughly 60% for the US, for a specific action game with the “high replayability” label, per Figure 2). We then compare estimates for “inconsistently” and “consistently” conceptualized labels in aggregate. Hence, for each country, we generate one 55-length vector of “inconsistently conceptualized” game-label annotation estimates, and another vector of the remaining 225 “consistently conceptualized” game-label annotation estimates. For each pair of countries, we calculate the Pearson correlation between their two 55-length “inconsistently conceptualized” vectors, and the Pearson correlation between their two 225-length “consistently conceptualized” vectors. The relationship between CDI and label similarity, stratified by label consistency, is plotted in Figure 4.
The first takeaway is a confirmation of our definition of “inconsistently conceptualized” labels in subsection 3.2: indeed, the game-label pairs we deem to be consistently conceptualized yield high (often close to perfect) annotation correlation regardless of country pair. Meanwhile, inconsistently conceptualized labels have much lower between-country agreement. The second takeaway is that as cultural distance (CDI) increases—that is, cultural similarity decreases—game label annotation similarity also decreases. While this is a weak decreasing effect among consistently conceptualized labels, we in contrast see a stronger negative relationship (slope -0.3, with a weakly negative Spearman correlation of -0.4) for inconsistently conceptualized labels. For example, the culturally close countries of Mexico and Argentina have a perfect annotation correlation of 1.0 for consistently conceptualized labels, and lower but still high correlation of 0.8 for inconsistently conceptualized labels. Meanwhile, the culturally distant countries of Korea and Nigeria have a high annotation correlation of 0.9 for consistently conceptualized labels and the lowest (0.0) annotation correlation for inconsistently conceptualized labels.
To summarize, we find that the lower the CDI (i.e., the more “culturally similar” a pair of countries are per the Hofstede model), the more similarly respondents from those countries tend to annotate game labels. While we cannot draw concrete causal conclusions from specific cultural differences to general game-label conceptualization consistency, we do find that culture may play a non-negligible role in understanding country-based differences in game label annotations.
3.3.2. Lost in Translation
In addition to modeling culture, another explanation for inconsistently conceptualized labels across countries lies in the label text itself. Translation to a different language can lead to the loss of semantic precision (Peskov et al., 2021; Santy et al., 2021), even if professionally translated, due to the fundamental difference in cultural conceptualization of a word. To determine whether language itself has an impact on game label annotations within a country, we compare respondents surveyed in English to a demographically-similar set of respondents surveyed in their local language, using Mahalanobis distance matching (Mahalanobis, 1936; ROSENBAUM and RUBIN, 1983; Caliendo and Kopeinig, 2008). To ensure we capture differences in semantics and not differences in player experience, we subset to respondents who play games in English “frequently” or even more often. We then match the Xbox ambassadors (surveyed in English) to their compatriots (surveyed in their local language) on dimensions of age, gender, and gaming experience.666There may, of course, be additional confounders—e.g., the Xbox Ambassadors could be a fundamentally different survey population than the other survey respondents responding to the email survey—however, these are the extent of the personal demographics we capture in our survey. Covariate balance was confirmed between the English and local survey language respondents (balance plots are reported in Figure 8 in Appendix C). We then estimate the effect of survey language on label annotation using a logistic regression on the matched sample, estimating standard error with cluster-robust variance.
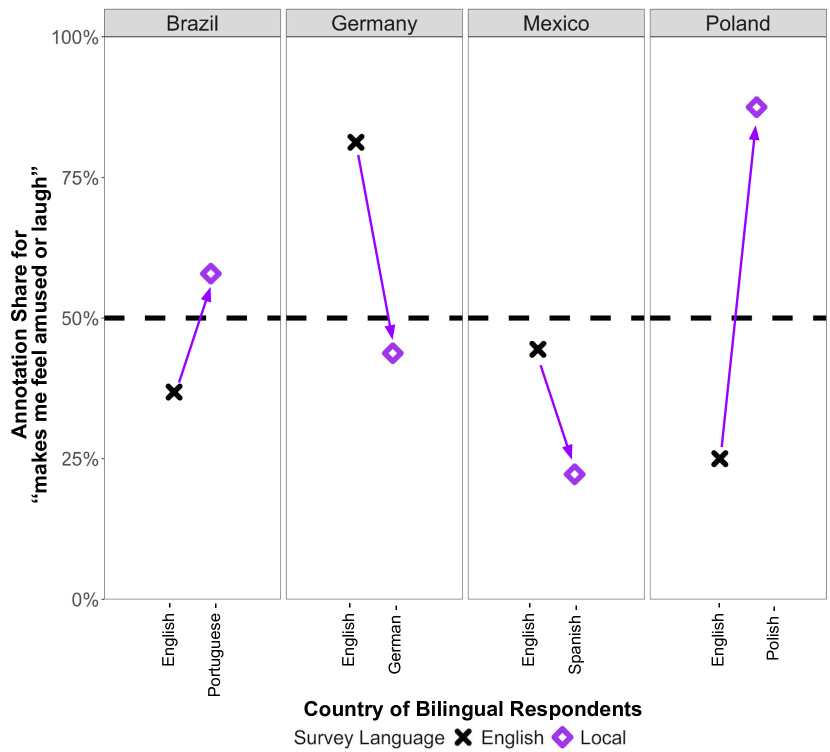
Overall, we find that the share of significant survey language effects is slightly higher among inconsistent labels (36%) relative to consistent labels (34%). To showcase the variability in language effects, we turn to another inconsistent label as an example: “makes me feel amused or laugh” for a specific action game.777Our running label examples of “high replayability” and “zen” from Figure 2 yields extremely small matched counts ( respondents for each language) for the specific action game; here, we use a different action game for the “makes me feel amused or laugh” example. For the sake of completion, we note that the inconsistently conceptualized “high replayability” label sees an increase in English relative to Polish (statistically significant at the 1% level), but no statistically significant language effects in Brazil or Mexico. Meanwhile, the consistently conceptualized label “zen” sees a 17 percentage point decrease in English relative to Portuguese (statistically significant at the 1% level), but no statistically significant language effects in Mexico or Poland. There were not enough matched participants in Germany for this particular game to comment on the English-German effect. In Figure 4, we present the grouped mean differences for individuals annotating a certain action game as such. For demographically matched respondents in Brazil, those surveyed in English had a 21 percentage point lower respondent share answering that the game made them “feel amused or laugh,” relative to being surveyed in Portuguese. A similar decrease, though with a larger magnitude and statistically significant, was observed between Polish respondents answering in English (63 percentage points lower) relative to Polish. Meanwhile, for demographically matched respondents in Germany, those surveyed in English had a statistically significant 38 percentage point higher respondent share agreeing with the label, relative to being surveyed in German. A similar increase, though not statistically significant, was observed among Mexican respondents answering in English (22 percentage points higher) relative to Spanish. Full statistics, including confidence intervals and p-values, are reported in Table 2 in Appendix C.
We make several notes on the directions of English language effects on bilingual respondents. First, the English effect is independent across countries; for a specific label for a specific game, there is no reason to expect that all languages’ translations of that label would consistently yield either all increases, or all decreases, in the probability of annotation relative to English. Second, there is no reason that the direction of the English effect must persist across labels for a local language (e.g., there may be some labels that lose meaning when translated to that language, but other labels may have no translational difference; furthermore, some label translations may yield a higher probability of label annotation, whereas other label translations may yield a lower probability of label annotation). Third, language-based differences in a label need not persist across games (e.g., if a label—even conceptualized differently—is clearly not relevant to the game being annotated, the language difference may not be as strong).
Overall, we find that differences in label translation do contribute in varying degrees to the inconsistent conceptualization of labels across countries, but are highly dependent on both the label itself and the language (as well as, of course, the quality of translation).
3.4. Heterogeneous annotators improve global game label predictions
We have established that some video game labels are inconsistently conceptualized, and provided two potential sociological reasons for this to be the case: cultural differences based on Hofstede dimensions, and text translation biases. While this is not in and of itself a concern, extrapolating game labels based on only one culture’s annotations to a broader global population compounds labeling biases. We demonstrate that incorporating diverse participants across different countries can lead to a more accurate and representative label decision for a global audience.
Per Section 1, it is often the case that a homogeneous group of annotators are hired to label data (e.g., from a certain country) (Chen, 2022; Pak, 2021; Murgia, 2019; Hale, 2019). Another tactic for eliciting annotators is by using an expert focus group, though this can fall prey to a similar homogeneity concern. When this homogeneous group’s annotations are used as the basis of recommendation systems applied globally, the resulting recommendations for non-annotator countries may not align with those countries’ conceptualizations of the same labels. For example, if a game is annotated as a “highly replayable” game based on a US-centric understanding of what this label means, it may lead to user confusion when the game is recommended to a gamer in Korea, who would not consider the same game to be “highly replayable.”
We show this in aggregate by simulating label predictions on different country subgroups, for “inconsistently conceptualized” labels that are especially difficult to predict with high accuracy. We begin by generating two different train sets: first, we generate a dataset based only on survey responses from one homogeneous group’s game label annotations—American gamers. Second, we generate a new train set based on survey responses from a globally representative population excluding American gamers. Then, we train the same logistic regression model on each of these two train sets, using covariates including game, label, and respondent demographics. This yields two predictive models, one trained on a “homogeneous” annotator group and the other trained on a “heterogeneous” annotator group. We then compare the two models’ performance on a held-out test set (representing 30% of the collected data) on globally representative survey respondents’ game label annotations.888Our results are robust to sampling the homogeneous and heterogeneous train set in different ways per Figure 13, e.g. demographically representative stratified sampling, and oversampling (so the homogeneous train set size matches the heterogeneous train set size).
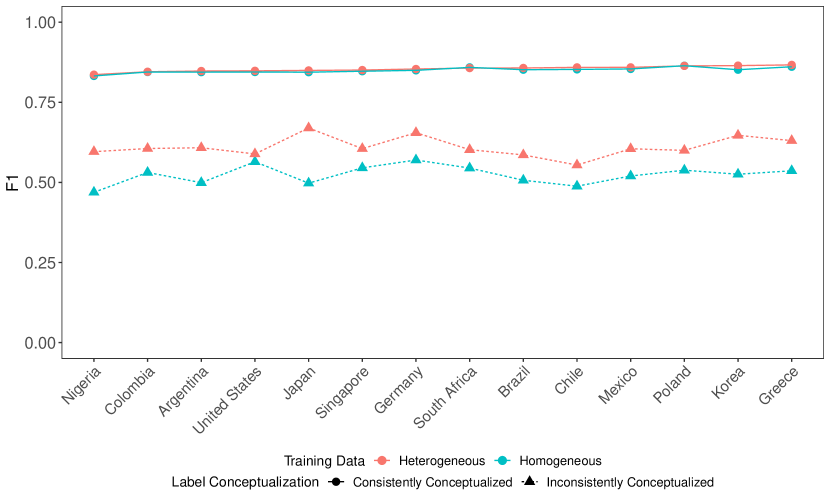
Our results are shown in Figure 5; at a country level, we aggregate F1 scores on the held-out test set across both inconsistently conceptualized labels and consistently conceptualized labels. First, we confirm that consistently conceptualized labels are relatively easy to predict (yielding a similarly high F1 score across countries in the test set) regardless of the country distribution underlying the training data: as we showed in Figure 4, most countries annotate these labels quite similarly. Second, we see improvement in F1 scores across all countries—including for American gamers—when the heterogeneous (global) dataset is used to train the model rather than only the homogeneous (US-based) train set. Across the entire test set, we see a 7.7% improvement in F1 score; further results are presented in Appendix C. More granularly, recall that we found Korea and Nigeria to be dissimilar countries (both along our Hofstede-based Cultural Distance Index and based on label annotation correlations). Continuing our running example from Figure 2, while the homogeneously-trained model (trained on gamer demographics) predicts similar “highly replayable” label annotation shares of 55.47% for Korea and 55.98% for Nigeria, the heterogeneously-trained model (additionally trained on a country covariate) predicts a much more distinct set of annotation shares: 38.85% for Korea and 51.95% for Nigeria, which is far more reflective of the wide difference in true label annotations per Figure 2.
Furthermore, using a globally diverse training set allows for better out-of-sample predictions. Recall that we excluded responses from India and Saudi Arabia in all prior analyses due to extremely low survey response rates for many games. When including these countries in our test set (despite not being in our train set), we find that the model trained on heterogeneous data yields better prediction accuracy on these countries relative to the model trained on homogeneous data (with improvements ranging from a 2-3% increase in F1 score). Overall, our results support the intuitive finding that diversifying the training set improves predictions on a diverse test set (Kim et al., 2019; Koh et al., 2021; Mitchell et al., 2021; Buolamwini and Gebru, 2018; Koenecke et al., 2020), and we encourage stakeholders to invest in diversifying annotator populations hired for data labels.
4. Framework: Auditing Data Annotation for Global Inclusivity
We summarize our research process in a generalized framework for auditing the annotation process. This framework provides a roadmap for practitioners to ask auditing questions on both country and language inclusivity, continuing our running example of game labels. For each question, we further propose actionable next steps for practitioners to take depending on the outcomes of each audit. Note that our framework should serve as a guide rather than an oracle. While we address country and language questions separately, it is important to additionally consider their interactions in cultural contexts. And, even if labels pass all of the proposed auditing criteria, this does not guarantee the same interpretation across cultures; rather, it simply satisfies our definition of “consistent conceptualization” and means that a predictive model taking the label as input would yield less country- or language-based bias for that label.
4.1. Country-based Auditing
4.1.1. Across countries, how much external agreement is there on labels of interest?
-
•
Example: Do more Americans consider a certain game to be an “action” game than their Japanese counterparts?
-
•
Method: Calculate differences in estimated label annotations for each demographic. To compare estimates across multiple countries, we suggest conducting post-stratified regression analysis (Wang et al., 2015) to adjust for survey respondents’ demographic confounders, as done in Figure 2. To elicit the causal country effect between a pair of countries, we suggest performing matching (e.g., with Mahalanobis distance matching (Mahalanobis, 1936), the method underlying Figure 4). To elicit similarity between country rankings of labels within a game, calculate the Spearman correlation between the ranked post-stratified estimates of label annotations (e.g., to see if a game is always ranked as “action” more than “zen” in all countries), the method underlying footnote 4.
-
•
Action Item: Determine whether label estimates should be de-biased for certain populations. For example, assume that your model estimates that 70% of US gamers would annotate a game with the “action” label, only 50% of Japanese gamers would do the same, and otherwise all labels are ranked in the same order for the game in question. In this case, consider applying a de-biasing correction to recommendation systems so that Japanese gamers are not as frequently recommended this game in the “action” category, relative to American gamers.
4.1.2. Within each country, how much internal agreement is there on labels of interest?
-
•
Example: Does the concept of an “action” game elicit more agreement among annotators within the US than it does among annotators in Japan?
-
•
Method: Compare the variance of label outcomes (estimated via subsubsection 4.1.1), when grouped by country. Higher variances suggest “inconsistently conceptualized” labels; see Figure 10.
-
•
Action Item: Deep dive into how to approach different country markets. For example, if everyone in one country agrees a game is “action” whereas this is not the case in another country, consider auditing for cultural effects (e.g., is there less clarity on the concept of “action” in the latter country? See subsubsection 4.1.3.) or language effects (e.g., does “action” does not translate well to that specific language? See subsubsection 4.2.3).
4.1.3. If low external or internal agreement is found, is there a research-backed explanation relating to cultural differences?
-
•
Example: If American and Japanese annotators conceptualize the “action” label inconsistently, can this be explained by specific cultural factors?
-
•
Method: Computationally, one can use Hofstede’s cultural indices to calculate the cultural distance between these two countries per Figure 4. However, we emphasize that culture is a highly context-dependent phenomenon (Sackmann and Phillips, 2004). To comprehensively understand the sociological reasons for conceptual differences requires consulting experts in these cultures; reducing country culture to an index will not paint the full picture of why a label might be inconsistently conceptualized. It is important to incorporate additional research when formulating hypotheses, such as cultural differences in game perceptions (Law et al., 2009; Zendle et al., 2023; Brückner et al., 2019; Chen, 2014).
-
•
Action Item: Consider research across the sociology and Human Computer Interaction literature to understand whether or why different countries may have different conceptualizations of labels. For example, prior work comparing Japanese and American gamers has found differences in preferences regarding replayability and bugs (Zagal and Tomuro, 2013), playtime (Zendle et al., 2023), and level of control (Cook, 2009).
4.2. Language-based Auditing
In this section, the questions can and should be benchmarked against the language in which labels were originally conceptualized. We center our questions on English as the default language (because the authors generated labels in English originally) but emphasize that other languages could be used as the benchmark.
4.2.1. Across English-speaking countries, how much external agreement is there on labels of interest?
-
•
Example: Is there broad consensus on the “action” annotation across India, Nigeria, Singapore, South Africa, and the US?
-
•
Method: Generate poststratified analyses per subsubsection 4.1.1 to compare the English-speaking countries within Figure 2, or compare pairs of English-speaking countries per Figure 4 when matched on demographic confounders (Mahalanobis, 1936; ROSENBAUM and RUBIN, 1983).
-
•
Action Item: If there is broad consensus across English-speaking countries, it confirms that the cross-cultural differences do not affect the shared conceptualization of a label’s meaning in English. If not, focus on country-based differences per subsubsection 4.1.3.
4.2.2. For non-English-speaking countries, how much external agreement is there on labels of interest?
-
•
Example: How similar are Japanese annotations of “action” games to those of other non-English annotations? How similar are Japanese annotations of “action” games to those of English language annotations?
-
•
Method: Again, we recommend similar poststratified analyses and matching analyses as in subsubsection 4.2.1, but now comparing specific non-English-speaking countries to all other countries.
-
•
Action Item: If similar label annotation estimates are found, the labels can be considered consistently conceptualized and language does not appear to play a factor. If not, focus on translation differences per subsubsection 4.2.3.
4.2.3. Within each country where English is not an official language, how much internal agreement is there among bilingual speakers annotating English versus non-English labels of interest?
-
•
Example: Is the label “action” translated to Japanese in a way that does not convey the same conceptual meaning as in English?
-
•
Method: Per the methodology in Figure 4, recruit bilingual annotators within a non-English-speaking country (e.g. Japan) and randomize surveys so that labels are annotated by: (a) one set of survey respondents in Engish and (b) another set of survey respondents in Japanese. Then, perform Mahalanobis distance (Mahalanobis, 1936) or propensity score matching (ROSENBAUM and RUBIN, 1983) on respondent demographics (e.g., age, gender, gaming experience, etc.) to elicit the causal difference between the English-language annotations and Japanese-language annotations.
-
•
Action Item: Within each non-English country with match-ed bilingual survey respondents, if non-significant differences are found between the English and non-English annotations, it is unlikely that label information was lost in translation. It is very likely that findings are label- and language-dependent: e.g., for some labels, the English version may yield more annotations for a game, whereas for others, the English version may yield fewer annotations. If significant language-based differences are found, we recommend consulting with translation experts and conducting further translation and back-translation. We further recommend understanding underlying cultural differences that could inform linguistic differences per subsubsection 4.1.3.
5. Discussion & Limitations
In this paper, we focus on the data annotation step of the recommendation system pipeline (Figure 1), specifically auditing label annotations for global bias. We provide the “inconsistent conceptualization” nomenclature to describe the biases discussed, and then illustrate the global biases at hand via a case study on video game labels. By conducting the first large-scale survey of video game labels, we elicit responses from 16 countries in 9 languages and evaluate annotation differences by country and language. Our findings from the case study demonstrate that data labels may be inconsistently conceptualized, despite them being uniformly deployed across countries in real-world ML applications. Our analyses suggest that inconsistently conceptualized game labels may be explained by both Hofstede’s cultural differences and semantic loss through translation. Considering the common practice of hiring annotators from only a single country, we then show that models trained on heterogeneous training data outperform those trained on homogeneous (single-country) training data when applied to global test sets. Finally, we provide a generalized framework for practitioners to conduct systematic audits on data annotation—via a series of actionable items—for inconsistent conceptualization of labels across countries and languages, hence fostering global inclusivity across users.
There are several limitations of our work. First, due to the privacy constraints arising from small survey response numbers, our analysis could not encompass some individuals from diverse backgrounds such as non-binary respondents (who were entirely based in the US in our survey). Relatedly, due to legal constraints and privacy concerns, we could not elicit demographic information on race, so intersectionality (Wang et al., 2022; Kong, 2022) was not fully captured in our analysis. Second, while our framework focuses on country and language as key indicators for evaluating global inclusivity in labeling, we acknowledge that using “country” as a proxy for “culture” in a geographical sense may perpetuate “cultural hegemony” in which value systems are shaped and mediated by those in power (Lears, 1985). Cultures, even within a country, have changed in dramatic ways over time (Orr and Hauser, 2008). Hofstede’s model, while providing a quantitative and practical approach, may oversimplify the complexity of cultures.
There are many directions for future work in auditing consistent conceptualization of labels as they percolate through the recommendation pipeline; in conjunction with our proposed framework, we further suggest performing an offline counterfactual evaluation to confirm that using inclusive labels as a feature improves model performance both in aggregate across users, as well as within demographic subgroups. Overall, our findings suggest that inconsistently conceptualized labels arise in human-annotated data, and we encourage practitioners to carefully consider how labels are generated (per the first stage of Figure 1) and opt to diversify their annotator groups to yield improved global label predictions downstream. We further suggest that practitioners perform audits of their annotations using the framework provided in section 4 before making important decisions based on black-box recommendation systems. And, we encourage our findings and suggestions to also be considered outside of recommendation systems, for other predictive models trained on human-labeled data.
6. Research Ethics & Social Impact
This survey study was approved by an institutional IRB and all collected data were anonymized; no PII was collected. We ensured that no analyses were conducted on subgroups of size 5 or fewer to ensure survey respondent privacy. Our work has broader impact on both the HCI/fairness community and the gaming research community. In the former, we connect the sociology and fairness literature to the data annotation process, a crucial step in the recommendation systems pipeline with massive downstream effects (Green, 2021; Do et al., 2023; Winner, 1980). In the latter, we supplement existing theoretical work and small-scale surveys (constrained to specific countries) with larger-scale data analysis of global label conceptualization. We hope that our framework can be applied both in other gaming applications and also across other domains that currently elicit labels from homogeneous annotators to train globally-applied predictive models.
References
- (1)
- Abdollahpouri and Burke (2019) Himan Abdollahpouri and Robin Burke. 2019. Multi-stakeholder Recommendation and its Connection to Multi-sided Fairness. CoRR abs/1907.13158 (2019). arXiv:1907.13158 http://arxiv.org/abs/1907.13158
- Abhishek (2022) Abhishek. 2022. Video game metadata: All you need to know. https://www.gameopedia.com/everything-about-video-game-metadata/
- Aroyo and Welty (2015) Lora Aroyo and Chris Welty. 2015. Truth Is a Lie: Crowd Truth and the Seven Myths of Human Annotation. AI Mag. 36 (2015), 15–24.
- Barbosa and Chen (2019) Natã M. Barbosa and Monchu Chen. 2019. Rehumanized Crowdsourcing: A Labeling Framework Addressing Bias and Ethics in Machine Learning. In Proceedings of the 2019 CHI Conference on Human Factors in Computing Systems (Glasgow, Scotland Uk) (CHI ’19). Association for Computing Machinery, New York, NY, USA, 1–12. https://doi.org/10.1145/3290605.3300773
- Beghtol (2005) Clare Beghtol. 2005. Ethical decision-making for knowledge representation and organization systems for global use. Journal of the American Society for Information Science and Technology 56, 9 (2005), 903–912.
- Berk et al. (2017) Richard Berk, Hoda Heidari, Shahin Jabbari, Matthew Joseph, Michael J. Kearns, Jamie Morgenstern, Seth Neel, and Aaron Roth. 2017. A Convex Framework for Fair Regression. CoRR abs/1706.02409 (2017). arXiv:1706.02409 http://arxiv.org/abs/1706.02409
- Bond (1991) Michael Harris Bond. 1991. Beyond the Chinese Face : Insights from Psychology. Oxford University Press, USA, Hong Kong.
- Brislin (1970) Richard W Brislin. 1970. Back-translation for cross-cultural research. Journal of cross-cultural psychology 1, 3 (1970), 185–216.
- Brückner et al. (2019) Stefan Brückner, Yukiko Sato, Shuichi Kurabayashi, and Ikumi Waragai. 2019. Exploring Cultural Differences in Game Reception: JRPGs in Germany and Japan. Transactions of the Digital Games Research Association 4, 3 (2019), 209–243.
- Buhrmester et al. (2011) Michael Buhrmester, Tracy Kwang, and Samuel D. Gosling. 2011. Amazon’s Mechanical Turk: A New Source of Inexpensive, Yet High-Quality, Data? Perspectives on Psychological Science 6, 1 (2011), 3–5. https://doi.org/10.1177/1745691610393980 arXiv:https://doi.org/10.1177/1745691610393980 PMID: 26162106.
- Buolamwini and Gebru (2018) Joy Buolamwini and Timnit Gebru. 2018. Gender Shades: Intersectional Accuracy Disparities in Commercial Gender Classification. In Proceedings of the 1st Conference on Fairness, Accountability and Transparency (Proceedings of Machine Learning Research, Vol. 81), Sorelle A. Friedler and Christo Wilson (Eds.). PMLR, New York, NY, USA, 77–91. https://proceedings.mlr.press/v81/buolamwini18a.html
- Burke (2017) Robin Burke. 2017. Multisided Fairness for Recommendation. CoRR abs/1707.00093 (2017). arXiv:1707.00093 http://arxiv.org/abs/1707.00093
- Caliendo and Kopeinig (2008) Marco Caliendo and Sabine Kopeinig. 2008. Some practical guidance for the implementation of propensity score matching. Journal of economic surveys 22, 1 (2008), 31–72.
- Chen (2022) Edwin Chen. 2022. 30% of Google’s emotions dataset is mislabeled. https://www.surgehq.ai//blog/30-percent-of-googles-reddit-emotions-dataset-is-mislabeled
- Chen et al. (2023) Jiawei Chen, Hande Dong, Xiang Wang, Fuli Feng, Meng Wang, and Xiangnan He. 2023. Bias and Debias in Recommender System: A Survey and Future Directions. ACM Trans. Inf. Syst. 41, 3, Article 67 (feb 2023), 39 pages. https://doi.org/10.1145/3564284
- Chen (2014) Lai Chi Chen. 2014. What’s the cultural difference between the West and the East? The consumption of popular “cute” games in the Taiwanese market. New Media & Society 16, 6 (2014), 1018–1033. https://doi.org/10.1177/1461444813497555 arXiv:https://doi.org/10.1177/1461444813497555
- Christofferson et al. (2022) Anders Christofferson, Andre James, Amanda OBrien, and Tom Rowland. 2022. Level up: The Future of Video Games Is bright. https://www.bain.com/insights/level-up-the-future-of-video-games-is-bright/
- Clarke et al. (2017) Rachel Ivy Clarke, Jin Ha Lee, and Neils Clark. 2017. Why video game genres fail: A classificatory analysis. Games and Culture 12, 5 (2017), 445–465.
- Cook (2009) Geoffrey Michael Cook. 2009. Methods to Market Mario: An Analysis of American and Japanese Preference for Control in Video Games. Ph. D. Dissertation. University of Kansas.
- d’Alessandro et al. (2017) Brian d’Alessandro, Cathy O’Neil, and Tom LaGatta. 2017. Conscientious Classification: A Data Scientist’s Guide to Discrimination-Aware Classification. Big data 5 2 (2017), 120–134.
- Díaz et al. (2022) Mark Díaz, Ian Kivlichan, Rachel Rosen, Dylan Baker, Razvan Amironesei, Vinodkumar Prabhakaran, and Emily Denton. 2022. CrowdWorkSheets: Accounting for Individual and Collective Identities Underlying Crowdsourced Dataset Annotation. In 2022 ACM Conference on Fairness, Accountability, and Transparency (Seoul, Republic of Korea) (FAccT ’22). Association for Computing Machinery, New York, NY, USA, 2342–2351. https://doi.org/10.1145/3531146.3534647
- Difallah et al. (2018) Djellel Difallah, Elena Filatova, and Panos Ipeirotis. 2018. Demographics and Dynamics of Mechanical Turk Workers. In Proceedings of the Eleventh ACM International Conference on Web Search and Data Mining (Marina Del Rey, CA, USA) (WSDM ’18). Association for Computing Machinery, New York, NY, USA, 135–143. https://doi.org/10.1145/3159652.3159661
- Do et al. (2023) Kimberly Do, Rock Yuren Pang, Jiachen Jiang, and Katharina Reinecke. 2023. “That’s Important, but…”: How Computer Science Researchers Anticipate Unintended Consequences of Their Research Innovations. In Proceedings of the 2023 CHI Conference on Human Factors in Computing Systems (Hamburg, Germany) (CHI ’23). Association for Computing Machinery, New York, NY, USA, Article 602, 16 pages. https://doi.org/10.1145/3544548.3581347
- Ekstrand et al. (2018) Michael D. Ekstrand, Mucun Tian, Ion Madrazo Azpiazu, Jennifer D. Ekstrand, Oghenemaro Anuyah, David McNeill, and Maria Soledad Pera. 2018. All The Cool Kids, How Do They Fit In?: Popularity and Demographic Biases in Recommender Evaluation and Effectiveness. In Proceedings of the 1st Conference on Fairness, Accountability and Transparency (Proceedings of Machine Learning Research, Vol. 81), Sorelle A. Friedler and Christo Wilson (Eds.). PMLR, New York, NY, USA, 172–186. https://proceedings.mlr.press/v81/ekstrand18b.html
- Faria (2006) Arlo Faria. 2006. Accent Classification for Speech Recognition. In Machine Learning for Multimodal Interaction, Steve Renals and Samy Bengio (Eds.). Springer Berlin Heidelberg, Berlin, Heidelberg, 285–293.
- Gaw (2021) Fatima Gaw. 2021. Algorithmic logics and the construction of cultural taste of the Netflix Recommender System. Media, Culture Society 44, 4 (Oct. 2021), 706–725. https://doi.org/10.1177/01634437211053767
- Ghosh et al. (2021) Sayan Ghosh, Dylan Baker, David Jurgens, and Vinodkumar Prabhakaran. 2021. Detecting Cross-Geographic Biases in Toxicity Modeling on Social Media. In Proceedings of the Seventh Workshop on Noisy User-generated Text (W-NUT 2021). Association for Computational Linguistics, Online, 313–328. https://doi.org/10.18653/v1/2021.wnut-1.35
- Gomez-Uribe and Hunt (2015) Carlos A. Gomez-Uribe and Neil Hunt. 2015. The Netflix Recommender System. ACM Transactions on Management Information Systems 6, 4 (Dec. 2015), 1–19. https://doi.org/10.1145/2843948
- Gordon et al. (2022) Mitchell L. Gordon, Michelle S. Lam, Joon Sung Park, Kayur Patel, Jeff Hancock, Tatsunori Hashimoto, and Michael S. Bernstein. 2022. Jury Learning: Integrating Dissenting Voices into Machine Learning Models. In Proceedings of the 2022 CHI Conference on Human Factors in Computing Systems (New Orleans, LA, USA) (CHI ’22). Association for Computing Machinery, New York, NY, USA, Article 115, 19 pages. https://doi.org/10.1145/3491102.3502004
- Green (2021) Ben Green. 2021. Data science as political action: Grounding data science in a politics of justice. Journal of Social Computing 2, 3 (2021), 249–265.
- Hale (2019) Kori Hale. 2019. Google & Microsoft Banking On Africa’s AI Labeling Workforce. https://www.forbes.com/sites/korihale/2019/05/28/google-microsoft-banking-on-africas-ai-labeling-workforce/?sh=36e98a98541c
- Hofstede (1980) G. Hofstede. 1980. Culture’s Consequences: International Differences in Work-Related Values. SAGE Publications, Beverly Hills, CA, and London. https://books.google.com/books?id=hW6AAAAAMAAJ
- Hofstede and Minkov (2010) Geert Hofstede and Michael Minkov. 2010. Long-versus short-term orientation: new perspectives. Asia Pacific business review 16, 4 (2010), 493–504.
- Huffaker et al. (2020) Jordan S. Huffaker, Jonathan K. Kummerfeld, Walter S. Lasecki, and Mark S. Ackerman. 2020. Crowdsourced Detection of Emotionally Manipulative Language. In Proceedings of the 2020 CHI Conference on Human Factors in Computing Systems (Honolulu, HI, USA) (CHI ’20). Association for Computing Machinery, New York, NY, USA, 1–14. https://doi.org/10.1145/3313831.3376375
- Inglehart (2006) Ronald Inglehart. 2006. Mapping Global Values. Comparative Sociology 5, 2-3 (2006), 115 – 136. https://doi.org/10.1163/156913306778667401
- Ipeirotis et al. (2010) Panagiotis G. Ipeirotis, Foster Provost, and Jing Wang. 2010. Quality Management on Amazon Mechanical Turk. In Proceedings of the ACM SIGKDD Workshop on Human Computation (Washington DC) (HCOMP ’10). Association for Computing Machinery, New York, NY, USA, 64–67. https://doi.org/10.1145/1837885.1837906
- Kees et al. (2017) Jeremy Kees, Christopher Berry, Scot Burton, and Kim Sheehan. 2017. An Analysis of Data Quality: Professional Panels, Student Subject Pools, and Amazon's Mechanical Turk. Journal of Advertising 46, 1 (Jan. 2017), 141–155. https://doi.org/10.1080/00913367.2016.1269304
- Kim et al. (2019) B. Kim, H. Kim, K. Kim, S. Kim, and J. Kim. 2019. Learning Not to Learn: Training Deep Neural Networks With Biased Data. In 2019 IEEE/CVF Conference on Computer Vision and Pattern Recognition (CVPR). IEEE Computer Society, Los Alamitos, CA, USA, 9004–9012. https://doi.org/10.1109/CVPR.2019.00922
- Kim, Bongjun (2021) Kim, Bongjun. 2021. Sound Event Annotation and Detection with Less Human Effort. Ph. D. Dissertation. Northwestern University. https://doi.org/10.21985/N2-JE7C-8R70
- Kittross (1959) John Michael Kittross. 1959. The measurement of meaning. Audiovisual communication review 7 (1959), 154–156.
- Koenecke et al. (2023) Allison Koenecke, Eric Giannella, Robb Willer, and Sharad Goel. 2023. Popular Support for Balancing Equity and Efficiency in Resource Allocation: A Case Study in Online Advertising to Increase Welfare Program Awareness. https://doi.org/10.48550/ARXIV.2304.08530
- Koenecke et al. (2020) Allison Koenecke, Andrew Nam, Emily Lake, Joe Nudell, Minnie Quartey, Zion Mengesha, Connor Toups, John R. Rickford, Dan Jurafsky, and Sharad Goel. 2020. Racial disparities in automated speech recognition. Proceedings of the National Academy of Sciences 117, 14 (2020), 7684–7689. https://doi.org/10.1073/pnas.1915768117 arXiv:https://www.pnas.org/doi/pdf/10.1073/pnas.1915768117
- Koh et al. (2021) Pang Wei Koh, Shiori Sagawa, Henrik Marklund, Sang Michael Xie, Marvin Zhang, Akshay Balsubramani, Weihua Hu, Michihiro Yasunaga, Richard Lanas Phillips, Irena Gao, Tony Lee, Etienne David, Ian Stavness, Wei Guo, Berton Earnshaw, Imran Haque, Sara M Beery, Jure Leskovec, Anshul Kundaje, Emma Pierson, Sergey Levine, Chelsea Finn, and Percy Liang. 2021. WILDS: A Benchmark of in-the-Wild Distribution Shifts. In Proceedings of the 38th International Conference on Machine Learning (Proceedings of Machine Learning Research, Vol. 139), Marina Meila and Tong Zhang (Eds.). PMLR, Virtual, 5637–5664.
- Kong (2022) Youjin Kong. 2022. Are “Intersectionally Fair” AI Algorithms Really Fair to Women of Color? A Philosophical Analysis. In 2022 ACM Conference on Fairness, Accountability, and Transparency (Seoul, Republic of Korea) (FAccT ’22). Association for Computing Machinery, New York, NY, USA, 485–494. https://doi.org/10.1145/3531146.3533114
- Kuo et al. (2022) Yu-Tung Kuo, Yu-Chun Kuo, and David M. Whittinghill. 2022. Exploring the Reliability of a Cross-Cultural Model for Digital Games: A Systematic Review. International Journal of Emerging Technologies in Learning (iJET) 17, 13 (Jul. 2022), pp. 217–234. https://doi.org/10.3991/ijet.v17i13.29519
- Law et al. (2009) Effie Lai-Chong Law, Tim Gamble, and Daniel Schwarz. 2009. Gender and Cultural Differences in Perceiving Game Characters of Digital Educational Games. In Human-Computer Interaction – INTERACT 2009, Tom Gross, Jan Gulliksen, Paula Kotzé, Lars Oestreicher, Philippe Palanque, Raquel Oliveira Prates, and Marco Winckler (Eds.). Springer Berlin Heidelberg, Berlin, Heidelberg, 149–153.
- Lears (1985) T. J. Jackson Lears. 1985. The Concept of Cultural Hegemony: Problems and Possibilities. The American Historical Review 90, 3 (1985), 567–593. http://www.jstor.org/stable/1860957
- Lecoutre et al. (2017) Adrian Lecoutre, Benjamin Negrevergne, and Florian Yger. 2017. Recognizing Art Style Automatically in Painting with Deep Learning. In Proceedings of the Ninth Asian Conference on Machine Learning (Proceedings of Machine Learning Research, Vol. 77), Min-Ling Zhang and Yung-Kyun Noh (Eds.). PMLR, Yonsei University, Seoul, Republic of Korea, 327–342. https://proceedings.mlr.press/v77/lecoutre17a.html
- Lee et al. (2005) Jin Ha Lee, J. Stephen Downie, and Sally Jo Cunningham. 2005. Challenges in Cross-Cultural/Multilingual Music Information Seeking. In ISMIR 2005, 6th International Conference on Music Information Retrieval, London, UK, 11-15 September 2005, Proceedings. Transactions of the International Society for Music Information Retrieval, London, UK, 1–7. http://ismir2005.ismir.net/proceedings/1100.pdf
- Li et al. (2021) Yunqi Li, Yingqiang Ge, and Yongfeng Zhang. 2021. Tutorial on Fairness of Machine Learning in Recommender Systems. In Proceedings of the 44th International ACM SIGIR Conference on Research and Development in Information Retrieval (Virtual Event, Canada) (SIGIR ’21). Association for Computing Machinery, New York, NY, USA, 2654–2657. https://doi.org/10.1145/3404835.3462814
- Little (1993) Roderick JA Little. 1993. Post-stratification: a modeler’s perspective. J. Amer. Statist. Assoc. 88, 423 (1993), 1001–1012.
- Lukosch et al. (2017) Heide Lukosch, Shalini Kurapati, Daan Groen, and Alexander Verbraeck. 2017. Gender and Cultural Differences in Game-Based Learning Experiences. Electronic Journal of e-Learning 15, 4 (2017), pp310–319.
- Mahalanobis (1936) Prasanta Chandra Mahalanobis. 1936. On the generalised distance in statistics. In Proceedings of the National Institute of Science of India, Vol. 12. National Institute of Science of India, 49–55.
- Mehrabi et al. (2021) Ninareh Mehrabi, Fred Morstatter, Nripsuta Saxena, Kristina Lerman, and Aram Galstyan. 2021. A survey on bias and fairness in machine learning. ACM Computing Surveys (CSUR) 54, 6 (2021), 1–35.
- Mehrotra et al. (2017) Rishabh Mehrotra, Ashton Anderson, Fernando Diaz, Amit Sharma, Hanna Wallach, and Emine Yilmaz. 2017. Auditing Search Engines for Differential Satisfaction Across Demographics. In Proceedings of the 26th International Conference on World Wide Web Companion (Perth, Australia) (WWW ’17 Companion). International World Wide Web Conferences Steering Committee, Republic and Canton of Geneva, CHE, 626–633. https://doi.org/10.1145/3041021.3054197
- Mitchell et al. (2021) Shira Mitchell, Eric Potash, Solon Barocas, Alexander D'Amour, and Kristian Lum. 2021. Algorithmic Fairness: Choices, Assumptions, and Definitions. Annual Review of Statistics and Its Application 8, 1 (March 2021), 141–163. https://doi.org/10.1146/annurev-statistics-042720-125902
- Mitra and Gilbert (2021) Tanushree Mitra and Eric Gilbert. 2021. CREDBANK: A Large-Scale Social Media Corpus With Associated Credibility Annotations. Proceedings of the International AAAI Conference on Web and Social Media 9, 1 (Aug. 2021), 258–267. https://doi.org/10.1609/icwsm.v9i1.14625
- Murgia (2019) Madhumita Murgia. 2019. AI’s new workforce: the data-labelling industry spreads globally. https://www.ft.com/content/56dde36c-aa40-11e9-984c-fac8325aaa04
- Northcutt et al. (2021) Curtis G. Northcutt, Anish Athalye, and Jonas Mueller. 2021. Pervasive Label Errors in Test Sets Destabilize Machine Learning Benchmarks. CoRR abs/2103.14749 (2021). arXiv:2103.14749 https://arxiv.org/abs/2103.14749
- Orr and Hauser (2008) Linda M Orr and William J Hauser. 2008. A Re-Inquiry of Hofstede’s Cultural Dimensions: A Call for 21st Century Cross-Cultural Research. Marketing Management Journal 18, 2 (2008), 1–19.
- Pak (2021) Jennifer Pak. 2021. The human labor behind artificial intelligence. https://www.marketplace.org/2021/05/04/the-human-labor-behind-artificial-intelligence/
- Park et al. (2004) David K. Park, Andrew Gelman, and Joseph Bafumi. 2004. Bayesian Multilevel Estimation with Poststratification: State-Level Estimates from National Polls. Political Analysis 12, 4 (2004), 375–385. http://www.jstor.org/stable/25791784
- Parmar et al. (2023) Mihir Parmar, Swaroop Mishra, Mor Geva, and Chitta Baral. 2023. Don’t Blame the Annotator: Bias Already Starts in the Annotation Instructions. In Proceedings of the 17th Conference of the European Chapter of the Association for Computational Linguistics. Association for Computational Linguistics, Dubrovnik, Croatia, 1779–1789. https://aclanthology.org/2023.eacl-main.130
- Patterson et al. (2014) Genevieve Patterson, Chen Xu, Hang Su, and James Hays. 2014. The SUN Attribute Database: Beyond Categories for Deeper Scene Understanding. International Journal of Computer Vision 108 (2014), 59–81.
- Peer et al. (2013) Eyal Peer, Joachim Vosgerau, and Alessandro Acquisti. 2013. Reputation as a sufficient condition for data quality on Amazon Mechanical Turk. Behavior Research Methods 46, 4 (Dec. 2013), 1023–1031. https://doi.org/10.3758/s13428-013-0434-y
- Perez (2017) Sarah Perez. 2017. Amazon launches ‘Themes,’ a feature for filtering Customer Reviews by popular terms. https://techcrunch.com/2017/08/04/amazon-launches-themes-a-feature-for-filtering-customer-reviews-by-popular-terms/
- Peskov et al. (2021) Denis Peskov, Viktor Hangya, Jordan Boyd-Graber, and Alexander Fraser. 2021. Adapting Entities across Languages and Cultures. In Findings of the Association for Computational Linguistics: EMNLP 2021. Association for Computational Linguistics, Punta Cana, Dominican Republic, 3725–3750. https://doi.org/10.18653/v1/2021.findings-emnlp.315
- Posch et al. (2022) Lisa Posch, Arnim Bleier, Fabian Flöck, Clemens M. Lechner, Katharina Kinder-Kurlanda, Denis Helic, and Markus Strohmaier. 2022. Characterizing the Global Crowd Workforce: A Cross-Country Comparison of Crowdworker Demographics. Human Computation 9, 1 (Aug. 2022), 22–57. https://doi.org/10.15346/hc.v9i1.106
- Pu et al. (2012) Pearl Pu, Li Chen, and Rong Hu. 2012. Evaluating recommender systems from the user’s perspective: survey of the state of the art. User Modeling and User-Adapted Interaction 22, 4-5 (March 2012), 317–355. https://doi.org/10.1007/s11257-011-9115-7
- Reinecke and Gajos (2015) Katharina Reinecke and Krzysztof Z. Gajos. 2015. LabintheWild: Conducting Large-Scale Online Experiments With Uncompensated Samples. In Proceedings of the 18th ACM Conference on Computer Supported Cooperative Work & Social Computing (Vancouver, BC, Canada) (CSCW ’15). Association for Computing Machinery, New York, NY, USA, 1364–1378. https://doi.org/10.1145/2675133.2675246
- Resnick et al. (1994) Paul Resnick, Neophytos Iacovou, Mitesh Suchak, Peter Bergstrom, and John Riedl. 1994. GroupLens: An Open Architecture for Collaborative Filtering of Netnews. In Proceedings of the 1994 ACM Conference on Computer Supported Cooperative Work (Chapel Hill, North Carolina, USA) (CSCW ’94). Association for Computing Machinery, New York, NY, USA, 175–186. https://doi.org/10.1145/192844.192905
- ROSENBAUM and RUBIN (1983) PAUL R. ROSENBAUM and DONALD B. RUBIN. 1983. The central role of the propensity score in observational studies for causal effects. Biometrika 70, 1 (1983), 41–55. https://doi.org/10.1093/biomet/70.1.41
- Ross et al. (2010) Joel Ross, Lilly Irani, M. Six Silberman, Andrew Zaldivar, and Bill Tomlinson. 2010. Who Are the Crowdworkers? Shifting Demographics in Mechanical Turk. In CHI ’10 Extended Abstracts on Human Factors in Computing Systems (Atlanta, Georgia, USA) (CHI EA ’10). Association for Computing Machinery, New York, NY, USA, 2863–2872. https://doi.org/10.1145/1753846.1753873
- Sackmann and Phillips (2004) Sonja A. Sackmann and Margaret E. Phillips. 2004. Contextual Influences on Culture Research: Shifting Assumptions for New Workplace Realities. International Journal of Cross Cultural Management 4, 3 (2004), 370–390. https://doi.org/10.1177/1470595804047820 arXiv:https://doi.org/10.1177/1470595804047820
- Santy et al. (2021) Sebastin Santy, Kalika Bali, Monojit Choudhury, Sandipan Dandapat, Tanuja Ganu, Anurag Shukla, Jahanvi Shah, and Vivek Seshadri. 2021. Language Translation as a Socio-Technical System:Case-Studies of Mixed-Initiative Interactions. In ACM SIGCAS Conference on Computing and Sustainable Societies (Virtual Event, Australia) (COMPASS ’21). Association for Computing Machinery, New York, NY, USA, 156–172. https://doi.org/10.1145/3460112.3471954
- Schafer et al. (2007) J. Ben Schafer, Dan Frankowski, Jon Herlocker, and Shilad Sen. 2007. Collaborative Filtering Recommender Systems. Springer Berlin Heidelberg, Berlin, Heidelberg, 291–324. https://doi.org/10.1007/978-3-540-72079-9_9
- Snow et al. (2008) Rion Snow, Brendan O’Connor, Daniel Jurafsky, and Andrew Ng. 2008. Cheap and Fast – But is it Good? Evaluating Non-Expert Annotations for Natural Language Tasks. In Proceedings of the 2008 Conference on Empirical Methods in Natural Language Processing. Association for Computational Linguistics, Honolulu, Hawaii, 254–263. https://aclanthology.org/D08-1027
- Steam (2023) Steam. 2023. Introducing steam tags, a powerful new way to shop for games. https://store.steampowered.com/tag/
- Wang et al. (2022) Angelina Wang, Vikram V Ramaswamy, and Olga Russakovsky. 2022. Towards Intersectionality in Machine Learning: Including More Identities, Handling Underrepresentation, and Performing Evaluation. In 2022 ACM Conference on Fairness, Accountability, and Transparency (Seoul, Republic of Korea) (FAccT ’22). Association for Computing Machinery, New York, NY, USA, 336–349. https://doi.org/10.1145/3531146.3533101
- Wang et al. (2015) Wei Wang, David Rothschild, Sharad Goel, and Andrew Gelman. 2015. Forecasting elections with non-representative polls. International Journal of Forecasting 31, 3 (2015), 980–991.
- Weijters et al. (2016) Bert Weijters, Hans Rudolf Baumgartner, and Maggie Geuens. 2016. The calibrated sigma method: An efficient remedy for between-group differences in response category use on Likert scales. International Journal of Research in Marketing 33 (2016), 944–960.
- Winner (1980) Langdon Winner. 1980. Do Artifacts Have Politics? Daedalus 109, 1 (1980), 121–136. http://www.jstor.org/stable/20024652
- Wulczyn et al. (2017) Ellery Wulczyn, Nithum Thain, and Lucas Dixon. 2017. Ex Machina: Personal Attacks Seen at Scale. In Proceedings of the 26th International Conference on World Wide Web (Perth, Australia) (WWW ’17). International World Wide Web Conferences Steering Committee, Republic and Canton of Geneva, CHE, 1391–1399. https://doi.org/10.1145/3038912.3052591
- Xbox (2023) Xbox. 2023. Xbox Ambassadors. https://ambassadors.microsoft.com/xbox
- Zagal and Tomuro (2013) José P. Zagal and Noriko Tomuro. 2013. Cultural differences in game appreciation: A study of player game reviews. In Proceedings of the 8th International Conference on the Foundations of Digital Games, FDG 2013, Chania, Crete, Greece, May 14-17, 2013, Georgios N. Yannakakis, Espen Aarseth, Kristine Jørgensen, and James C. Lester (Eds.). Society for the Advancement of the Science of Digital Games, Chania, Greece, 86–93. http://www.fdg2013.org/program/papers/paper12_zagal_tomuro.pdf
- Zendle et al. (2023) David Zendle, Catherine Flick, Darel Halgarth, Nick Ballou, Simon Demediuk, and Anders Drachen. 2023. Cross-cultural patterns in mobile playtime: an analysis of 118 billion hours of human data. Scientific reports 13, 1 (January 2023), 386. https://doi.org/10.1038/s41598-022-26730-w
- Zhu and Caverlee (2022) Ziwei Zhu and James Caverlee. 2022. Fighting Mainstream Bias in Recommender Systems via Local Fine Tuning. In Proceedings of the Fifteenth ACM International Conference on Web Search and Data Mining (Virtual Event, AZ, USA) (WSDM ’22). Association for Computing Machinery, New York, NY, USA, 1497–1506. https://doi.org/10.1145/3488560.3498427
- Zhu et al. (2020) Ziwei Zhu, Yun He, Yin Zhang, and James Caverlee. 2020. Unbiased Implicit Recommendation and Propensity Estimation via Combinational Joint Learning. In Proceedings of the 14th ACM Conference on Recommender Systems (Virtual Event, Brazil) (RecSys ’20). Association for Computing Machinery, New York, NY, USA, 551–556. https://doi.org/10.1145/3383313.3412210
- Zou and Schiebinger (2018) James Zou and Londa Schiebinger. 2018. AI can be sexist and racist—it’s time to make it fair.
Appendix A Survey Details
A.1. Survey Resondent Demographics
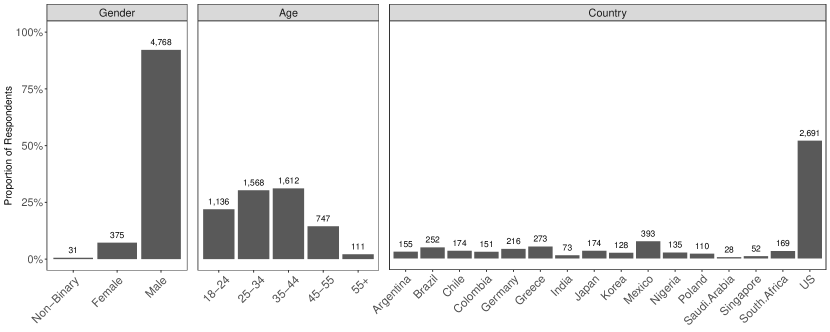
| Game | 1 | 2 | 3 | 4 | 5 | 6 | 7 | 8 | 9 | 10 | 11 |
|---|---|---|---|---|---|---|---|---|---|---|---|
| Argentina | 13 | 39 | 24 | 34 | 59 | 94 | 22 | 61 | 34 | 11 | 10 |
| Brazil | 12 | 72 | 48 | 54 | 72 | 145 | 47 | 103 | 47 | 44 | 28 |
| Chile | 27 | 37 | 19 | 41 | 52 | 99 | 61 | 72 | 33 | 19 | 18 |
| Colombia | 7 | 57 | 26 | 23 | 57 | 94 | 31 | 58 | 32 | 5 | 11 |
| Germany | 41 | 60 | 15 | 64 | 44 | 121 | 69 | 88 | 35 | 36 | 16 |
| Greece | 17 | 64 | 32 | 70 | 112 | 133 | 37 | 62 | 44 | 20 | 13 |
| India | 1 | 28 | 23 | 13 | 16 | 37 | 1 | 26 | 51 | 2 | 2 |
| Japan | 60 | 13 | 13 | 47 | 13 | 50 | 44 | 62 | 14 | 25 | 4 |
| South Korea | 45 | 24 | 14 | 48 | 36 | 52 | 34 | 33 | 48 | 12 | 6 |
| Mexico | 44 | 114 | 86 | 89 | 116 | 194 | 132 | 168 | 73 | 36 | 20 |
| Nigeria | 4 | 62 | 84 | 12 | 82 | 29 | 11 | 16 | 40 | 3 | 5 |
| Poland | 5 | 27 | 8 | 29 | 40 | 68 | 10 | 44 | 20 | 21 | 11 |
| Saudi Arabia | 1 | 12 | 4 | 5 | 15 | 12 | 2 | 11 | 6 | 1 | 1 |
| Singapore | 8 | 14 | 4 | 18 | 17 | 11 | 13 | 11 | 7 | 5 | 2 |
| South Africa | 7 | 41 | 31 | 32 | 62 | 50 | 14 | 60 | 32 | 20 | 9 |
| US | 705 | 834 | 264 | 1,125 | 203 | 1,413 | 949 | 1,376 | 576 | 695 | 238 |
| Total | 997 | 1,498 | 695 | 1,704 | 996 | 2,602 | 1,477 | 2,251 | 1,092 | 955 | 394 |
A.2. Survey Questions
-
(1)
Are you 18 or older?
-
Yes/No
-
-
(2)
In a typical week, how often do you play video games on each of the following types of devices?
-
•
Frequency Options:
-
–
Never
-
–
Less than once per month
-
–
Monthly
-
–
Weekly
-
–
A few times per week
-
–
Daily
-
–
-
•
Device Options:
-
–
Personal computer
-
–
Game console
-
–
Tablet
-
–
Smartphone
-
–
-
•
-
(3)
When you play video games, how often do you play them in English?
-
•
Frequency Options:
-
–
Never
-
–
Less than once per month
-
–
Monthly
-
–
Weekly
-
–
A few times per week
-
–
Daily
-
–
-
•
-
(4)
Please select games you played in the past year from the following list. We will ask questions about your selected games, focusing on things like gameplay and visual design. You are not required to select all games that you have played.
-
•
List of anonymized games
-
•
None of the above
-
•
-
(5)
How complex are the controls in the game?
-
•
Low complexity
-
•
Medium complexity
-
•
High complexity
-
•
-
(6)
Think back to the first time that you played the game. How many sessions did it take you to understand how to play the game?
-
•
Low, 1 game session
-
•
Medium, 2 game sessions
-
•
High, 3+ game sessions, or long instruction sessions
-
•
-
(7)
How much skill does the game require?
-
•
Low, new gamers would find this easy.
-
•
Medium, this game is medium difficulty.
-
•
High, this game needs significant effort and skills.
-
•
Extreme, punishingly difficult
-
•
-
(8)
How replayable is the game?
-
•
Low, only a single play through is necessary to get most of the full experience.
-
•
Medium, multiple play throughs are necessary to get most of the full experience.
-
•
High, you can play this game an infinite number of times.
-
•
-
(9)
Now we are going to ask you about your impression of the games. It is okay if no game below satisfies the description, and it is okay if multiple descriptions are true for each game. Please check any of the boxes for the corresponding descriptions that you believe are true about each game.
-
•
pacifist
-
•
made for kids
-
•
cozy
-
•
zen
-
•
a fantasy game
-
•
located in space
-
•
None of these apply
-
•
-
(10)
Please check any of the boxes for the corresponding descriptions that you believe are true about each game.
-
•
centralized around the character being a hero or savior of the world
-
•
designed to simulate real-world activities
-
•
violent
-
•
an action game
-
•
None of these apply
-
•
-
(11)
Please check any of the boxes for the corresponding feelings that you had about each game.
-
•
I feel strong empathy for the story or character experience.
-
•
I feel amused or laugh.
-
•
I feel that I’ve never played a game like this before.
-
•
I feel that I must strategize and make decisions to win.
-
•
I feel that I need to do grinding or repetitive work.
-
•
None of these apply.
-
•
-
(12)
Please check any of the boxes for the corresponding art styles that you believe are true about each game.
-
•
an anime art style
-
•
an art style that invokes the memory of drawings on paper
-
•
a unique art style that influences the feeling of the game
-
•
None of these apply
-
•
-
(13)
Please check any of the boxes for the corresponding descriptions that you believe are true about each game. It is okay if no game satisfies the description, and it is okay if multiple descriptions are true for each game. Where does your fun come from when you play the game?
-
•
Action: the fast-paced action, surprises, thrills, and adrenaline
-
•
Social: socializing and interacting
-
•
Mastery: mastering the skills and techniques in the game
-
•
Achievement: completing all the missions, increasing all the stats, or getting a more powerful character or equipment
-
•
Immersion: the desire to get lost in the world of the game
-
•
Creativity: designing your own character, house, clothes, or the world
-
•
None of these apply.
-
•
-
(14)
How old are you? (Optional)
-
(15)
Which gender do you identify with? (Optional)
-
•
Male
-
•
Female
-
•
Another gender (please specify)
-
•
Prefer not to answer
-
•
-
(16)
Do you have a disability that affects how you play video games? (Optional)
-
•
Yes
-
•
No
-
•
Prefer not to answer
-
•
Appendix B Survey Responses
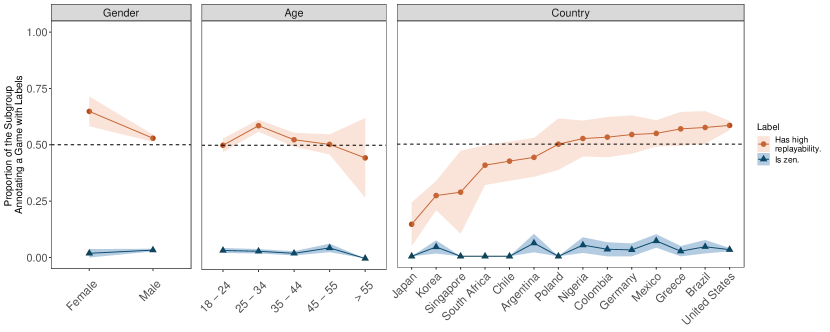
Appendix C Detailed Methods
For multi-level regression and poststratification, we used the R package stan_glmer to run a logistic regression on a respondent’s label annotation for a specific game, conditioned on gender and age group, and with country random effects. The rstanarm package uses Hamiltonian Monte Carlo; we set a 0.99 target average proposal acceptance probability for adaptation. We set the prior to be drawn from a normal distribution and the prior covariance scaled to a 0.5 exponential.
For matching analyses, we used the R package MatchIt with Mahalanobis distance and caliper set to 0.2. We additionally use lmtest and sandwich to calculate treatment coefficient confidence intervals and evaluate significance.
| Country | English | Non-English | Mean | MeanDiff | MeanDiff | p-value | |||
|---|---|---|---|---|---|---|---|---|---|
| Mean | Mean | Difference | Lower CI | Upper CI | Lower CI | Upper CI | |||
| Brazil | 0.37 | 0.58 | -0.21 | -0.54 | 0.12 | 0.48 | 0.11 | 2.07 | 0.33 |
| Germany | 0.81 | 0.44 | 0.38 | 0.04 | 0.71 | 6.42 | 1.39 | 29.64 | 0.02** |
| Mexico | 0.44 | 0.22 | 0.22 | -0.26 | 0.71 | 1.80 | 0.11 | 28.40 | 0.68 |
| Poland | 0.25 | 0.88 | -0.63 | -1.0 | -0.18 | 0.05 | 0.00 | 0.58 | 0.02** |
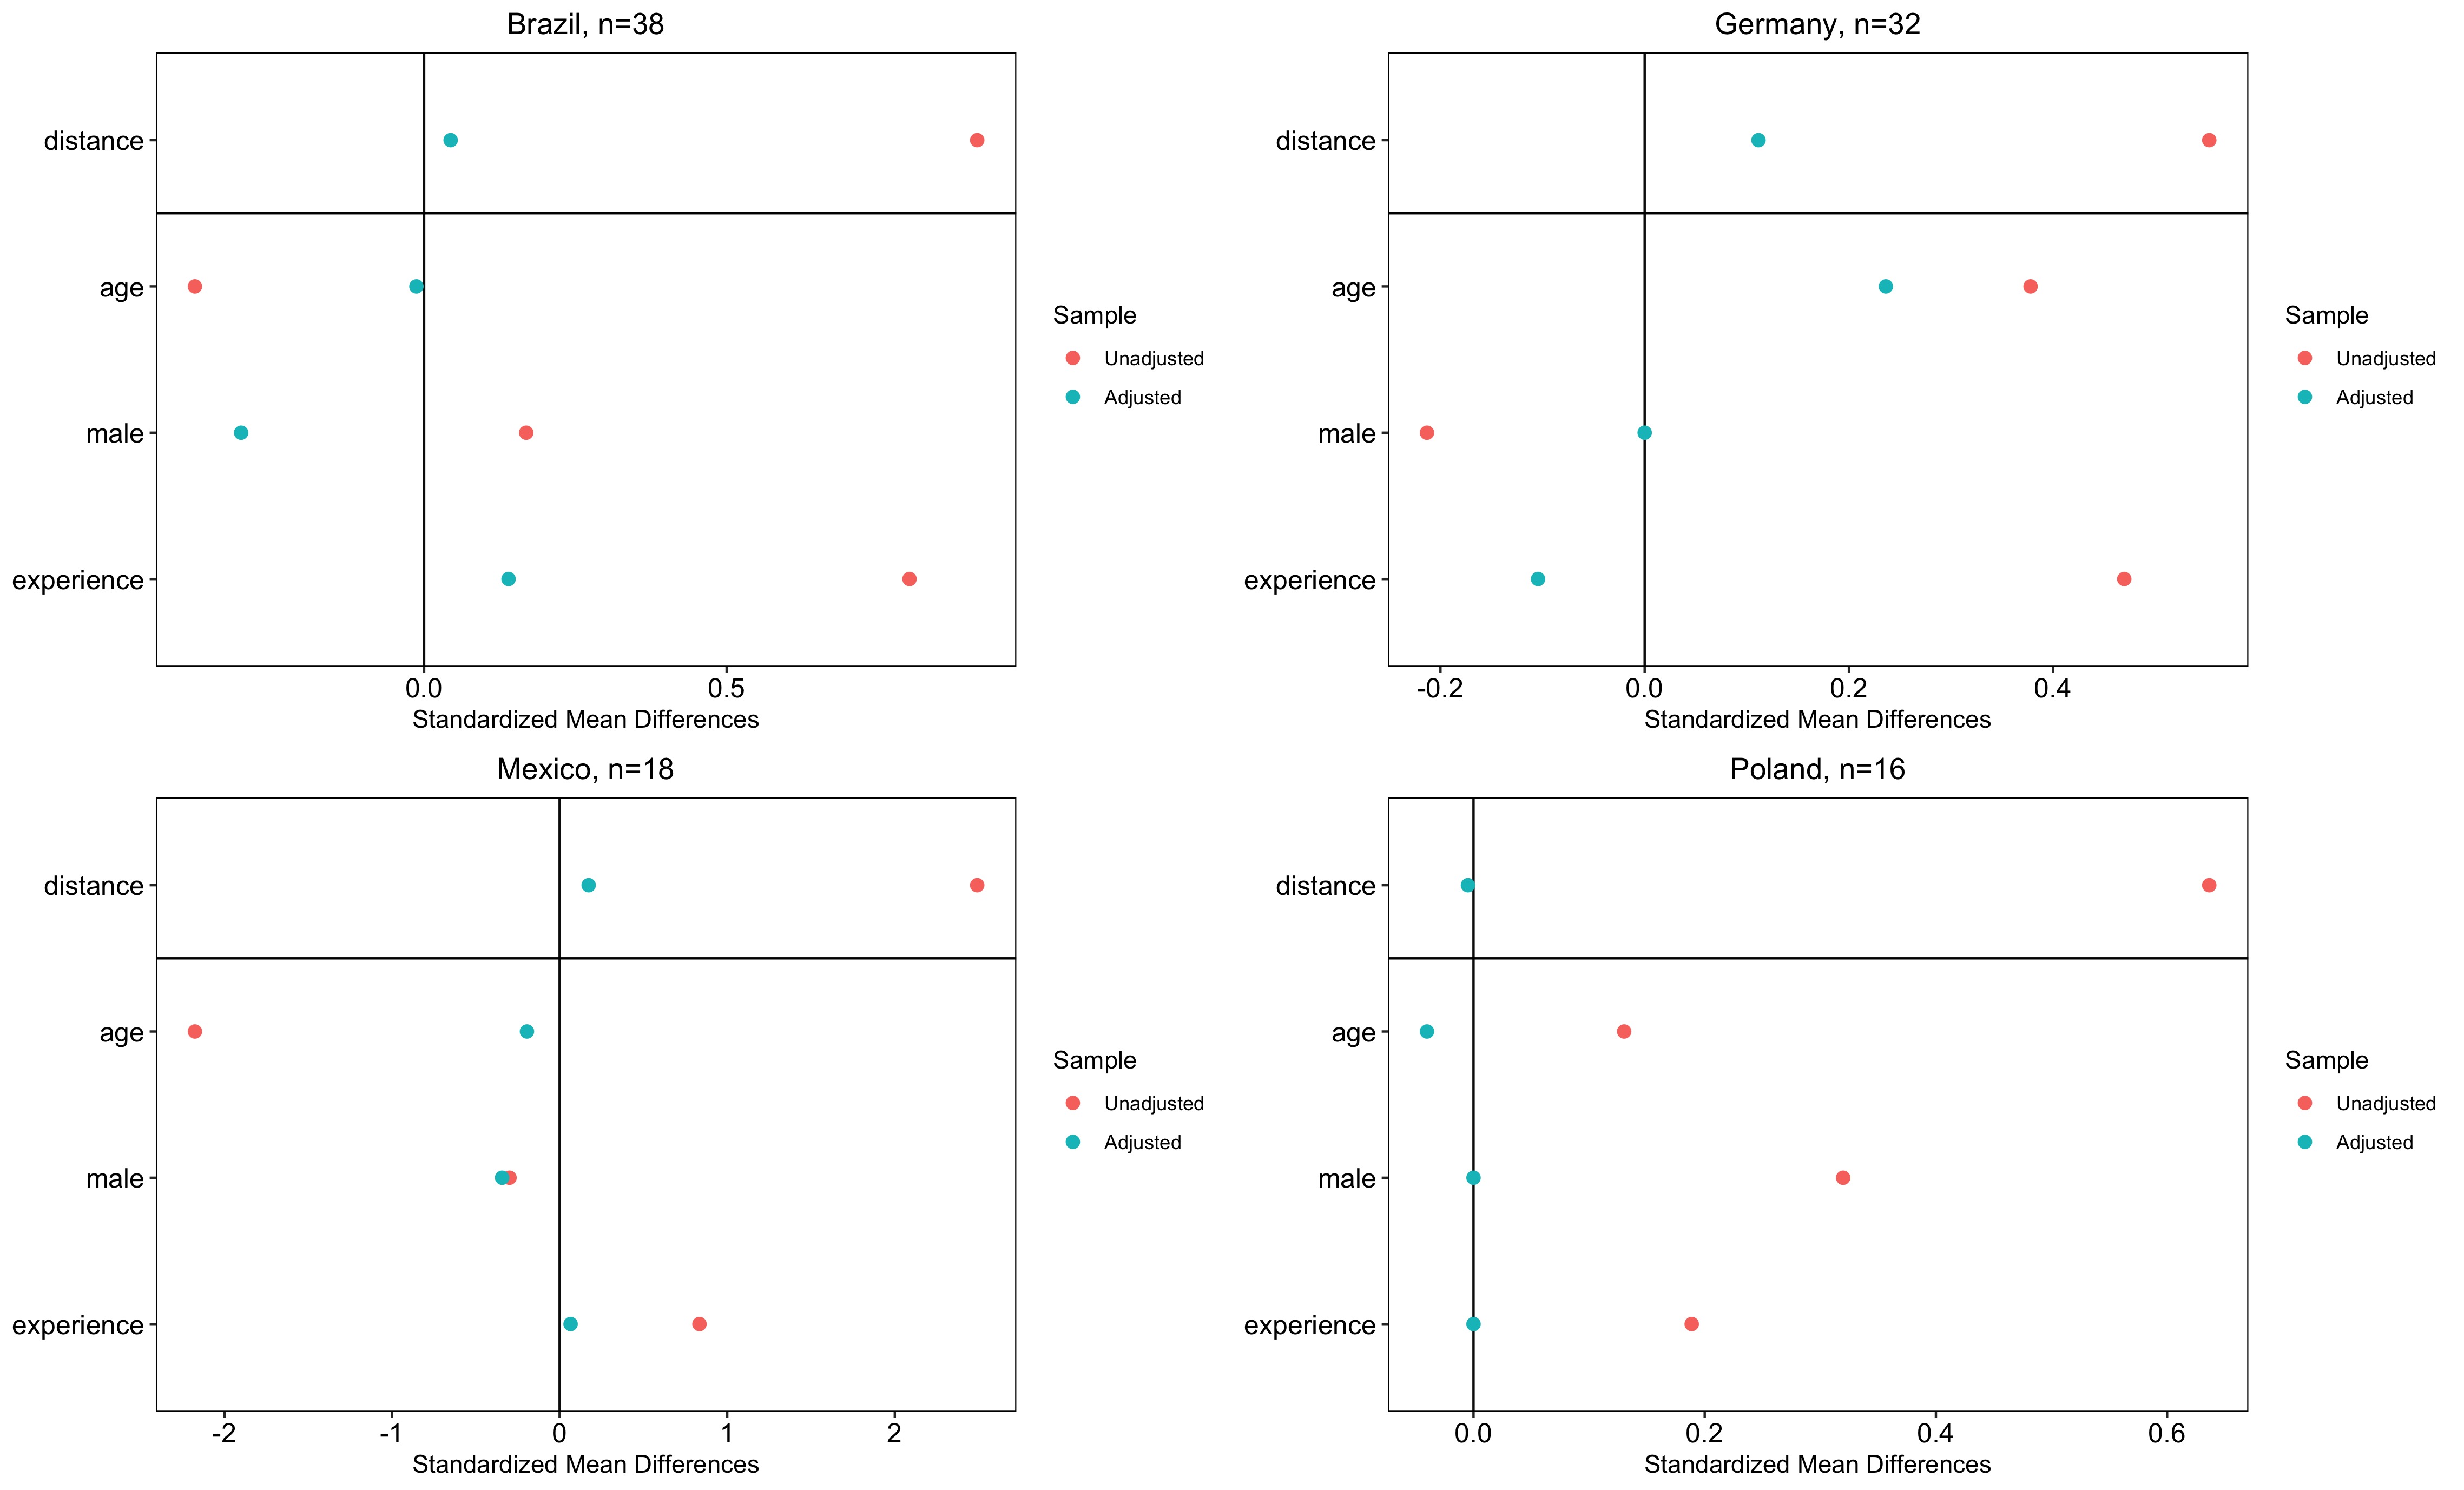

| Dependent variable: | |
| Value | |
| GenderMale | 0.007 (0.014) |
| AgeGroup18 - 24 | 0.132∗∗∗ (0.032) |
| AgeGroup25 - 34 | 0.112∗∗∗ (0.032) |
| AgeGroup35 - 44 | 0.047 (0.032) |
| AgeGroup45 - 55 | 0.015 (0.033) |
| Game2 | 0.407∗∗∗ (0.018) |
| Game3 | 0.995∗∗∗ (0.024) |
| Game4 | 0.354∗∗∗ (0.017) |
| Game5 | 0.635∗∗∗ (0.020) |
| Game6 | 0.168∗∗∗ (0.016) |
| Game7 | 0.521∗∗∗ (0.018) |
| Game7 | 0.034∗ (0.016) |
| Game8 | 0.395∗∗∗ (0.019) |
| Game9 | 0.143∗∗∗ (0.019) |
| Game10 | 0.253∗∗∗ (0.026) |
| Has an anime art style. | 2.524∗∗∗ (0.034) |
| Has an art style that invokes the memory of drawings on paper. | 2.333∗∗∗ (0.032) |
| Has high control complexity. | 2.196∗∗∗ (0.031) |
| Has high difficulty. | 1.219∗∗∗ (0.026) |
| Has a high learning curve. | 1.674∗∗∗ (0.028) |
| Has high replayability. | 0.065∗∗ (0.024) |
| Is a fantasy game. | 0.931∗∗∗ (0.025) |
| Is an action game. | 0.313∗∗∗ (0.024) |
| Is centralized around the character being a hero or savior of the world. | 1.387∗∗∗ (0.026) |
| Is cozy. | 1.064∗∗∗ (0.025) |
| Is designed to simulate real-world activites. | 0.703∗∗∗ (0.024) |
| Is great for designing your own character, house, clothes, or the world. | 0.494∗∗∗ (0.024) |
| Is great for completing all the missions, increasing all the stats, or getting a more powerful character or equipment. | 0.146∗∗∗ (0.024) |
| Is great for mastering the skills and techniques in the game. | 0.234∗∗∗ (0.024) |
| Is great for socializing and interacting with other players. | 0.303∗∗∗ (0.024) |
| Is great for the desire to get lost in the world of the game. | 0.298∗∗∗ (0.024) |
| Is great for the fast-paced action, surprises, thrills, and adrenaline. | 0.036 (0.024) |
| Is located in space. | 3.483∗∗∗ (0.048) |
| Is made for kids. | 1.070∗∗∗ (0.025) |
| Is pacifist. | 1.751∗∗∗ (0.028) |
| Is violent. | 0.645∗∗∗ (0.024) |
| Is zen. | 1.314∗∗∗ (0.026) |
| Makes me feel amused or laugh. | 0.390∗∗∗ (0.024) |
| Makes me feel strong empathy for the story or character experience. | 1.532∗∗∗ (0.027) |
| Makes me feel that I must strategize and make decisions to win. | 0.364∗∗∗ (0.024) |
| Makes me feel that I need to do grinding or repetitive work. | 0.377∗∗∗ (0.024) |
| Makes me feel that I’ve never played a game like this before. | 1.747∗∗∗ (0.028) |
| Power.distance | 0.045 (0.060) |
| Individualism | 0.110∗ (0.045) |
| Masculinity | 0.043 (0.047) |
| Uncertainty | 0.289∗∗∗ (0.036) |
| Long.term.orientation | 0.241∗∗∗ (0.038) |
| Indulgence | 0.078 (0.044) |
| Constant | 0.518∗∗∗ (0.090) |
| Observations | 407,512 |
| Log Likelihood | 228,518.300 |
| Akaike Inf. Crit. | 457,134.600 |
| Note: | ∗p0.05; ∗∗p0.01; ∗∗∗p0.001 |
Appendix D A heatmap of the standard deviations from post-stratified estimates by country.
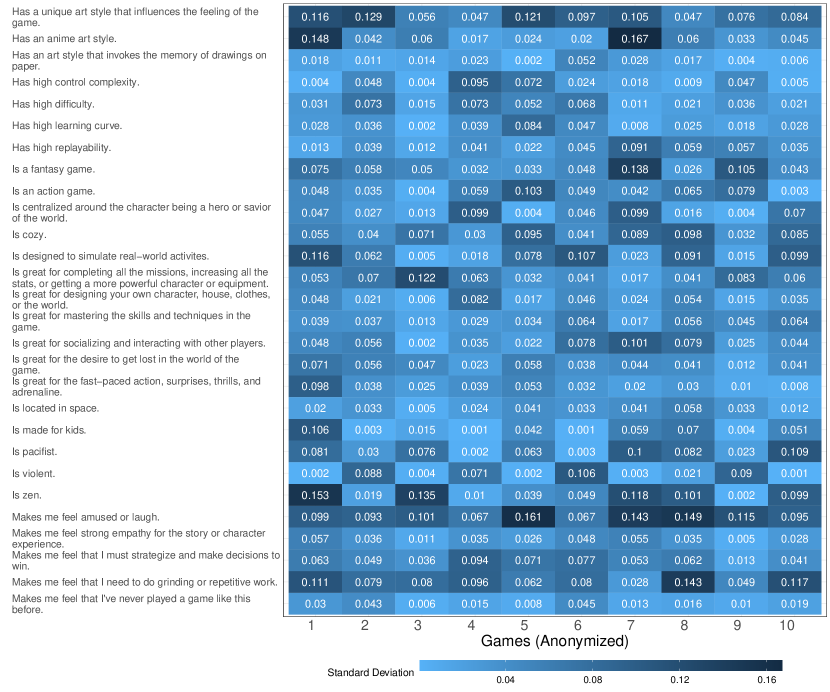
Appendix E A heatmap of the standard deviations from post-stratified estimates by gender
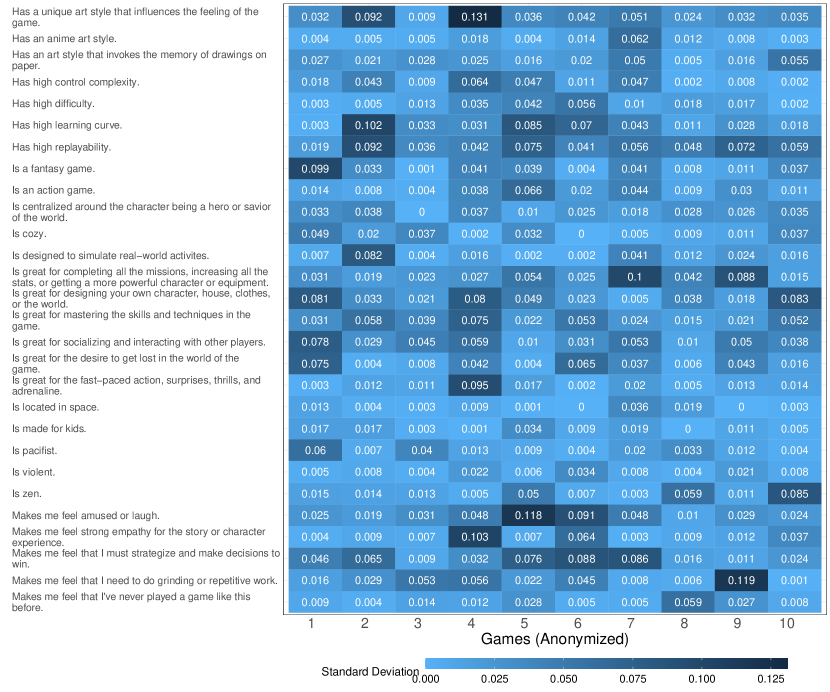
Appendix F A heatmap of the standard deviations from post-stratified estimates by age.
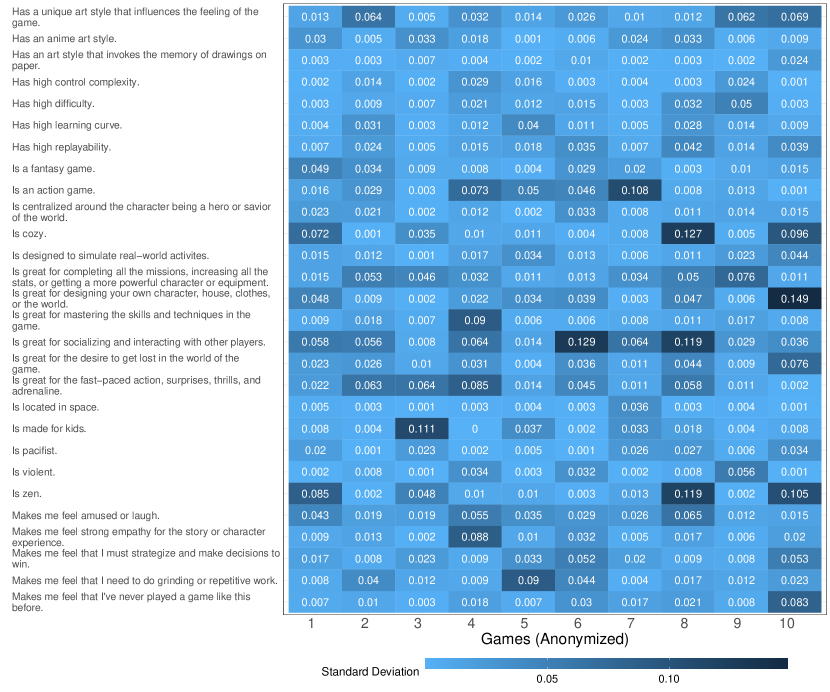
Appendix G An evaluation of F1 scores using a representative set of train and test sets.
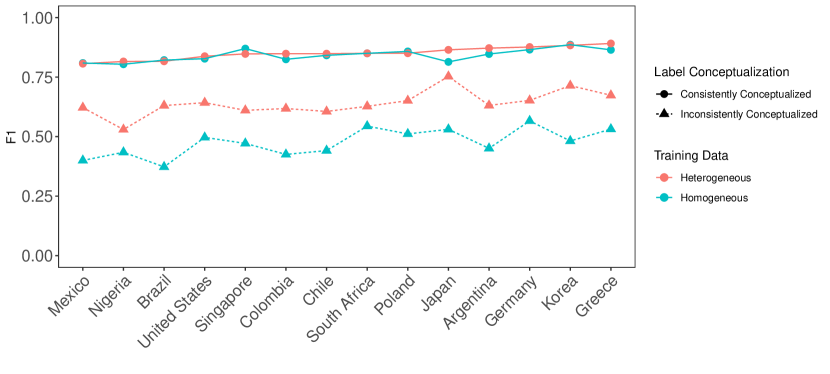
| Label Conceptualization | Annotator Train Set | ||||
|---|---|---|---|---|---|
| Consistent | Homogeneous | 0.8476 | 0.8475 | 0.7608 | 0.7578 |
| Consistent | Heterogeneous | 0.8569 | 0.8516 | 0.7642 | 0.7585 |
| Inconsistent | Homogeneous | 0.5508 | 0.5279 | 0.6597 | 0.6174 |
| Inconsistent | Heterogeneous | 0.6263 | 0.6049 | 0.5939 | 0.6021 |