Level-line Guided Edge Drawing for Robust Line Segment Detection
Abstract
Line segment detection plays a cornerstone role in computer vision tasks. Among numerous detection methods that have been recently proposed, the ones based on edge drawing attract increasing attention owing to their excellent detection efficiency. However, the existing methods are not robust enough due to the inadequate usage of image gradients for edge drawing and line segment fitting. Based on the observation that the line segments should locate on the edge points with both consistent coordinates and level-line information, i.e., the unit vector perpendicular to the gradient orientation, this paper proposes a level-line guided edge drawing for robust line segment detection (GEDRLSD). The level-line information provides potential directions for edge tracking, which could be served as a guideline for accurate edge drawing. Additionally, the level-line information is fused in line segment fitting to improve the robustness. Numerical experiments show the superiority of the proposed GEDRLSD111https://github.com/roylin1229/GEDRLSD algorithm compared with state-of-the-art methods.
Index Terms— Edge detection, level-line, line segment detection, local features, low-level features
1 Introduction
Like point features [1], line segments are also the basic image local features for many computer vision tasks, e.g., indoor frame recovery [2], in which line segments are detected and matched to provide the feature correspondences between different images of the same scenes. Line segment detection should be robust and fast to accomplish these tasks. Generally, line segments appear in the image areas where the gradients have a trending change, e.g., the edges [3].
A lot of line segment detection methods have been proposed recently. According to their detection mechanism, they can be classified into the following three groups roughly: (1) Hough based methods [4, 5]; (2) Local information analysis based methods [6, 7, 8, 9, 10]; (3) Deep learning based methods [11, 12, 13, 14]. Among these methods, the local information analysis based ones attract increasing attention for their high detection efficiency, which is critical for embedded devices with limited computation and storage resources. Notably, the methods [7, 8] based on edge drawing [15] are ultra-fast, which are more than ten times faster than the benchmark real-time line segment detection algorithm [6]. However, they are not robust enough due to inadequate usage of image gradients.
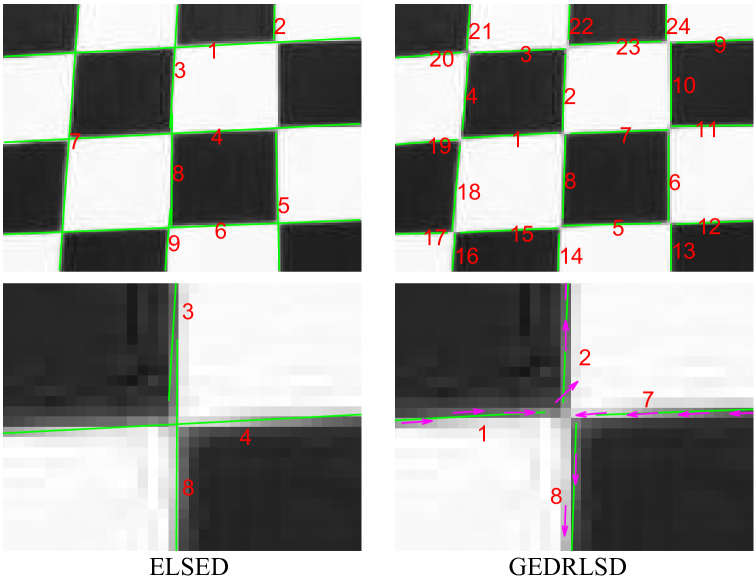
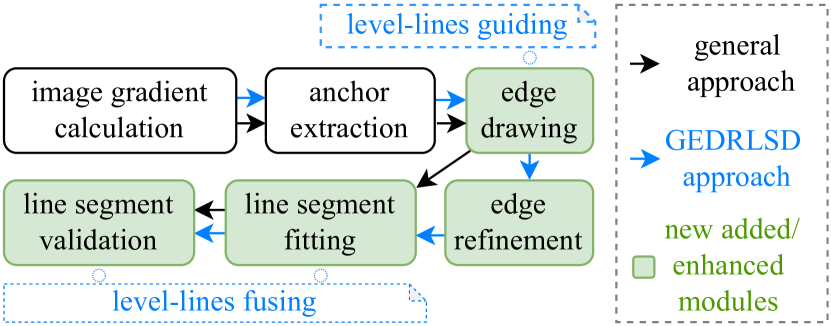
As shown in Fig. 1 and 2, this paper proposes a level-line guided edge drawing for robust line segment detection (GEDRLSD) algorithm by observing that line segments should locate on edge points with both consistent coordinates and level-lines. The double consistent constraints make it more robust than the methods based on a single coordinate constraint, e.g., [7] and [8]. The level-lines are perpendicular to the gradient orientation [6], which can assign more accurate tracking directions for edge drawing than that in [7] and [8], significantly when the edge directions are changed, as shown in Fig. 3 and 4. The drawn edges are further refined by analyzing their geometric characteristics, i.e., the reordering for ”loop” edges and merging for ”line” edges shown in subsection 3.2. Both edge coordinates and level-lines are fused in line segment fitting under the optimization framework, as shown in formula 2. Experiments show that the GEDRLSD method outperforms other state-of-the-art (SOTA) methods while still keeping its efficiency competitive.
The rest of this paper is organized as follows. In Section 2, the pipeline of edge drawing based line segment detection algorithms will be described briefly. The proposed GEDRLSD algorithm will be introduced in Section 3. Numerical experiments based on well-known benchmark datasets are included in Section 4. Section 5 is the conclusion of this paper.
2 Edge Drawing Based Line Segment Detection
Fig. 2 shows the flowchart of general edge drawing based line segment detection. The edges are drawn by the smart routing strategies [7, 8], which connect a series of anchors according to the gradient map. The anchors have a high probability of being edge points, which are pixels with the local maximum of image gradients. When calculating the gradient maps, the original images are generally smoothed by Gaussian filters to decrease the negative effect of noises.
Based on the drawn edge chain, the line segments are fitted progressively in the way of least squares using the coordinates of edge points until the predefined conditions are satisfied, e.g., the distance threshold in [7]. Finally, the fitted line segments can be further validated optionally based on additional constraints, e.g., the constraint of gradient orientation or statistics like the Helmholtz principle in [7].
3 The Proposed GEDRLSD Algorithm
In this paper, except for image gradient magnitude, the level-line information is fully used in the overall process. As shown in Fig. 2, in contrast to the pipeline shown in Section 2, the main innovations lie in the level-line guided edge drawing, edge refinement (new process), and level-line leveraged line segment fitting (simultaneously including validation).
3.1 Level-line Guided Edge Drawing
Inspired by the general processes for edge drawing, the Gaussian filter with a kernel size of (w.r.t. ) is applied in the original image to reduce the noises, and the Sobel filter is used to calculate the image gradients. These pixels with normalized gradient magnitude smaller than a threshold are not considered in edge drawing. The anchors are extracted in images where the pixels have local maxima of gradient magnitude for each quantized direction (described below) and equalized with a radius of 10 pixels as in [16] to reduce their numbers and improve the efficiency of edge drawing.
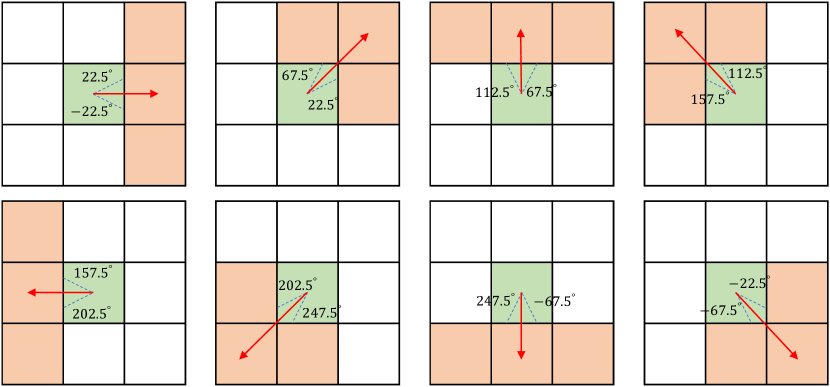
The level-lines of pixels defined in [6] are perpendicular to their gradient orientation, which can be formulated as
| (1) |
in which is the gradient orientation. Since the angles of the level-lines lie in the range of , they are quantized into eight corresponding directions for searching the candidates of the next edge points, as shown in Fig. 3.
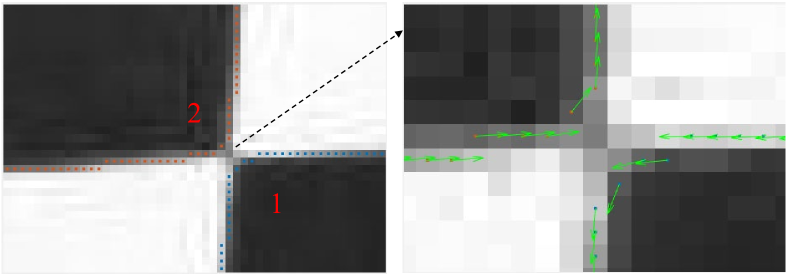
The level-lines provide potential directions for accurate edge drawing. Starting from the anchors, for each current edge point, there are three specific searching candidates of the next edge points thanks to the level-lines, instead of the rough searching candidates as in [7] and [8], significantly when the edge directions are changed. The point with maximal gradient magnitude in searching candidates is selected as the next edge point. The drawing is performed iteratively until all anchors are tracked. Fig. 4 shows an example of edges drawn by the GEDRLSD algorithm.
3.2 Edge Refinement
As in [17], if the start and end points of an edge lie in a threshold range, i.e., 3 pixels, it is declared as the ”loop” edge. Otherwise, it is the ”line” edge. Two ”line” edges are merged as one if their start and end points lie in a threshold range, i.e., 3 pixels. For ”loop” edges, the initial edges may have wrong start and end points due to the ordering of selected anchors. Here, the ”loop” edges are reordered according to the corner function introduced in [17]. Specifically, the point with the highest corner function (sharpest corner) is always selected as the start point for ”loop” edges, which ensures the single search direction of line segment fitting.
3.3 Level-line Leveraged Line Segment Fitting
As mentioned above, the line segment in this paper should locate on the edge points with both consistent coordinates and level-lines. Here, the initial line segment is generated by fitting the coordinates of edge points using the least square [8] and validated until the constraint conditions are satisfied. Two validation conditions are set in this paper, i.e., the distance error between the edge coordinates and the fitted lines, and the angle error between the edge level-lines and the fitted lines. Only the ratio of inliers validated by both distances and angles is larger than a threshold , the line segment is valid.
Once the initial line segment is generated and validated, it is grown iteratively using more edge points. Finally, the coordinates and level-lines of all tracked edge points are used to refine the line segment (with parameters of , , and ) under the optimization framework according to the formula
| (2) | |||
| (3) | |||
| (4) |
in which is normalized regarding distance validation threshold , and is normalized regarding angle validation threshold . The and are the coordinate and level-line of an edge point, respectively. The is a weight factor between and . The line segment endpoints are determined by projecting the first and last inlier edge points onto the fitted line. The refinement process can also be applied to increase the robustness further when the initial line segment is generated.
4 Numerical Experiments
To quantitatively evaluate the proposed GEDRLSD method, various existing SOTA line segment detection methods, including two Hough based methods, i.e., HoughP [4] and MCMLSD [5], five local information analysis based methods, i.e., EDLines [7], ELSED [8], LSD [6], FLD [9], and Linelet [10], and four deep learning based methods, i.e., MLSD [11], LCNN [12], HT-LCNN [13], and FClip [14], are compared based on well-known benchmark datasets.
4.1 Evaluation Datasets & Metrics
Since line segment detection is a pixel-level task, it is hard to label their ground-truth. Although some datasets [18, 10] have ”ground-truth”, their accuracy and correctness are hard to guarantee due to human labeling error and subjectivity. In this paper, inspired by feature point evaluation, the ground-truth free evaluation considering the detection repeatability in different images is adopted to evaluate various methods. The well-known publicly available datasets, i.e., the affine covariant feature dataset [19] and HPatches [20] dataset, are selected to perform the quantitative evaluation.
The repeatability defined in [17] is used as the evaluation metric, which can be formulated as , in which , , and are the numbers of matched line segments, line segments in the reference image, and line segments in the test image, respectively. Two line segments and are matched only if the projected line segment (according to the Homograph matrix) lies in the neighborhood of with a distance threshold of pixels, an angle threshold of degrees, and an overlap threshold of , as described in [10]. Besides, the line segment matches should be one-to-one, which means that the projected line segments should also lie in the neighborhood of similarly and that only the mutual closest matched of them are preserved.
4.2 Parameters Setting
In all experiments, the line segments with lengths smaller than 15 pixels are discarded for all the testing methods to eliminate the effect of short line fragments. In the GEDRLSD algorithm, the normalized gradient magnitude is set to 0.2. When fitting the line segments, the validation parameters, i.e., inlier ratio , distance threshold , and angle threshold , are set to 0.5, 3 pixels, and 20 degrees, respectively. The weight factor in formula 2 is 2. For other SOTA methods, the parameters are default values provided by the authors.
4.3 Results Analysis
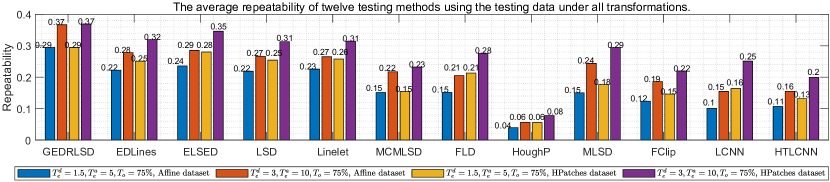
Fig. 1 qualitatively shows an example of line segments detected by the ELSED and proposed GEDRLSD algorithms. Intuitively, the GEDRLSD method detects more complete line segments than the ELSED method. Fig. 5 quantitatively shows the average repeatability of twelve methods based on two datasets and two evaluation parameter configurations under all transformations. The results indicate that the proposed GEDRLSD algorithm outperforms other SOTA methods in all the evaluation datasets and configurations. It can effectively and repeatably detect line segments.
Table 1 shows the average repeatability of twelve testing methods under a single transformation. The results indicate that, except for the light transformation, the proposed GEDRLSD algorithm performs best in all the single transformations of two evaluation datasets. The main reason is that image gradients are sensitive to light transformation and insensitive to other abovementioned transformations.
| Evaluation parameter configuration: | Evaluation parameter configuration: | |||||||||||||
| Affine feature dataset | HPatches dataset | Affine feature dataset | HPatches dataset | |||||||||||
| blur | view | zoom+rotation | light | JPEG | light | view | blur | view | zoom+rotation | light | JPEG | light | view | |
| GEDRLSD | 0.182 | 0.266 | 0.165 | 0.435 | 0.697 | 0.281 | 0.307 | 0.287 | 0.368 | 0.233 | 0.449 | 0.711 | 0.330 | 0.407 |
| EDLines | 0.126 | 0.209 | 0.121 | 0.403 | 0.464 | 0.258 | 0.244 | 0.182 | 0.295 | 0.182 | 0.428 | 0.477 | 0.310 | 0.328 |
| ELSED | 0.116 | 0.224 | 0.138 | 0.406 | 0.528 | 0.290 | 0.271 | 0.169 | 0.303 | 0.189 | 0.423 | 0.536 | 0.338 | 0.354 |
| LSD | 0.127 | 0.222 | 0.125 | 0.394 | 0.410 | 0.251 | 0.258 | 0.174 | 0.295 | 0.182 | 0.404 | 0.422 | 0.295 | 0.330 |
| Linelet | 0.120 | 0.181 | 0.126 | 0.473 | 0.480 | 0.297 | 0.220 | 0.185 | 0.228 | 0.157 | 0.494 | 0.486 | 0.344 | 0.286 |
| MCMLSD | 0.093 | 0.144 | 0.083 | 0.279 | 0.290 | 0.180 | 0.130 | 0.147 | 0.223 | 0.151 | 0.349 | 0.345 | 0.249 | 0.216 |
| FLD | 0.076 | 0.171 | 0.076 | 0.299 | 0.270 | 0.228 | 0.199 | 0.121 | 0.244 | 0.136 | 0.338 | 0.300 | 0.273 | 0.278 |
| HoughP | 0.028 | 0.032 | 0.011 | 0.107 | 0.066 | 0.076 | 0.036 | 0.041 | 0.052 | 0.018 | 0.138 | 0.093 | 0.101 | 0.056 |
| MLSD | 0.085 | 0.064 | 0.046 | 0.363 | 0.449 | 0.265 | 0.092 | 0.173 | 0.129 | 0.116 | 0.555 | 0.562 | 0.395 | 0.197 |
| Fclip | 0.096 | 0.059 | 0.029 | 0.293 | 0.332 | 0.221 | 0.075 | 0.168 | 0.131 | 0.064 | 0.380 | 0.384 | 0.293 | 0.150 |
| LCNN | 0.065 | 0.040 | 0.028 | 0.223 | 0.319 | 0.234 | 0.096 | 0.124 | 0.085 | 0.062 | 0.334 | 0.365 | 0.309 | 0.195 |
| HTLCNN | 0.097 | 0.025 | 0.083 | 0.199 | 0.248 | 0.200 | 0.066 | 0.164 | 0.056 | 0.112 | 0.287 | 0.292 | 0.264 | 0.138 |
4.4 Computation Cost Analysis
For edge drawing based line segment detection methods, the primary computation cost comes from the progressive line segment fitting based on the least square using the coordinate of edge points. Here, the additional operation mainly lies in the line segment refinement using both the coordinate of edge points and their level-line information for the GEDRLSD method, which is only performed when the initial line segment is found (optional), and the line segment is stopped to grow. For each line segment, there are at most two times of refinement. The computation cost of the GEDRLSD method is slightly higher than the ELSED and EDLines methods, but their computation costs should be at the same level, much faster than other non-edge drawing based methods.
4.5 Application in Visual Localization
The proposed GEDRLSD algorithm is applied in the long-term visual localization system mentioned in [21]. The road route ”Log 3” of the Ford AV dataset222https://avdata.ford.com/ is selected to perform the testing. The localization results show that the proposed GEDRLSD algorithm can be successfully applied in a long-term visual localization system, achieving centimeter-level positioning and high orientation accuracy. The details can be found in the published video demo https://github.com/roylin1229/GEDRLSD.
5 Conclusion
This paper proposed the GEDRLSD algorithm by assuming that the line segments should be located on the edge points with consistent coordinates and level-lines. The double consistent constraints make it more robust than the methods based on a single coordinate constraint. The level-lines provide potential directions for edge point tracking and is fused in the line segment refinement. Numerical experiments show that the proposed approach outperforms other SOTA methods while still keeping its efficiency competitive.
References
- [1] Mohammad Awrangjeb, Guojun Lu, and Manzur Murshed, “An affine resilient curvature scale-space corner detector,” in IEEE International Conference on Acoustics, Speech and Signal Processing, Honolulu, HI, USA, June 2007.
- [2] Jun Chu, Anzheng GuoLu, Lingfeng Wang, Chunhong Pan, and Shiming Xiang, “Indoor frame recovering via line segments refinement and voting,” in IEEE International Conference on Acoustics, Speech and Signal Processing, Vancouver, BC, Canada, May 2013.
- [3] Won-Dong Jang, Jae-Young Sim, and Chang-Su Kim, “Geqm: A quality metric for gray-level edge maps based on structural matching,” in IEEE International Conference on Acoustics, Speech and Signal Processing, Florence, Italy, May 2014.
- [4] J. Matas, C. Galambos, and J. Kittler, “Robust detection of lines using the progressive probabilistic hough transform,” Computer Vision and Image Understanding, vol. 78, no. 1, pp. 119–137, 2000.
- [5] Emilio J. Almazàn, Ron Tal, Yiming Qian, and James H. Elder, “Mcmlsd: A dynamic programming approach to line segment detection,” in IEEE Conference on Computer Vision and Pattern Recognition, Honolulu, HI, USA, July 2017.
- [6] Rafael Grompone von Gioi, Jérémie Jakubowicz, Jean-Michel Morel, and Gregory Randall, “LSD: a Line Segment Detector,” Image Processing On Line, vol. 2, pp. 35–55, 2012.
- [7] Cuneyt Akinlar and Cihan Topal, “Edlines: A real-time line segment detector with a false detection control,” Pattern Recognition Letters, vol. 32, no. 13, pp. 1633–1642, 2011.
- [8] Iago Suárez, José M. Buenaposada, and Luis Baumela, “Elsed: Enhanced line segment drawing,” Pattern Recognition, vol. 127, pp. 108619, 2022.
- [9] Jin Han Lee, Sehyung Lee, Guoxuan Zhang, Jongwoo Lim, Wan Kyun Chung, and Il Hong Suh, “Outdoor place recognition in urban environments using straight lines,” in IEEE International Conference on Robotics and Automation, Hong Kong, China, May 2014.
- [10] Nam-Gyu Cho, Alan Yuille, and Seong-Whan Lee, “A novel linelet-based representation for line segment detection,” IEEE Transactions on Pattern Analysis and Machine Intelligence, vol. 40, no. 5, pp. 1195–1208, 2018.
- [11] Geonmo Gu, Byungsoo Ko, SeoungHyun Go, Sung-Hyun Lee, Jingeun Lee, and Minchul Shin, “M-lsd: Towards light-weight and real-time line segment detection,” in Association for the Advancement of Artificial Intelligence, Feb. 2022.
- [12] Yichao Zhou, Haozhi Qi, and Yi Ma, “End-to-end wireframe parsing,” in IEEE/CVF International Conference on Computer Vision, Seoul, Korea (South), Oct. 2019.
- [13] Yancong Lin, Silvia L. Pintea, and Jan C. van Gemert, “Deep hough-transform line priors,” in European Conference on Computer Vision, Glasgow, United Kingdom, Aug. 2020.
- [14] Xili Dai, Haigang Gong, Shuai Wu, Xiaojun Yuan, and Ma Yi, “Fully convolutional line parsing,” Neurocomputing, vol. 506, pp. 1–11, 2022.
- [15] Cihan Topal and Cuneyt Akinlar, “Edge drawing: A combined real-time edge and segment detector,” Journal of Visual Communication and Image Representation, vol. 23, no. 6, pp. 862–872, 2012.
- [16] Raúl Mur-Artal, J. M. M. Montiel, and Juan D. Tardós, “Orb-slam: A versatile and accurate monocular slam system,” IEEE Transactions on Robotics, vol. 31, no. 5, pp. 1147–1163, 2015.
- [17] Mohammad Awrangjeb and Guojun Lu, “Robust image corner detection based on the chord-to-point distance accumulation technique,” IEEE Transactions on Multimedia, vol. 10, no. 6, pp. 1059–1072, 2008.
- [18] Kun Huang, Yifan Wang, Zihan Zhou, Tianjiao Ding, Shenghua Gao, and Yi Ma, “Learning to parse wireframes in images of man-made environments,” in IEEE/CVF Conference on Computer Vision and Pattern Recognition, Salt Lake City, UT, USA, June 2018.
- [19] Krystian Mikolajczyk, Tinne Tuytelaars, Cordelia Schmid, Andrew Zisserman, Jiri Matas, Frederik Schaffalitzky, Timor Kadir, and L Van Gool, “A comparison of affine region detectors,” International journal of computer vision, vol. 65, no. 1, pp. 43–72, 2005.
- [20] Vassileios Balntas, Karel Lenc, Andrea Vedaldi, Tinne Tuytelaars, Jiri Matas, and Krystian Mikolajczyk, “-patches: A benchmark and evaluation of handcrafted and learned local descriptors,” IEEE Transactions on Pattern Analysis and Machine Intelligence, vol. 42, no. 11, pp. 2825–2841, 2020.
- [21] Xinyu Lin, Yingjie Zhou, Yipeng Liu, and Ce Zhu, “Long-term visual localization using illumination insensitive descriptors,” in IEEE International Workshop on Multimedia Signal Processing, Shanghai, China, Sept. 2022.