Identification of interstellar cyanamide towards the hot molecular core G358.93–0.03 MM1
Abstract
The amide-related molecules are essential for the formation of the other complex bio-molecules and an understanding of the prebiotic chemistry in the interstellar medium (ISM). We presented the first detection of the rotational emission lines of the amide-like molecule cyanamide (\ceNH2CN) towards the hot molecular core G358.93–0.03 MM1 using the Atacama Large Millimeter/Submillimeter Array (ALMA). Using the rotational diagram model, the derived column density of \ceNH2CN towards the G358.93–0.03 MM1 was (5.92.5)1014 cm-2 with a rotational temperature of 100.630.4 K. The derived fractional abundance of \ceNH2CN towards the G358.93–0.03 MM1 with respect to \ceH2 was (4.722.0)10-10, which is very similar to the existent three-phase warm-up chemical model abundances of \ceNH2CN. We compare the estimated abundance of \ceNH2CN towards G358.93–0.03 MM1 with other sources, and we observe the abundance of \ceNH2CN towards G358.93–0.03 MM1 is nearly similar to that of the sculptor galaxy NGC 253 and the low-mass protostars IRAS 16293–2422 B and NGC 1333 IRAS4A2. We also discussed the possible formation mechanisms of \ceNH2CN towards the hot molecular cores and hot corinos, and we find that the \ceNH2CN molecule was created in the grain-surfaces of G358.93–0.03 MM1 via the neutral-neutral reaction between \ceNH2 and CN.
email: arijitmanna@mcconline.org.in
Keywords ISM: individual objects (G358.93–0.03 MM1) – ISM: abundances – ISM: kinematics and dynamics – stars: formation – astrochemistry
Band Date of observation Start time End time Number Frequency range Spectral resolution Field of View (FOV) (YYYY MMM DD) (hh:mm) (hh:mm) of antennas (GHz) (kHz) () 6 2019 Oct 07 22:01 22:23 42 216.44–217.38 488.28 26.599 218.08–218.55 282.23 219.88–220.35 282.23 220.33–220.80 282.23
1 Introduction
The amide-type molecule cyanamide (\ceNH2CN) was formed with amide and cyanide functional groups, which acted as a possible precursor of urea (\ceNH2CONH2) in the ISM. The urea was formed via the hydrolysis of \ceNH2CN in the ISM (Kilpatrick, 1947). The carbodiimide (HNCNH) molecule is known as one of the isomer of \ceNH2CN, which contains the –NCN– frame (Turner et al., 1975; Coutens et al., 2018). The molecules with the –NCN– frame play a major role in linking biological processes and in the assembly of amino acids into peptides (Williams & Ibrahim, 1981). The HNCNH molecule forms due to photochemical and thermally induced reactions of \ceNH2CN in interstellar ice analogues (Duvernay et al., 2005). Except for urea, the \ceNH2CN molecule also acts as a possible precursor of 2-amino-oxazole, cytosine, 3’-cyclic phosphate (pyrimidine ribonucleotide), and beta-ribocytidine-2 via biochemistry synthesis routes towards the hot cores/corinos (Jiménez-Serra et al., 2020). The \ceNH2CN molecule contains 0+ and 0- substates with a pyramidal equilibrium structure (Sharma, 2021). The dipole moments of the 0+ and 0- substrates are D and D, respectively (Brown et al., 1985; Sharma, 2021). In the ISM, evidence of \ceNH2CN was found towards the hot molecular cores Sgr B2 (N), Orion KL, IRAS 20126+410, and NGC 6334I (Turner et al., 1975; White et al., 2003; Palau et al., 2017; Ligterink et al., 2020). The rotational emission lines of \ceNH2CN were also detected towards the low-mass solar-like protostars IRAS 16293–2422 B and NGC 1333 IRAS2A using the ALMA and Plateau de Bure Interferometer (PdBI) (Coutens et al., 2018). Outside of the Milky Way, evidence of the \ceNH2CN molecule was also found towards the sculptor galaxy NGC 253 and the starburst galaxy M82 (Martín et al., 2006; Aladro et al., 2011). Recently, the emission lines of \ceNH2CN were also detected towards the hot molecular core G10.47+0.03 using the ALMA band 4, with an estimated column density of 6.601015 cm-2 and a rotational temperature of 201.2 K (Manna & Pal, 2022a).
The search for complex organic molecules using the millimeter and submillimeter telescopes in the star-formation regions gives us an idea about the chemistry in the ISM. The hot molecular cores are one of the highly chemically rich phases that are located in the high-mass star-formation regions, and they play an important role in increasing the chemical complexity in the ISM (Shimonishi et al., 2021). The hot molecular cores are the ideal astronomical objects in the ISM to study the different complex and prebiotic molecular lines because they have a warm temperature (100 K), a high gas density (106 cm-3), and a small source size (0.1 pc) (van Dishoeck & Blake, 1998). The chemistry of the hot core is characterised by the sublimation of ice mantles, which accumulate during the star-formation activities (Shimonishi et al., 2021). The gaseous molecules and atoms are frozen onto the dust grains of cold molecular clouds and prestellar cores. When the temperature increases due to star-formation activities, the chemical interaction between heavy compounds becomes active on the grain surfaces, and the complex organic molecules are formed in the star-formation regions (Garrod & Herbst, 2006; Garrod, 2013; Shimonishi et al., 2021). So, the highly dense, warm, and chemically rich abundant molecules around the protostars produce the strongest molecular line emitters, known as the hot molecular cores (Shimonishi et al., 2021). The period of the hot molecular cores is thought to last about 105 years (medium warm-up phase) to 106 years (slow warm-up phase) (van Dishoeck & Blake, 1998; Garrod & Herbst, 2006; Garrod, 2013).
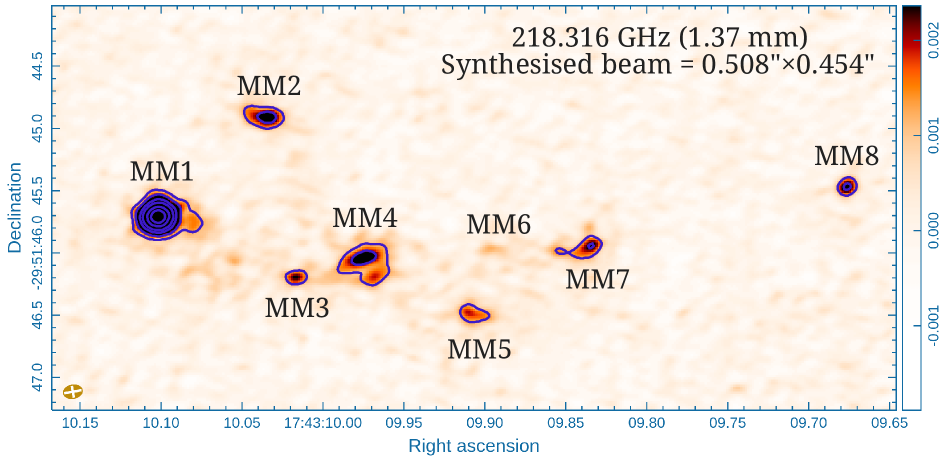
The hot molecular core G358.93–0.03 MM1 is located in the high-mass star-formation region G358.93–0.03. The high-mass star-formation region G358.93–0.03 is located at a distance of 6.75 kpc from the earth (Reid et al., 2014; Brogan et al., 2019). The luminosity of the high-mass star-formation region G358.93–0.03 was 7.660103L⊙ with total gas mass 16712M⊙ (Brogan et al., 2019). The high-mass star-formation region G358.93–0.03 has eight sub-millimeter wavelength continuum sources, i.e., G358.93–0.03 MM1 to G358.93–0.03 MM8. Among the eight sources, G358.93–0.03 MM1 and G358.93–0.03 MM3 emit the molecular line emission (Brogan et al., 2019). That means G358.93–0.03 MM1 and G358.93–0.03 MM3 are hot molecular cores because those two sources emit both continuum and line emission (Brogan et al., 2019; Bayandina et al., 2022). Earlier, Brogan et al. (2019) claimed that G358.93–0.03 MM1 is more chemically rich than G358.93–0.03 MM3. Earlier, the maser lines of methanol (\ceCH3OH), durated water (HDO), and isocyanic acid (HNCO) were detected towards the G358.93–0.03 MM1 using the ALMA, TMRT, and VLA radio telescopes (Brogan et al., 2019; Chen et al., 2020). The emission lines of methyl cyanide (\ceCH3CN) were also detected towards the G358.93–0.03 MM1 and the G358.93–0.03 MM3 using the ALMA (Brogan et al., 2019).
In this article, we present the first detection of the rotational emission lines of \ceNH2CN towards the hot molecular core region G358.93–0.03 MM1 using the ALMA band 6. The ALMA observations and data reduction of the high-mass star-formation region G358.93–0.03 were presented in Section 2. The result of the detection of emission lines of \ceNH2CN towards the G358.93–0.03 MM1 was shown in Section 3. The discussion and conclusion of the detection of \ceNH2CN towards the G358.93–0.03 MM1 were shown in Section 4 and 5.
2 Observations and data reduction
The high-mass star-formation region G358.93–0.03 was observed using the Atacama Large Millimeter/Submillimeter Array (ALMA) band 6 (frequency range of 216.44–220.80 GHz) receiver to study the massive protostellar accretion outburst (ID: 2019.1.00768.S., PI: Crystal Brogan). The observations were conducted on October 7th, 2019 with on-source integration times of 604.80 sec. The phase centre of G358.93–0.03 was ()J2000 = 17:43:10.000, –29:51:46.000. The observation was carried out using the forty-two antennas, with a minimum baseline of 15 m and a maximum baseline of 783 m. During the observation, J1744–3116 was used as a phase calibrator, and J1924–2914 was used as a flux calibrator and bandpass calibrator. The observation details are shown in Table 1.
We used the Common Astronomy Software Application (CASA 5.4.1) for the reduction of data using the ALMA data analysis pipeline (McMullin et al., 2007). For flux calibration, we applied the CASA task SETJY using the Perley-Butler 2017 flux calibrator model (Perley & Butler, 2017). For bandpass calibration and flagging the band antenna data, we applied the CASA pipeline tasks hifa_bandpassflag and hifa_flagdata. After the flux calibration, bandpass calibration, and flagging of the bad channels, we employed the task MSTRANSFORM to separate the target object G358.93–0.03 with all available rest frequencies. We created four continuum emission images of G358.93–0.03 using the CASA task TCLEAN with the HOGBOM deconvolver using the frequency ranges of 216.44–217.38 GHz, 218.08–218.55 GHz, 219.88–220.35 GHz, and 220.33–220.80 GHz, respectively. Among the four individual continuum emission images, we have shown the sub-millimeter wavelength continuum emission map of the high-mass star-formation region G358.93–0.03 at frequency 218.316 GHz (1.37 mm) in Figure 1 as an example. The continuum emission image of G358.93–0.03 was created using the Cube Analysis and Rendering Tool for Astronomy (CARTA) software package (Comrie et al., 2021). The bandwidth of this continuum emission image of G358.93–0.03 at frequency 218.316 GHz is 0.47 GHz. The effect of bandwidth smearing in those observed frequency ranges is minimal as according to Mangum (2020) the maximum bandwidth to avoid amplitude smearing between the frequency ranges of 216.44 GHz and 220.80 GHz is 1.2 GHz. From the continuum emission map of G358.93–0.03 at frequency 218.316 GHz, we identified the eight sub-millimeter wavelength continuum sources, G358.93–0.03 MM1 to G358.93–0.03 MM8. Among the eight sources, G358.93–0.03 MM1 and G358.93–0.03 MM3 are hot molecular cores because both sources emit the line emission as well as the emission lines of \ceCH3CN (Brogan et al., 2019). Earlier, Brogan et al. (2019) showed the first sub-millimeter continuum emission map of G358.93–0.03, but the authors were unable to clearly identify the continuum sources G358.93–0.03 MM6 and G358.93–0.03 MM8 due to the lower image resolution. We first individually detected all eight sub-millimeter wavelength continuum sources in the massive star-formation region G358.93–0.03 using the ALMA at wavelength 1.37 mm with an angular resolution of 0.508′′0.454′′. After the continuum analysis, we employed the task UVCONTSUB to subtract the background continuum emission from the UV plane of the calibrated data. Now we created the spectral images at frequency ranges of 216.44–217.38 GHz, 218.08–218.55 GHz, 219.88–220.35 GHz, and 220.33–220.80 GHz using the task TCLEAN with the SPECMODE = CUBE parameter. Finally, we used the CASA task IMPBCOR for the correction of the synthesised beam pattern in the continuum and spectral images of G358.93–0.03.
| Frequency | Wavelength | Integrated Flux | Peak flux | Beam size | RMS | Position angle |
|---|---|---|---|---|---|---|
| (GHz) | (mm) | (mJy) | (mJy beam-1) | (′′′′) | (Jy) | (∘) |
| 216.90 | 1.38 | 61.723.7 | 50.601.9 | 0.5070.456 | 22.12 | 88.879 |
| 218.31 | 1.37 | 72.313.8 | 56.831.8 | 0.5080.454 | 16.40 | 87.515 |
| 220.11 | 1.36 | 72.123.5 | 61.352.0 | 0.4970.455 | 28.23 | 89.169 |
| 220.56 | 1.35 | 77.914.2 | 69.422.2 | 0.4940.454 | 22.22 | 86.827 |
3 Results
3.1 Sub-millimeter wavelength continuum emission towards the G358.93–0.03 MM1
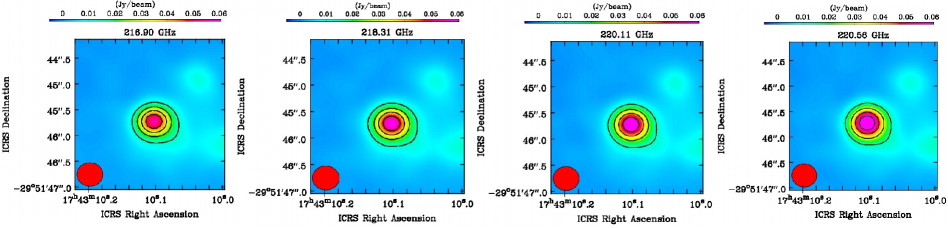
Among the eight sub-millimeter wavelength continuum sources, we mainly focus on the G358.93–0.03 MM1 ( = 17:43:10.102, –29:51:45.714) because that source is the brightest sub-millimeter wavelength continuum source in the massive star-formation region G358.93–0.03, which hosts the line-rich hot core (Brogan et al., 2019; Bayandina et al., 2022). We presented the sub-millimeter wavelength continuum emission images of the G358.93–0.03 MM1 at frequencies of 216.90 GHz (1.38 mm), 218.31 GHz (1.37 mm), 220.11 GHz (1.36 mm), and 220.56 GHz (1.35 mm) in Figure 2. Now we used the CASA task IMFIT to fit the 2D Gaussian over all the continuum images and obtained an integrated flux density, peak flux density, synthesised beam size, position angle, and RMS, which are presented in Table 2. We notice that the hot molecular core G358.93–0.03 MM1 was resolved in ALMA band 6 as it was found that the source was larger than the synthesised beam size. Earlier, Brogan et al. (2019) also detected the millimeter-wavelength continuum emission from the eight individual continuum sources (G358.93–0.03 MM1 to G358.93–0.03 MM8) of G358.93–0.03 at frequencies of 195.58 GHz, 233.75 GHz, and 337.26 GHz, and the author mentioned the continuum emission maps of the eight individual continuum sources were resolved within the observable frequency ranges.
3.2 Estimation of hydrogen (\ceH2) column density and dust optical depth () towards the G358.93–0.03 MM1
The peak flux density (Sν) of optically thin dust continuum emission can be expressed as,
| (1) |
where presented the optical depth, indicated the Planck function at dust temperature (Whittet, 1992), and is the solid angle of the synthesised beam. The expression of optical depth in terms of the mass density of dust can be written as,
| (2) |
where is the mass absorption coefficient, L is the path length, and indicates the mass density of dust. The mass density of the dust can be expressed in terms of the dust-to-gas mass ratio ().
| (3) |
where is the hydrogen mass density, presented the mean atomic mass per hydrogen, mH indicated the mass of hydrogen, and is the column density of hydrogen. We take the dust temperature to be 150 K (Chen et al., 2020), , and (Cox & Pilachowski, 2000). The estimated peak flux density of the dust continuum of the G358.93–0.03 MM1 at different frequencies is presented in Table. 2. From equations 1, 2, and 3, the column density of molecular hydrogen can be expressed as,
| (4) |
During the estimation of the mass absorption coefficient (), we adopted the formula (Motogi et al., 2019), where indicated the emissivity of the dust grains at a gas density of , which covered by a thin ice mantle at 230 GHz. We used the dust spectral index 1.7 (Brogan et al., 2019). Using the mass absorption coefficient formula, we estimated the value of to be 0.814, 0.823, 0.835, and 0.838 for frequencies of 216.90, 218.31, 220.11, and 220.56 GHz, respectively. We estimated the column density of hydrogen () for the four frequency regions towards the G358.93–0.03 MM1, which was presented in Table. 3. We take the average value to estimate the resultant hydrogen column density towards the G358.93–0.03 MM1. The estimated column density of hydrogen towards the G358.93–0.03 MM1 was (1.250.11)1024 cm-2. We also determine the value of optical depth () using the following equation,
| (5) |
where is the brightness temperature and is the dust temperature of G358.93–0.03 MM1. For estimation of the brightness temperature, we used the Rayleigh-Jeans approximation, 1 Jy beam 118 K (Gorai et al., 2021). The calculated dust optical depth of G358.93–0.03 MM1 with individual frequencies was presented in Table. 3. The average dust optical depth was 0.0475. The estimated dust optical depth indicated that the G358.93–0.03 MM1 is optically thin between the frequency ranges of 216.44–220.80 GHz.
Wavelength Hydrogen column density Optical depth (mm) (cm-2) () 1.38 0.0397 1.37 0.0457 1.36 0.0502 1.35 0.0561 Average Value 0.0475
Observed frequency Transition Peak intensity S FWHM VLSR Remark (GHz) (–) (K) (s-1) (K) (Debye2)† (km s-1) (km s-1) (K km s-1) 218.394 11(1,11)–10(1,10), V = 1 148.33 1.0510-3 3.459 199.330 3.3580.18 –16.510.21 10.4571.21 Non blended 218.461 11(1,11)–10(1,10), V = 0 77.40 1.0810-3 8.663 612.666 8.3100.35 –16.500.12 47.4150.22 Blended with \ceNH2CHO 219.875 11(2,10)–10(2,9), V = 0 121.29 1.0710-3 6.266 198.970 3.5340.13 –16.490.94 18.0590.22 Non blended 219.893 11(0,11)–10(0,10), V = 0 63.32 1.1110-3 6.228 205.927 3.6960.28 –16.510.82 18.7320.11 Non blended 219.914 11(2,9)–10(2,8), V = 0 121.29 1.0710-3 6.025 198.996 3.7280.25 –16.520.23 17.2490.51 Non blended 220.126 11(3,9)–10(3,8), V = 0 193.72 1.0410-3 6.861 579.630 4.5080.17 –16.520.29 28.3920.26 Non blended 220.127 11(3,8)–10(3,7), V = 0 193.72 10.410-3 6.861 579.624 4.5060.36 –16.490.17 28.3890.29 Non blended
†–The values of the S were taken from the JPL molecular database (Pickett et al., 1998).
3.3 Identification of the \ceNH2CN towards the G358.93–0.03 MM1
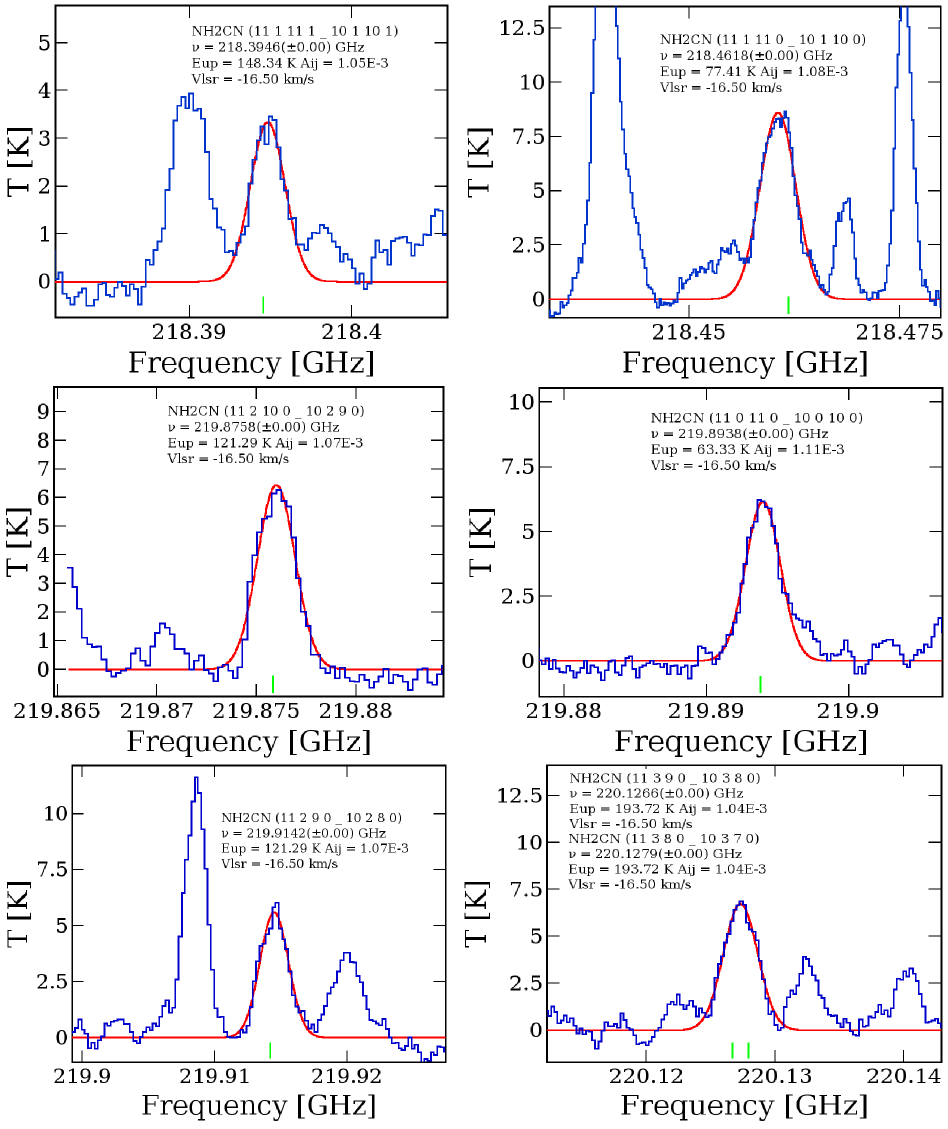
After the production of the spectral images of G358.9–0.03 from the observable frequency ranges, we see that only the spectra of G358.93–0.03 MM1 and G358.93–0.03 MM3 show any line emission. We did not observe any line emission from other sources in G358.93–0.03. We focus to study of the complex organic molecules on the G358.93–0.03 MM1 rather than the G358.93–0.03 MM3 because the G358.93–0.03 MM1 is more chemically rich than the G358.93–0.03 MM3. We extracted the sub-millimeter wavelength molecular rich spectra from the spectral images of G358.93–0.03 to create a 0.781′′ diameter circular region over the hot molecular core G358.93–0.03 MM1 ( = 17:43:10.102, –29:51:45.714). The systematic velocity of G358.93–0.03 MM1 was –16.5 km s-1 (Brogan et al., 2019). We used the CASSIS (Vastel et al., 2015) with the Line Analysis module to examine the molecular emission lines from the sub-millimeter spectra of G358.93–0.03 MM1. After the spectral analysis, we identified the rotational emission lines of amide-like molecules \ceNH2CN from the sub-millimeter spectra G358.93–0.03 MM1 using the Jet Population Laboratory (JPL) (Pickett et al., 1998) spectroscopic database. We detected the seven rotational emission lines of \ceNH2CN at frequencies ranging from 216.44 to 220.80 GHz. There are no missing transition lines of \ceNH2CN within the observable frequency ranges as per the JPL molecular database.
After the identification, we fitted the Gaussian model over the detected rotational emission spectra of \ceNH2CN using the Levenberg-Marquardt algorithm, which was available in CASSIS. After fitting a Gaussian model over the detected spectra of \ceNH2CN, we obtained molecular transitions (–), upper state energy () in K, line intensity () in Debye2, FWHM in km s-1, Einstein coefficients () in s-1, peak intensity in K, and integrated intensity () in K km s-1. After the spectral analysis, we noticed J = 11(1,11)–10(1,10) V = 1, J = 11(2,10)–10(2,9) V = 0, J = 11(0,11)–10(0,10) V = 0, J = 11(2,9)–10(2,8) V = 0, J = 11(3,9)–10(3,8) V = 0, and J = 11(3,8)–10(3,7) V = 0 transition lines of \ceNH2CN are not contaminated with other nearby molecular transitions. We also observed that the J = 11(1,11)–10(1,10), V = 0 transition line of \ceNH2CN is blended with the \ceNH2CHO molecular transition. During the spectral analysis, we notice the J = 11(3,9)–10(3,8) V = 0, and J = 11(3,8)–10(3,7) V = 0 transition lines of \ceNH2CN are present in a single spectral profile, which indicates the current spectral resolution is insufficient to resolve those two transition lines of \ceNH2CN towards the G358.93–0.03 MM1. The Gaussian-fitting rotational emission spectra of \ceNH2CN were shown in Figure 3 and a summary of the Gaussian-fitting spectral line properties of \ceNH2CN was presented in Table 4.
3.4 Spatial distribution of \ceNH2CN towards the G358.93–0.03 MM1
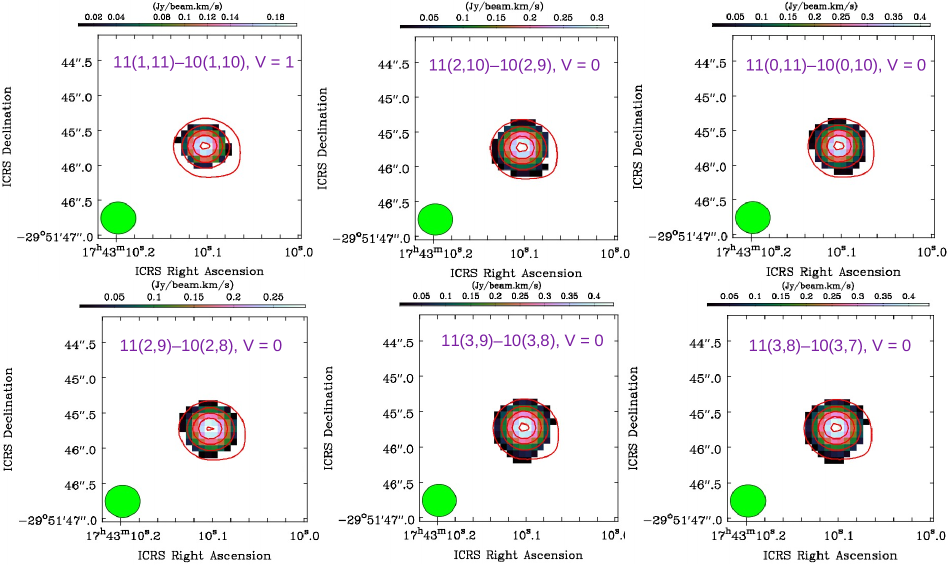
We created the integrated emission maps of the non-blended transitions of \ceNH2CN towards the G358.93–0.03 MM1 using the CASA task IMMOMENTS. During the run of the task IMMOMENTS, we specified the channel ranges of the spectral images where the emission lines of \ceNH2CN were identified. The resultant integrated emission maps of the \ceNH2CN towards the G358.93–0.03 MM1 were shown in Figure 4, which was overlaid on the 1.37 mm continuum emission map. We observed that the integrated \ceNH2CN emission maps show a peak at the position of continuum emission. The integrated emission maps indicated that the rotational emission lines of \ceNH2CN mainly come from the highly dense, warm inner hot core region of the G358.93–0.03 MM1. Now we used the CASA task IMFIT for fitting the 2D Gaussian over the integrated emission maps of \ceNH2CN to estimate the emitting regions of \ceNH2CN. The deconvolved synthesised beam sizes of the \ceNH2CN emitting regions were derived by the following equation:
| (6) |
where was the half-power width of the synthesised beam of the integrated emission maps and presented the diameter of the circle whose area was surrounding the line peak of \ceNH2CN (Manna & Pal, 2022a, b). The derived emitting regions of \ceNH2CN are presented in Table 5. The emitting regions of \ceNH2CN were found to be in the range of 0.496′′–0.513′′. We observed that the derived \ceNH2CN emitting regions are comparable to or slightly greater than the synthesised beam sizes of the integrated emission maps. That indicates the transitions of \ceNH2CN were not well resolved spatially or, at best, marginally resolved towards the G358.93–0.03 MM1. So it is not possible to present any conclusions about the morphology of the spatial distribution of \ceNH2CN towards the G358.93–0.03 MM1. High-sensitivity data with higher spatial and angular resolution observations are required to understand the spatial distribution of \ceNH2CN towards the hot molecular core G358.93–0.03 MM1.
Transition Frequency Eup Emitting region [–] [GHz] [K] [′′] 11(1,11)–10(1,10), V = 1 218.394 148.33 0.501 11(2,10)–10(2,9), V = 0 219.875 121.29 0.496 11(0,11)–10(0,10), V = 0 219.893 63.32 0.512 11(2,9)–10(2,8), V = 0 219.914 121.29 0.498 11(3,9)–10(3,8), V = 0 220.126 193.72 0.513 11(3,8)–10(3,7), V = 0 220.127 193.72 0.513
3.5 Rotational diagram analysis of \ceNH2CN
In this work, we have identified the seven rotational emission lines of \ceNH2CN towards the G358.93–0.03 MM1. Rotational diagram analysis is the most efficient way to estimate the rotational temperature () in K and the column density () in cm-2 of the detected emission lines of \ceNH2CN. We used the rotational diagram model since we assumed that the observed rotational emission lines of \ceNH2CN are optically thin and that they are populated in local thermodynamic equilibrium (LTE) conditions. The LTE assumption was appropriate for the G358.93–0.03 MM1 because the gas density of the warm inner region of the hot core was 2107 cm-3 (Stecklum et al., 2021). The equation of column density of the optically thin molecular emission lines can be expressed as (Goldsmith & Langer, 1999),
| (7) |
where indicates the dipole moments of the \ceNH2CN, is the rest frequency, indicates the line strength, is the degeneracy of the upper state, indicates the integrated intensity of the detected emission lines of the \ceNH2CN, and is the Boltzmann constant. The total column density of \ceNH2CN under the LTE condition can be expressed as,
| (8) |
where, is the upper-state energy of \ceNH2CN, is the rotational temperature of \ceNH2CN, and indicates the partition function of rotational temperature (). The partition function of \ceNH2CN at 75 K, 150 K, and 300 K is 1730.290, 5730.062, and 17902.30, respectively. Equation 8 can be rearranged as,
| (9) |
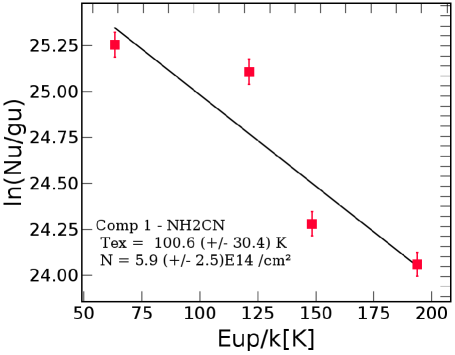
The equation 9 presents a linear relation between and upper-state energy (). After the estimation of from equation 7, we fit a straight line to the estimated values of , which vary with . After fitting the straight line, the rotational temperature was estimated from the inverse of the slope, and the column density was estimated from the intercept of the slope. For rotational diagram analysis, the spectral line parameters of \ceNH2CN are estimated by fitting a Gaussian model over the observed emission lines of \ceNH2CN, which were presented in Table 4. After spectral analysis, we notice only the J = 11(1,11)–10(1,10) V = 0 transition line of \ceNH2CN is blended with \ceNH2CHO, and that transition was excluded from the rotational diagram analysis. We observed that J = 11(2,10)–10(2,9) V = 0 and J = 11(2,9)–10(2,8) V = 0 transitions have the same upper-state energy of 121.29 K. During the rotational diagram, we used the J = 11(2,9)–10(2,8) V = 0 transition line because the line intensity of the J = 11(2,9)–10(2,8) V = 0 transition line is slightly higher than that of the J = 11(2,10)–10(2,9) V = 0 transition line. Similarly, we also observed that the J = 11(3,9)–10(3,8) V = 0 and J = 11(3,8)–10(3,7) V = 0 transitions of \ceNH2CN are present in the single spectral profile, and the upper-state energy of those two transitions is the same (193.72 K). So, we take the J = 11(3,9)–10(3,8) V = 0 transition line for the rotational diagram because the line intensity of J = 11(3,9)–10(3,8) V = 0 is slightly higher than the J = 11(3,8)–10(3,7) V = 0 transition line. The rotational diagram analysis was carried out using the J = 11(1,11)–10(1,10) V = 1, J = 11(0,11)–10(0,10) V = 0, J = 11(2,9)–10(2,8), V = 0, and J = 11(3,9)–10(3,8) V = 0 transition lines of \ceNH2CN. The resultant rotational diagram of \ceNH2CN, which was computed using the ROTATIONAL DIAGRAM module in CASSIS, is shown in Figure 5. In the rotational diagram, the vertical red error bars represent the absolute uncertainty of , which was calculated from the of the emission spectra. From the rotational diagram, the estimated column density of \ceNH2CN was (5.92.5)1014 cm-2 with a rotational temperature () of 100.630.4 K. The derive rotational temperature indicates that the emission lines of \ceNH2CN arise from the warm inner region of the G358.93–0.03 MM1 because the temperature of the hot molecular core is above 100 K (van Dishoeck & Blake, 1998). The derived fractional abundance of \ceNH2CN with respect to \ceH2 towards the G358.93–0.03 MM1 was (4.722.0)10-10, where the \ceH2 column density was (1.250.11)1024 cm-2.
4 Discussion
4.1 Comparison with other sources
Here we compare the observed abundance of \ceNH2CN in G358.93–0.03 MM1 and other hot molecular cores, galaxies, high and low-mass protostars, and molecular clouds, which are shown in Table 6. The estimated abundance of \ceNH2CN towards the G358.93–0.03 MM1 is (4.722.0)10-10. This means the abundance of \ceNH2CN towards the G358.93–0.03 MM1 is nearly similar to that of the sculptor galaxy NGC 253 and the low-mass protostars IRAS 16293–2422 B and NGC 1333 IRAS4A2. The abundance of \ceNH2CN towards G358.93–0.03 MM1 is approximately one order of magnitude higher as compared to the hot molecular cores Sgr B2(OH), Sgr B2(N), and Sgr B2(M), and the low-mass protostar NGC 1333 IRAS2A. Similarly, the abundance of \ceNH2CN towards G358.93–0.03 MM1 is approximately one order of magnitude lower as compared to the high-mass protostar IRAS 20126+4104 and the molecular cloud G+0.693. We also observed that the abundance of \ceNH2CN towards G358.93–0.03 MM1 is approximately two orders of magnitude lower as compared to the hot molecular core G10.47+0.03. This result indicates the formation route(s) of \ceNH2CN towards G358.93–0.03 MM1 is similar to NGC 253, IRAS 16293–2422 B, and NGC 1333 IRAS4A2.
Source name Type (\ceNH2CN) Tex (\ceH2) Abundance Reference (cm-2) (K) (cm-2) G358.93–0.03 MM1 Hot molecular core (5.902.5)1014 100.630.4 (1.250.11)1024 (4.722.0)10-10 This work G10.47+0.03 Hot molecular core (6.600.1)1015 201.23.3 1.301023 5.0710-8 Manna & Pal (2022a) Sgr B2(OH) Hot molecular core 2.01015 15 5.01023 4.010-11 Cummins et al. (1986) Sgr B2(N) Hot molecular core 2.31014 500 3.01024 7.610-11 Nummelin et al. (2000) Sgr B2(M) Hot molecular core 3.01013 68 2.01024 1.510-11 Nummelin et al. (2000) NGC 253 Sculptor Galaxy 1.21013 67 6.51022 2.010-10 Martín et al. (2006) IRAS 20126+4104 High-mass protostar 3.31015 210 2.71024 1.210-9 Palau et al. (2017) IRAS 16293–2422 B Low-mass protostar 7.01013 300 1.21025 2.010-10 Coutens et al. (2018) NGC 1333 IRAS2A Low-mass protostar 2.51014 130 5.01024 5.010-11 Coutens et al. (2018) NGC 1333 IRAS4A2 Low-mass protostar 8.51014 150 5.01024 1.710-10 Belloche et al. (2020) G+0.693 Giant molecular cloud 3.81013 6.3 1.351023 2.310-9 Zeng et al. (2018)
4.2 Possible formation and destruction pathways of \ceNH2CN
In the hot core and corino objects, the formation mechanism of \ceNH2CN was poorly understood. According to the KIDA (Wakelam et al., 2012) astrochemistry molecular reactions database, there are no gas-phase reactions that produce the abundance of \ceNH2CN. We found two gas-phase reactions of \ceNH2CN in the UMIST 2012 (McElroy et al., 2013) astrochemistry chemical network database that have the ability to synthesise \ceNH2CN. According to the UMIST 2012 database, the \ceNH2CN molecule was created via the neutral-neutral reaction between NH3 and CN (CN + NH NH2CN + H) and electron recombination of NH2CNH+ (NH2CNH+ + e NH2CN + H). Earlier, Coutens et al. (2018) also proposed another pathway for the formation of \ceNH2CN via the neutral-neutral reaction between \ceNH2 and CN (NH2 + CN NH2CN). Earlier, Manna & Pal (2022a) claimed the neutral-neutral reaction between \ceNH3 and CN is responsible for the formation of \ceNH2CN towards the hot molecular core G10.47+0.03. The electron recombination of NH2CNH+ was assumed to create \ceNH2CN only in 5% of cases (Belloche et al., 2017). Earlier, Coutens et al. (2018) claimed the neutral-neutral reaction between \ceNH2 and CN is the most effective pathway to produce \ceNH2CN on the grain surface of hot cores and corinos. Recently, Zhang et al. (2023) also claimed the neutral-neutral reaction between \ceNH2 and HNC is responsible for the formation of \ceNH2CN towards the hot corinos and hot molecular cores. Similarly, \ceNH2CN will be destroyed via photochemical reaction (NH2CN + h NH2 + CN), cosmic ray-induced photoreaction (NH2CN + CRPHOT NH2 + CN), and ion-neutral reaction (H3+ + NH2CN NH2CNH+ + H2) (McElroy et al., 2013). Recently, Zhang et al. (2023) also presented more destruction pathways of \ceNH2CN in Table 2 in the context of hot corinos and hot molecular cores.
4.3 Previous chemical modelling of \ceNH2CN in the hot molecular cores
To understand the formation mechanisms and abundance of \ceNH2CN towards hot molecular cores and hot corinos, Coutens et al. (2018) used the three-phase (gas + dust + ice) warm-up chemical model using the chemical kinetics code MAGICKAL (Garrod, 2013). The chemical modelling of Coutens et al. (2018) is similar to the three-phase warm-up chemical model of Garrod (2013) which was applied towards the hot molecular cores. During the chemical modelling, Coutens et al. (2018) used both low-density (1.6107 cm-3) and high-density (6.01010 cm-3) conditions. The high-density (6.01010 cm-3) model is reasonable towards the hot corinos objects (IRAS 16293–2422, NGC 1333 IRAS2A, etc.) because the gas density of the hot corinos varies between 109 and 1010 cm-3 (Coutens et al., 2018). The low-density (1.6107 cm-3) model is reasonable towards the hot molecular core objects (G10.47+0.03, G31.41+0.31, Sgr B2, Orion KL, etc.) because the gas density of the hot molecular core varies between 106 to 108 cm-3 (van Dishoeck & Blake, 1998; Garrod, 2013). During the chemical modelling of \ceNH2CN in low-density conditions, Coutens et al. (2018) used the neutral-neutral reaction between \ceNH2 and CN (\ceNH2 + CN \ceNH2CN) in the grain/ice chemical network to estimate the abundance of \ceNH2CN. During the chemical modelling of \ceNH2CN in low-density conditions, Coutens et al. (2018) considered an isothermal collapse phase followed by a static warm-up phase. In the first phase (the free-fall collapse stage), the gas density rapidly increased from 1.1103 to 1.6107 cm-3, while the dust temperature decreased from 16 K to 8 K. In the second phase (the warm-up stage), the density of gas was fixed at 1.6107 cm-3 and the temperature of the dust fluctuated between 8 K and 400 K. After the modelling, Coutens et al. (2018) estimated that the abundance of \ceNH2CN was 3.710-10 in the case of the low-density model in the warm-up stage.
To ensure the chemical modelling of Coutens et al. (2018), we also examined another three-phase warm-up chemical modelling of \ceNH2CN created by Zhang et al. (2023). For chemical modelling of \ceNH2CN towards the hot molecular cores, Zhang et al. (2023) used the NAUTILUS chemical code, which includes the gas, dust surface, and icy mantle. In the first phase (the freefall collapse stage), Zhang et al. (2023) assumed the hot molecular cores undergoes the isothermal collapse phase at 10 K, and gas density rapidly increases from = 3103 cm-3 to 1.6107 cm-3. The first phase begins at = 2 mag and progresses to more than 200 mag. In the second phase (the warm-up phase), the gas density is fixed at 1.6107 cm-3, and the temperature increases from 10 K to 200 K over the time scale 4105 yr. During the chemical modelling of \ceNH2CN, Zhang et al. (2023) used the reaction \ceNH2 + CN\ceNH2CN in the grain surface to estimate the abundance of \ceNH2CN. In the warm-up phase, Zhang et al. (2023) observed that the abundance of \ceNH2CN varies between 2.010-10 to 6.010-9.
4.4 Comparision between observed and modelled abundances of \ceNH2CN
To understand the formation pathways of \ceNH2CN towards G358.93–0.03 MM1, we compare our estimated observed abundance of \ceNH2CN with the modelled abundance of \ceNH2CN estimated by the low-density model of Coutens et al. (2018) and Zhang et al. (2023). This comparison is physically reasonable because the temperature and gas density of G358.93–0.03 MM1 are 150 K (Chen et al., 2020) and 2107 cm-3 (Stecklum et al., 2021), respectively. Earlier, Coutens et al. (2018) showed that the modelled abundance of \ceNH2CN is 3.710-10. Similarly, Zhang et al. (2023) observed the abundance of \ceNH2CN varies between 2.010-10 to 6.010-9. We find that our estimated abundance of \ceNH2CN towards G358.93–0.03 MM1 is (4.722.0)10-10, which is very close to the range of the modelled abundance of \ceNH2CN in Coutens et al. (2018) and Zhang et al. (2023). This comparison indicates that \ceNH2CN molecule is created in the grain surfaces of G358.93–0.03 MM1 via the neutral-neutral reaction between \ceNH2 and CN (\ceNH2 + CN \ceNH2CN).
4.5 Searching of urea (\ceNH2C(O)NH2) towards the G358.93–0.03 MM1
After the detection of the possible urea (\ceNH2C(O)NH2) precursor molecule \ceNH2CN from the G358.93–0.03 MM1, we also attempted to search for the rotational emission lines of \ceNH2C(O)NH2 from the sub-millimeter spectra of the G358.93–0.03 MM1. After careful spectral analysis, we did not detect the emission lines of \ceNH2C(O)NH2 within the limits of our LTE spectral modelling. We estimated the upper limit column density of \ceNH2C(O)NH2 was (1.20.8)1013 cm-2. Furthermore, we calculated the upper limit of the \ceNH2C(O)NH2 and \ceNH2CN column density ratios towards the G358.93–0.03 MM1 as 0.0200.016. For searching the emission lines of \ceNH2C(O)NH2, we used the Cologne Database for Molecular Spectroscopy (CDMS) spectroscopic molecular database (Müller et al., 2005). Our detection of the amide-like molecule \ceNH2CN towards the hot molecular core G358.93–0.03 MM1 using the ALMA gives more confidence that the G358.93–0.03 MM1 has the ability to create other amide-related molecules. We propose a spectral line survey of formamide (\ceNH2CHO), acetamide (\ceCH3C(O)NH2), and N-methyl formamide (\ceCH3NHCHO) with better spectral resolution and a higher integration time to solve the prebiotic chemistry of the amide-related molecules in the ISM.
5 Conclusion
We analysed the ALMA band 6 data of the high-mass star-formation region G358.93–0.03, and we extracted the molecular lines from the hot molecular core G358.93–0.03 MM1. The main conclusions of this work are as follows:
1. We identified a total of seven rotational emission lines of \ceNH2CN towards the hot molecular core G358.93–0.03 MM1 using the ALMA band 6 observations.
2. The estimated column density of \ceNH2CN towards the G358.93–0.03 MM1 was (5.92.5)1014 cm-2 with a rotational temperature of 100.630.4 K. The derived abundance of \ceNH2CN towards the G358.93–0.03 MM1 with respect to \ceH2 was (4.722.0)10-10.
3. We compared the estimated abundance of \ceNH2CN towards G358.93–0.03 MM1 with other sources. We observe the abundance of \ceNH2CN towards G358.93–0.03 MM1 is nearly similar to that of the sculptor galaxy NGC 253 and the low-mass protostars IRAS 16293–2422 B and NGC 1333 IRAS4A2. That means the formation route(s) of \ceNH2CN towards G358.93–0.03 MM1 are similar to NGC 253, IRAS 16293–2422 B, and NGC 1333 IRAS4A2.
4. We compared our estimated abundance of \ceNH2CN with the modelled abundances of \ceNH2CN, which was estimated by Coutens et al. (2018) and Zhang et al. (2023). After the comparison, we found that the observed abundance of \ceNH2CN is nearly similar to the modelled abundances of \ceNH2CN. This comparison indicates that the \ceNH2CN molecule was created in the grain surfaces of G358.93–0.03 MM1 via the neutral-neutral reaction between \ceNH2 and CN (\ceNH2 + CN \ceNH2CN).
5. After the identification of the \ceNH2CN towards the G358.93–0.03 MM1, we also looked for the emission lines of
urea (\ceNH2C(O)NH2). After the spectral analysis, we did not detect the emission lines of \ceNH2C(O)NH2 within the limits of LTE analysis. We estimated the upper limit column density of \ceNH2C(O)NH2 as (1.20.8)1013 cm-2. We also derive the upper limit of the \ceNH2C(O)NH2 and \ceNH2CN column density ratios towards the G358.93–0.03 MM1 as 0.0200.016. The unsuccessful detection of \ceNH2C(O)NH2 using the ALMA indicated that the emission lines of \ceNH2C(O)NH2 may be below the confusion limit towards the G358.93–0.03 MM1.
Acknowledgments
We thank the anonymous referee for the helpful comments that improved the manuscript. A.M. acknowledges the Swami Vivekananda Merit-cum-Means Scholarship (SVMCM) for financial support for this research. This paper makes use of the following ALMA data: ADS /JAO.ALMA#2019.1.00768.S. ALMA is a partnership of ESO (representing its member states), NSF (USA), and NINS (Japan), together with NRC (Canada), MOST and ASIAA (Taiwan), and KASI (Republic of Korea), in co-operation with the Republic of Chile. The Joint ALMA Observatory is operated by ESO, AUI/NRAO, and NAOJ.
Data availability
The data that support the plots within this paper and other findings of this study are available from the corresponding author upon reasonable request. The raw ALMA data are publicly available at https://almascience.nao.ac.jp/asax/ (project id: 2019.1.00768.S).
Funding
No funds or grants were received during the preparation of this manuscript.
Conflicts of interest
The authors declare no conflict of interest.
Author Contributions
S.P. conceptualize the project. A.M. analysed the ALMA data and identify the emission lines of cyanamide (\ceNH2CN) from G358.93–0.03 MM1. A.M. analyses the rotational diagram to derive the column density and rotational temperature of \ceNH2CN. A.M. and S.P. wrote the main manuscript text. All authors reviewed the manuscript.
References
- Aladro et al. (2011) Aladro, R., Martín, S., Martín-Pintado, J. et al. 2011, A&A, 535, A84
- Bayandina et al. (2022) Bayandina, O.S., Brogan, C.L., Burns, R.A., et al. 2022, AJ, 163(2), p.83
- Belloche et al. (2017) Belloche, A., Meshcheryakov, A. A., Garrod, R. T., et al. 2017, A&A, 601, A49
- Belloche et al. (2020) Belloche A. et al., 2020, A&A , 635, A198
- Brogan et al. (2019) Brogan, C. L., Hunter, T. R., Towner, A. P. M., et al. 2019, ApJL, 881, L39
- Brown et al. (1985) Brown, R. D., Godfrey, P. D., Kleibömer, B., 1985, Journal of Molecular Spectroscopy, 2, 257-273
- Chen et al. (2020) Chen, X., Sobolev, A. M., Ren, Z.-Y., et al. 2020, NatAs, 4, 1170
- Coutens et al. (2018) Coutens, A., Willis, E. R., Garrod, R. T., et al. 2018, A&A, 612, A107
- Comrie et al. (2021) Comrie, A., Wang, K.-S., Ford, P., et al. 2021, CARTA: The Cube Analysis and Rendering Tool for Astronomy, 1.3.0, Zenodo
- Cummins et al. (1986) Cummins S. E., Linke R. A., Thaddeus P., 1986, ApJS , 60, 819
- Duvernay et al. (2005) Duvernay, F., Chiavassa, T., Borget, F., & Aycard, J.-P. 2005, J. Phys. Chem. A, 109, 603
- Garrod & Herbst (2006) Garrod, R. T., & Herbst, E. 2006, A&A, 457, 927
- Garrod (2013) Garrod, R. T. 2013, ApJ, 765, 60
- Goldsmith & Langer (1999) Goldsmith, P. F., & Langer, W. D. 1999, ApJ, 517, 209
- Gorai et al. (2021) Gorai, P., Das, A., Shimonishi, T., et al. 2021, ApJ, 907, 108
- Jiménez-Serra et al. (2020) Jiménez-Serra, I., Martín-Pintado, J., Rivilla, V. M., Rodríguez-Almeida, L., Alonso, A. E. R., Zeng, S., Cocinero, E. J., Martín, S., Requena-Torres, M., Martín-Domenech, R., Testi, L.,2020, Astrobiology, 20, 9, 1048-1066
- Kilpatrick (1947) Kilpatrick, M. L. 1947, J. Am. Chem. Soc., 69, 40
- Ligterink et al. (2020) Ligterink, N. F. W., El-Abd, S. J., Brogan, C. L., et al. 2020, ApJ, 901, 37
- Manna & Pal (2022a) Manna, A. & Pal, S., 2022, Journal of Astrophysics and Astronomy, 43, 83
- Manna & Pal (2022b) Manna, A. & Pal, S., 2022, Life Sciences in Space Research, 34, 9
- Martín et al. (2006) Martín S., Mauersberger R., Martín-Pintado J., Henkel C., García-Burillo S., 2006, ApJS , 164, 450
- Müller et al. (2005) Müller, H. S. P., SchlMder, F., Stutzki, J. & Winnewisser, G. 2005, Journal of Molecular Structure, 742, 215–227
- McElroy et al. (2013) McElroy, D., Walsh, C., Markwick, A. J., Cordiner, M. A., Smith, K., Millar, T. J., 2013, A&A, 550, A36
- McMullin et al. (2007) McMullin, J. P., Waters, B., Schiebel, D., et al. 2007, San Francisco, CA: ASP, 127
- Motogi et al. (2019) Motogi, K., Hirota, T., Machida, M. N., et al. 2019, ApJL, 877, L25
- Mangum (2020) Mangum, J., 2020, How to Calculate Bandwidth Smearing in Radio Synthesis Measurements, NRAO
- Nummelin et al. (2000) Nummelin A., Bergman P ., Hjalmarson Å., Friberg P ., Irvine W. M., Millar T. J., Ohishi M., Saito S., 2000, ApJS , 128, 213
- Cox & Pilachowski (2000) Cox, A. N., & Pilachowski, C. A. 2000, Physics Today, 53, 77
- Pickett et al. (1998) Pickett, H. M., Poynter, R. L., Cohen, E. A., et al. 1998, Journal of Quantitative Spectroscopy and Radiative Transfer, 60, 883
- Palau et al. (2017) Palau, A., Walsh, C., Sánchez-Monge, Á., Girart, J. M., Cesaroni, R., Jiménez-Serra, I., Fuente, A., Zapata, L. A., Neri, R., 2017, MNRAS, 467, 2723
- Perley & Butler (2017) Perley, R. A., Butler, B. J. 2017, ApJ, 230, 1538
- Reid et al. (2014) Reid, M. J., Menten, K. M., Brunthaler, A., et al. 2014, ApJ, 783, 130
- Shimonishi et al. (2021) Shimonishi, T., Izumi, N., Furuya, K., & Yasui, C., 2021, ApJ, 2, 206
- Sharma (2021) Sharma, M. K., Astrophysics, 2021, 64,71-80
- Stecklum et al. (2021) Stecklum, B., Wolf, V., Linz, H., et al., 2021. A&A, 646, p.A161
- Turner et al. (1975) Turner, B. E., Liszt, H. S., Kaifu, N., & Kisliakov, A. G. 1975, ApJ, 201, L149
- van Dishoeck & Blake (1998) van Dishoeck E. F., & Blake G. A. 1998, Annu Rev Astron Astrophys, 36, 317
- Vastel et al. (2015) Vastel, C., Bottinelli, S., Caux, E., et al. 2015, Proceedings of the Annual meeting of the French Society of Astronomy and Astrophysics, 313-316
- Williams & Ibrahim (1981) Williams, A., & Ibrahim, I. T. 1981, Chem. Rev., 81, 589
- White et al. (2003) White, G. J., Araki, M., Greaves, J. S., Ohishi, M., & Higginbottom, N. S. 2003, A&A, 407, 589
- Whittet (1992) Whittet, D. C. B. 1992, Journal of the British Astronomical Association, 102, 230
- Wakelam et al. (2012) Wakelam V., et al., 2012, The Astrophysical Journal Supplement, 199, 21
- Zeng et al. (2018) Zeng S. et al., 2018, MNRAS , 478, 2962
- Zhang et al. (2023) Zhang, X., et al., 2023, MNRAS, 521, 1578