utf8
RAAD: LIGHT-1 CubeSat’s Payload for the Detection of Terrestrial Gamma-Ray Flashes
Abstract
The Rapid Acquisition Atmospheric Detector (RAAD), onboard the LIGHT-1 3U CubeSat, detects photons between hard X-rays and soft gamma-rays, in order to identify and characterize Terrestrial Gamma Ray Flashes (TGFs). Three detector configurations are tested, making use of Cerium Bromide and Lanthanum BromoChloride scintillating crystals coupled to photomultiplier tubes or Multi-Pixel Photon Counters, in order to identify the optimal combination for TGF detection. High timing resolution, a short trigger window, and the short decay time of its electronics allow RAAD to perform accurate measurements of prompt, transient events. Here we describe the overview of the detection concept, the development of the front-end acquisition electronics, as well as the ground testing and simulation the payload underwent prior to its launch on December 21st, 2021. We further present an analysis of the detector’s in-orbit system behavior and some preliminary results.
1 Introduction
Terrestrial Gamma Ray Flashes (TGFs) are upward directed, highly luminous bursts of photons, with durations of less than 1 ms and energies from 10 keV reaching up to several tens of MeV[1, 2, 3, 4, 5, 6]. They are produced in the high electric fields naturally occurring within thunderstorms, at altitudes of 10 - 15 km, when electrons are accelerated to relativistic speeds and produce photons through bremsstrahlung [7, 8, 9, 5]. It is estimated that a sum of more than 400,000 TGFs are produced annually [1], primarily concentrated around the equator [3].
TGFs were first discovered by Fishman et al. using data obtained from the Burst and Transient Source Experiment (BATSE) on NASA’s Compton Gamma Ray Observatory (CGRO) in 1994 [3], and were found to be associated with lightning activity. BATSE was built to detect gamma-rays from celestial sources and thus was sensitive to energies of 20 keV. However, BATSE’s sampling rate of ms was longer than the typical sub-millisecond duration of a TGF, resulting in very few detections [3, 5].
NASA’s Reuven Ramaty High Energy Solar Spectroscopic Imager (RHESSI), originally built for studying solar flares, was able to detect TGFs as well. However, RHESSI’s Germanium detectors were sensitive to photons with energies up to only 18 MeV. [10]. Regardless, RHESSI’s detections proved that TGFs can be detected by satellites operating il LEO (Low Earth Orbit) [11, 12]. The “Astro-Rivelatore Gamma a Immagini Leggero” (AGILE) and the Gamma-Ray Burst Monitor (GBM) onboard NASA’s Fermi Gamma-ray Space Telescope were able to detect the full energy spectrum of TGFs [13, 4, 14, 15, 16, 17, 18]. As the aforementioned missions were optimized to detect fainter phenomena of longer duration, their detectors suffered from pileup and saturation when observing high luminosity and energetic TGFs.
Thus far, TGFs have been primarily studied as by-products of missions designed to detect other phenomena, thus creating an opportunity for specialized missions. One such mission is European Space Agency’s Atmosphere-Space Interactions Monitor (ASIM), installed in 2018 on the ISS, which managed to confirm the hypothesized TGF models originating from previous studies by combining observations between keV - MeV with optical data [19, 20].
Even though TGFs’ bright and brief nature made them hard to characterise with the non-specialised equipment of the initial missions, it also made their detection possible using detectors small enough to fit within CubeSats (i.e., pico-satellites developed at reduced costs). Thus we proposed the Rapid Acquisition Atmospheric Detector (RAAD), an instrument specifically designed for TGF detection, as the payload of the LIGHT-1 CubeSat mission. Table 1 shows the performance characteristics of LIGHT-1 compared to previous missions. The RAAD acronym was also chosen for its similarity to the Arabic word "Ra’ad" ( \<رعد> ) which means thunder.
In this paper, we provide a detailed description of the payload electronics, ground tests and simulations, as well as some preliminary in-orbit data. A prototype of RAAD was built and tested at NYUAD, providing proof of concept. Details on the prototype can be found in [21]. Details on the CubeSat’s bus and subsystems can be found in [22].
| Mission | Trigger Window (ms) | Resolution (s) | Dead Time Per Event (s) | Sensitivity (MeV) |
|---|---|---|---|---|
| BATSE | 64 | 2 | 6 | 0.02 2 |
| RHESSI | None | 0.95 | 8 | 0.003 17 |
| AGILE | 0.293 | 1 | 65 | 0.3 100 |
| FERMI | 16 | 2 | 2.6 | 0.001 40 |
| LIGHT-1 | 0.5 | 0.5 | 0.04 | 0.02 3 |
2 The LIGHT-1 Mission
2.1 Mission Concept
Absorption by the atmosphere can suppress TGFs, therefore, solely measuring the gamma-ray emission would not provide complete information about their characteristics [25]. As a result, a combined measurement is, in general, preferred over a single detection channel. Combining atmospheric gamma-ray detection with X and gamma-ray surveys or lightning radar measurements could provide insightful information on the production mechanisms of TGFs [26, 27]. Under this premise, a LEO operated gamma-ray detector, together with correlated ground and space observations and measurements, would be the ideal probe to pursue a TGF science program.
LIGHT-1 is a 3U CubeSat built primarily to study TGFs. Yet, LIGHT-1’s mission extends to measuring orbital radiation and space-qualifying different technologies for the detection of prompt, highly energetic, and intense emissions typical of transient events. For size reference, one U of a CubeSat consists of a cube of about . A little less than two units of LIGHT-1 is dedicated to RAAD, while the rest is dedicated to the subsystems of the CubeSat (reaction wheels, onboard computer, attitude control system, electrical power system, etc.). A review on operating gamma-ray detectors onboard CubeSats is available in [28].
RAAD utilizes three types of detectors, by coupling two types of photosensors to two types of scintillating crystals. In fact, the LIGHT-1 mission is also meant to conduct a direct comparison between different detector configurations to find which is best suited for TGF detection. LIGHT-1 is the first mission to conduct a direct comparison between Cerium Bromide and Lanthanum BromoChloride scintillating crystals, coupled to either photomultiplier tubes or silicon photomultipliers.
2.2 Mission Schedule
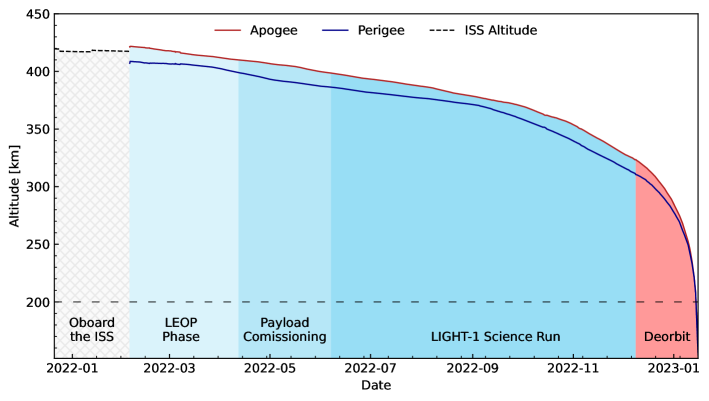
The LIGHT-1 CubeSat was launched on the 21st of December, 2021, onboard a Space-X Falcon9/Dragon from the Kennedy Space Center, directed at the International Space Station (ISS). The handling of LIGHT-1 for the launch and subsequent deployment was taken care by the Japan Aerospace Exploration Agency (JAXA). Once on the ISS, it was deployed via the Japanese Experiment Module (JEM) on the 3rd of February, 2022, in a 51.6°orbit at an initial altitude of .
Figure 1 shows the operation regimes of the LIGHT-1 mission as a function of time. During the Launch and Early Orbit Phase (LEOP), the satellite bus developed by NanoAvionics was fully tested and optimized for the science program operations. The payload was powered on for the completion of one full orbit on the 16th of March, 2022 to check its vital parameters. The commissioning of the payload began on the 6th of April, 2022. On the 25th of May, 2022 LIGHT-1 entered the Science Run mode. Communications with LIGHT-1 stopped on January 18th, 2023, marking the start of the de-orbiting phase and the end of the mission.
3 Scientific Payload Specifications
| Parameter | Design value | Actual Value |
|---|---|---|
| Mass [kg] | 2.05 0.07 | 1.981 0.001 |
| Average Power Consumption [W] | 5.9 W | 4.8 W |
| Data Downlink [MB/24 h] | 40 | 40 |
| Duty Cycle [%] | 50 | 50 |
| Life Time [months] | 6 | 10 |
| Temperature operative range [] | 0 45 | 10 40 |
RAAD is designed to resolve events hundreds of ns apart, measure the energy deposited, and assign a timestamp for comparison with TGF and lightning catalogs generated by other experiments.
3.1 Detector Structure
RAAD consists of two detectors, different in size, fitting 1 U and 0.7 U of the spacecraft, respectively. The detector structure is shown in Figure 2.
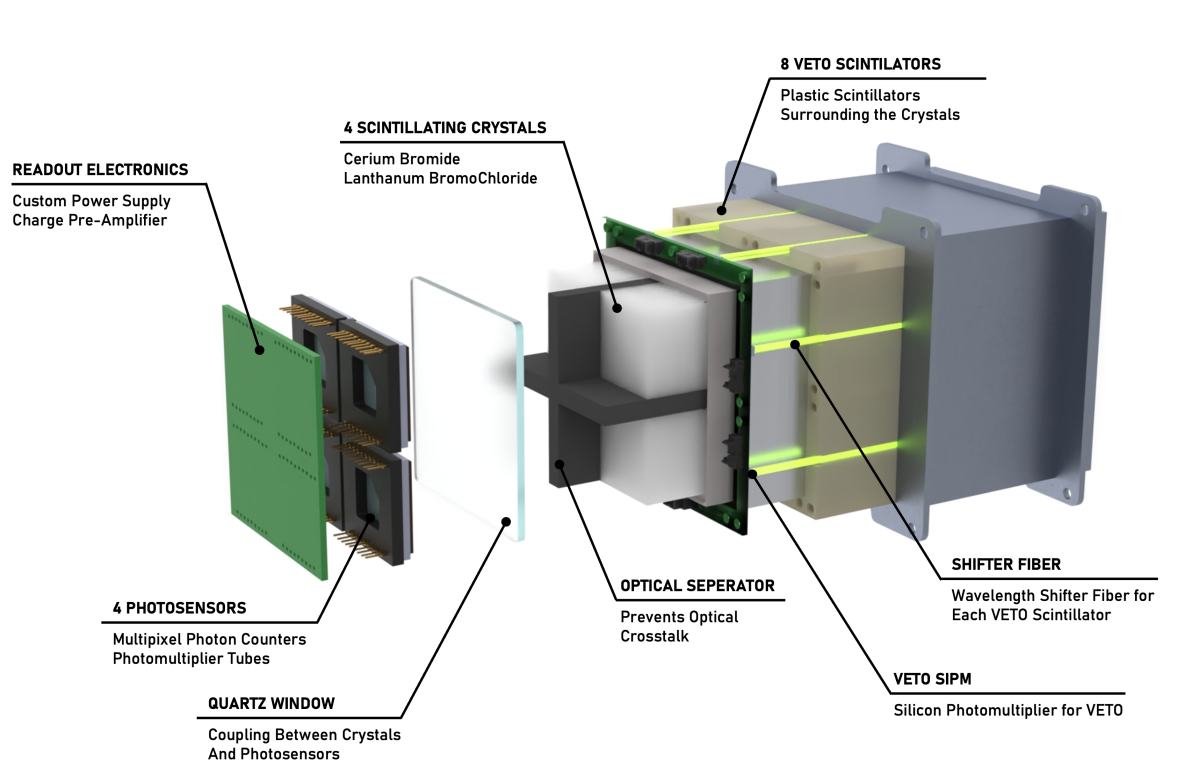
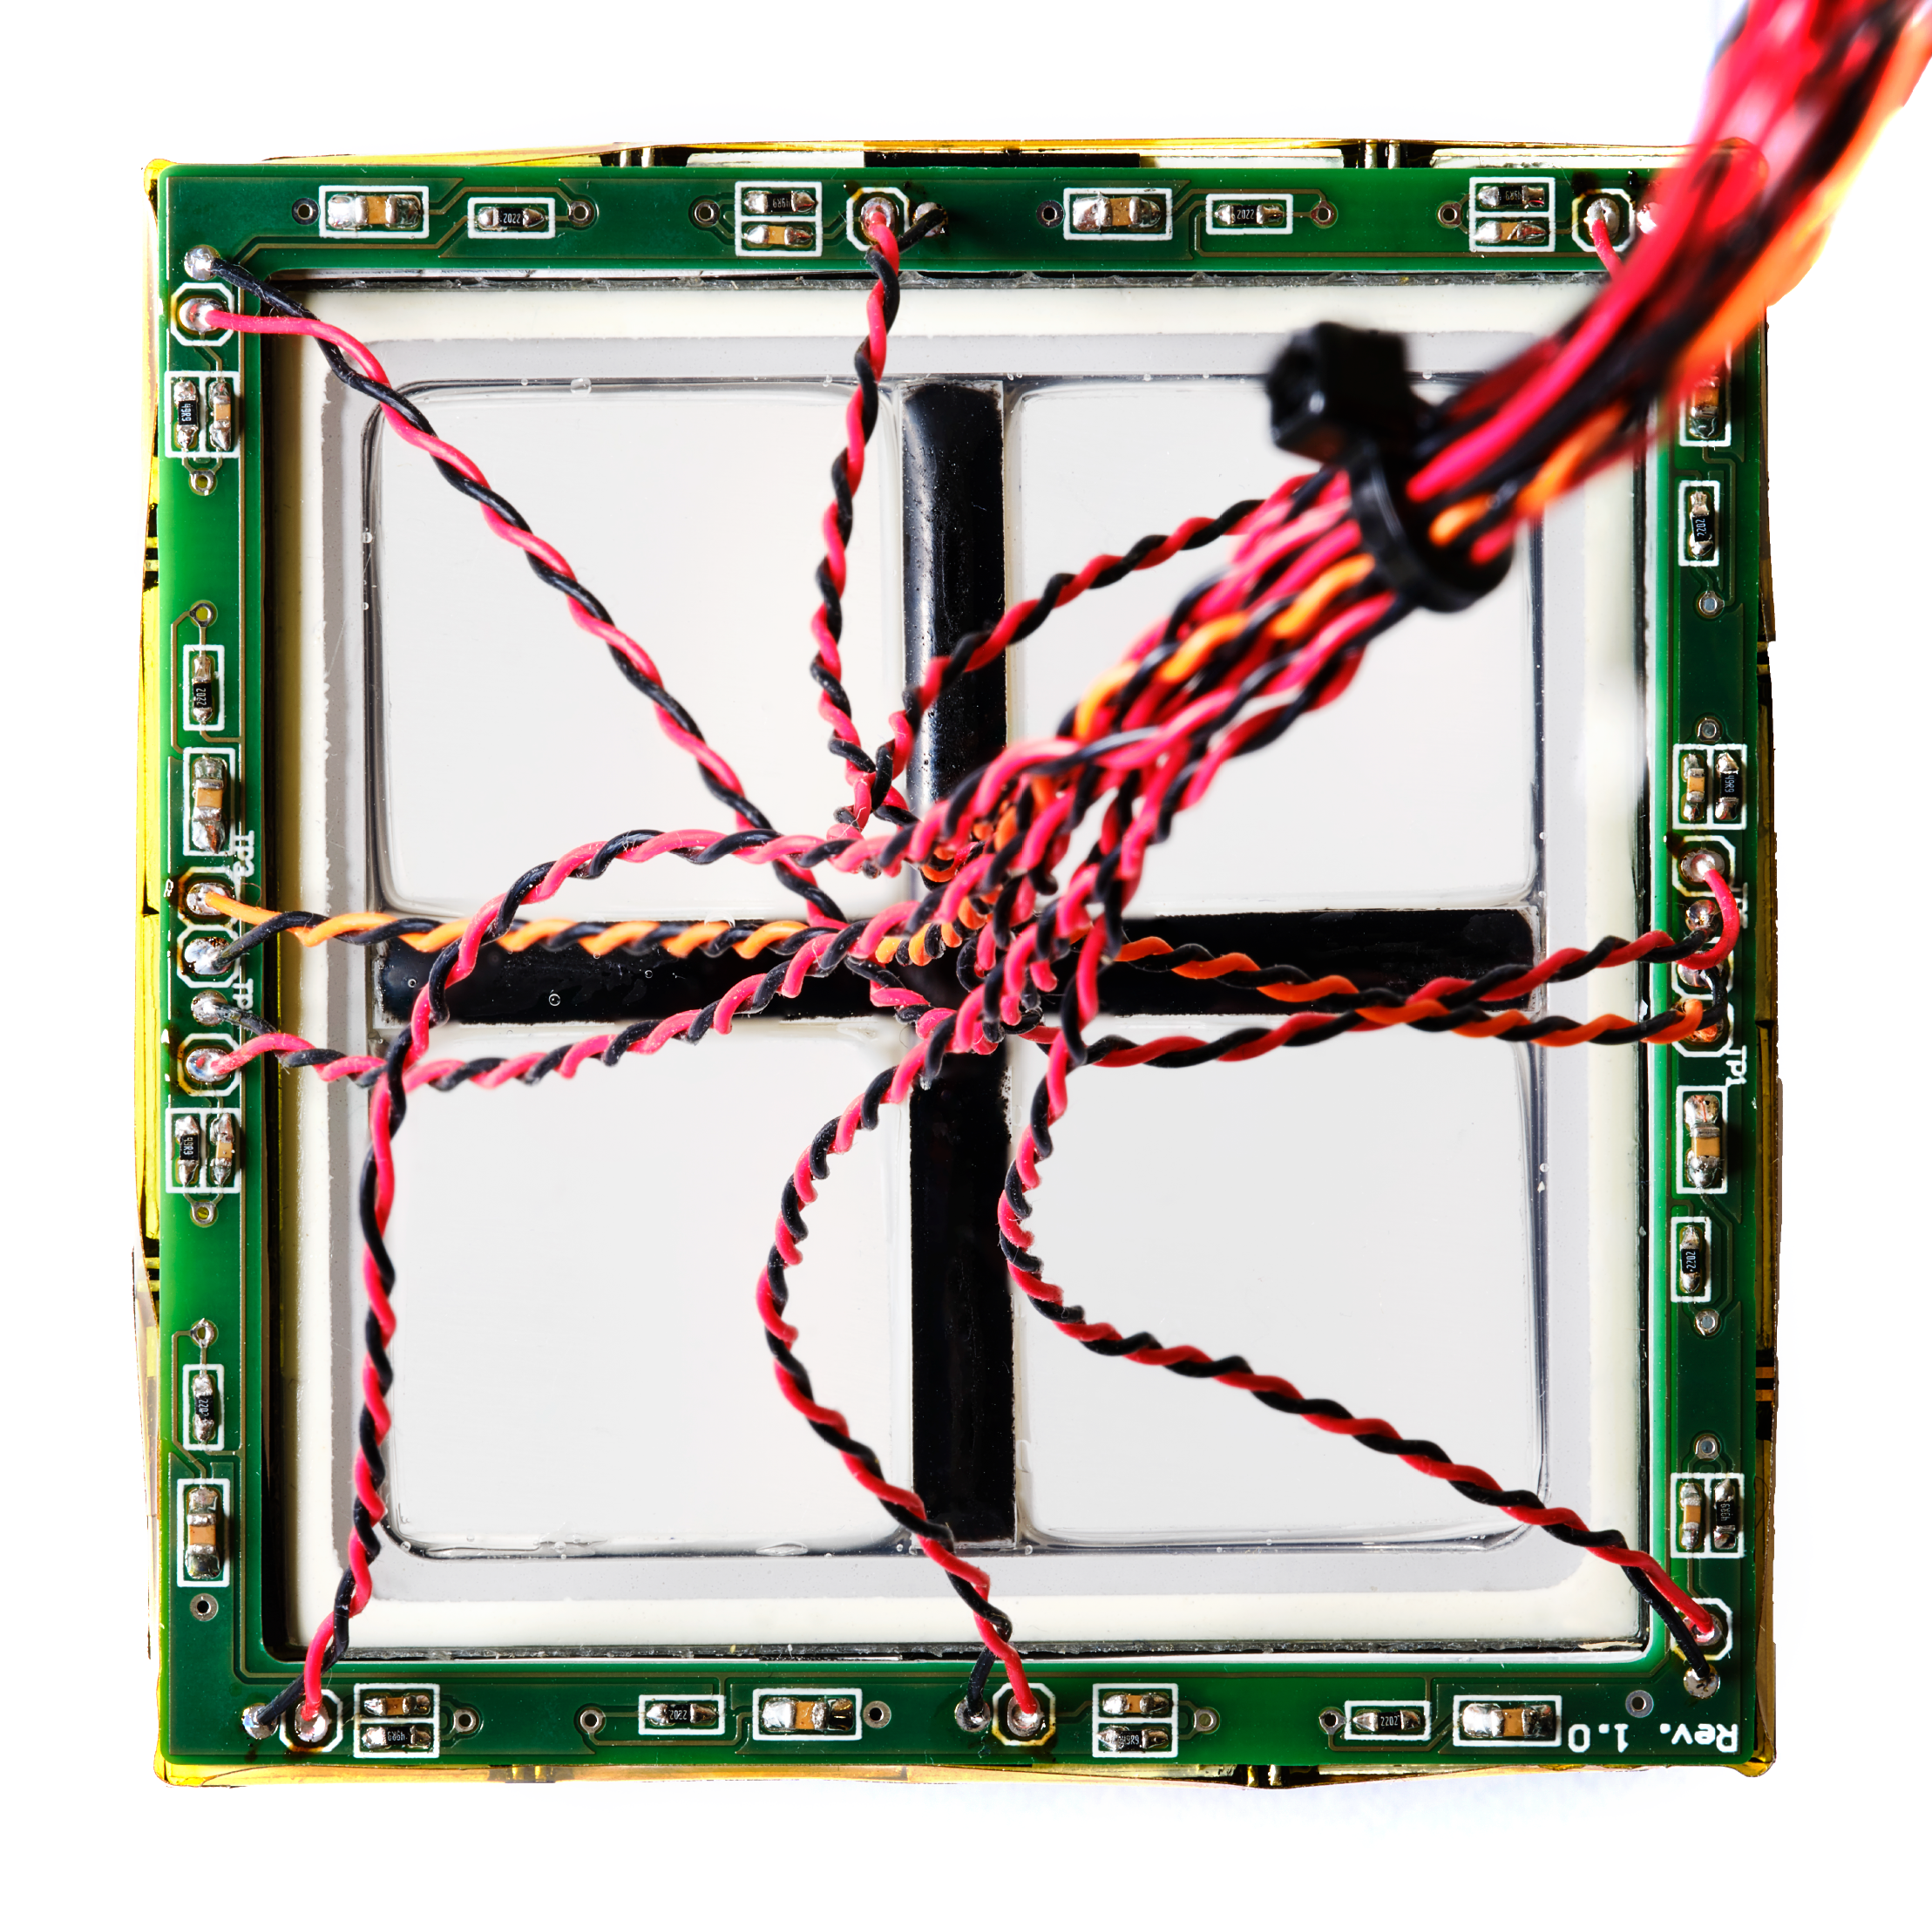
The smaller one, the MPPC payload, is equipped with four S13361-6050AE-04 Multi-Pixel Photon Counters (MPPCs) manufactured by Hamamatsu Photonics and coupled to a 4-channel Low Background Cerium Bromide (CeBr3(LB)) crystal array, manufactured by Scionix and shown in Figure 3. The larger detector, the PMT payload, is equipped with four R11265-200 photomultiplier tubes (by Hamamatsu Photonics) and coupled to one array of four scintillating crystals organized in one pair of CeBr3(LB) and one pair of Lanthanum BromoChloride (LBC), both manufactured by Scionix. We refer to each photosensor array coupled with the corresponding scintillating crystals as the detection target of RAAD. The differences between the two photosensors are shown in Table 3.
| Parameter | R11265-200 | S13361-6050AE-04 |
|---|---|---|
| Type of photosensor | PMT | MPPC |
| Dimensions () [] | ||
| Mass [g] | 24 | 2 |
| Max Sensitivity [nm] | 400 | 450 |
| Quantum Efficiency - Photon Detection Efficiency [%] | 43 | 40 |
| Operating Voltage [V] | 900 | 55 |
| Gain at working point | ||
| Dark Counting Rate at working point, 300 K [Hz] | < 1 | |
| Operating Temperature [K] | 240 - 320 | 250 - 330 |
The performances of the crystals at different energies, shown in Table 4, make them complementary. The intrinsic activity of LBC, while on one hand an obvious nuisance, on the other hand, may provide an embedded calibration tool. The high dark counting rate of the MPPC does not represent a problem when triggering at (see 4.2).
Each scintillating crystal unit is in dimensions, with the whole scintillating crystal arrays of in dimensions and and in mass, for the and LBC respectively.
The four scintillating crystals are separated by Polytetrafluoroethylene (PTFE) to avoid optical cross-talk. In order to prevent the effects of water vapor contamination during the assembling phase, the hygroscopic crystal array is housed in an airtight container. Five sides are covered with aluminum, while on the sixth side, a 2 mm thick layer of fused silica is used to optically connect the photosensor array to the crystals.
| Parameter | CeBr3(LB) | LBC |
|---|---|---|
| Density [] | 5.1 | 4.9 |
| Hygroscopic | Yes | Yes |
| Light Emission Peak [nm] | 370 | 380 |
| Energy Resolution at 122 keV [%] | 10 | 7 |
| Energy Resolution at 662 keV [%] | 4 | 3 |
| Decay Time [ns] | 20 | 35 |
| Intrinsic Activity [] | 1 |
The front-end electronics are directly coupled to the back of the photosensor array as seen in Figure 4.

A detailed study and characterization of the detection concept is reported in [21].
A VETO system surrounds the detection target on four sides. Its purpose is to partially identify and suppress the charged particle induced background. It consists of eight independent units, each composed of one 5 mm thick plastic scintillator tile with an embedded wavelength shifter fiber and read out at one edge by a SMD Silicon photomultiplier (SiPM) manufactured by AdvanSiD srl (ASD-NUV1C-P-40). The CAD model of the VETO system is shown in Figure 2.
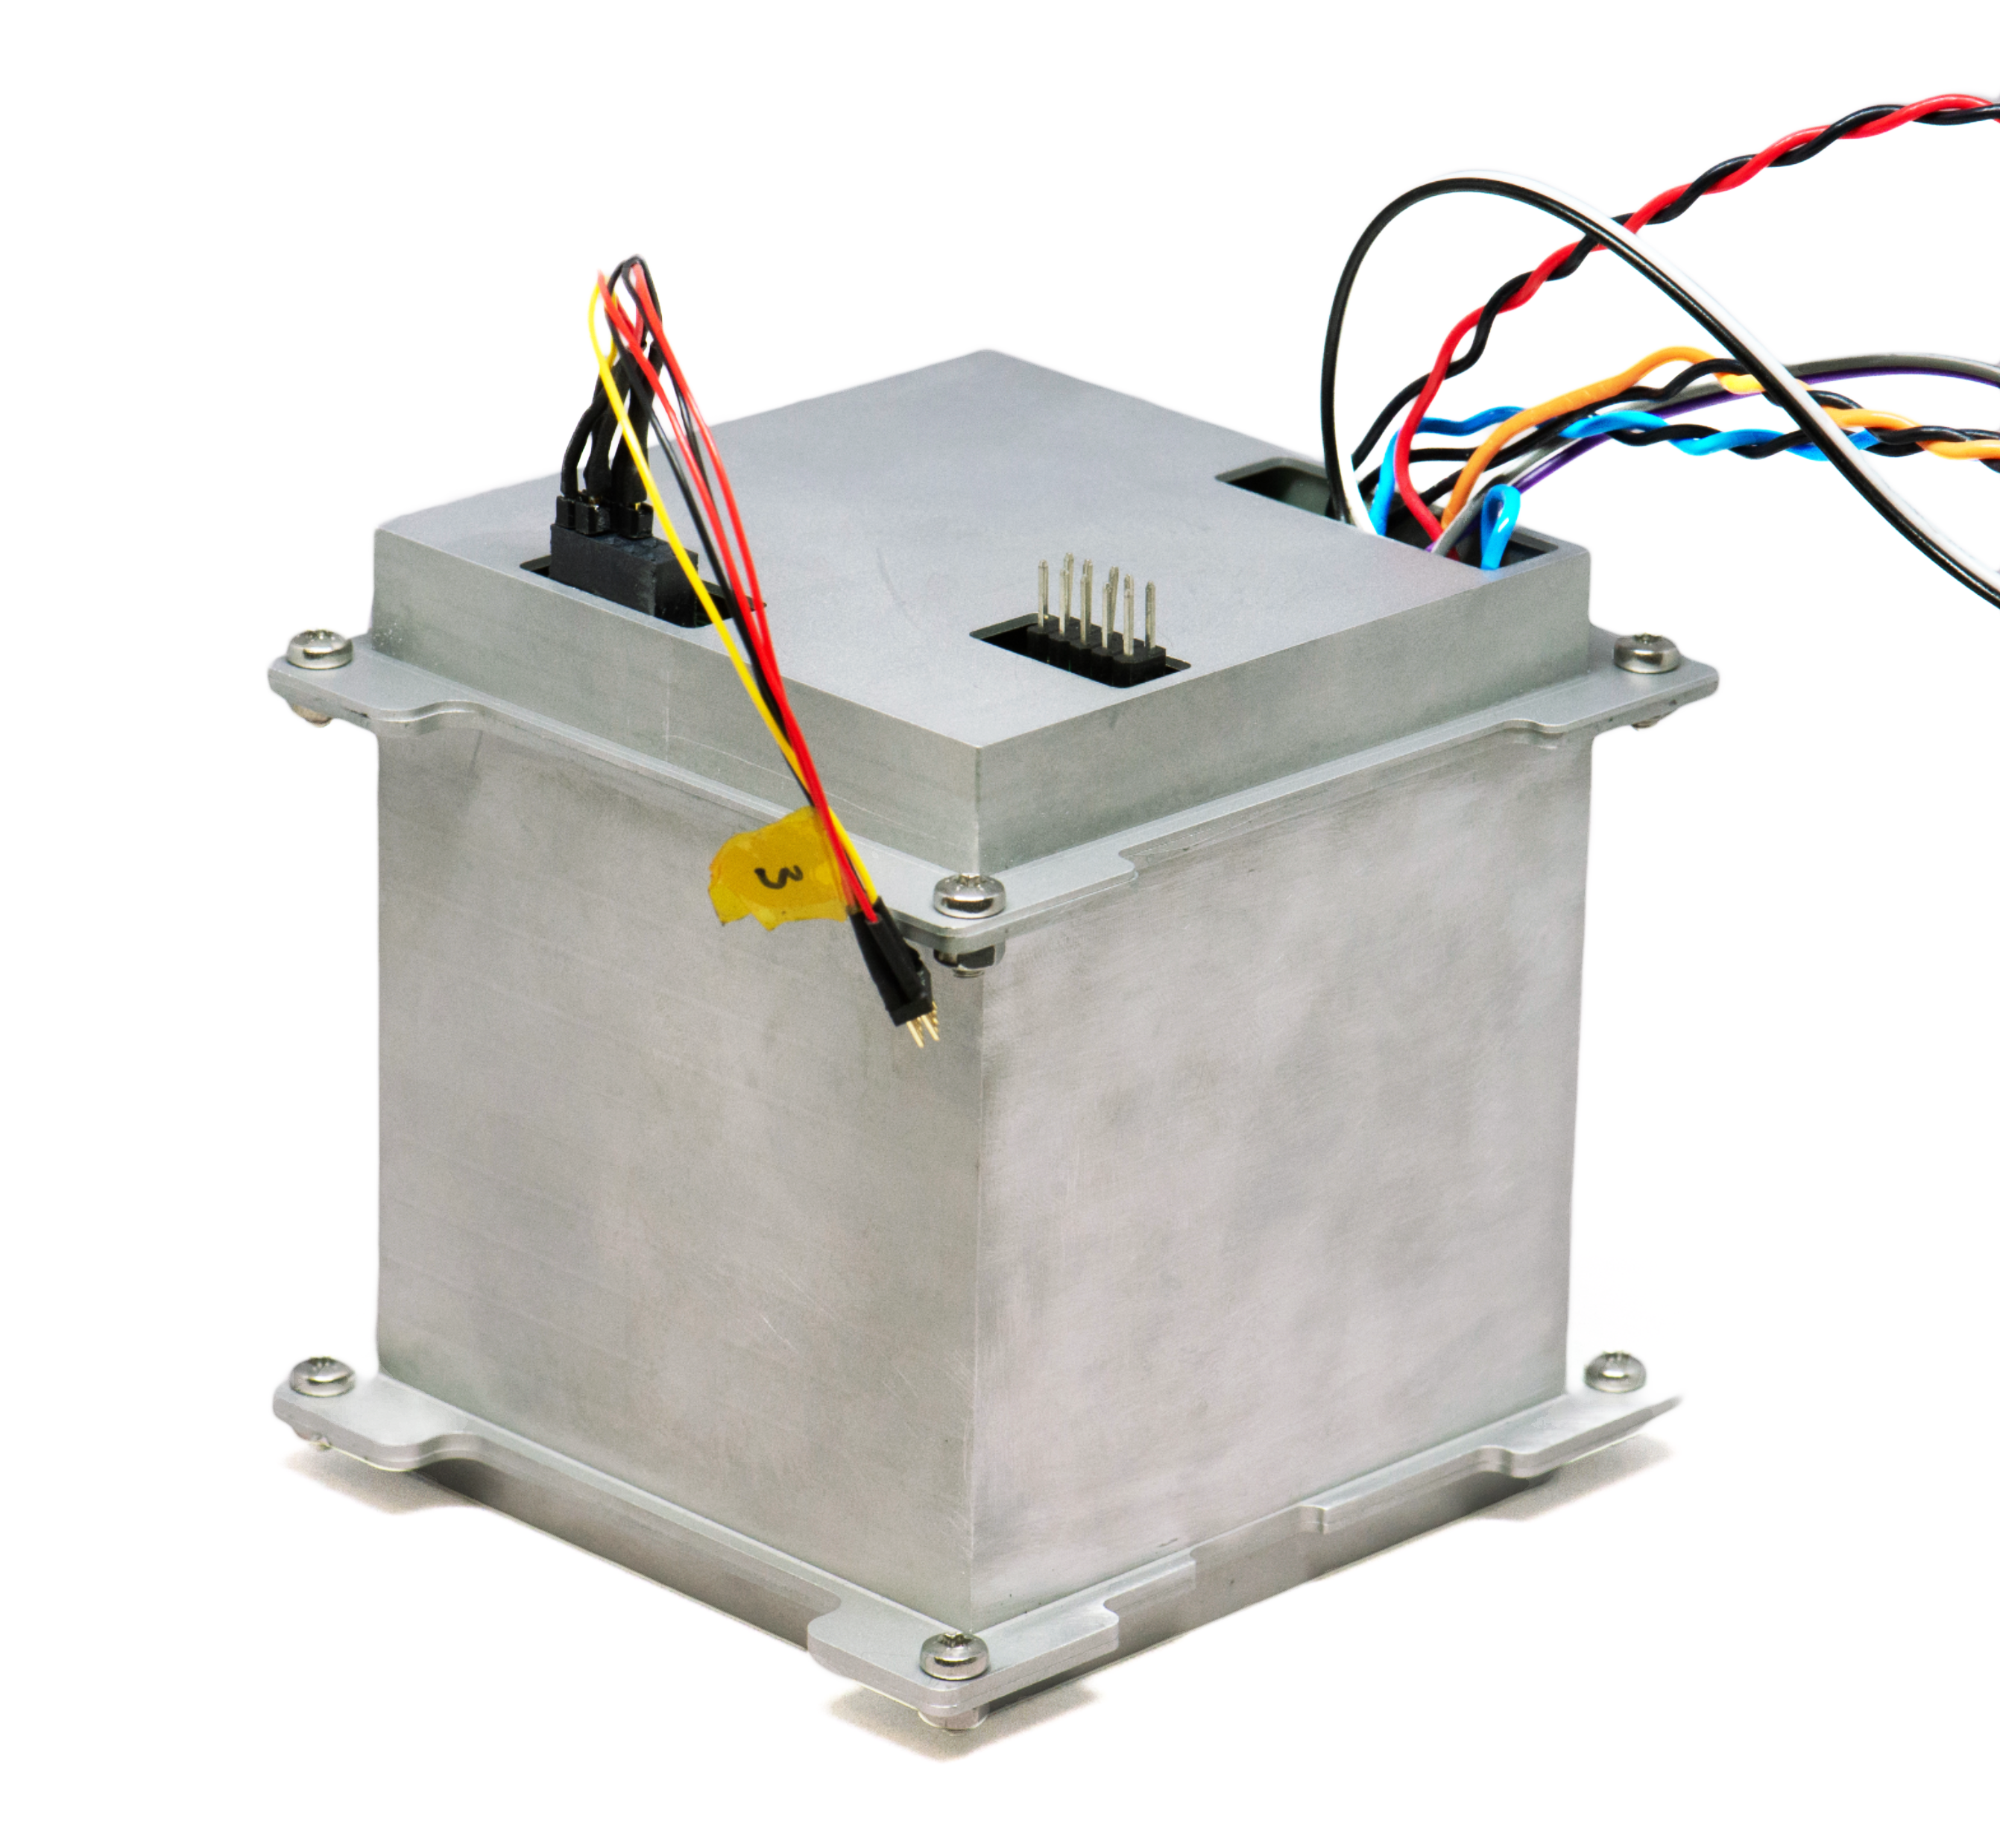
The detection target along with the photosensor array and related electronics are placed inside an aluminum enclosure designed to be mechanically coupled to the CubeSat spacecraft. The final assembly of the PMT payload is shown in Figure 5.
The effect of the aluminum walls has been evaluated by a Geant4 simulation, fully presented in Section 4.2, indicating a hardware detection threshold for gamma rays of about 20 keV.
An aerospace-grade silicon resin (Momentive RTV615) was used for filling the voids in the assembly in order to mitigate the effect of vibration on the structure and to provide effective electrical insulation for the high voltage () required to operate the payload. Overall, the multiple enclosing layers comply with the safety requirements of the mission, mitigating the risk of fragmentation.
3.2 Payload Readout and Control Electronics
RAAD electronics consist of three main components.
-
1.
VETO readout electronics
-
2.
Photosensor power supply
-
3.
Front-end and Controller boards
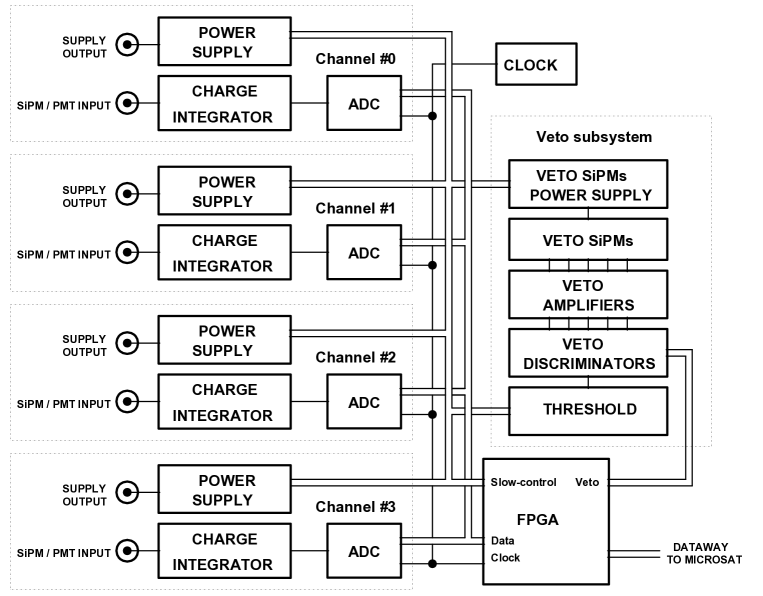
A block diagram for the electronics is shown in Figure 6 and its main characteristics are summarized in Table 5.
| Parameter | Design value |
|---|---|
| Average Power Consumption [W] | 5.9 |
| Mass [g] | 58 (MPPC), 66 (PMT) |
| ADC resolution range [bits] | 10 16 |
| Components | SMD, all COTS, Automotive grade |
| Operating modes | noise, default, science, custom, safe |
The power supply electronics of the MPPC and PMT payloads are shown in Figure 7.
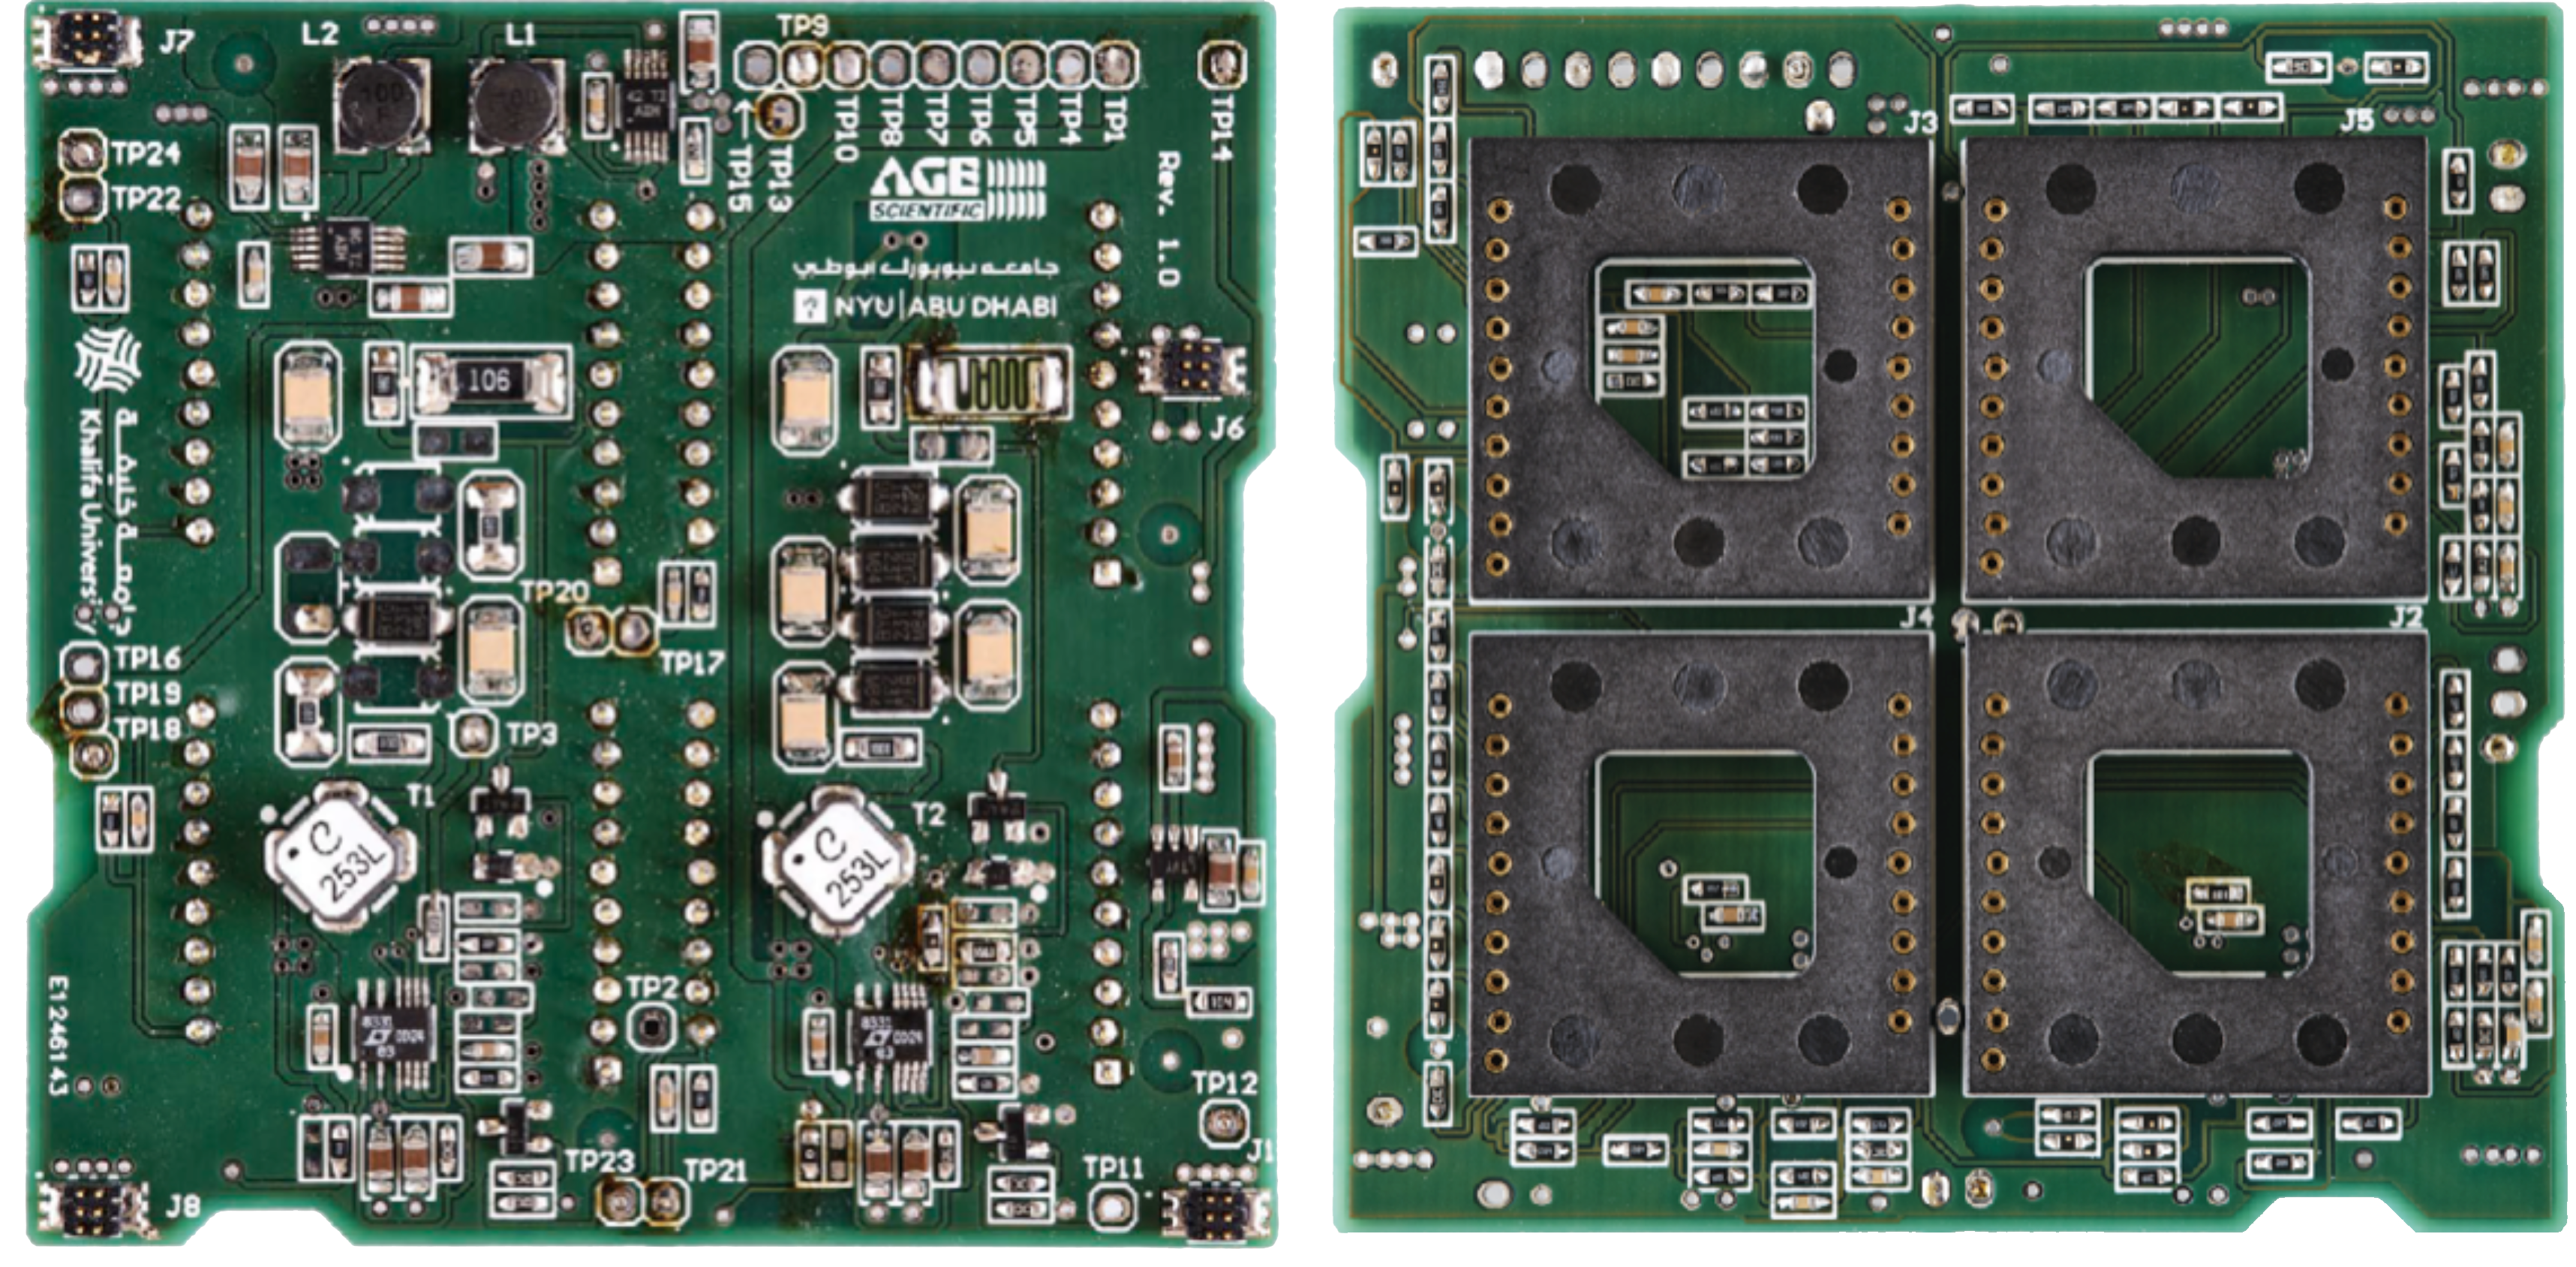
With the single exception of the photosensor sockets, no connectors have been used in the LIGHT-1 payload to maximize compactness and reliability.
3.3 Firmware Overview
The onboard firmware is designed in order to assign all data collected to specific categories (i.e. gamma and charged particle-induced events, TGF events, and orbit monitoring data).
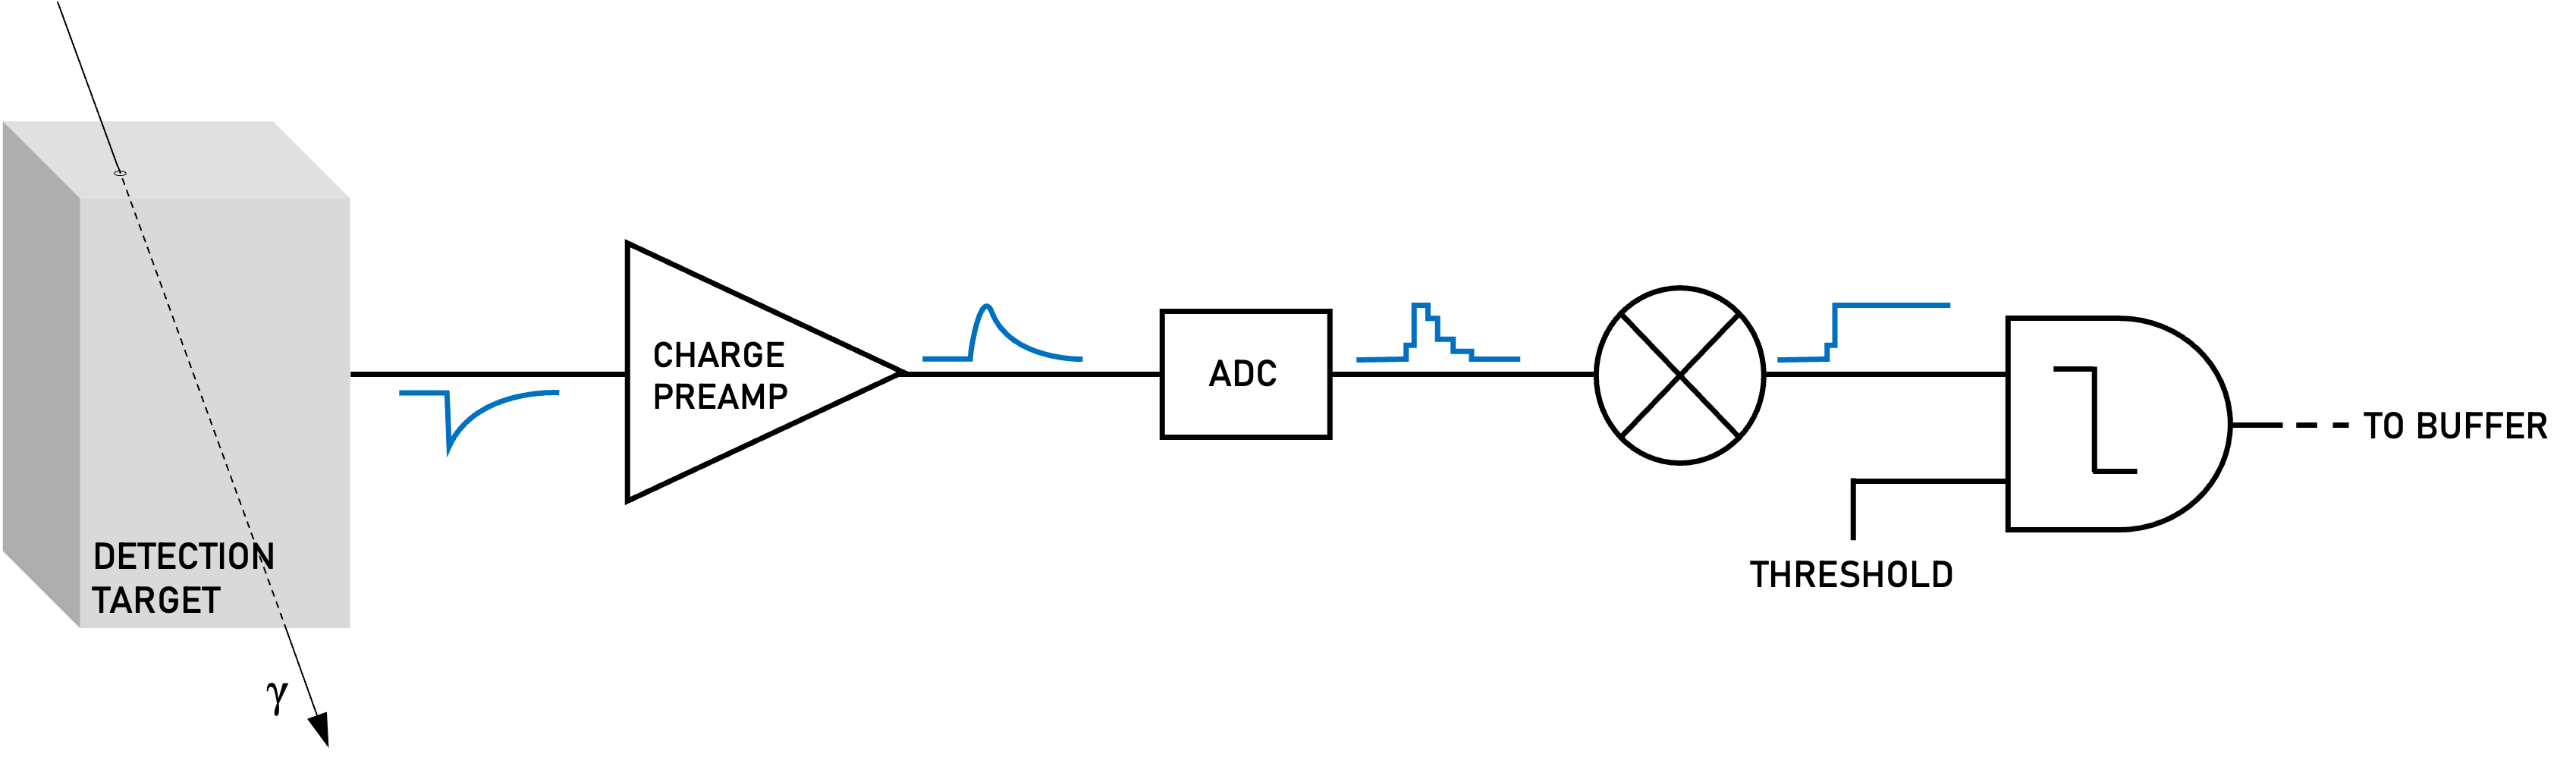
The detection strategy can be summarised in a series of steps listed below ( see Figure 8).
-
1.
Particle interaction and signal generation in the detector;
-
2.
the charge amplifier integrates the signal. Its output is sampled by an ADC (16 bits, 10 MHz) and passed through a matched filter [28] to extract the peak charge value;
-
3.
if the charge value is larger than the detection threshold, an event timestamp is assigned and the event is sent to the spacecraft bus.
The payload data generated are organized into four buffers, each designed to store different types of events as shown in Table 6.
| Data Buffer | Description |
|---|---|
| NonVeto | All the events in which there is no VETO flag. The ADC resolution is lowered to 10 bits, timestamp at 1 ms resolution |
| Veto | All the events in which there is at least one (out of eight) VETO flag active. The ADC resolution is lowered to 14 bits, timestamp at 100 resolution |
| TGF | All the events falling into a coincidence window of 500 in which there is no VETO flag. The ADC resolution is nominal (16 bits), 500 ns timestamp resolution |
| Orbit | Payload housekeeping events collected once every 20 s including the payload temperature, the particle rate of each channel and the VETO, the detector operating voltage, the payload operating configuration (e.g. noise, default, flight mode), and all the working parameters required to run diagnostic checks |
The science data is transmitted to the ground using an S-Band system during daily passes above ground stations dedicated to the mission [22]. Each contact (up 6 times per day) can last up to 10 minutes. Spacecraft telemetry, which includes housekeeping data, operational commands, and payload scripts, is transmitted using a UHF transceiver.
4 Pre-Flight Simulations and Tests
In order to space qualify RAAD, all the payload components and the payload as a whole have been subjected to several environmental and functionality tests, in order to assess the surviving capability to the various regimes typical of the mission (launch phase, thermal stress, radiation, etc …).
4.1 Stress Analysis
Prior to conducting vibrations tests on the physical assembly of the payload, a stress analysis was conducted to study the effect of the launch conditions on the structure. In particular, a Finite Element Analysis was conducted in order to calculate the frequency and peak amplitude of the first 20 vibrational modes.
The large computational requirement for such analyses forced a geometric simplification of the 3D models used. Yet the simplification was within a reasonable range so as to not contribute more than 10% of the payload’s total mass.
The general requirement for space qualifying such equipment to survive launch is for the natural modes to be above 100 Hz (see [29]). Through the simulation, we verified that our design fulfills this requirement as all normal modes are between 1200 Hz and 2000 Hz.
4.2 Geant4 Simulations
Using the Geant4 framework a C++ particle physics simulation was developed to evaluate the efficiency of the detectors, as well as the background energy deposition on the crystals and the veto caused by trapped charged particles in the earth’s magnetic field. The detector geometry was simplified to increase performance. The simulation code and analysis can be found in [30].
We were able to estimate the hardware threshold of the detector by sending photons with energies ranging from to and recording the energy deposited on each component of the detector. Fig. 9 shows the ratio of the energy deposited to the crystals over the incoming energy as a function of the incoming photon energy. We see that we start detecting photons at roughly .

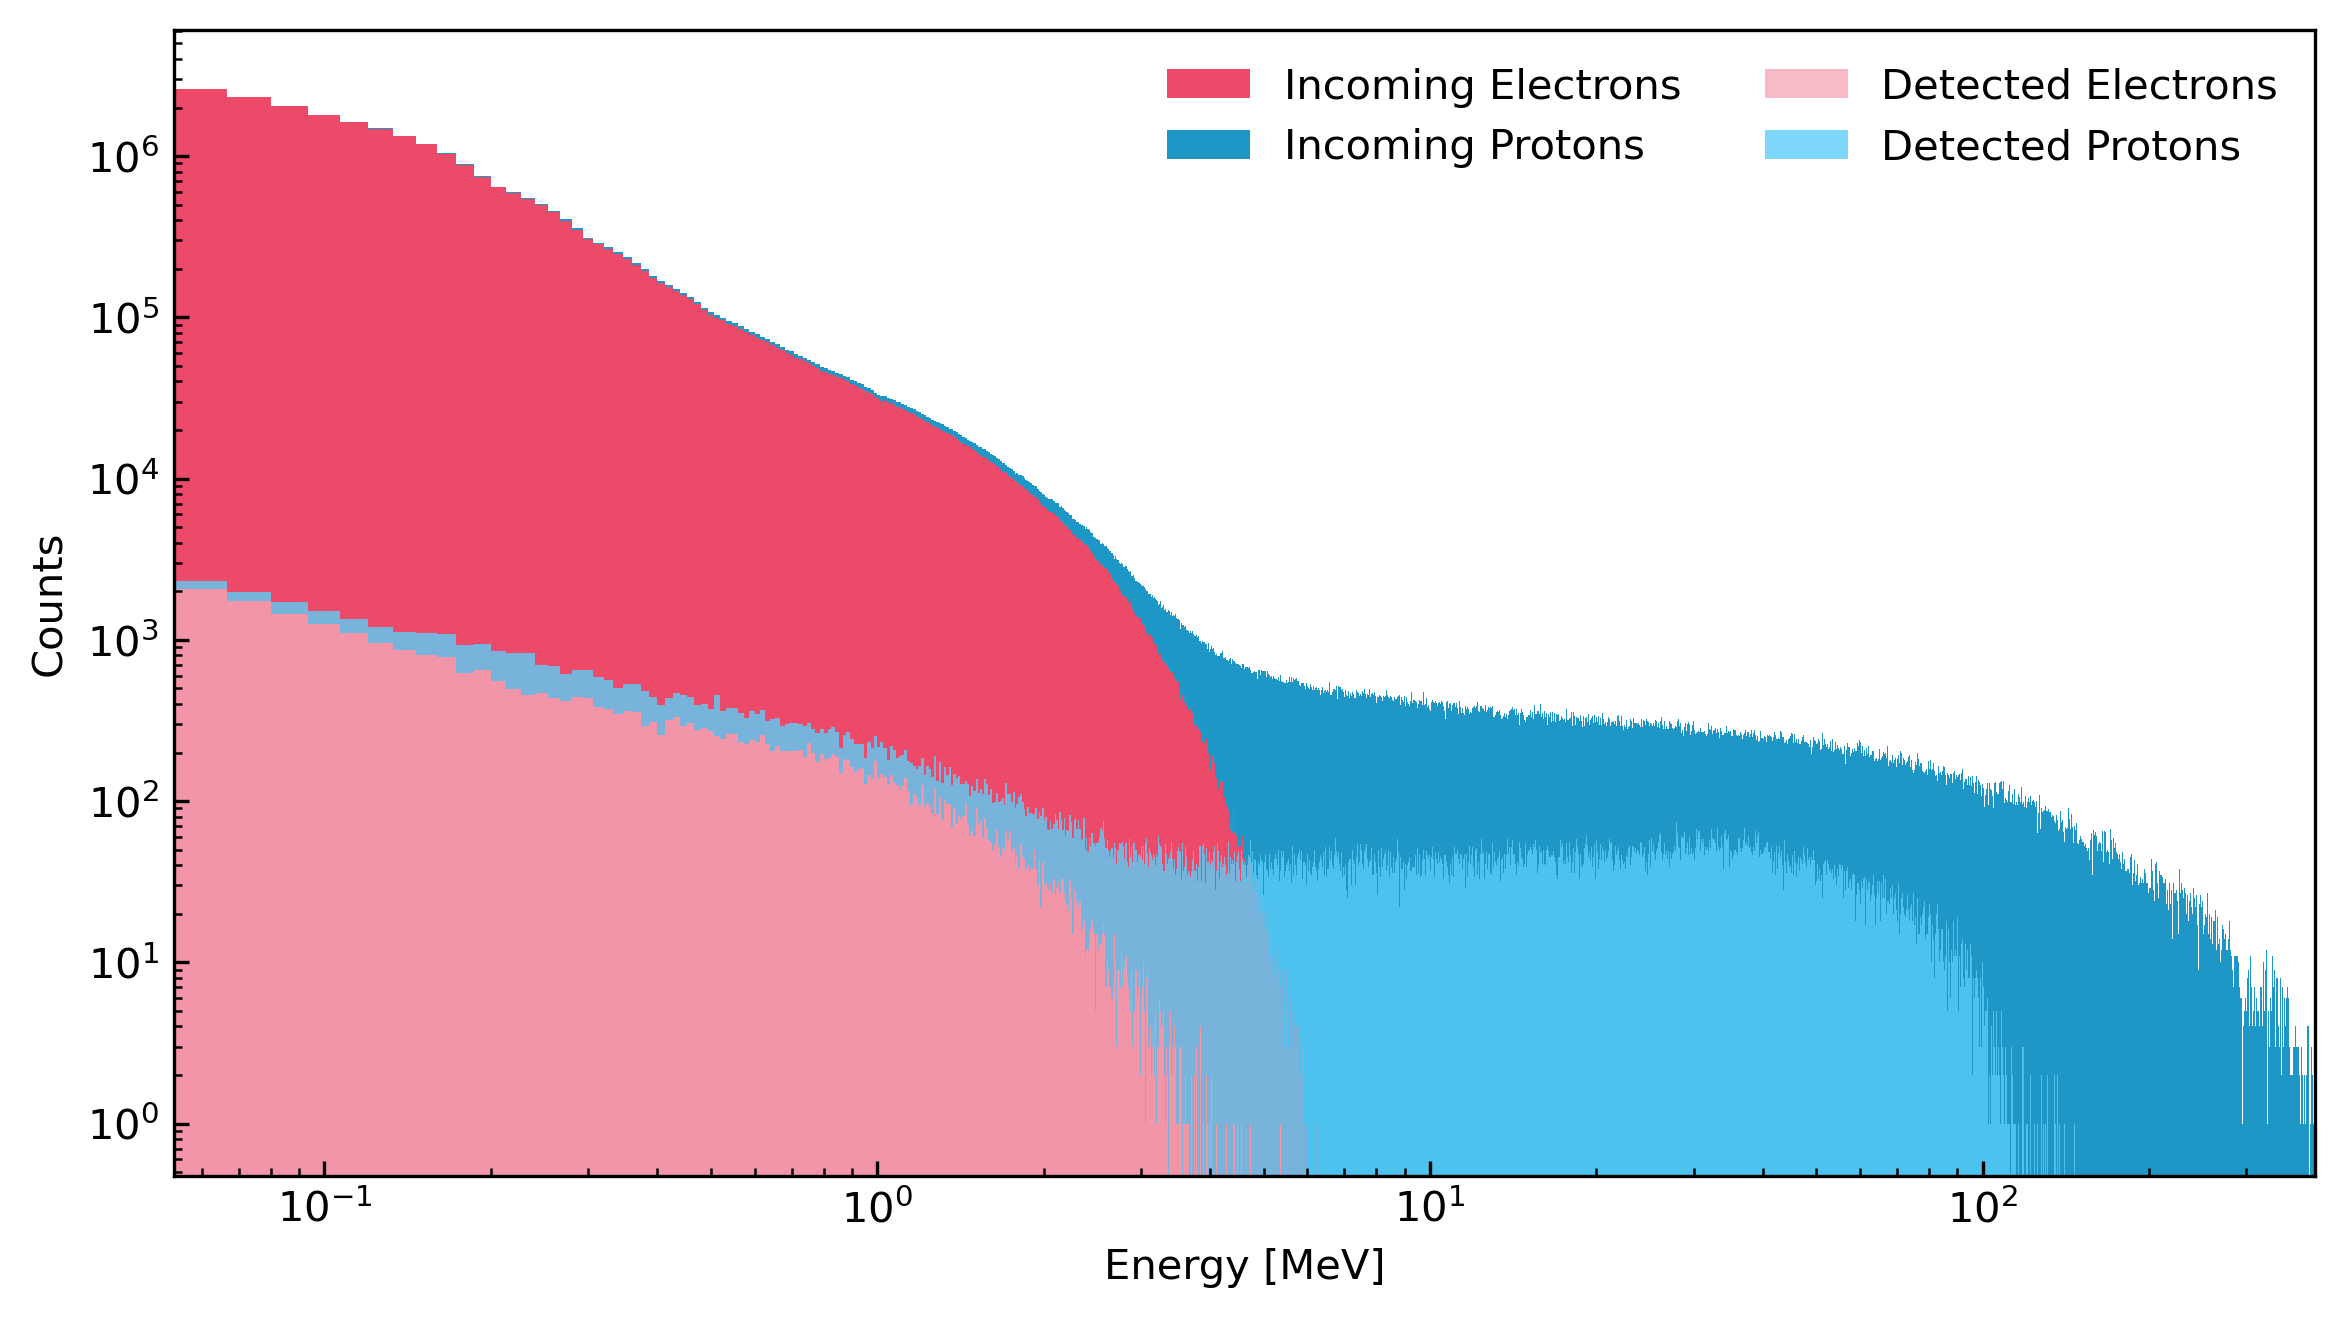
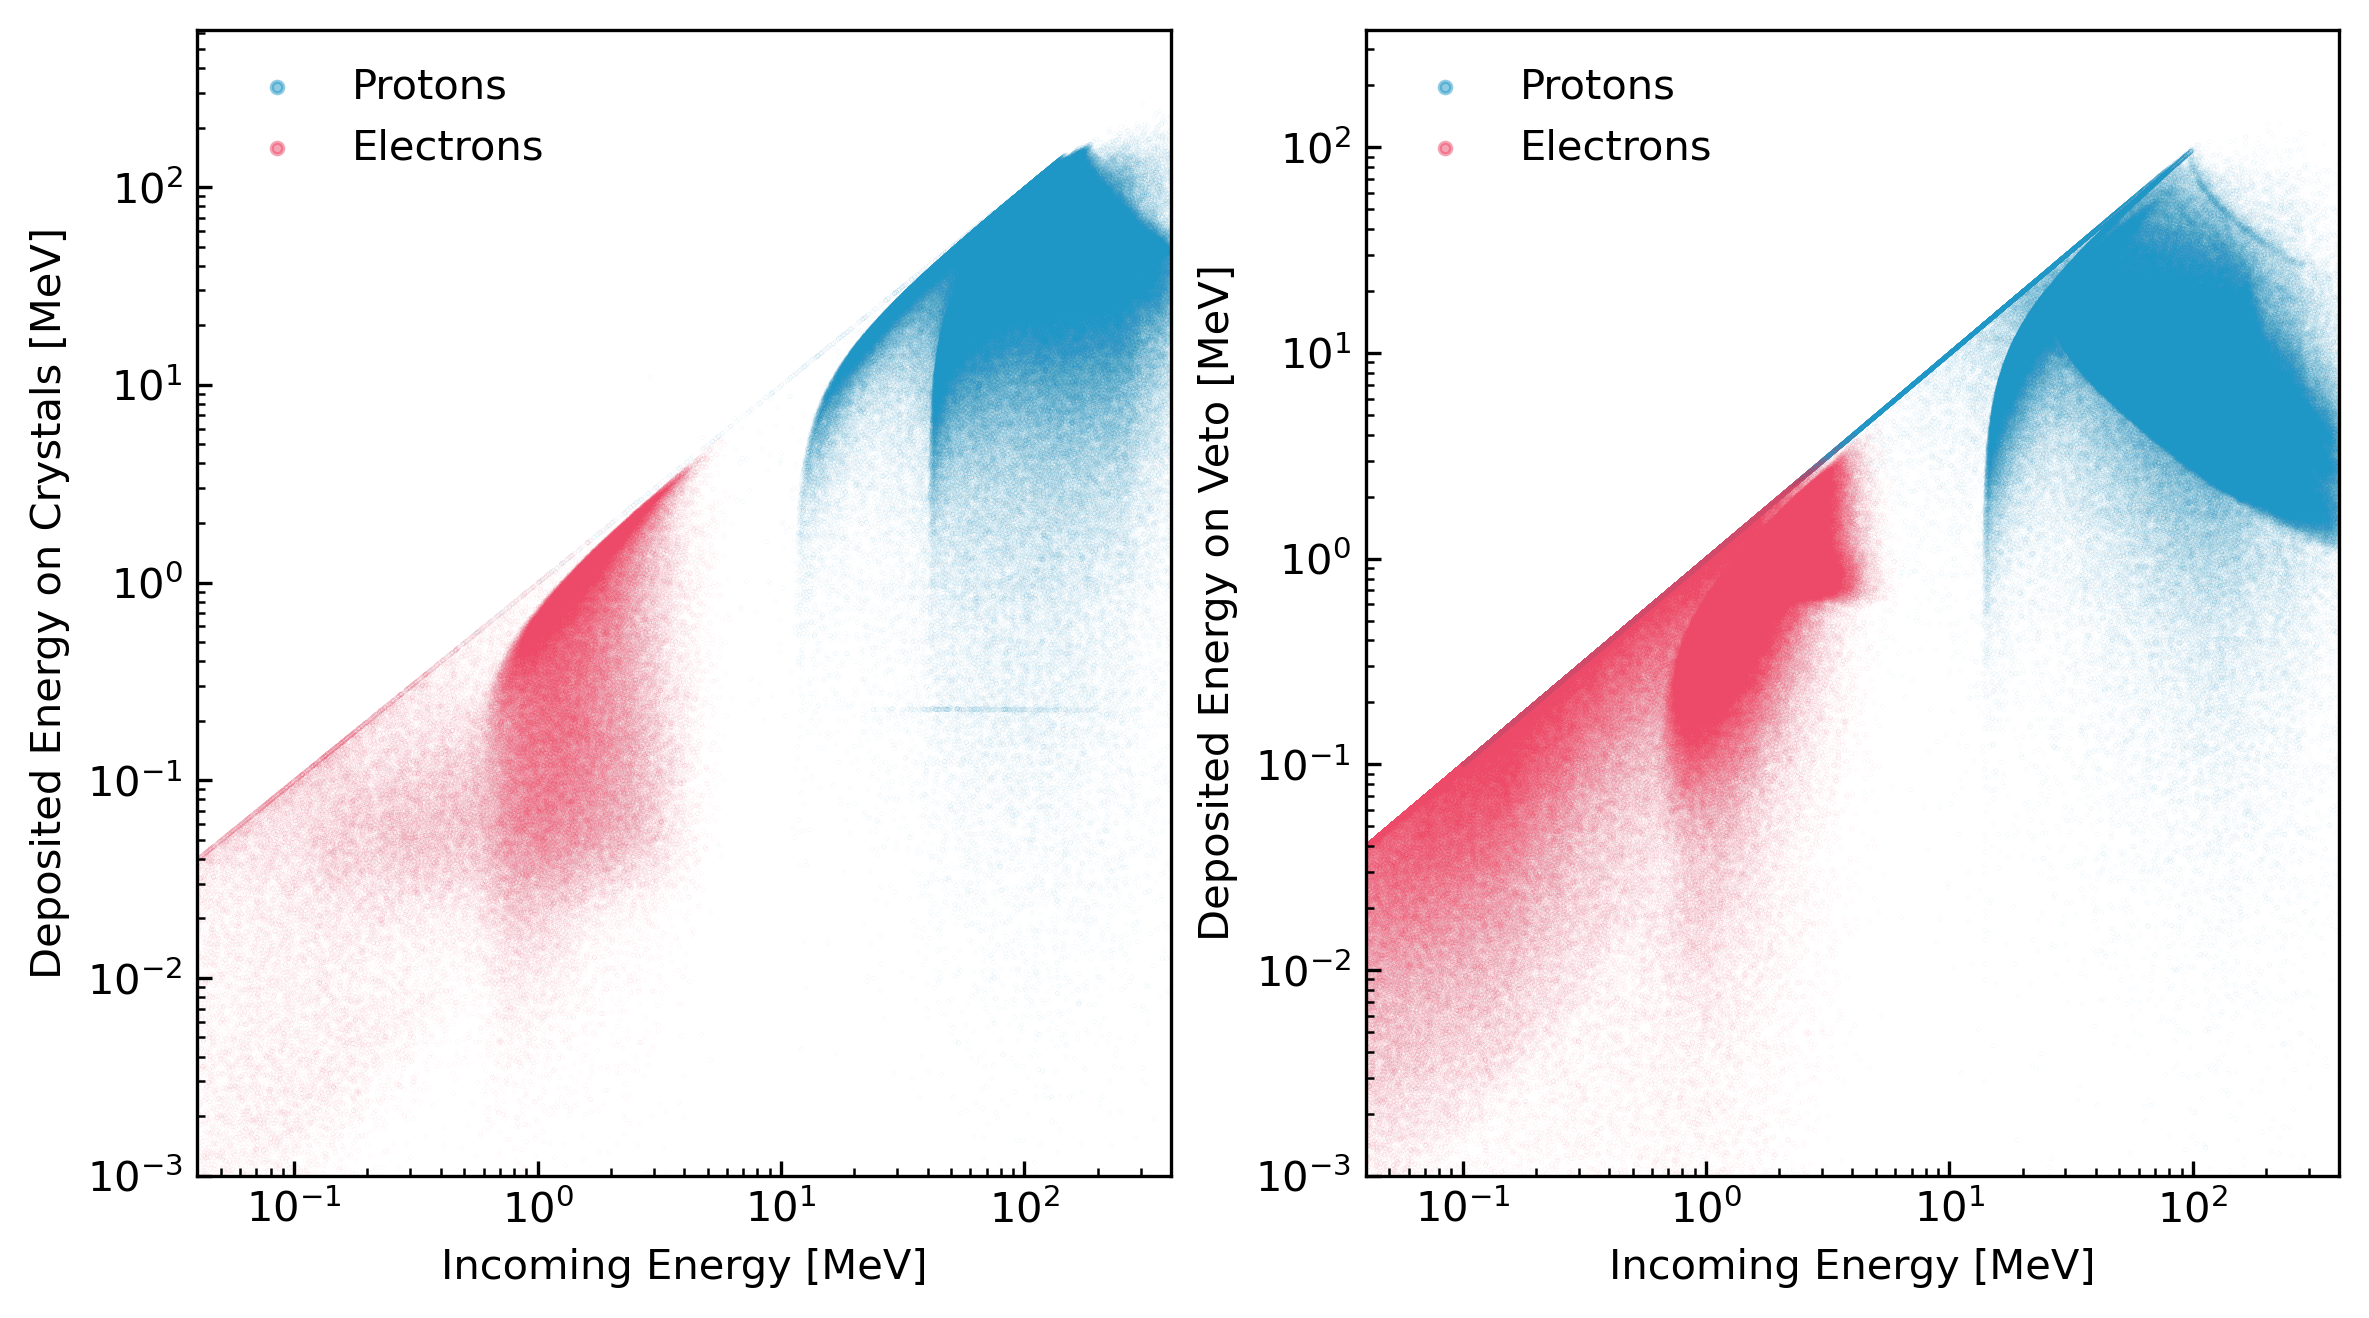
Using the European Space Agency’s SPace ENVironment Information System (SPENVIS) [31] the flux and energy spectrum for trapped protons and electrons along the orbit of LIGHT-1 were estimated, providing the input for a Geant4-based simulation of the detectors’ background spectrum. The energy deposition on the crystals vs the original particle energy spectrum is shown in Fig. 10 while a more detailed comparison between the energy deposited on the veto vs the crystals is shown in Fig. 11.
4.3 Vibration Tests
Vibration tests are typically conducted on fully assembled CubeSats to test their ability to survive launch. However, since our payload made use of quartz windows and crystals, JAXA required additional vibration tests to be carried out on these components in isolation, prior to their integration into the main assembly.
The vibration tests were conducted at New York University Abu Dhabi (NYUAD). A permanent magnet shaker was used to emulate the vibrational profile of the launch as well as other parameters specified by JAXA. The testing procedure is outlined below:
-
1.
A 20 Hz - 2 kHz sweep to identify the component’s normal modes.
-
2.
A 7s test using a frequency sweep designed to simulate the launch conditions of a possible transport vehicle as provided by JAXA.
-
3.
A 20 Hz - 2 kHz sweep to compare the component’s normal modes after exposure to launch conditions.
This test was carried out to simulate three spacecraft candidates, namely H-II Transfer Vehicle (HTV), Cygnus NG, and SpaceX Dragon. The latter became the chosen transport vehicle for LIGHT-1. Both crystal arrays and a PMT unit were subject to these tests, all of which survived without mechanical failures, ensuring that the RAAD components were launch-safe.
4.4 Thermal-Vacuum Tests
Placing four crystals in the same case was a solution to the limited space problem that exists in CubeSat missions, but a concept that was not tested for space missions. Thus, it was crucial to conduct thermal vacuum tests on the crystal arrays to determine their survivability in the space environment. Two types of thermal vacuum tests were carried out on the crystal arrays:
-
1.
One Day Tests: The arrays were left in the thermal vacuum chamber for approximately 24 hours at a set temperature of 40 oC and a set pressure of 1 Torr.
-
2.
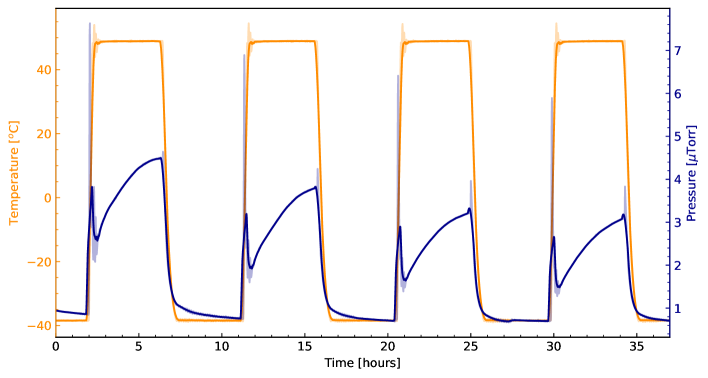
Three Days Tests: The arrays were left for approximately 72 hours at a set pressure of 1 Torr with a thermal cycle where the temperature oscillates every five hours between -40 oC and 50 oC, simulating the conditions faced in space by satellites. An example of this cycle can be found in figure 12.
In both thermal vacuum tests the arrays were placed on top of an insulator material, to prevent the lower side of the arrays from heating up faster than the rest of the array due to their contact with the chamber’s inner metal base. These tests helped in reevaluating the structure of the arrays so that they could be optimized for space flight. In particular, a manufacturing error was uncovered that led to condensation inside one of the arrays during the thermal cycle, necessitating its repair by the manufacturer. These tests were carried out both at YahSat Lab in Khalifa University and at NYUAD.
5 On-Flight Perfomance
The performance and health of the payload have been evaluated continuously throughout the mission. In this section, we relate some of the experimental data observed in orbit to the parameters we have used to evaluate the operating condition of the LIGHT-1 payload.
5.1 Instrument Health
Throughout the mission, we have monitored the health of the hardware through onboard sensors. In particular, the Texas Instruments LM71 temperature sensor embedded in each of the readout electronics boards measured the payload temperature over the lifespan of the mission. The resulting measurements from the commissioning of the payload until de-orbit are shown in Fig. 13.
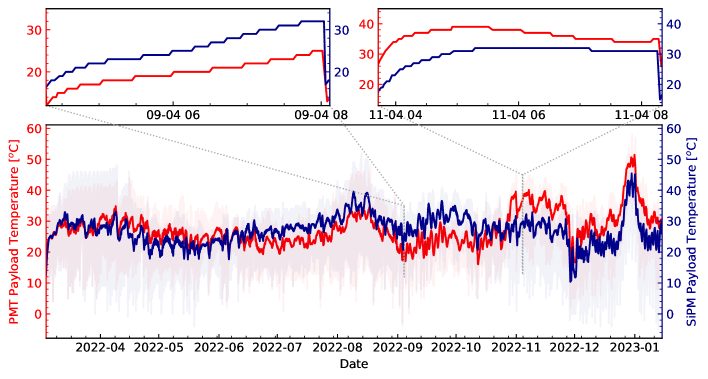
The payload’s temperature data during orbit is important to correct for detector gain drift [21], and for adjusting the operations duty cycle in flight to avoid overheating. As can be seen in the insets of Fig. 13, which represent the temperature recorded while the payload was operational, during a single orbit the temperature rises significantly when the payload is operating. This occurs due to the power dissipated by the electronics. Already in its design phase, the payload mission concept has been tailored around a reduced 50 duty cycle in order to meet the mission requirements in terms of the power budget. From the commissioning to the de-orbit phase, the electronics have been subjected to 1861 power cycles. Under these conditions and for the entire mission, no emergency procedure has been triggered due to temperature failure.
Pulse Per Second Signal Loss.
By design, a key feature of the RAAD electronics is the ability of assigning a sub-microsecond time stamping to each acquired event. To be compliant with the power constraints of the mission, since the design phase, the use of fast electronics capable of coping with the typical time response of MPPCs and PMTs (order of ) could not be considered.
The solution implemented on the LIGHT-1 timing architecture utilizes a distributed disciplined clock, controlled by a Phase Locked Loop (PLL).
The PLL generates an high frequency output () from a low frequency reference (). The RAAD timing circuit concept is based on a PLL using the Pulse-Per-Second (PPS) hardware signal obtained from the spacecraft GPS receiver coupled to a oscillator.
However, an unidentified failure made the PPS signal unavailable. As a consequence, the capability to calculate and assign the timestamp to events on the payload data buffers was compromised from the beginning of the LEOP Phase until the Science Run began (see Fig. 1).
To overcome this issue, a software patch has been implemented during the Payload Commissioning phase (see Fig. 1). The patch uses the onboard computer’s signal to provide a, less accurate, PPS signal digitally. We used further reconstruction techniques on the ground after obtaining the data in order to retrieve the original accuracy.
Seasonal Temperature Variation.
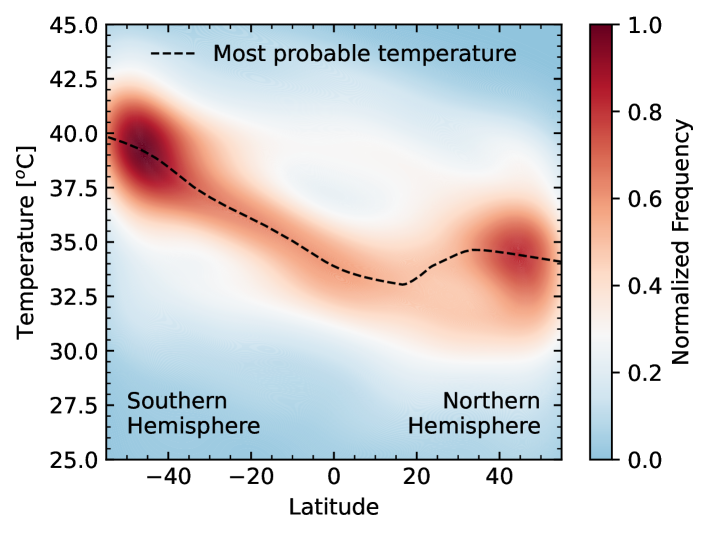
We further verified the health of the onboard electronics by tracking the temperature of the satellite during October as a function of latitude. In Fig. 14 the dotted line shows the most probable temperature measured by the satellite as a function of latitude. In the plot, we observe the expected seasonal variation, namely hot temperatures in the southern hemisphere due to increased sunlight during October, and, conversely, colder temperatures in the northern hemisphere. Such results were used to verify the integrity of our reconstructed data.
6 Conclusions
In this paper, we describe RAAD, the scientific payload of the LIGHT-1 CubeSat mission, designed to detect fast (< 1ms) X and gnmma-ray transients with two detectors fitting in 1.7 CubeSat units. The payload underwent rigorous physical testing and simulation in order to space-quality the instrument. In particular, the thermal vacuum and vibration tests of the individual components and the assembly certified RAAD according to JAXAs specifications for surviving typical launch conditions for such instrumentation. Space qualification was further validated by carrying out a modal analysis of the apparatus, showing vibrational modes within the approved range for withstanding launch conditions. The expected trapped charged particle flux along the orbit of the detector was estimated using data from the European Space Agency’s SPace ENVironment Information System (SPENVIS) [31] allowing us to carry out an exhaustive Geant4 particle physics simulation to predict the expected background and optimize the detection threshold accordingly as well as the geometry and optical insulation of the instrument.
The LIGHT-1 satellite was launched from the Kennedy Space Center on December 21st, 2021, on a SpaceX rocket, which docked at the International Space Station the day after. It was deployed on February 3rd, 2022. Contact was lost on January 14, 2023. While the analysis of the data is ongoing, the housekeeping data presented show that, with the exception of the failure that led to the PPS loss, RAAD withstood the launch stress as expected, and the detectors operated throughout the mission.
Acknowledgments
We gratefully acknowledge the support of the UAE Space Agency through the 2018 MiniSat Competition, and the NYUAD Kawader program for supporting one of the authors (L. AlKindi). Special thanks to Sebastien Celestin for providing TGF models. We also thank Khalifa University and NSSA for funding their master’s students to work on the CubeSat’s Bus system design. Finally, we express our gratitude to the NYUAD Core Technology Platforms for their invaluable assistance and particularly to the machine shop team for the realization of the aluminum enclosures of the detection targets.
References
- [1] M.S. Briggs, S. Xiong, V. Connaughton, D. Tierney, G. Fitzpatrick, S. Foley et al., Terrestrial gamma-ray flashes in the fermi era: Improved observations and analysis methods, Journal of Geophysical Research: Space Physics 118 (2013) 3805.
- [2] J.R. Dwyer, The relativistic feedback discharge model of terrestrial gamma ray flashes, Journal of Geophysical Research: Space Physics 117 (2012) n/a.
- [3] G.J. Fishman, P.N. Bhat, R. Mallozzi, J.M. Horack, T. Koshut, C. Kouveliotou et al., Discovery of intense gamma-ray flashes of atmospheric origin, Science 264 (1994) 1313.
- [4] M. Marisaldi, F. Fuschino, C. Labanti, M. Galli, F. Longo, E.D. Monte et al., Detection of terrestrial gamma ray flashes up to 40 MeV by the AGILE satellite, Journal of Geophysical Research: Space Physics 115 (2010) n/a.
- [5] R.J. Nemiroff, J.T. Bonnell and J.P. Norris, Temporal and spectral characteristics of terrestrial gamma flashes, Journal of Geophysical Research: Space Physics 102 (1997) 9659.
- [6] M. Tavani, M. Marisaldi, C. Labanti, F. Fuschino, A. Argan, A. Trois et al., Terrestrial gamma-ray flashes as powerful particle accelerators, Physical Review Letters 106 (2011) .
- [7] J.R. Dwyer, D.M. Smith and S.A. Cummer, High-energy atmospheric physics: Terrestrial gamma-ray flashes and related phenomena, Space Science Reviews 173 (2012) 133.
- [8] J.R. Dwyer and S.A. Cummer, Radio emissions from terrestrial gamma-ray flashes, Journal of Geophysical Research: Space Physics 118 (2013) 3769.
- [9] T. Khamitov, A. Nozik, E. Stadnichuk, E. Svechnikova and M. Zelenyi, Estimation of number of runaway electrons per avalanche in earth's atmosphere, Europhysics Letters 132 (2020) 35001.
- [10] D.M. Smith, L.I. Lopez, R.P. Lin and C.P. Barrington-Leigh, Terrestrial gamma-ray flashes observed up to 20 mev, Science 307 (2005) 1085 [https://www.science.org/doi/pdf/10.1126/science.1107466].
- [11] S.A. Cummer, Y. Zhai, W. Hu, D.M. Smith, L.I. Lopez and M.A. Stanley, Measurements and implications of the relationship between lightning and terrestrial gamma ray flashes, Geophysical Research Letters 32 (2005) [https://agupubs.onlinelibrary.wiley.com/doi/pdf/10.1029/2005GL022778].
- [12] B. Grefenstette, D. Smith, B. Hazelton and L. Lopez, First rhessi terestrial gamma ray flash catalog, Journal of Geophysical Research 114 (2009) .
- [13] F. Fuschino, F. Longo, M. Marisaldi, C. Labanti, M. Galli, A. Bulgarelli et al., Agile view of tgfs, AIP Conference Proceedings 1118 (2009) 46 [https://aip.scitation.org/doi/pdf/10.1063/1.3137712].
- [14] M. Marisaldi, A. Argan, A. Trois, A. Giuliani, M. Tavani, C. Labanti et al., Agile observation of terrestrial gamma-ray flashes, Il Nuovo Cimento C (2011) 1–99999.
- [15] W.B. Atwood, A.A. Abdo, M. Ackermann, W. Althouse, B. Anderson, M. Axelsson et al., THE LARGE AREA TELESCOPE ON THE <i>FERMI GAMMA-RAY SPACE TELESCOPE <i>MISSION, The Astrophysical Journal 697 (2009) 1071.
- [16] C. Meegan, G. Lichti, P.N. Bhat, E. Bissaldi, M.S. Briggs, V. Connaughton et al., The fermi gamma-ray burst monitor, .
- [17] M.S. Briggs, G.J. Fishman, V. Connaughton, P.N. Bhat, W.S. Paciesas, R.D. Preece et al., First results on terrestrial gamma ray flashes from the fermi gamma-ray burst monitor, Journal of Geophysical Research: Space Physics 115 (2010) .
- [18] O.J. Roberts, G. Fitzpatrick, M. Stanbro, S. McBreen, M.S. Briggs, R.H. Holzworth et al., The first fermi-GBM terrestrial gamma ray flash catalog, Journal of Geophysical Research: Space Physics 123 (2018) 4381.
- [19] T. Neubert, N.B. Crosby, T.-Y. Huang and M.J.R. and, ASIM—an instrument suite for the international space station, .
- [20] I. Bjørge-Engeland, N. Østgaard, A. Mezentsev, C.A. Skeie, D. Sarria, J. Lapierre et al., Terrestrial gamma-ray flashes with accompanying elves detected by ASIM, Journal of Geophysical Research: Atmospheres 127 (2022) .
- [21] A.D. Giovanni, L. Manenti, F. AlKhouri, L. AlKindi, A. AlMannaei, A.A. Qasim et al., Characterisation of a cebr3(lb) detector for space application, Journal of Instrumentation 14 (2019) P09017.
- [22] A. Almazrouei, A. Khan, A. Almesmari, A. Albuainain, A. Bushlaibi, A. Mahmood et al., A complete mission concept design and analysis of the student-led cubesat project: Light-1, Aerospace 8 (2021) 247.
- [23] D. Smith, R. Lin, P. Turin, D. Curtis, J. Primbsch, R. Campbell et al., The rhessi spectrometer, Solar Physics 210 (2002) 33.
- [24] C. Labanti, M. Marisaldi, F. Fuschino, M. Galli, A. Argan, A. Bulgarelli et al., Design and construction of the mini-calorimeter of the AGILE satellite, Nuclear Instruments and Methods in Physics Research Section A: Accelerators, Spectrometers, Detectors and Associated Equipment 598 (2009) 470.
- [25] B.G. Mailyan, W. Xu, S. Celestin, M.S. Briggs, J.R. Dwyer, E.S. Cramer et al., Analysis of individual terrestrial gamma-ray flashes with lightning leader models and fermi gamma-ray burst monitor data, Journal of Geophysical Research: Space Physics 124 (2019) 7170.
- [26] T. Chronis, M.S. Briggs, G. Priftis, V. Connaughton, J. Brundell, R. Holzworth et al., Characteristics of thunderstorms that produce terrestrial gamma ray flashes, Bulletin of the American Meteorological Society 97 (2016) 639 .
- [27] B.G. Mailyan, A. Nag, M.J. Murphy, M.S. Briggs, J.R. Dwyer, W. Rison et al., Characteristics of radio emissions associated with terrestrial gamma-ray flashes, Journal of Geophysical Research: Space Physics 123 (2018) 5933.
- [28] F. Arneodo, A. Di Giovanni and P. Marpu, A review of requirements for gamma radiation detection in space using cubesats, Applied Sciences 11 (2021) .
- [29] E.S. Agency, Ecss–e–10–03a space engineering testing, Earth Observation CFI software (2022) .
- [30] P. Oikonomou and F. Arneodo, LIGHT-1 Geant4 Background Model, GitHub Repository (2023) .
- [31] E.S. Agency, Spenvis - space environment information system, European Space Agency (2023) .