CAMIL: Context-Aware Multiple Instance Learning for Cancer Detection and Subtyping in Whole Slide Images
Olga Fourkioti1, *, Matt De Vries1, Chris Bakal1, *
1 The Institute of Cancer Research, London, United Kingdom
* olga.fourkioti@icr.ac.uk, chris.bakal@icr.ac.uk
1 Abstract
The visual examination of tissue biopsy sections is fundamental for cancer diagnosis, with pathologists analyzing sections at multiple magnifications to discern tumor cells and their subtypes. However, existing attention-based multiple instance learning (MIL) models, used for analyzing Whole Slide Images (WSIs) in cancer diagnostics, often overlook the contextual information of tumor and neighboring tiles, leading to misclassifications. To address this, we propose the Context-Aware Multiple Instance Learning (CAMIL) architecture. CAMIL incorporates neighbor-constrained attention to consider dependencies among tiles within a WSI and integrates contextual constraints as prior knowledge into the MIL model. We evaluated CAMIL on subtyping non-small cell lung cancer (TCGA-NSCLC) and detecting lymph node (CAMELYON16) metastasis, achieving test AUCs of 0.959% and 0.975%, respectively, outperforming other state-of-the-art methods. Additionally, CAMIL enhances model interpretability by identifying regions of high diagnostic value.
2 Introduction
Deep learning (DL) methods have revolutionized the development of highly accurate diagnostic machines (Morales et al., 2021) that rival or even surpass the performance of expert pathologists (Tong et al., 2014; Melendez et al., 2015; Quellec et al., 2016; Das et al., 2018; Srinidhi et al., 2019; Wang et al., 2021). These advancements have been facilitated by the emergence of weakly supervised learning, which eliminates the need for laborious pixel-level annotations. Models trained using weakly supervised learning, relying solely on slide-level labels, have demonstrated exceptional classification accuracy on whole slide imaging (WSI) data, paving the way for scalable computational decision support systems in clinical practice (Xu et al., 2014; Courtiol et al., 2018; Xu et al., 2019; Zhou et al., 2021).
In the context of cancer histopathology, WSIs are not processed as a single image by DL models. Instead, WSIs are frequently subdivided into smaller ‘tiles’, which serve as an input. The task is, then, to classify the WSI based on the features extracted from the individual tiles. Most current methods for weakly supervised WSI classification use the Multiple Instance Learning (MIL) framework, which considers each WSI as a ‘bag’ of tiles and attempts to learn the slide-level label without possessing any prior knowledge about the labels of the individual tiles.
A major bottleneck in the deployment of MIL models, and the weakly-supervised learning paradigm in general, is that the MIL model is either permutation invariant, meaning that the tiles within a WSI exhibit no ordering among each other (Sharma et al., 2021; Xie et al., 2020), or permutation-aware without explicit information guidance. In other words, the spatial relationship of one tile to another is either ignored, or the dependencies between the tiles are implicitly modeled during training without requiring direct instructions (Shao et al., 2021a; Landini et al., 2020; Campanella et al., 2019).
However, explicit knowledge about a tile’s spatial arrangement is particularly relevant in cancer histopathology, where cancer and normal cells are not necessarily distributed randomly inside an image. Contextual insights into the cellular landscape, such as the spatial dispersion of cells, the arrangement of cell clusters, and the broader characteristics of the tissue microenvironment, provide a more comprehensive view of the tile’s local environment, enabling a better assessment of subtle variations and abnormalities that may indicate the presence of cancer.
In this paper, we propose a novel framework dubbed Context-Aware Multiple Instance Learning (CAMIL) to harness the dependencies among the individual tiles within a WSI and impose contextual constraints as prior knowledge on the multiple instance learning model. By explicitly accounting for contextual information, CAMIL aims to enhance the detection and classification of localized tumors and mitigate the potential misclassification of isolated or noisy instances, thereby contributing to an overall improvement in performance for both individual tiles and WSIs. Moreover, the attention weights enhance the interpretability of the model by highlighting sub-regions of high diagnostic value within the WSI.
3 Related work
Typically, to serve as input for a deep neural network (DNN), a WSI is divided into non-overlapping fixed-size tiles, which are assigned a weak label based on the slide-level diagnosis. Under the MIL formulation, the prediction of a WSI label (i.e., cancerous or not) can come either directly from the tile predictions (Campanella et al., 2019; Landini et al., 2020; Hou et al., 2016; Xu et al., 2019), or from a higher-level bag representation resulting from the aggregation of the tile features (Ilse et al., 2018; Lu et al., 2021; Sharma et al., 2021; Wang et al., 2018). The former approach is referred to as instance based. The latter, known as the bag embedding-based approach, has empirically demonstrated superior performance (Sharma et al., 2021; Wang et al., 2018). Most recent bag embedding-based approaches employ attention mechanisms (Vaswani et al., 2017), which assign an attention score to every tile reflecting its relative contribution to the collective WSI-level representation. Attention scores enable the automatic localization of sub-regions of high diagnostic value in addition to informing the WSI-level label (Zhang et al., 2021; BenTaieb and Hamarneh, 2018; Lu et al., 2021).
Attention-based MIL models vary in how they explore tissue structure in WSIs. Many are permutation invariant, meaning they assume the tiles are independent and identically distributed. Building upon this assumption, Ilse et al. (2018) proposed a learnable attention-based MIL pooling operator that computes the bag embedding as the average of all tile features in the WSI weighted by their respective attention score. This operator has been widely adopted and modified with the addition of a clustering layer (Lu et al., 2021; Li et al., 2021b; Yao et al., 2020) to further encourage the learning of semantically-rich, separable and class-specific features. Another variation of the same model uses ‘pseudo bags’ (Zhang et al., 2022). The original bag (WSI) can be split into several smaller bags to alleviate the issue of the limited number of training data.
However, permutation invariant operators cannot inherently capture the structural dependencies among different tiles at the input. The lack of bio-topological information has partially been remedied by the introduction of feature similarity scores instead of positional encodings to model the mutual tile dependencies within a WSI (Xie et al., 2020; Tellez et al., 2021; Adnan et al., 2020). For instance, DSMIL (Li et al., 2020) utilizes a non-local operator to compute an attention score for each tile by measuring the similarity of its feature representation against that of a critical tile. Recently, to consider the correlations between the different tiles of a WSI, transformer-based architectures have been introduced, which usually make use of a learnable position-dependent signal to incorporate the spatial information of the image (Zhao et al., ; Tu et al., 2019). For instance, TransMIL (Shao et al., 2021a) is a transformer-like architecture trained end-to-end to optimize for the classification task and produce attention scores while simultaneously learning the positional embeddings.
In CAMIL, we provide explicit guidance information regarding the context of every tile as we argue that it can provide a valuable, rich source of information. Unlike most existing MIL approaches where the relationships developed between neighboring tiles are omitted, in our approach, we propose a neural network architecture that explicitly leverages the dependencies between neighboring tiles of a WSI by enforcing bio-topological constraints to enhance performance effectively.
Materials and Methods
CAMIL operates on the principle that the context and characteristics of a tile’s surroundings hold substantial potential for enhancing the accuracy of whole slide classification. To illustrate this concept, we can draw a parallel between our framework and the examination process of a pathologist analyzing a biopsy slide. Similar to how a pathologist zooms out of a specific sub-region to comprehensively understand its broader surroundings, CAMIL utilizes this zooming-out approach by extending the tile’s view to examine the broader neighborhood of each tile thoroughly. This extension allows CAMIL to gather additional information and facilitates a better understanding and assessment of the surrounding microenvironment and tissue context.
In CAMIL, we recalibrate each tile’s individual attention score by aggregating the attention scores of its surroundings. For example, tiles with high attention scores that are surrounded by other high-scoring tiles should be recognized as important. Conversely, the presence of a tile classified by the model as important in a low-scoring neighborhood could be, in some cases, attributed to noise, and this should be reflected in its final attention score.

The overview of CAMIL can be seen in Figure 1. It can be decomposed into five elements:
-
1.
A WSI-preprocessing phase automatically segments the tissue region of each WSI and divides it into many smaller tiles (e.g., 256 x 256 pixels).
-
2.
A tile and feature extraction module, consisting of a stack of convolutional, max pooling, and linear layers transforms the original tile input to low dimensional feature representations: , where is the embedding dimensions of a tile, the number of tiles within a WSI ( differs among different WSIs), and the number of WSIs.
-
3.
A Transformer module transforms the tile embeddings to a concise, descriptive hidden feature representation. It is crucial in aggregating global contexts, capturing the overall information and patterns across multiple tiles.
-
4.
A neighbor-constrained attention mechanism in CAMIL, coupled with a contrastive learning block, encapsulates the neighborhood prior and focuses on aggregating local concepts.
-
5.
The feature aggregator and classification layer combine the local concepts derived from the previous layer with the features that describe the global contexts obtained from the transformer module. These features are merged to generate a prediction at the slide level.
We elaborate on each step in the following subsections.
3.1 WSI preprocessing
First, we follow methods in CLAM to segment tissue regions and split the whole slide image into individual non-overlapping tiles (1. in Figure 1) (details of the hyperparameters used here are shown in the appendix).
3.2 Feature extractor
The input to our neighbor-constrained attention module is a bag of features. Quality feature representations have been shown to affect predictive accuracy substantially. Therefore, to extract rich, meaningful feature representations from individual tiles, we use self-supervised contrastive learning. Specifically, we first train a feature extractor following the SimCLR (Chen et al., 2020) approach. SimCLR is one of the most popular self-supervised learning frameworks that enable semantically rich feature representations to be learned by minimizing the distance between different augmented versions of the same image data.
Similar to the training approach followed by Li et al. (2021a), the data sets utilized in SimCLR are composed of patches derived from WSIs. These patches are densely cropped with no overlap and treated as separate images for the purpose of SimCLR training. During training, two different augmentations are done on the same tile. These two augmentations are chosen from four possible augmentations (color distortion, zoom, rotation, and reflection) using a stochastic data augmentation module. These two augmentations of the same tile are fed through a ResNet-18 (He et al., 2015) pre-trained on ImageNet (Deng et al., 2009) with an additional projection head, which is a multi-layer perceptron (MLP) with two hidden layers that map the feature representations to a space where a contrastive loss is applied. The final convolutional block of ResNet-18 and the projection head are then fine-tuned by minimizing the contrastive loss (temperature-scaled cross entropy) between , corresponding to two ‘correlated’ (differentially augmented) views of the same tile. Here, we minimized the normalized temperature-scaled cross entropy (NT-Xent) defined as
| (1) |
The trained network is then used as the base feature extractor ( in Figure 1) to produce the feature representations of each WSI, where is the number of tiles and is the embedding dimension to represent each tile, and the number of WSIs. This trained feature extractor is frozen when training CAMIL and is only used to extract features and calculate distances between neighboring patches. These distances between neighboring patches are calculated using the sum of squared differences between the features and are used in the following neighbor-constrained attention module.
3.3 Transformer module to capture global contexts
To encode the feature embeddings , we use a transformer layer, denoted as in Figure 1. CAMIL leverages the transformer layer to capture the relationships and dependencies between the tiles, enhance the understanding of the global context, and facilitate a more comprehensive feature aggregation. To circumvent the memory overload associated with the long-range dependencies of large WSIs, we adopt the Nystromformer architecture (Xiong et al., 2021) to model feature interactions that otherwise would be intractable. The approximate self-attention mechanism can be defined as follows:
where and are the selected landmarks from the original -dimensional sequence of and , is the approximate inverse of , and softmax is applied along the rows of the matrix.
3.4 Neighbor-constrained attention module to capture local contexts
The neighbor-constrained attention module in CAMIL is designed to capture specific features and patterns within localized areas of the slide. It focuses on the immediate neighborhood of each tile and aims to capture the local relationships and dependencies within that specific region. By doing so, the module can emphasize the relevance and importance of nearby tiles, effectively incorporating fine-grained details and local nuances into the model.
To model the tile and its surroundings, we construct a weighted adjacency matrix. Consider an undirected graph , where represents the set of nodes representing image tiles, and represents the set of edges between nodes indicating adjacency. The graph can be represented by an adjacency matrix with elements , where if there exists an edge and otherwise. Each image tile must be connected to other tiles and can be surrounded by at most eight adjacent patches. Therefore, the sum of each row or column of the adjacency matrix is at least one and, at most, 8, reflecting the neighboring relationships of the tiles. Each element of the matrix represents the degree of similarity or resemblance between two connected tiles and is calculated as follows:
| (2) |
This design ensures injecting a bio-topological prior such that the weight of a tile is dependent on adjacent tiles with a similar pattern.
The tile representations are transformed by the weight matrices , and into three distinct representations: the query representation , the key representation and the value representation , where . The dot product of every query with all the key vectors produces an attention matrix whose elements determine the correlation between the different tiles of a WSI (Figure 1).
The similarity mask is element-wise multiplied with the dot product of the query and key embeddings, generating a masked attention matrix whose non-zero elements reflect the contribution of a tile’s neighbors to the tile score.
After obtaining the attention coefficients that correspond to the neighbors of every tile, the last step is to aggregate this contextual information to generate a single attention weight. For each tile, we sum the coefficients of their neighbors. The resultant tile score vector is passed through a softmax function to ensure that all weights sum to one.
Therefore, the attention coefficient of the th tile of a WSI is given by the following equation, where denotes the inner product between two vectors:
| (3) |
The feature embeddings are then computed and weighted by their respective attention score to give a neighbor-constrained feature vector, , for each tile:
| (4) |
3.5 Feature aggregation and slide-level prediction
The mechanism utilized to fuse the local and global value vectors allows for the adaptive blending of local and global information based on the sigmoid-derived weights and is described in Equation 5. The sigmoid function applied to the local values serves as a weighting factor, enabling the model to emphasize local characteristics when they are deemed more relevant while still retaining the contribution from the global contexts.
| (5) |
where denotes the sigmoid non-linearity.
The collective, WSI-level representation is adaptively computed as the weighted average of the fused vector:
| (6) |
such that:
| (7) |
where , , and are learnable parameters, is an element-wise multiplication, and is the hyperbolic tangent function.
By combining the value vector of the neighbor-constrained attention module with that of the transformer layer, CAMIL achieves a synergistic effect. The transformer layer captures global interactions and dependencies across the entire slide, while the neighbor-constrained attention module complements it by capturing local details and context. Together, they enable CAMIL to integrate both local and global perspectives effectively.
Finally, the slide-level prediction is given via the classification layer :
| (8) |
where corresponds to the number of classes. The representation obtained from the high-attended patches is used to minimize a cross-entropy loss, and a final classification score is produced.
4 Experiments
We sought to determine if CAMIL can effectively capture informative context relationships and, if so, determine whether those relationships can improve MIL performance. To this end, we evaluated CAMIL on two histopathology datasets. This section includes our experimental setup, an overview of our baselines, and a result on test data.
4.1 Datasets
We conducted a series of experiments in two publicly available and widely-used histopathology datasets: the CAMELYON16 (Ehteshami Bejnordi et al., 2017) and TCGA-NSCLC.
CAMELYON16 is a significant publicly available Whole Slide Image (WSI) dataset designed for lymph node classification and metastasis detection. It includes 270 training slides and 129 test slides from two medical centers, all meticulously annotated by pathologists. Some slides have partial annotations, making it a challenging benchmark due to varying metastasis sizes.
On the other hand, the TCGA-NSCLC dataset comprises two non-small cell lung cancer subtypes, LUAD and LUSC, with 541 slides. Unlike CAMELYON16, it lacks annotations. In DigestPath2019, tumorous areas are more extensive, constituting over 80% of each slide’s total tissue area.
4.2 Data splits
In the case of CAMELYON16, the WSIs are partitioned into a training and test set. The 270 WSIs of the training set are split five times into a training (80%) and a validation (20%) set in a 5-fold cross-validation fashion, and the average performance of the model on the competition test set is reported. The official test set comprising 129 WSIs is used for evaluation. Regarding the TCGA-NSCLC dataset, a 5-fold cross-validation across the available images is performed. For each fold, the training set is split into 80% for training purposes and 20% for validation.
4.3 WSI pre-processing
Using the publicly available WSI-prepossessing toolbox developed by (Lu et al., 2021), for both datasets, we first automatically segmented the tissue region from each slide and exhaustively divided it into 256256 non-overlapping patches using magnification (Figure 1). Otsu’s method was used to perform automatic WSI thresholding.
To avoid the computational overhead and capitalize on the rich feature representations already learned during its previous training on CAMELYON16 and TCGA-NSCLC datasets, we opted to use the pre-trained Resnet-18 feature extractor provided by (Li et al., 2021a). This model was extensively trained on a large set of tiles from the CAMELYON16 dataset, densely cropped without overlap, making it a powerful feature extractor. To make a fair comparison, we used the same contrastive learning-based model as the feature extractor for all our baselines.
Results
4.4 Classification performance
We evaluated the performance of our context-aware pooling operator by comparing its performance against traditional pooling operators, including CLAM-SB, CLAM-MB (Lu et al., 2021), TransMIL (Shao et al., 2021b), DTFT-MIL (Zhang et al., 2022) and GTP (Zheng et al., 2022). CLAM-SB and CLAM-MB utilize an attention-based pooling operator within the Attention-Based MIL (AB-MIL) framework (Ilse et al., 2018). They focus on the features of individual tiles and incorporate a clustering layer to enhance performance further. TransMIL is a transformer-based aggregator operator, and DTFT-MIL leverages class activation maps to estimate the probability of an instance being positive under the AB-MIL framework. Lastly, GTP combines a graph-based representation of a WSI and a vision transformer.
The results of using CAMIL to classify WSI in the CAMELYON16 and TCGA-NSCLC datasets are presented in Table 1. The evaluation of the model’s performance in all experiments includes the area under the receiver operating characteristic curve (AUC) and the slide-level accuracy (ACC), which is determined by the threshold of 0.5. When implementing our baselines, we fine-tuned the hyperparameters used in the previously published original work to achieve the best performance. The GTP model has the same configurations as the one described in the original paper (Zheng et al., 2022). However, for the CAMELYON16 dataset, the batch size () was set to 2 due to memory limitations.
| CAMELYON16 | TCGA-NSCL | |||
| METHOD | ACC() | AUC() | ACC() | AUC() |
| Mean-pool | 0.713 | 0.695 | 0.822 | 0.934 |
| Max-pool | 0.841 | 0.921 | 0.888 | 0.956 |
| CLAM-SB | 0.877 | 0.933 | 0.903 | 0.972 |
| CLAM-MB | 0.894 | 0.938 | 0.904 | 0.973 |
| TransMIL | 0.905 | 0.950 | 0.905 | 0.974 |
| DTFD-MIL | 0.889 | 0.941 | 0.899 | 0.964 |
| GTP | 0.883 | 0.921 | 0.916 | 0.973 |
| CAMIL-L | 0.910 | 0.953 | 0.914 | 0.975 |
| CAMIL-G | 0.891 | 0.950 | 0.907 | 0.973 |
| CAMIL | 0.917 | 0.959 | 0.916 | 0.975 |
CAMIL demonstrates superior performance compared to all existing MIL models on the CAMELYON16 cancer dataset across all evaluation metrics. Importantly, in the CAMELYON16 dataset, tumor cells may account for as little as 5% of any WSI. The low frequency of tumor cells in tissue samples is particularly common (Cheng et al., 2021) to metastatic sites, where tumor cells are interspersed within large regions of normal cells. Thus CAMIL - which re-adjusts the attention coefficients by inspecting a tile’s neighborhood - was more effective at identifying clinically relevant, sparse, cancerous regions amidst a sea of normal cells than other models. Specifically, CAMIL outperforms the other baseline models on the CAMELYON16 dataset by significant margins, achieving at least 0.9% better in the AUC and 1.2% in ACC than the existing models.
In the TCGA-NSCLC, CAMIL achieved the highest performance on par with the GTP model (in terms of ACC). Notably, the GTP model, which incorporates a MinCUT pooling layer (Bianchi et al., 2020), performs effectively in this dataset but not in the CAMELYON16 dataset. The purpose of the MinCUT pooling layer is to reduce the memory and time complexity of the self-attention mechanism in the transformer layer. Reducing the number of nodes in the graph from thousands to hundreds makes the self-attention computation more manageable. However, the CAMELYON16 dataset is large and complex, and this pooling operation may result in information loss, particularly in retaining fine-grained details. On the contrary, the relatively smaller dataset size of TCGA-NSCLC allows the GTP model to retain sufficient information even after the MinCUT pooling operation and remain competitive.
4.5 Localization
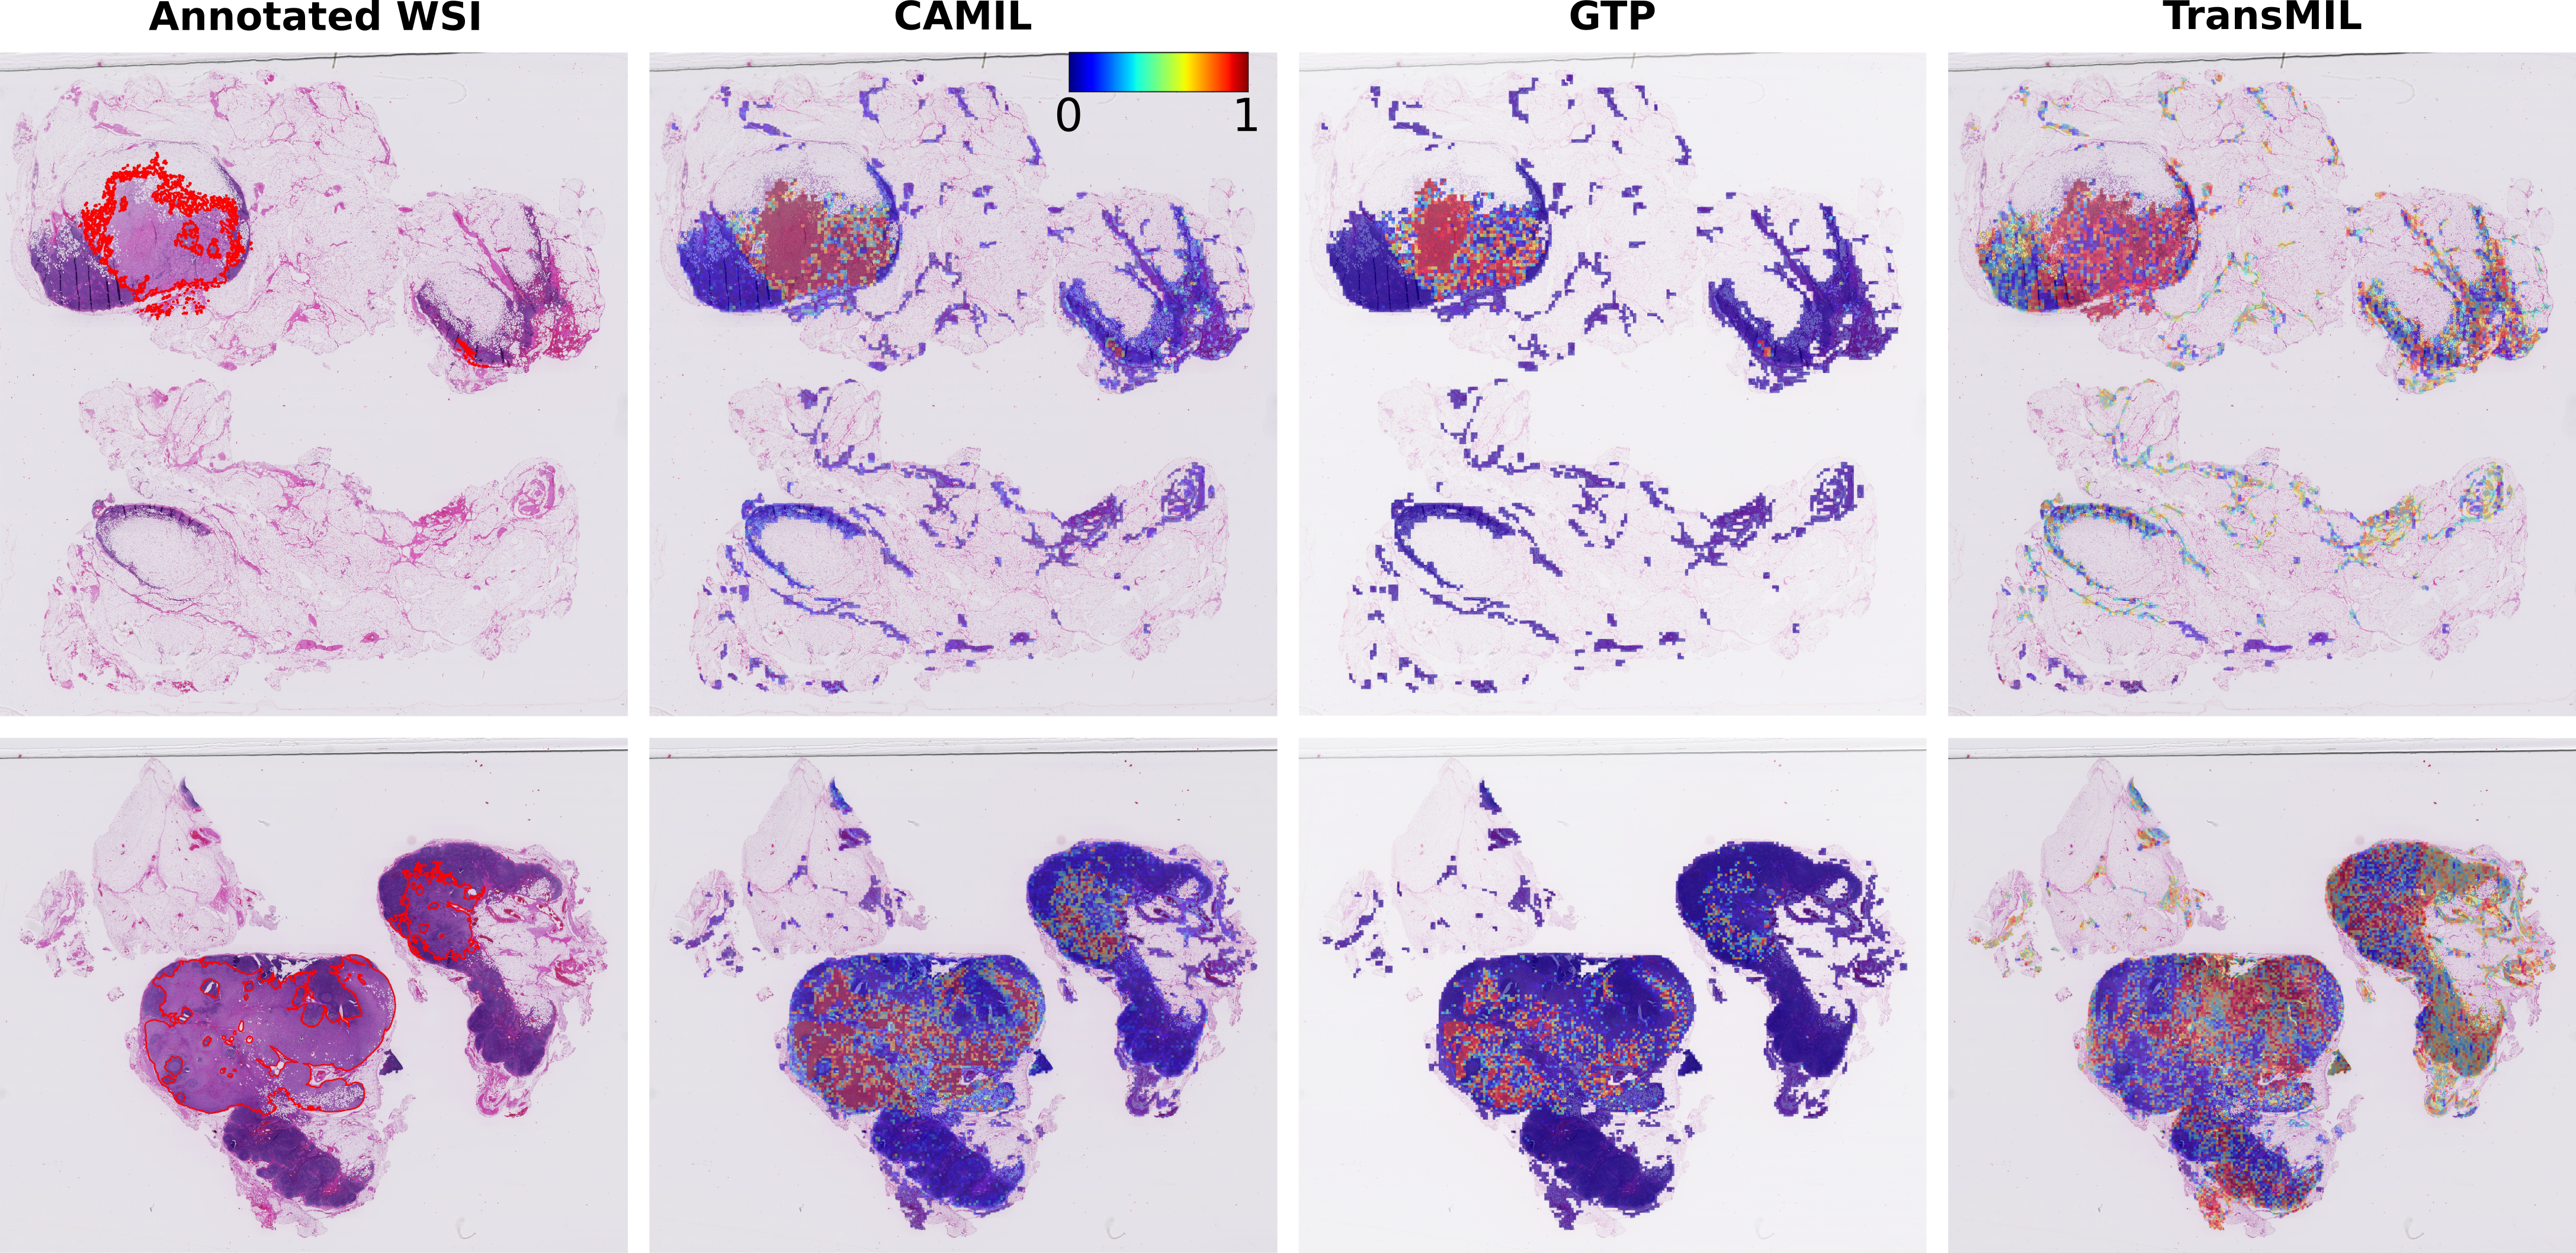
To provide a comprehensive comparison between CAMIL and other models, we opted to compare our model with the graph-based method, GTP, and the transformer-based histopathology framework, TransMIL. Similarly to our model, both of these methods retain spatial information to enhance predictions at the whole slide image (WSI) level. On one hand, GTP uses GraphCAM, a sophisticated technique that propagates the transformer attention maps and class relevance scores through the network and then reconstructs the class activation map for the entire WSI using its graph representation. On the other hand, TransMIL utilizes a transformer to generate an attention matrix whose class token corresponds to the attention coefficients of every tile within a WSI. This method also leverages spatial information in its analysis of histopathology data.
Figure 2 provides a qualitative comparison of the attention maps generated by CAMIL, GTP, and TransMIL on the CAMELYON16 cancer dataset. These attention maps underscore CAMIL’s high predictive performance, as it can adeptly discern the boundaries that separate normal tissue from tumor tissue. Although effectively pinpointing the regions of interest, GTP attention maps appear fragmented and less dense in cancer-associated regions. This fragmentation could be attributed to the MinCUT-pooling operation, which may reduce the representation’s granularity and subsequently affect the heatmap’s coherence. Lastly, TransMIL appears to sufficiently capture long-term dependencies within the WSIs, as evidenced by the attention maps of Figure 2. Specifically, TransMIL can identify the presence of cancer and precisely pinpoint the cancer-associated regions. However, these maps also reveal TransMIL’s inability to capture intricate details and local nuances. The attention scores are not only confined to the cancer regions but expand beyond those to the surrounding normal tissue, impeding the precise localization of tumor boundaries, indicating the model’s limitations in representing close proximity relationships within the WSIs.
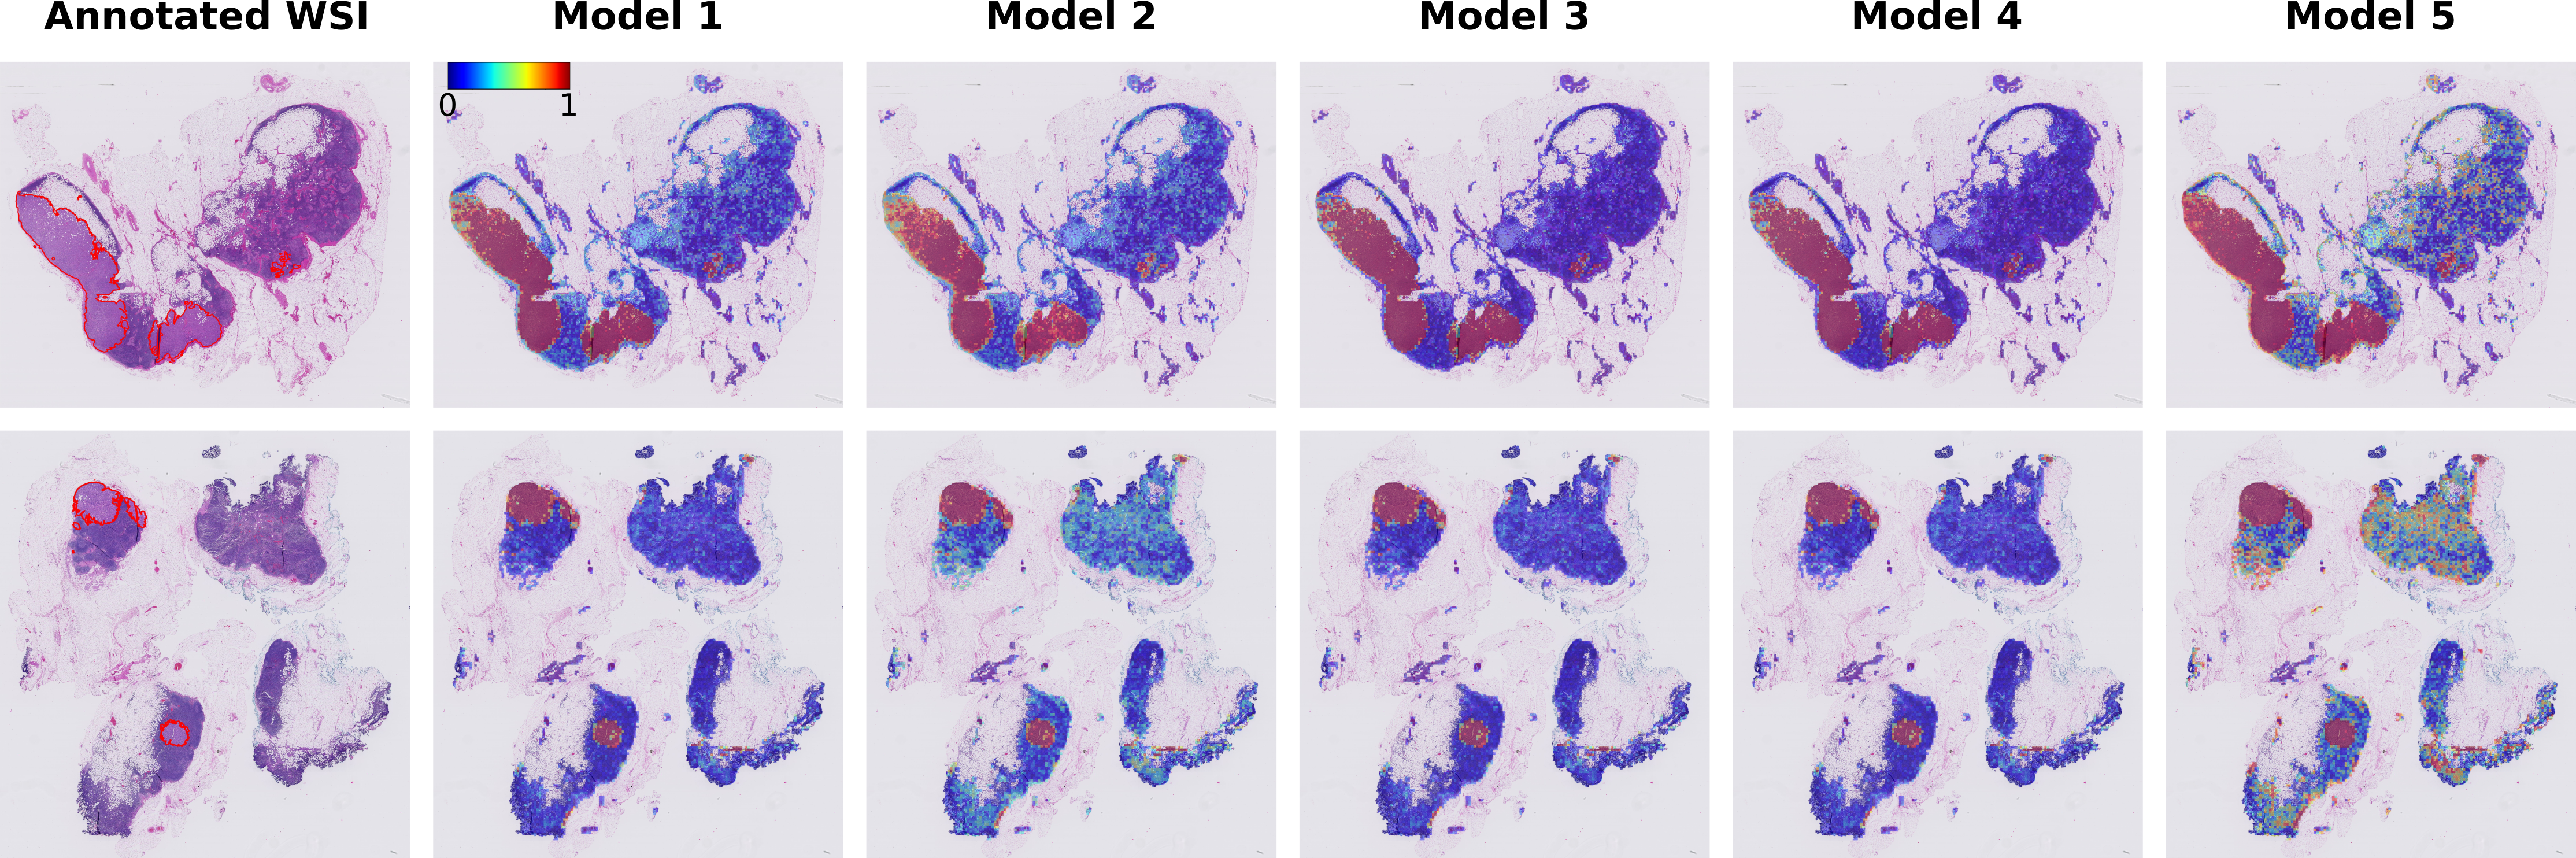
In addition to the quantitative outcomes, we assessed our approach qualitatively by visually presenting attention maps generated by different validation runs of our model overlaid on expert-annotated tumor regions (Figure 3). These attention maps pinpoint diagnostically significant locations in the image that are crucial for accurate tumor identification.
We notice a substantial level of agreement between the regions of interest identified by experts and those generated by our attention maps. These steps are harmonized with an attention map, ultimately forming a transformer relevancy map. Notably, our method consistently highlights the same regions within Whole Slide Images (WSIs) across different cross-validation folds, underscoring the reliability and robustness of our model.
5 Ablation studies
Additionally, we performed ablation studies to evaluate the effectiveness of the Nystromformer module and that of the neighboring-constrained attention module in our model. Specifically, we examined the effect of the Nystromformer block by retaining it while excluding the neighbor-constrained attention module denoted as CAMIL-G. The results in Table 1 demonstrate that using only the Nystromformer block leads to satisfactory performance comparable to that of the TransMIL model, which also incorporates the Nystromformer. In a distinct ablation study, we omitted the Nystromformer block and retained the neighbor-constrained attention module, referred to as CAMIL-L. CAMIL-L exhibits a marginal improvement over the CAMIL-G model, thereby underlining its crucial role in augmenting the model’s performance. Optimal results were achieved through the amalgamation of both models, harnessing both the potential of the Nystromformer block to model long-term dependencies and the prowess of the attention module to comprehend local visual concepts.
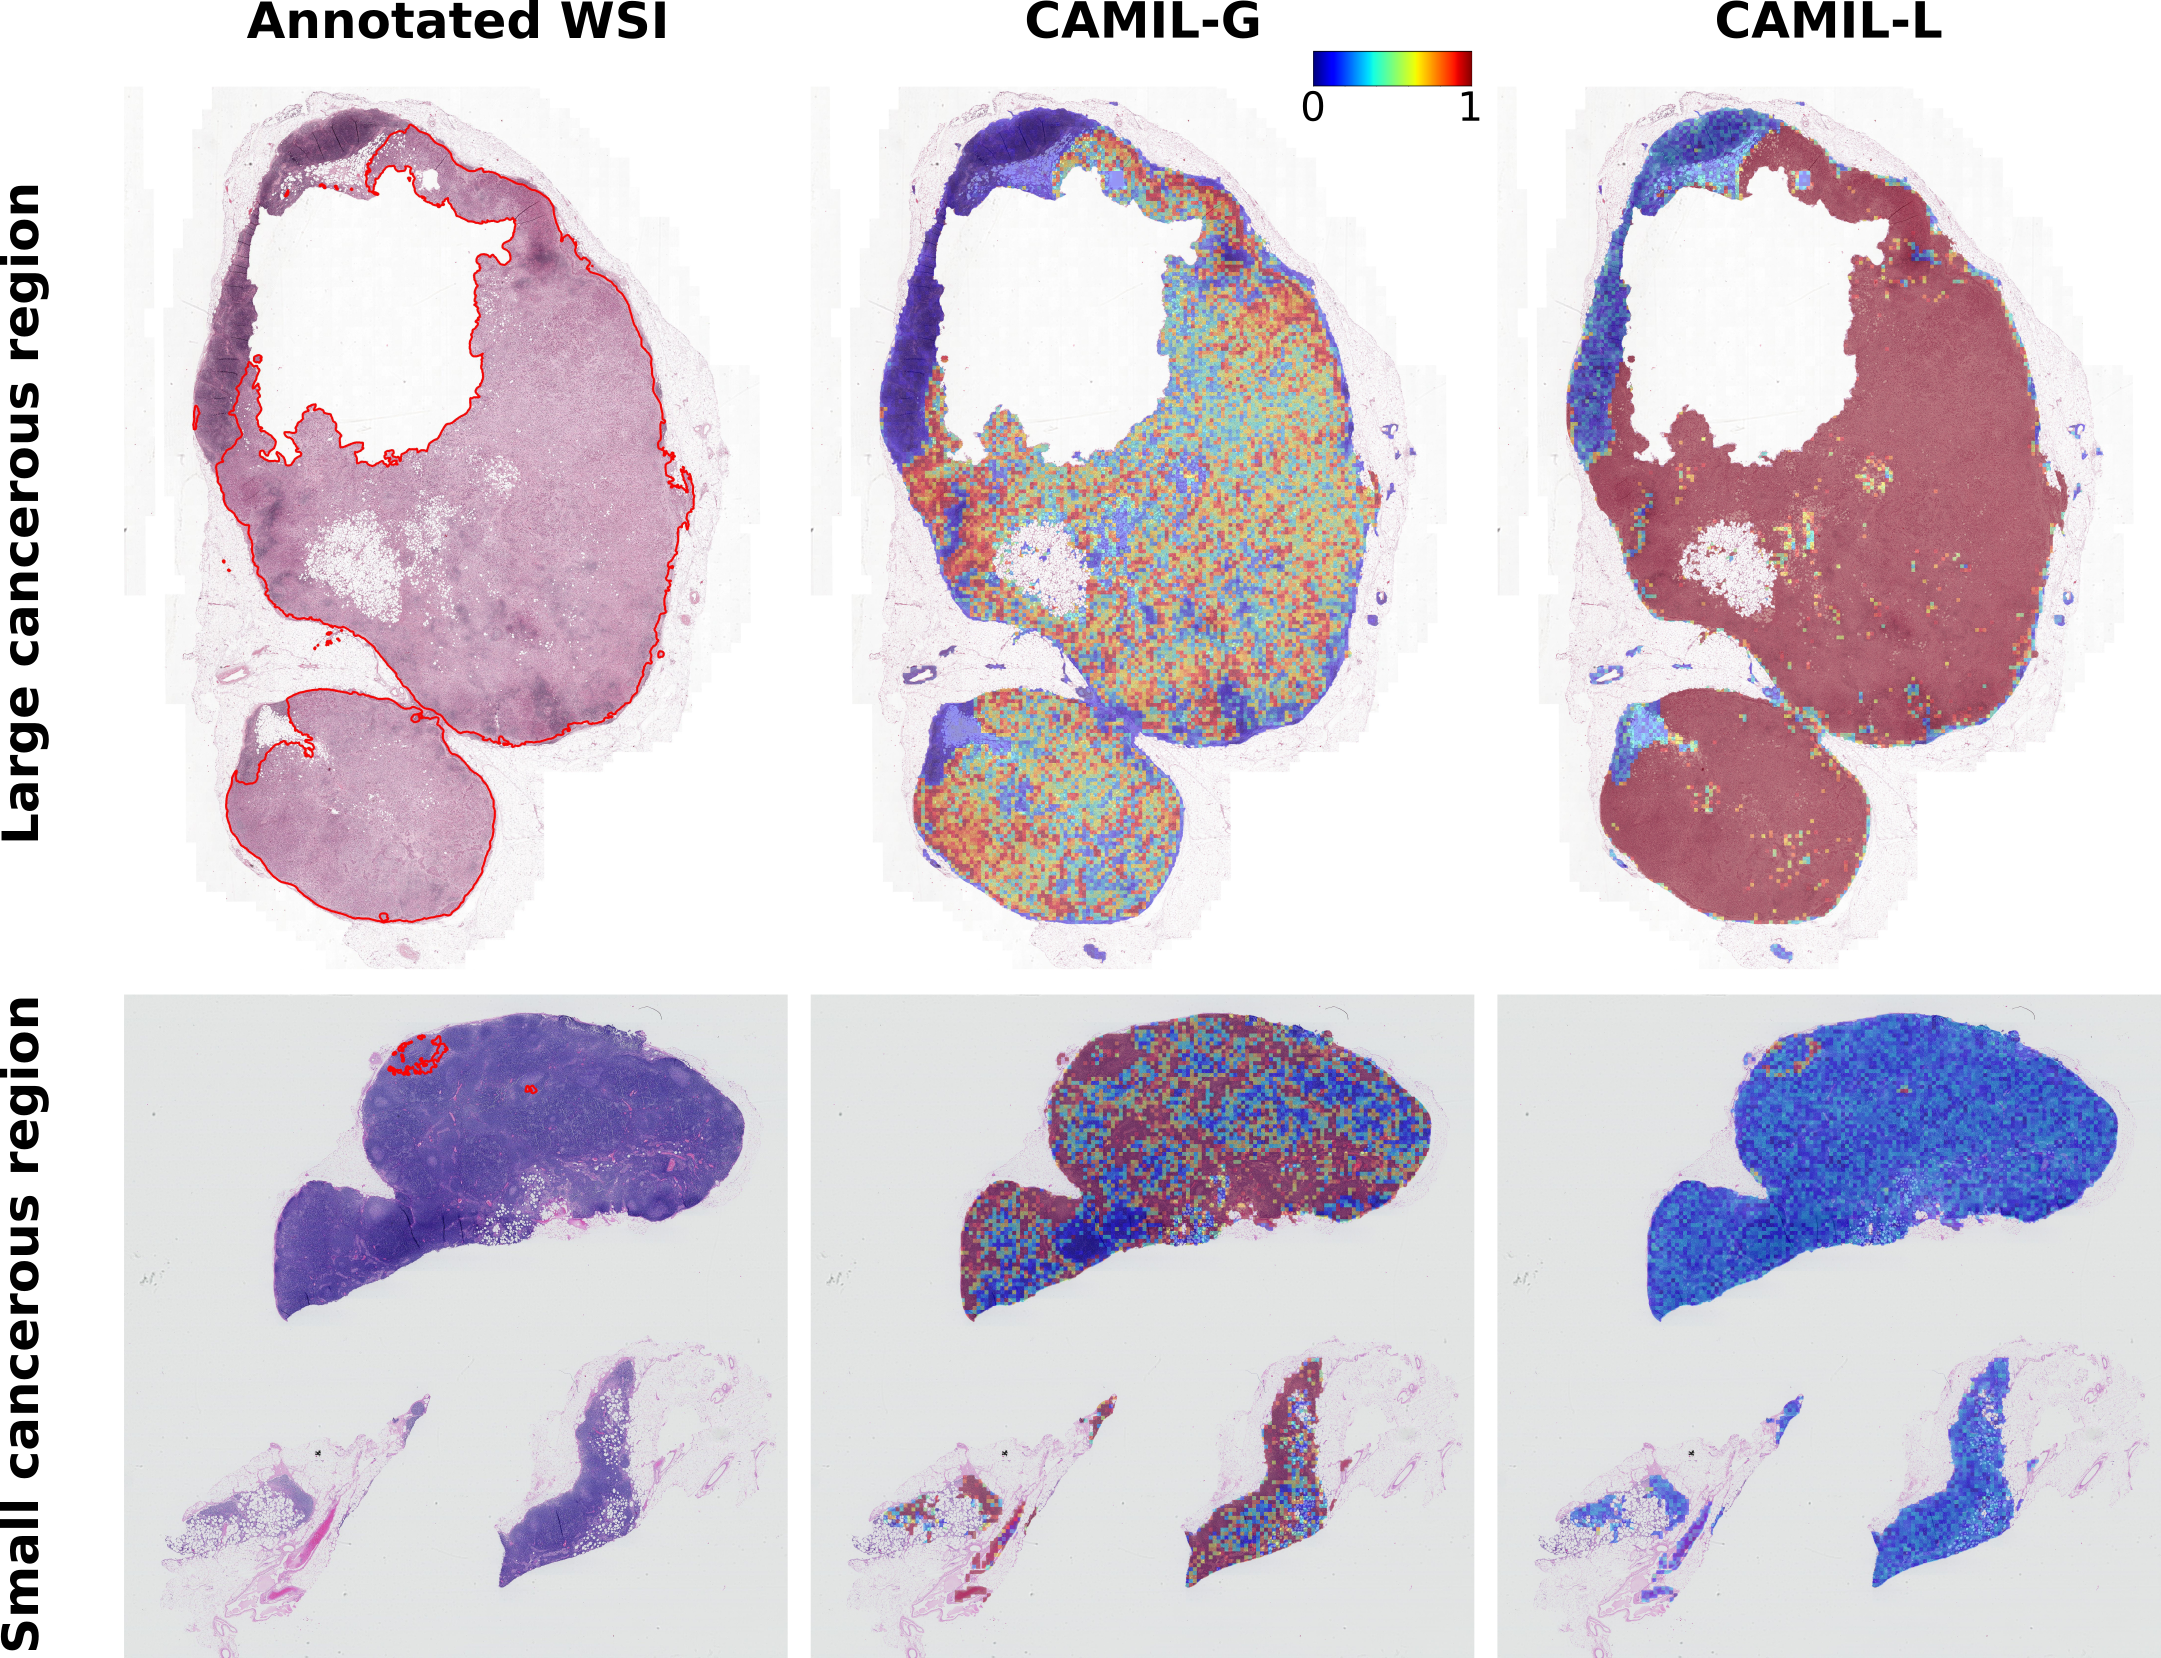
5.1 Visualising global and local concepts
As part of our ablation study, we utilized visualizations to gain insight into the attention maps generated by the two versions of our model. Notably, in Figure 5, CAMIL-G demonstrates commendable performance in understanding global concepts and overall patterns, as it effectively detects tumor regions. However, it struggles when faced with highly localized tumors, as it encounters difficulties capturing intricate, short-term dependencies within the image.
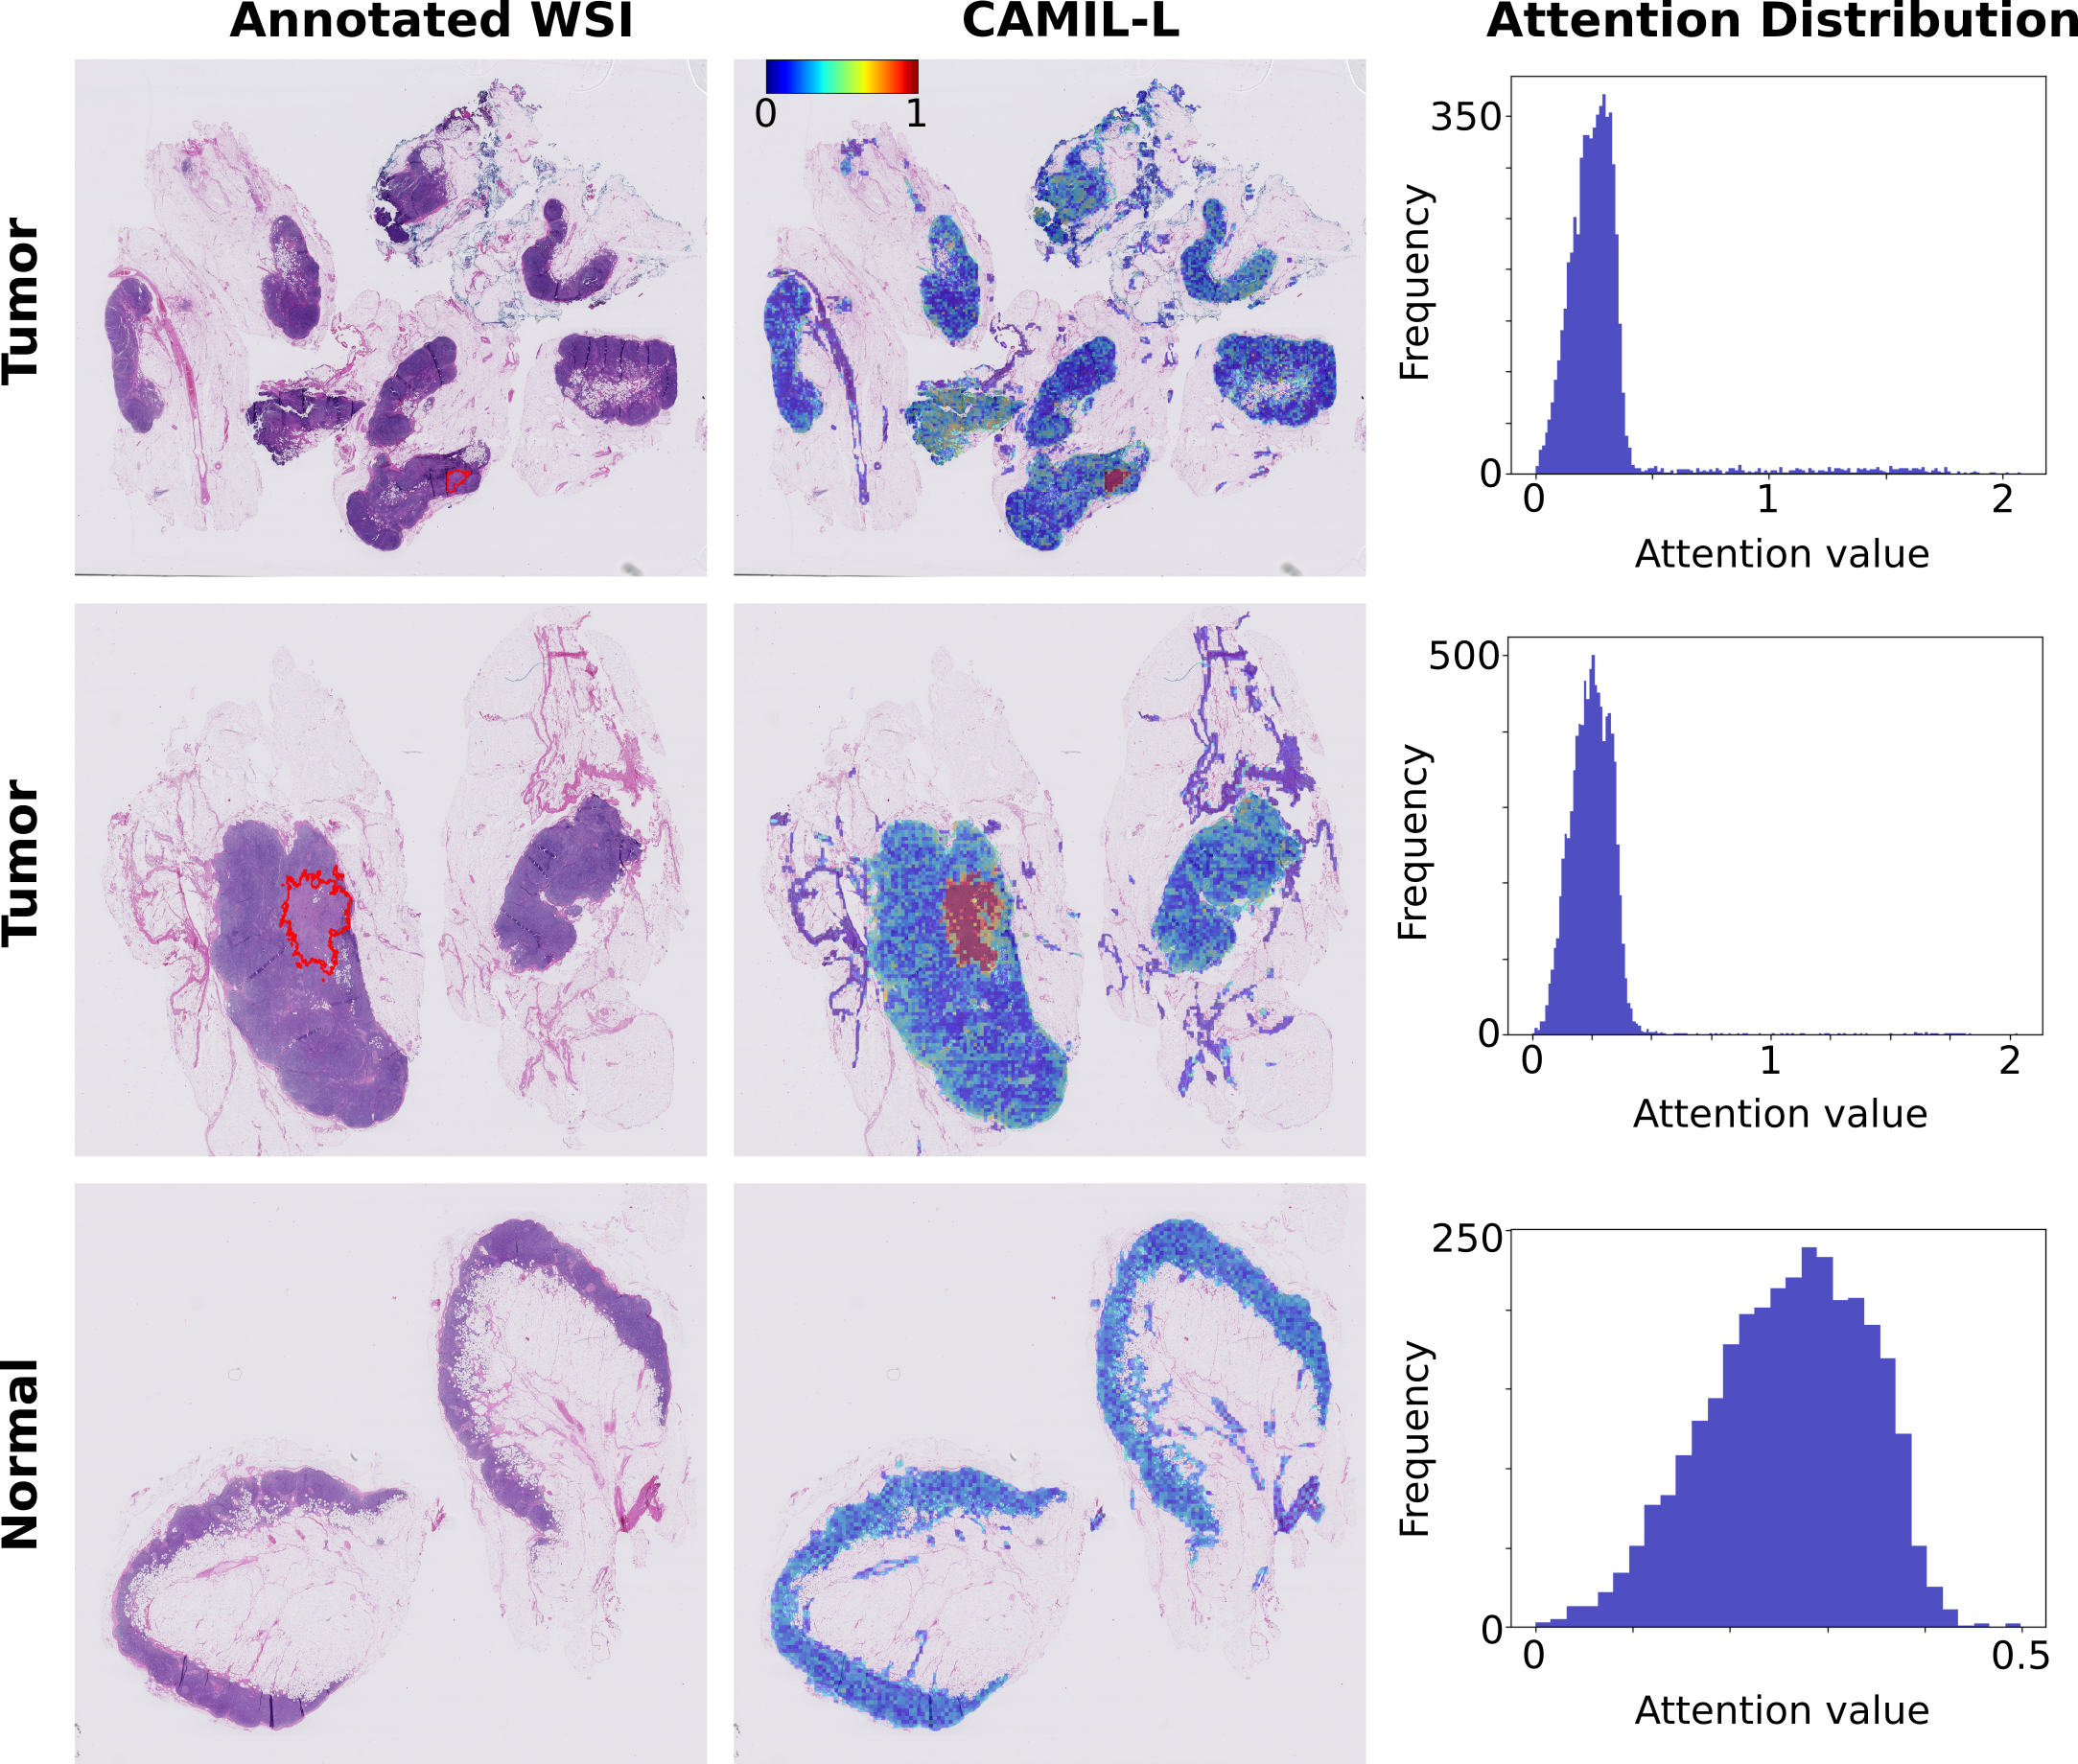
On the other hand, the attention maps produced by CAMIL-L excel in capturing the fine details within a Whole Slide Image (WSI). This proficiency can be attributed to the context-aware module, which utilizes a similarity mask. This mask aggregates attention weights of similar neighboring feature representations, resulting in robust activations. In contrast, less favorable weights, particularly those associated with negative regions, do not contribute as strongly. This observation is substantiated by the histograms of the unnormalized attention coefficients, which are not constrained within the range of 0 to 1 (before applying the softmax function) provided in Figure 5. These histograms underscore a notable pattern: while a significant portion of the attention coefficients falls below the 0.5 threshold, cancerous cases display outliers within the range of 0.5 to 2. These outliers represent stronger activations, which distinctly characterize regions affected by cancer. Conversely, all activations consistently remain below the 0.5 threshold, signifying a reduced emphasis on non-cancerous areas.
6 Conclusion
We have introduced CAMIL, a novel MIL vision transformer-based method that takes into account the context of the tumor microenvironment while determining tile-level labels in Whole Slide Images (WSI), mirroring the approach of a skilled pathologist. This is achieved by employing a unique neighbor-constrained attention mechanism, which assesses the dependencies between tiles within a WSI and incorporates contextual constraints as prior knowledge into the MIL model. We have demonstrated that the use of the transformer and the neighborhood-attention mechanism together are impirative in successfull performance across datasets through our ablation studies. Importantly, CAMIL achieves state-of-the-art across multiple datasets in terms of all ACC, AUC scores as well as interpretability.
References
- Adnan et al. (2020) Mohammed Adnan, Shivam Kalra, and Hamid R. Tizhoosh. Representation learning of histopathology images using graph neural networks. In 2020 IEEE/CVF Conference on Computer Vision and Pattern Recognition, CVPR Workshops 2020, Seattle, WA, USA, June 14-19, 2020, pages 4254–4261. Computer Vision Foundation / IEEE, 2020. doi: 10.1109/CVPRW50498.2020.00502.
- BenTaieb and Hamarneh (2018) Aïcha BenTaieb and Ghassan Hamarneh. Predicting cancer with a recurrent visual attention model for histopathology images. In Alejandro F. Frangi, Julia A. Schnabel, Christos Davatzikos, Carlos Alberola-López, and Gabor Fichtinger, editors, Medical Image Computing and Computer Assisted Intervention - MICCAI 2018 - 21st International Conference, Granada, Spain, September 16-20, 2018, Proceedings, Part II, volume 11071 of Lecture Notes in Computer Science, pages 129–137. Springer, 2018. doi: 10.1007/978-3-030-00934-2“˙15.
- Bianchi et al. (2020) Filippo Maria Bianchi, Daniele Grattarola, and Cesare Alippi. Spectral clustering with graph neural networks for graph pooling. 2020.
- Campanella et al. (2019) Gabriele Campanella, Matthew G. Hanna, Luke Geneslaw, Allen P. Miraflor, Vitor Werneck Krauss Silva, Klaus J. Busam, Edi Brogi, Victor E. Reuter, David S. Klimstra, and Thomas J. Fuchs. Clinical-grade computational pathology using weakly supervised deep learning on whole slide images. Nature Medicine, pages 1–9, 2019.
- Chen et al. (2020) Ting Chen, Simon Kornblith, Mohammad Norouzi, and Geoffrey E. Hinton. A simple framework for contrastive learning of visual representations. In Proceedings of the 37th International Conference on Machine Learning, ICML 2020, 13-18 July 2020, Virtual Event, volume 119 of Proceedings of Machine Learning Research, pages 1597–1607. PMLR, 2020.
- Cheng et al. (2021) Jun Cheng, Yuting Liu, Wei Huang, Wenhui Hong, Lingling Wang, Xiaohui Zhan, Zhi Han, Dong Ni, Kun Huang, and Jie Zhang. Computational Image Analysis Identifies Histopathological Image Features Associated With Somatic Mutations and Patient Survival in Gastric Adenocarcinoma. Frontiers in Oncology, 11, 2021. ISSN 2234-943X.
- Courtiol et al. (2018) Pierre Courtiol, Eric W. Tramel, Marc Sanselme, and Gilles Wainrib. Classification and disease localization in histopathology using only global labels: A weakly-supervised approach. CoRR, abs/1802.02212, 2018.
- Das et al. (2018) Kausik Das, Sailesh Conjeti, Abhijit Guha Roy, Jyotirmoy Chatterjee, and Debdoot Sheet. Multiple instance learning of deep convolutional neural networks for breast histopathology whole slide classification. In 15th IEEE International Symposium on Biomedical Imaging, ISBI 2018, Washington, DC, USA, April 4-7, 2018, pages 578–581. IEEE, 2018. doi: 10.1109/ISBI.2018.8363642.
- Deng et al. (2009) Jia Deng, Wei Dong, Richard Socher, Li-Jia Li, Kai Li, and Li Fei-Fei. Imagenet: A large-scale hierarchical image database. In 2009 IEEE Conference on Computer Vision and Pattern Recognition, pages 248–255, 2009. doi: 10.1109/CVPR.2009.5206848.
- Ehteshami Bejnordi et al. (2017) Babak Ehteshami Bejnordi, Mitko Veta, Paul Johannes van Diest, Bram van Ginneken, Nico Karssemeijer, Geert Litjens, Jeroen A. W. M. van der Laak, and and the CAMELYON16 Consortium. Diagnostic Assessment of Deep Learning Algorithms for Detection of Lymph Node Metastases in Women With Breast Cancer. JAMA, 318(22):2199–2210, December 2017. ISSN 0098-7484. doi: 10.1001/jama.2017.14585. URL https://doi.org/10.1001/jama.2017.14585.
- He et al. (2015) Kaiming He, Xiangyu Zhang, Shaoqing Ren, and Jian Sun. Deep residual learning for image recognition, 2015.
- Hou et al. (2016) Le Hou, Dimitris Samaras, Tahsin M. Kurç, Yi Gao, James E. Davis, and Joel H. Saltz. Patch-based convolutional neural network for whole slide tissue image classification. In 2016 IEEE Conference on Computer Vision and Pattern Recognition, CVPR 2016, Las Vegas, NV, USA, June 27-30, 2016, pages 2424–2433. IEEE Computer Society, 2016. doi: 10.1109/CVPR.2016.266.
- Ilse et al. (2018) Maximilian Ilse, Jakub M. Tomczak, and Max Welling. Attention-based deep multiple instance learning. In Jennifer G. Dy and Andreas Krause, editors, Proceedings of the 35th International Conference on Machine Learning, ICML 2018, Stockholmsmässan, Stockholm, Sweden, July 10-15, 2018, volume 80 of Proceedings of Machine Learning Research, pages 2132–2141, 2018.
- Landini et al. (2020) Gabriel Landini, Giovanni Martinelli, and Filippo Piccinini. Colour deconvolution: stain unmixing in histological imaging. Bioinformatics, 09 2020. ISSN 1367-4803. doi: 10.1093/bioinformatics/btaa847. btaa847.
- Li et al. (2020) Bin Li, Yin Li, and Kevin W. Eliceiri. Dual-stream multiple instance learning network for whole slide image classification with self-supervised contrastive learning. CoRR, abs/2011.08939, 2020. URL https://arxiv.org/abs/2011.08939.
- Li et al. (2021a) Bin Li, Yin Li, and Kevin W. Eliceiri. Dual-stream multiple instance learning network for whole slide image classification with self-supervised contrastive learning. In IEEE Conference on Computer Vision and Pattern Recognition, CVPR 2021, virtual, June 19-25, 2021, pages 14318–14328. Computer Vision Foundation / IEEE, 2021a. doi: 10.1109/CVPR46437.2021.01409. URL https://openaccess.thecvf.com/content/CVPR2021/html/Li_Dual-Stream_Multiple_Instance_Learning_Network_for_Whole_Slide_Image_Classification_CVPR_2021_paper.html.
- Li et al. (2021b) Jiayun Li, Wenyuan Li, Anthony E. Sisk, Huihui Ye, W. Dean Wallace, William Speier, and Corey W. Arnold. A multi-resolution model for histopathology image classification and localization with multiple instance learning. Comput. Biol. Medicine, 131:104253, 2021b. doi: 10.1016/j.compbiomed.2021.104253.
- Lu et al. (2021) Ming Y Lu, Drew FK Williamson, Tiffany Y Chen, Richard J Chen, Matteo Barbieri, and Faisal Mahmood. Data-efficient and weakly supervised computational pathology on whole-slide images. Nature Biomedical Engineering, 5(6):555–570, 2021.
- Melendez et al. (2015) Jaime Melendez, Bram van Ginneken, Pragnya Maduskar, Rick H. H. M. Philipsen, Klaus Reither, Marianne Breuninger, Ifedayo M. O. Adetifa, Rahmatulai Maane, Helen Ayles, and Clara I. Sánchez. A novel multiple-instance learning-based approach to computer-aided detection of tuberculosis on chest x-rays. IEEE Trans. Medical Imaging, 34(1):179–192, 2015. doi: 10.1109/TMI.2014.2350539.
- Morales et al. (2021) Sandra Morales, Kjersti Engan, and Valery Naranjo. Artificial intelligence in computational pathology - challenges and future directions. Digit. Signal Process., 119:103196, 2021. doi: 10.1016/j.dsp.2021.103196.
- Quellec et al. (2016) Gwénolé Quellec, Mathieu Lamard, Michel Cozic, Gouenou Coatrieux, and Guy Cazuguel. Multiple-instance learning for anomaly detection in digital mammography. IEEE Trans. Medical Imaging, 35(7):1604–1614, 2016. doi: 10.1109/TMI.2016.2521442.
- Shao et al. (2021a) Zhuchen Shao, Hao Bian, Yang Chen, Yifeng Wang, Jian Zhang, Xiangyang Ji, and Yongbing Zhang. Transmil: Transformer based correlated multiple instance learning for whole slide image classification. In Marc’Aurelio Ranzato, Alina Beygelzimer, Yann N. Dauphin, Percy Liang, and Jennifer Wortman Vaughan, editors, Advances in Neural Information Processing Systems 34: Annual Conference on Neural Information Processing Systems 2021, NeurIPS 2021, December 6-14, 2021, virtual, pages 2136–2147, 2021a.
- Shao et al. (2021b) Zhuchen Shao, Hao Bian, Yang Chen, Yifeng Wang, Jian Zhang, Xiangyang Ji, and Yongbing Zhang. TransMIL: Transformer based correlated multiple instance learning for whole slide image classification. In A. Beygelzimer, Y. Dauphin, P. Liang, and J. Wortman Vaughan, editors, Advances in Neural Information Processing Systems, 2021b. URL https://openreview.net/forum?id=LKUfuWxajHc.
- Sharma et al. (2021) Yash Sharma, Aman Shrivastava, Lubaina Ehsan, Christopher A. Moskaluk, Sana Syed, and Donald E. Brown. Cluster-to-conquer: A framework for end-to-end multi-instance learning for whole slide image classification. In Mattias P. Heinrich, Qi Dou, Marleen de Bruijne, Jan Lellmann, Alexander Schlaefer, and Floris Ernst, editors, Medical Imaging with Deep Learning, 7-9 July 2021, Lübeck, Germany, volume 143 of Proceedings of Machine Learning Research, pages 682–698. PMLR, 2021.
- Srinidhi et al. (2019) Chetan L. Srinidhi, Ozan Ciga, and Anne L. Martel. Deep neural network models for computational histopathology: A survey. CoRR, abs/1912.12378, 2019.
- Tellez et al. (2021) David Tellez, Geert Litjens, Jeroen van der Laak, and Francesco Ciompi. Neural image compression for gigapixel histopathology image analysis. IEEE Trans. Pattern Anal. Mach. Intell., 43(2):567–578, 2021. doi: 10.1109/TPAMI.2019.2936841.
- Tong et al. (2014) Tong Tong, Robin Wolz, Qinquan Gao, Ricardo Guerrero, Joseph V. Hajnal, and Daniel Rueckert. Multiple instance learning for classification of dementia in brain MRI. Medical Image Anal., 18(5):808–818, 2014. doi: 10.1016/j.media.2014.04.006.
- Tu et al. (2019) Ming Tu, Jing Huang, Xiaodong He, and Bowen Zhou. Multiple instance learning with graph neural networks. CoRR, abs/1906.04881, 2019.
- Vaswani et al. (2017) Ashish Vaswani, Noam Shazeer, Niki Parmar, Jakob Uszkoreit, Llion Jones, Aidan N. Gomez, Lukasz Kaiser, and Illia Polosukhin. Attention is all you need. In Isabelle Guyon, Ulrike von Luxburg, Samy Bengio, Hanna M. Wallach, Rob Fergus, S. V. N. Vishwanathan, and Roman Garnett, editors, Advances in Neural Information Processing Systems 30: Annual Conference on Neural Information Processing Systems 2017, December 4-9, 2017, Long Beach, CA, USA, pages 5998–6008, 2017.
- Wang et al. (2021) Xiaodong Wang, Ying Chen, Yunshu Gao, Huiqing Zhang, Zehui Guan, Zhou Dong, Yuxuan Zheng, Jiarui Jiang, Haoqing Yang, Liming Wang, Xianming Huang, Lirong Ai, Wenlong Yu, Hongwei Li, Changsheng Dong, Zhou Zhou, Xiyang Liu, and Guanzhen Yu. Predicting gastric cancer outcome from resected lymph node histopathology images using deep learning. Nature Communications, 12(1):1637, March 2021. ISSN 2041-1723. doi: 10.1038/s41467-021-21674-7. Number: 1 Publisher: Nature Publishing Group.
- Wang et al. (2018) Xinggang Wang, Yongluan Yan, Peng Tang, Xiang Bai, and Wenyu Liu. Revisiting multiple instance neural networks. Pattern Recognit., 74:15–24, 2018. doi: 10.1016/j.patcog.2017.08.026.
- Xie et al. (2020) Chensu Xie, Hassan Muhammad, Chad M. Vanderbilt, Raul Caso, Dig Vijay Kumar Yarlagadda, Gabriele Campanella, and Thomas J. Fuchs. Beyond classification: Whole slide tissue histopathology analysis by end-to-end part learning. In Tal Arbel, Ismail Ben Ayed, Marleen de Bruijne, Maxime Descoteaux, Hervé Lombaert, and Christopher Pal, editors, International Conference on Medical Imaging with Deep Learning, MIDL 2020, 6-8 July 2020, Montréal, QC, Canada, volume 121 of Proceedings of Machine Learning Research, pages 843–856, 2020.
- Xiong et al. (2021) Yunyang Xiong, Zhanpeng Zeng, Rudrasis Chakraborty, Mingxing Tan, Glenn Fung, Yin Li, and Vikas Singh. Nyströmformer: A nyström-based algorithm for approximating self-attention. In Thirty-Fifth AAAI Conference on Artificial Intelligence, AAAI 2021, Thirty-Third Conference on Innovative Applications of Artificial Intelligence, IAAI 2021, The Eleventh Symposium on Educational Advances in Artificial Intelligence, EAAI 2021, Virtual Event, February 2-9, 2021, pages 14138–14148. AAAI Press, 2021. URL https://ojs.aaai.org/index.php/AAAI/article/view/17664.
- Xu et al. (2019) Gang Xu, Zhigang Song, Zhuo Sun, Calvin Ku, Zhe Yang, Cancheng Liu, Shuhao Wang, Jianpeng Ma, and Wei Xu. CAMEL: A weakly supervised learning framework for histopathology image segmentation. In 2019 IEEE/CVF International Conference on Computer Vision, ICCV 2019, Seoul, Korea (South), October 27 - November 2, 2019, pages 10681–10690, 2019. doi: 10.1109/ICCV.2019.01078.
- Xu et al. (2014) Yan Xu, Jun-Yan Zhu, Eric I-Chao Chang, Maode Lai, and Zhuowen Tu. Weakly supervised histopathology cancer image segmentation and classification. Medical Image Anal., 18(3):591–604, 2014. doi: 10.1016/j.media.2014.01.010.
- Yao et al. (2020) Jiawen Yao, Xinliang Zhu, Jitendra Jonnagaddala, Nicholas J. Hawkins, and Junzhou Huang. Whole slide images based cancer survival prediction using attention guided deep multiple instance learning networks. Medical Image Anal., 65:101789, 2020. doi: 10.1016/j.media.2020.101789.
- Zhang et al. (2022) Hongrun Zhang, Yanda Meng, Yitian Zhao, Yihong Qiao, Xiaoyun Yang, Sarah E. Coupland, and Yalin Zheng. DTFD-MIL: double-tier feature distillation multiple instance learning for histopathology whole slide image classification. In IEEE/CVF Conference on Computer Vision and Pattern Recognition, CVPR 2022, New Orleans, LA, USA, June 18-24, 2022, pages 18780–18790, 2022. doi: 10.1109/CVPR52688.2022.01824.
- Zhang et al. (2021) Jingwei Zhang, Ke Ma, John S. Van Arnam, Rajarsi Gupta, Joel H. Saltz, Maria Vakalopoulou, and Dimitris Samaras. A joint spatial and magnification based attention framework for large scale histopathology classification. In IEEE Conference on Computer Vision and Pattern Recognition Workshops, CVPR Workshops 2021, virtual, June 19-25, 2021, pages 3776–3784. Computer Vision Foundation / IEEE, 2021. doi: 10.1109/CVPRW53098.2021.00418.
- (39) Yu Zhao, Fan Yang, Yuqi Fang, Hailing Liu, Niyun Zhou, Jun Zhang, Jiarui Sun, Sen Yang, Bjoern H. Menze, Xinjuan Fan, and Jianhua Yao. Predicting lymph node metastasis using histopathological images based on multiple instance learning with deep graph convolution. In 2020 IEEE/CVF Conference on Computer Vision and Pattern Recognition, CVPR 2020, Seattle, WA, USA, June 13-19, 2020, pages 4836–4845. Computer Vision Foundation / IEEE. doi: 10.1109/CVPR42600.2020.00489.
- Zheng et al. (2022) Yi Zheng, Rushin H. Gindra, Emily J. Green, Eric J. Burks, Margrit Betke, Jennifer E. Beane, and Vijaya B. Kolachalama. A graph-transformer for whole slide image classification. IEEE Trans. Medical Imaging, 41(11):3003–3015, 2022. doi: 10.1109/TMI.2022.3176598. URL https://doi.org/10.1109/TMI.2022.3176598.
- Zhou et al. (2021) Changjiang Zhou, Yi Jin, Yuzong Chen, Shan Huang, Rengpeng Huang, Yuhong Wang, Youcai Zhao, Yao Chen, Lingchuan Guo, and Jun Liao. Histopathology classification and localization of colorectal cancer using global labels by weakly supervised deep learning. Comput. Medical Imaging Graph., 88:101861, 2021. doi: 10.1016/j.compmedimag.2021.101861.