A Feasibility Study on Indoor Localization and Multi-person Tracking Using Sparsely Distributed Camera Network with Edge Computing
Abstract
Camera-based activity monitoring systems are becoming an attractive solution for smart building applications with the advances in computer vision and edge computing technologies. In this paper, we present a feasibility study and systematic analysis of a camera-based indoor localization and multi-person tracking system implemented on edge computing devices within a large indoor space. To this end, we deployed an end-to-end edge computing pipeline that utilizes multiple cameras to achieve localization, body orientation estimation and tracking of multiple individuals within a large therapeutic space spanning , all while maintaining a strong focus on preserving privacy. Our pipeline consists of 39 edge computing camera systems equipped with Tensor Processing Units (TPUs) placed in the indoor space’s ceiling. To ensure the privacy of individuals, a real-time multi-person pose estimation algorithm runs on the TPU of the computing camera system. This algorithm extracts poses and bounding boxes, which are utilized for indoor localization, body orientation estimation, and multi-person tracking 111https://github.com/cliffordlab/EdgeCameraTracking. Our pipeline demonstrated an average localization error of 1.41 meters, a multiple-object tracking accuracy score of 88.6%, and a mean absolute body orientation error of 29°. These results shows that localization and tracking of individuals in a large indoor space is feasible even with the privacy constrains.
Indoor Localization, Multi-person Tracking, Body Orientation Estimation, Computer Vision, Edge Computing, Cloud Computing.
1 Introduction
Indoor localization and tracking is an active research area to support various applications, such as smart hospitals [1, 2], smart offices [3], or customer analysis in shopping mall [4]. A wide range of sensors have been used to simultaneously detect the whereabouts and movement of multiple people in indoor spaces over the past two decades, including radio-frequency identification (RFID) [5], infrared (IR) [6], WiFi [7], and Bluetooth [8]. Recent advances in multi-person pose estimation [9, 10] and tracking have led to the use of cameras to monitor indoor activities [11, 12], and vision-based approaches have proven to be very effective in capturing accurate and detailed movements continuously over time. However, most studies have only examined a few cameras in small rooms and have not studied a system that integrates localization, tracking, and body orientation estimation techniques in a large indoor space required to understand fine-grained activities comprehensively [13, 14, 1]. Advancements in edge computing now allow for low-cost, powerful devices to monitor activity in existing buildings [15, 16, 17].
In this work, we present a feasibility study and systematic analysis of a camera-based indoor localization and tracking system to monitor multiple people across a wide indoor space using an edge computing framework. To carry out this study, we deployed a multi-camera edge computing pipeline designed to estimate locations, track individuals, and ascertain their body orientations in a vast therapeutic indoor space with a strong emphasis on safeguarding privacy. We deployed 39 cameras sparsely positioned throughout an large indoor space spanning which contains diverse functional areas, such as a gym, library, and kitchen. These cameras were connected to edge computing units, specifically Raspberry Pi v4 B devices. We adopted a real-time processing approach using Google Coral Tensor Processing Units (TPUs) connected to the edge computing units. These TPUs automatically process raw color frames obtained from the cameras to detect 2D poses (as described in [18]). This information is then used to estimate the positions and orientations of people within the indoor space, and the original raw frames are discarded. The estimated positions and orientations from all the cameras are combined to track the movement of individuals. Using our camera infrastructure, we aim to provide a comprehensive analysis of the camera installation and its relations with the performance of our system in various activity scenarios. We expect this work to provide practical guidelines for practitioners when installing a multi-view camera-based activity monitoring system using edge computing frameworks in existing facilities.
2 Method & Materials
2.1 Study Site
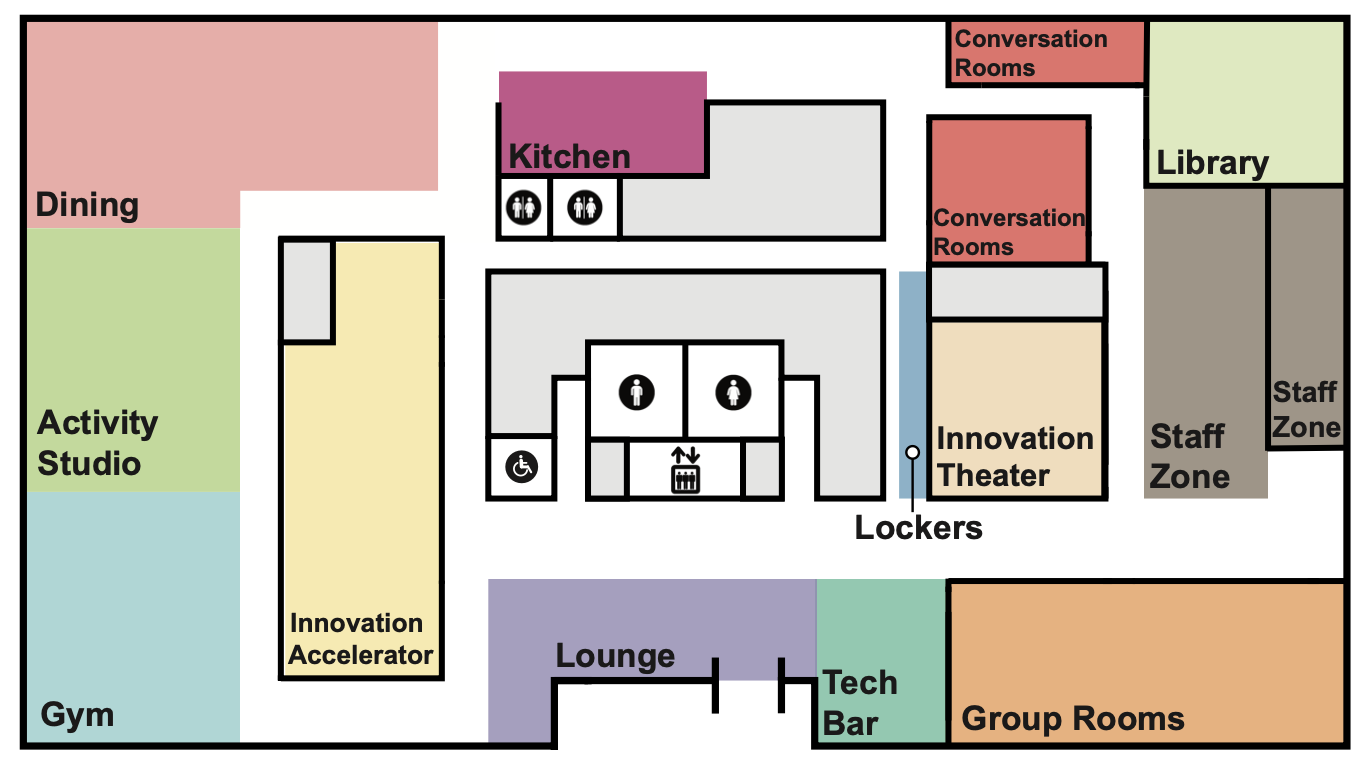
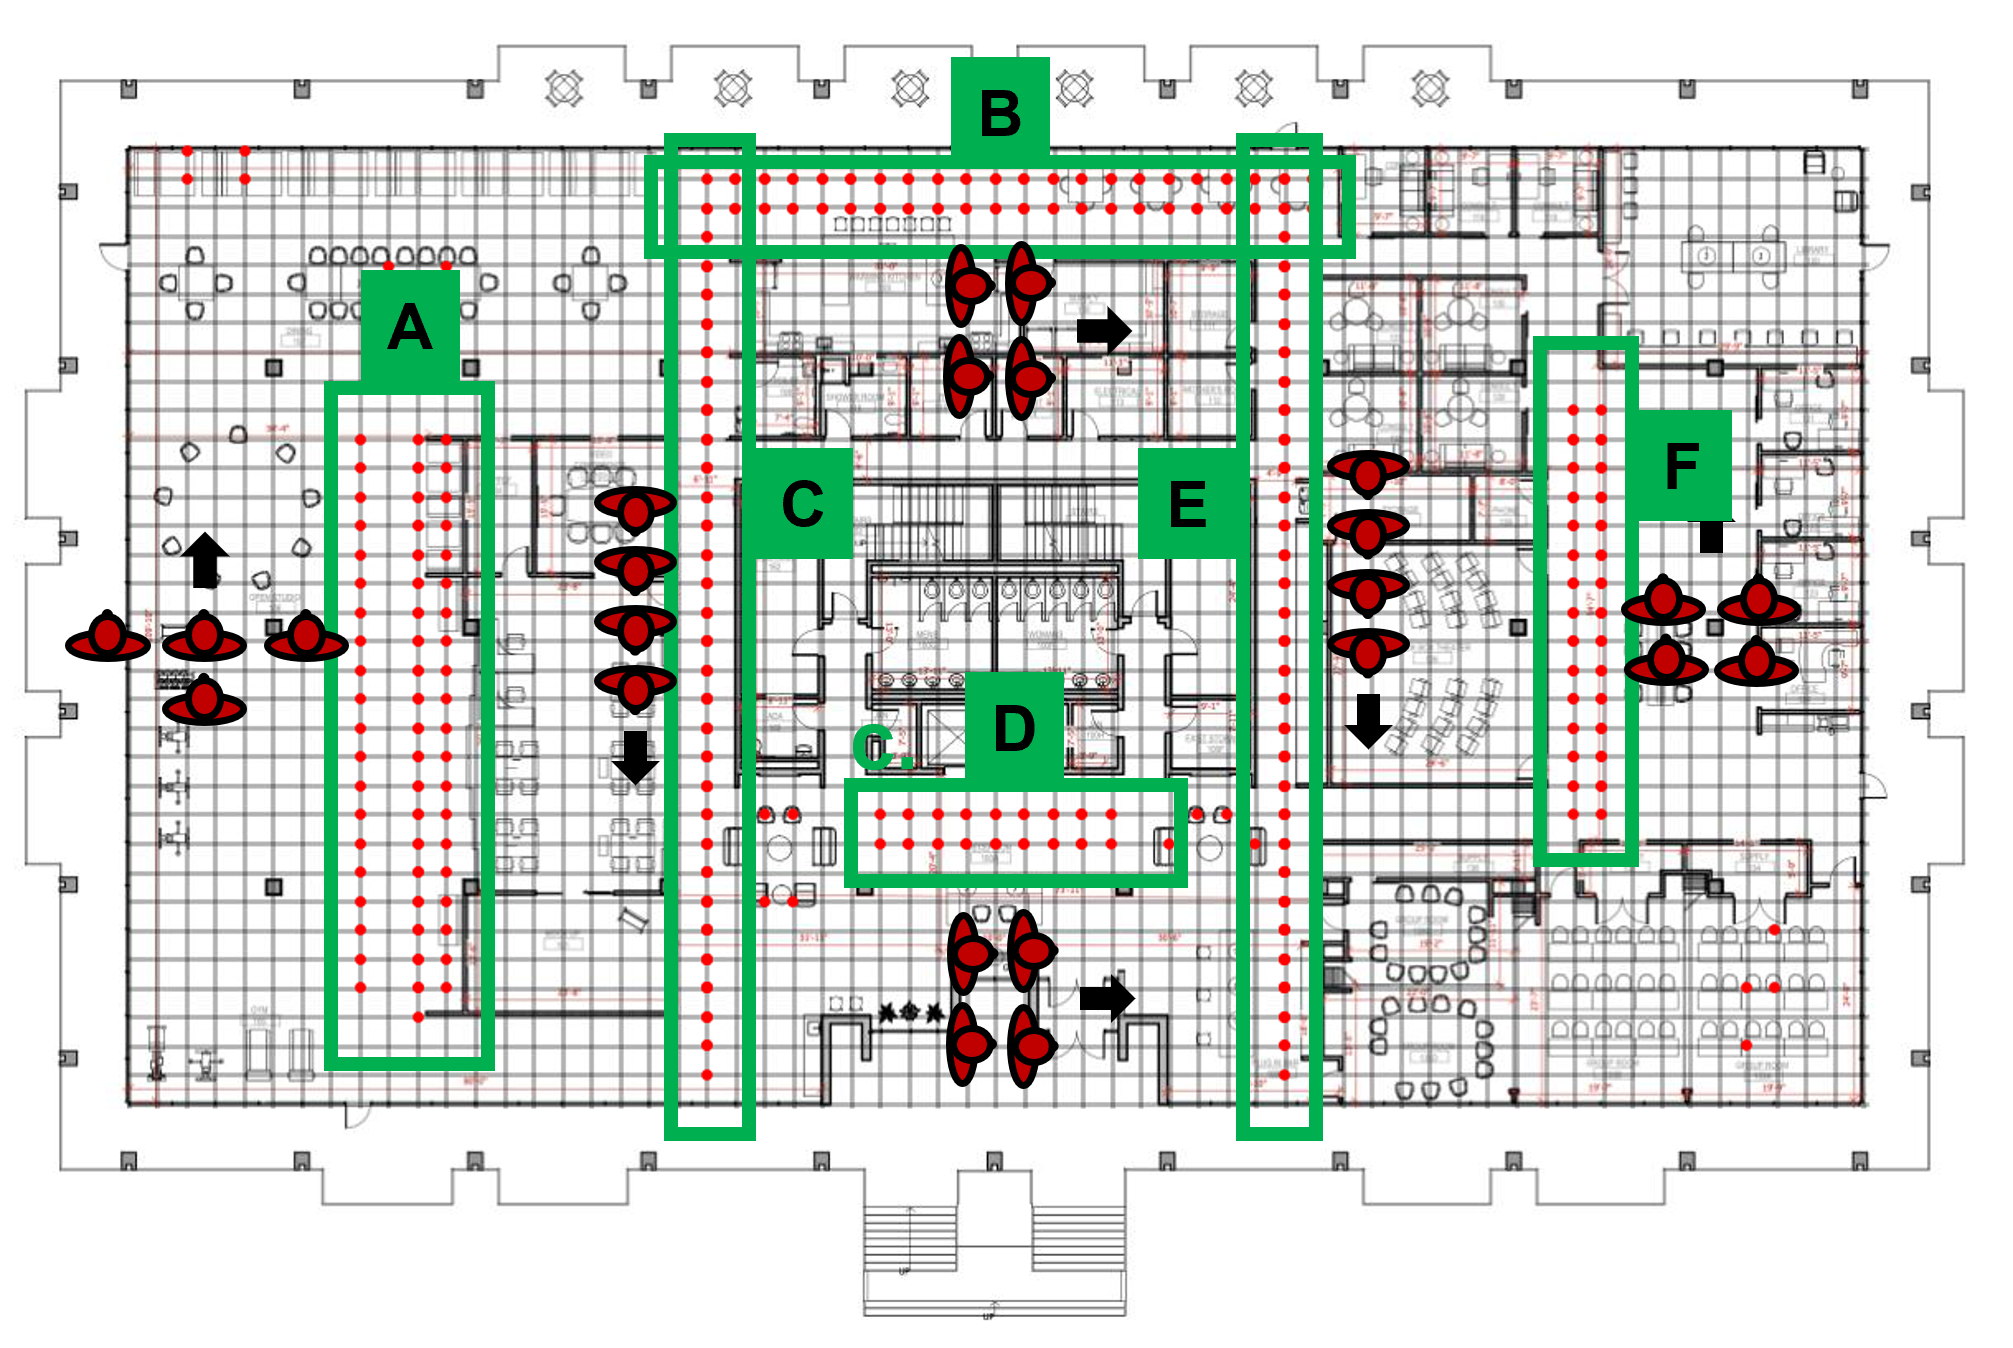
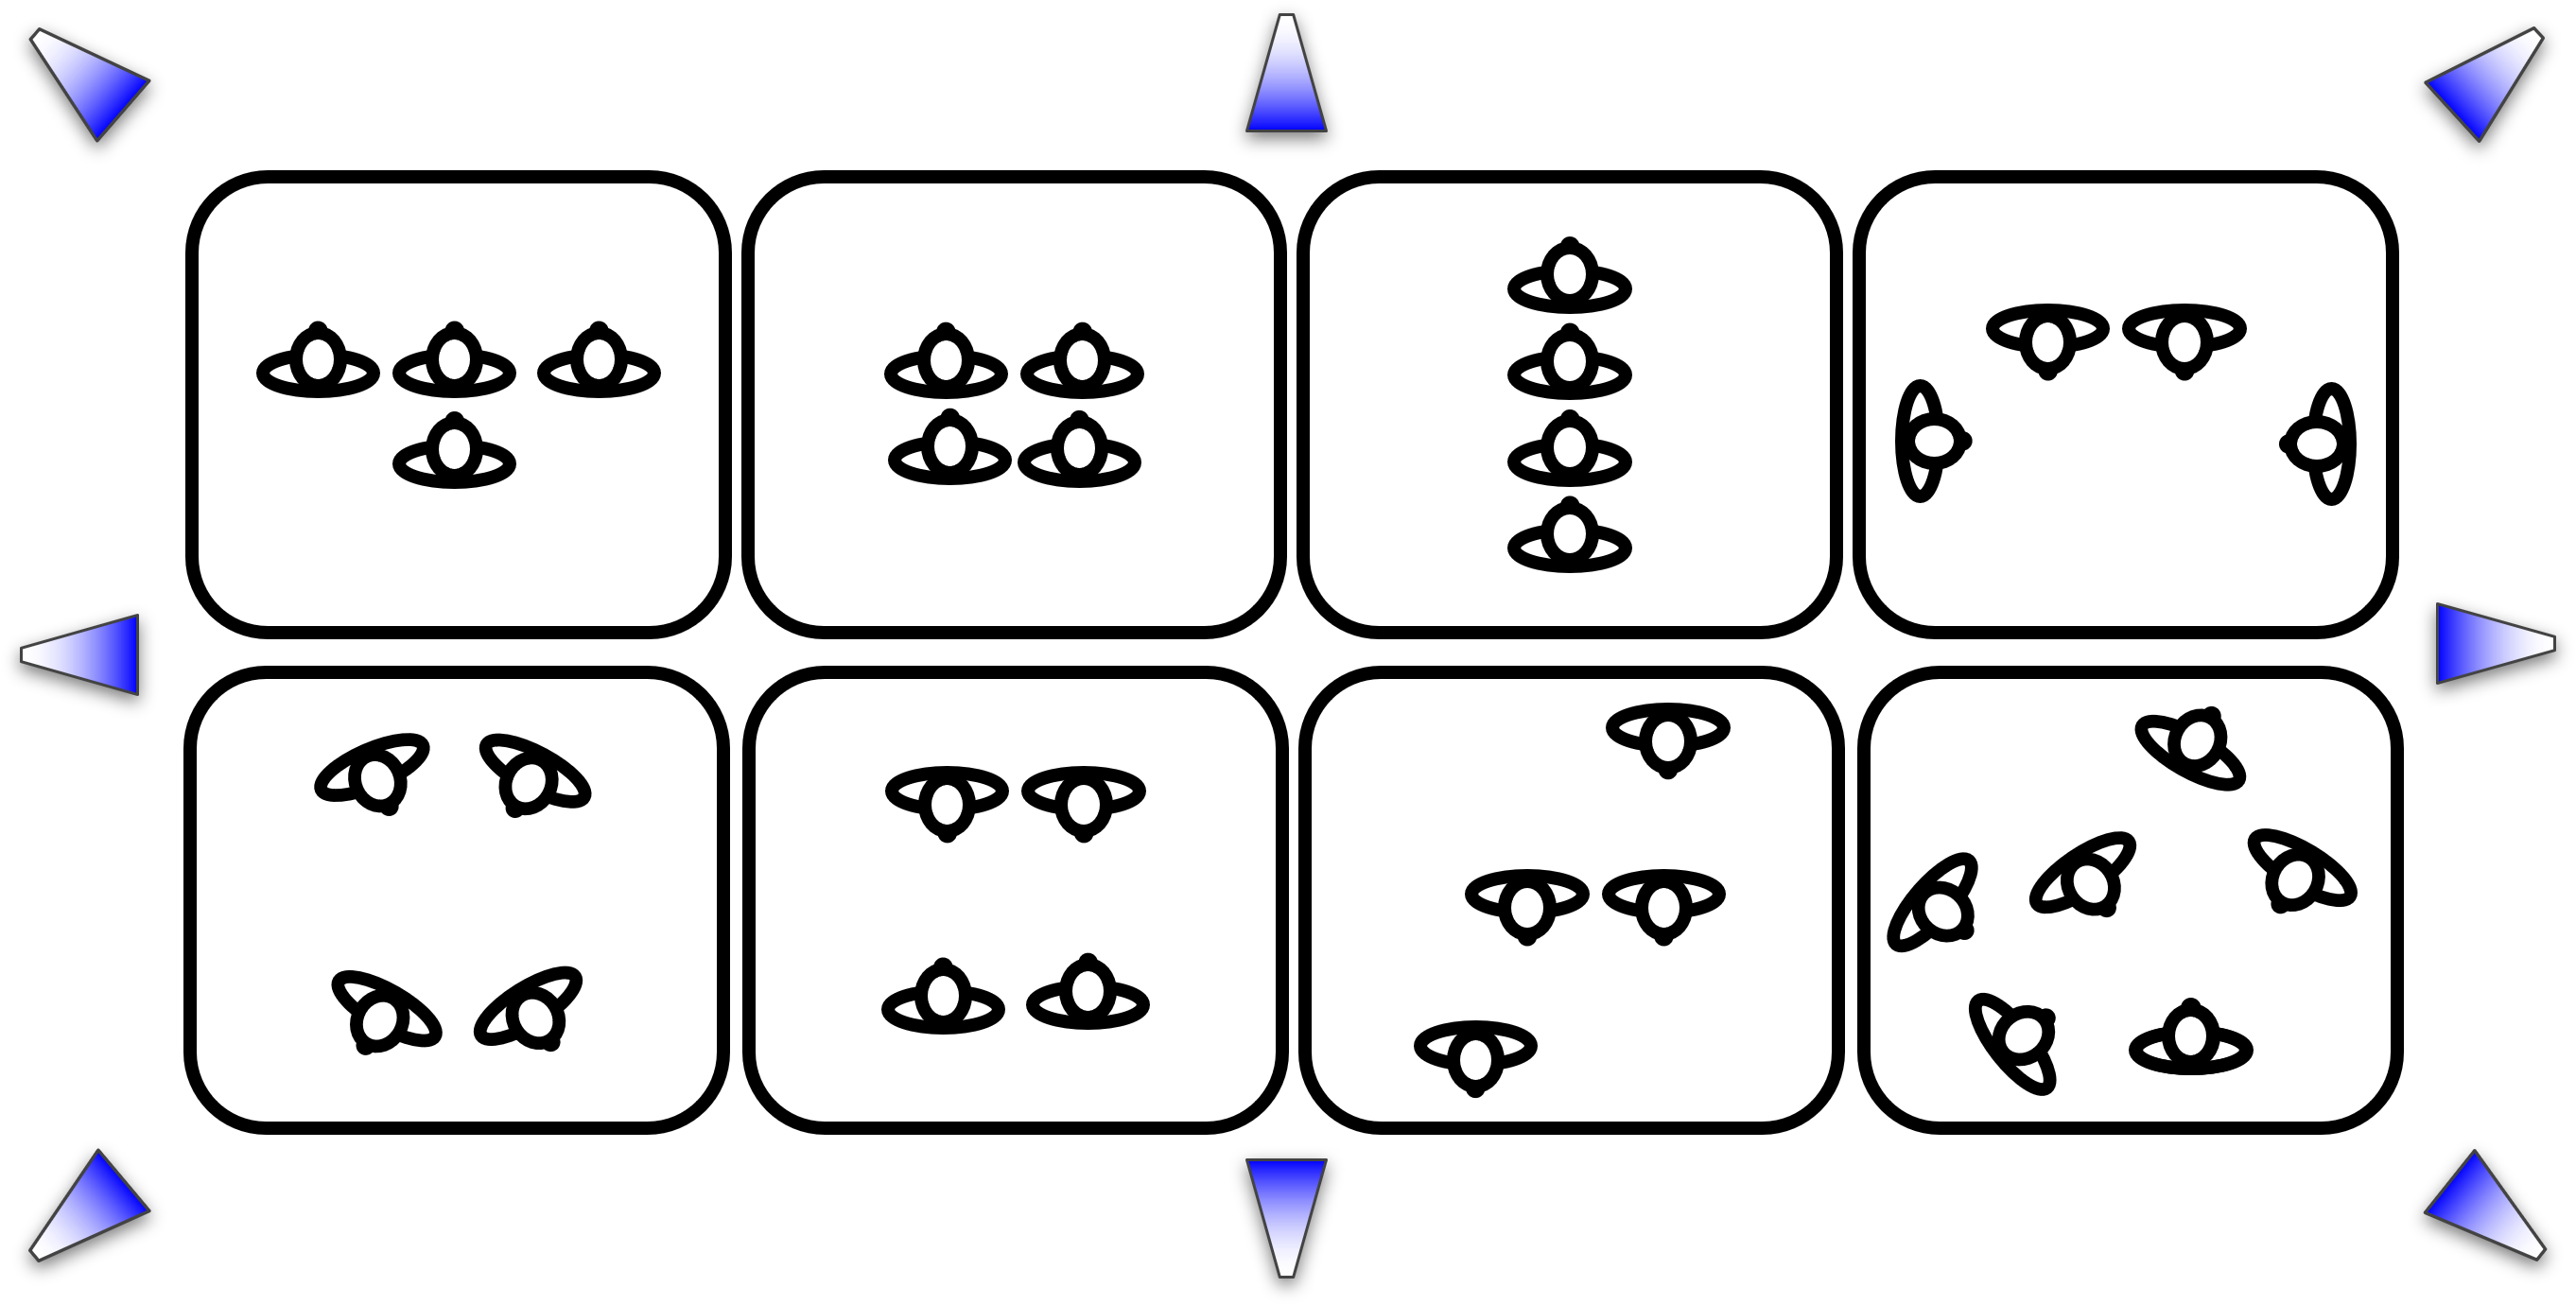
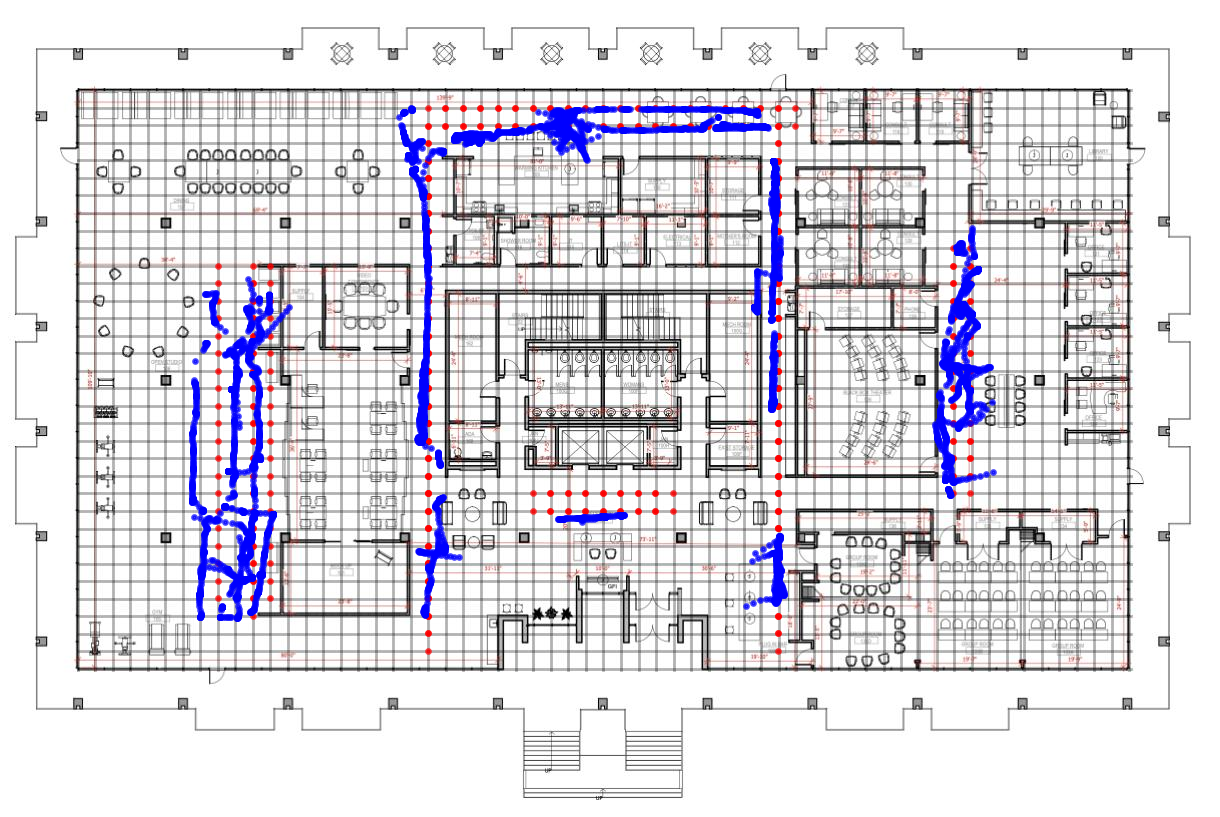
Our site was designed to promote the involvement of older adults in a range of therapeutic activities, including physical exercise and memory training. It also provides opportunities for social interaction, such as shared meals and comfortable lounge areas. The study site consists of diverse functional regions as shown in Figure 1. The Activity Area (A) encompasses both the Activity Studio and Gym, promoting physical exercise. The Kitchen (B) covers the upper corridor between the dining area’s right boundary and the conversation room’s left boundary, encouraging independent cooking activities. The left corridor (C) runs alongside a room called the Innovation Accelerator, while the Right Corridor (E) is situated next to the Lockers, to the left of the Innovation Theater. The lounge (D) extends from the elevator area to the front door, and the Staff area (F) comprises the section on the building’s right side, where staff offices are located.
2.2 Distributed Camera Network using Edge Computing
 (a)
(a)
 (b)
(c)
(b)
(c)
2.2.1 Camera Configuration
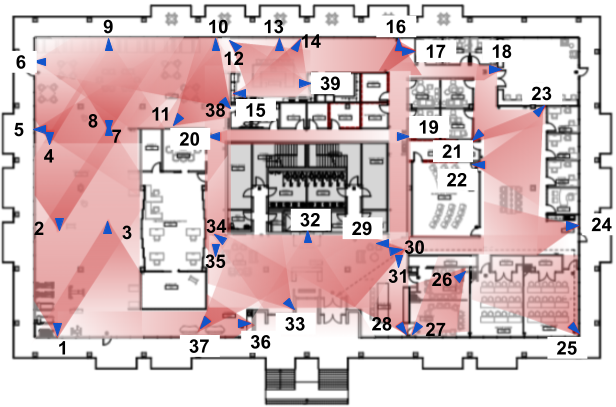
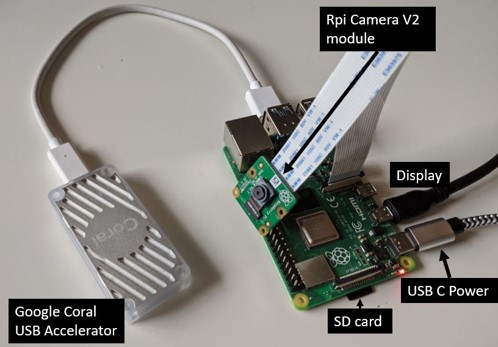
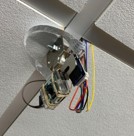
Figure 2a shows the locations (BLUE) of 39 low-cost () edge computing and camera devices (Figure 2b) and their viewpoints (RED). These cameras effectively provide coverage over the entire study site where subjects have consented to have their activities monitored. The cameras along with the edge devices were placed in the ceiling of the indoor environment away from the direct line of sight of visitors to prevent them from feeling overly self-conscious, as shown in Figure 2c. These edge devices were connected to the closest available power and network sources in the ceiling through USB-C power cable and ethernet cable for data transfer. Depending on the availability of power and network sources, some locations, such as kitchen or staff areas, are covered by multiple cameras, and other locations, such as long corridors, are covered by a single or two cameras. The cameras installed above visitors’ eyesight make it easier for visitors to comply with the proposed instrumentation of cameras for activity monitoring.

2.2.2 Secure Computing Network Architecture
The complete computing setup comprises four key components: the off-site cloud server, the on-site fog server, the edge computing network infrastructure, and the array of 39 edge computing camera devices. Here, on-site and off-site servers refer to servers that are physically present in the study site and servers places outside of the study site respectively. This configuration is shown in Figure 3.
Real-time estimation of 2D poses, composed of 17 keypoints following the MS COCO format [19], and bounding boxes occurs at a frame rate of 1Hz using the TPU on the edge computing device. Bounding box images are temporarily retained on the on-site fog computing node for up to one hour to facilitate body orientation estimation. They are then discarded. The raw frames are immediately discarded from the edge computing device after the 2D poses are extracted and do not get sent to the on-site fog server. This ensures privacy of individuals in the study site and prevents the capture, storage, or transmission of sensitive or identifiable information, such as faces or nudity. The 2D poses and body orientations of a single day, specifically from 8 AM to 7 PM, are stored on the fog server and this data is routinely synchronized with the off-site cloud server during the night, typically between 12 AM and 7 AM. The duration of the nightly synchronization can change depending on the volume of data collected during the day. It’s worth noting that the fog server complies with the Health Insurance Portability and Accountability Act (HIPAA) regulations.
2.3 Monitoring Movement in Built-in Environment
2.3.1 Overall Pipeline
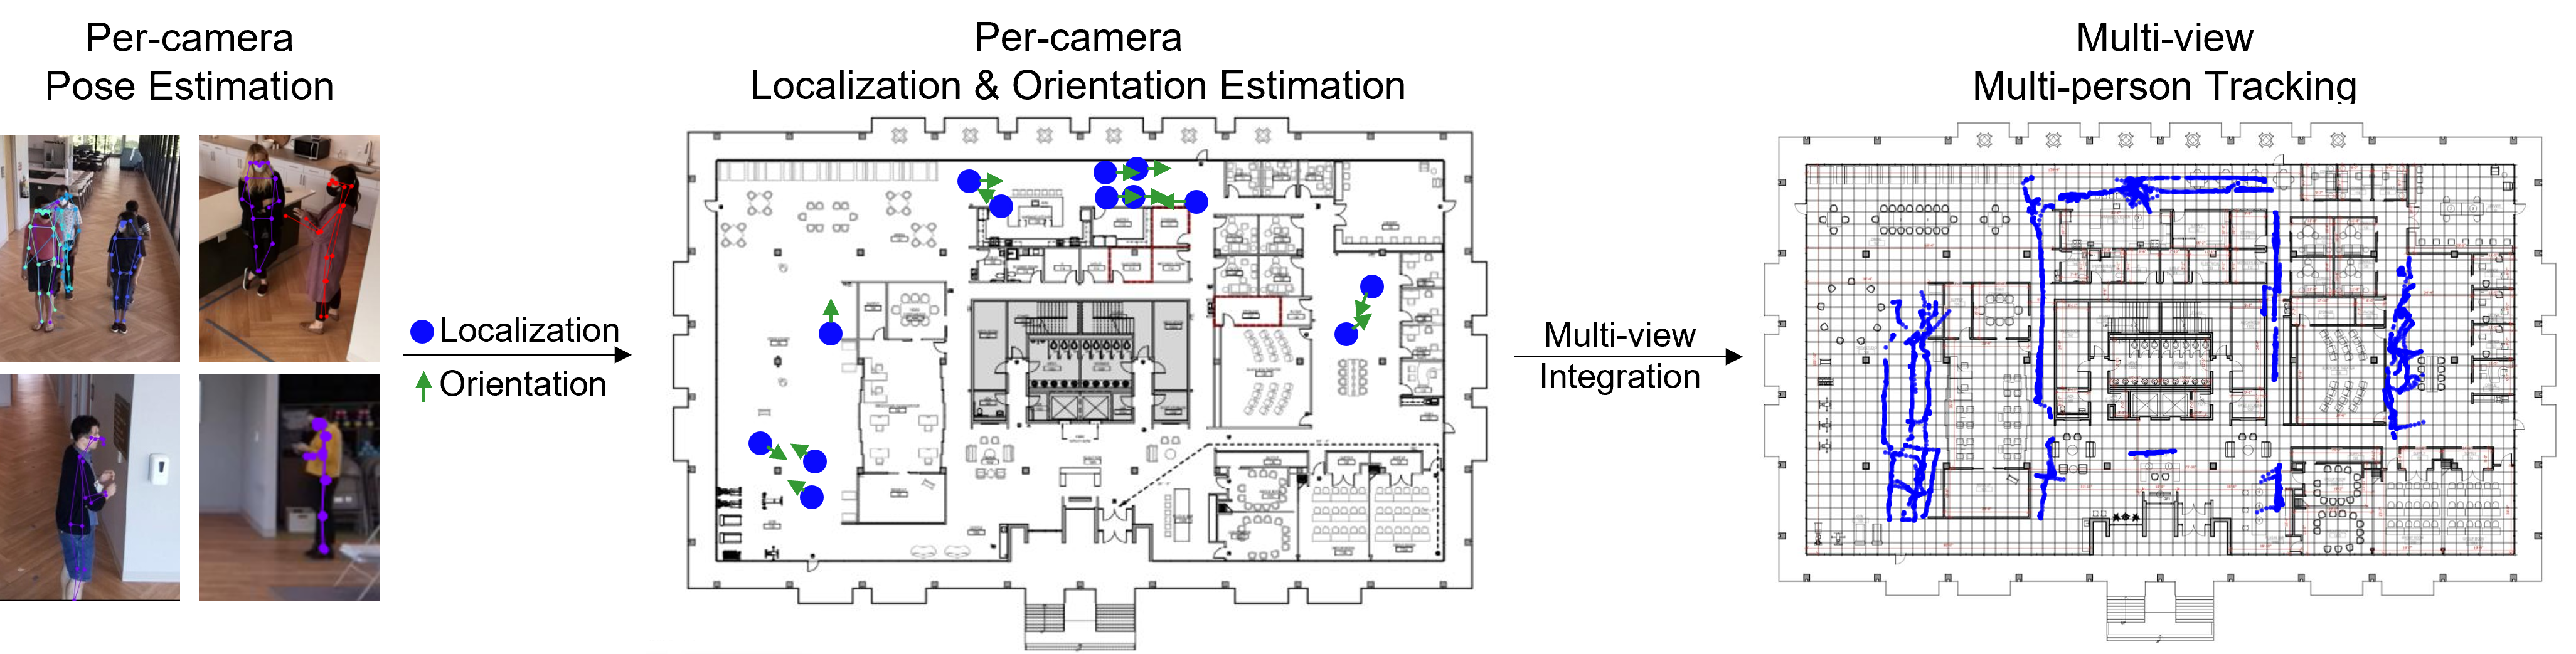
The overall approach for multi-view multi-person tracking using the above mentioned computing and camera infrastructure is shown in Figure 4. Using the 2D poses and human bounding boxes, each person’s location and body orientation is estimated and projected on a 2D coordinate system representing the study space. Multi-view integration then resolves duplicate detections across cameras from overlapping views by combining samples from 39 cameras. Lastly, a multi-person tracking algorithm [20] is used to track people from the combined location and orientation samples.
2.3.2 Preprocessing 2D poses
The 2D poses estimated by the edge computing systems undergo a preprocessing step to eliminate noisy data. We identified two primary issues in the poses detected by the pose detection model [18]: non-human poses and temporal inconsistencies. The model occasionally misinterprets patterns on the walls and floor as human poses due to its overhead camera perspective. These non-human poses remain static over time and show minimal pose changes. Consequently, we identify and remove these false positives (non-human samples) by examining subsequent frames for near-zero pose changes. The second issue relates to the lack of temporal consistency in 2D poses because the model estimates poses frame by frame. Some poses exhibit discrepancies, such as left and right sides being flipped or even missing entirely between frames (false negatives). To address this, we implement temporal smoothing using a Kalman filter-based approach to reduce noise and fill in missing pose detections [21, 22].
2.3.3 Indoor Localization
Our indoor localization technique is designed to determine the positions of individuals within the study site using a 2D coordinate system that represents the layout of the site, which we call the study site coordinate system. This is achieved by utilizing the 2D poses detected from each camera. In our approach, we define the location of a person within a frame as the midpoint between their left and right feet. Given that the floor in our study area is uniformly flat, all individuals detected in a frame are assumed to be on the same plane. To enable this localization, we derive a perspective transformation matrix . This matrix serves to project the foot locations from the 2D camera space to the corresponding floor positions within the study site coordinate system [23, 12]. The process for obtaining this transformation matrix is carried out manually for each camera by aligning four corresponding points in both the 2D camera space and the study space coordinate system.
2.3.4 Body Orientation Estimation
Starting with the human bounding boxes obtained from 2D pose detection models, we extract the chest-facing direction of each individual within the transverse plane. This orientation is subsequently translated into the study space coordinate system. To estimate the chest-facing direction from a human bounding box image, we employ a deep learning-based method for body orientation estimation [24]. Here, we define a human bounding box as a tightly enclosed square region that encompasses a detected 2D pose from the edge computing systems. The resultant estimate of the chest orientation is represented as a 2D chest vector on the transverse plane. This 2D chest vector, initially defined in camera space, is then transformed into a 2D orientation in the study site coordinate system, denoted as . The rotation matrices, , are manually determined for each camera based on the direction in which the camera is facing within the study site, with north serving as the reference orientation.
2.3.5 Multi-view Integration
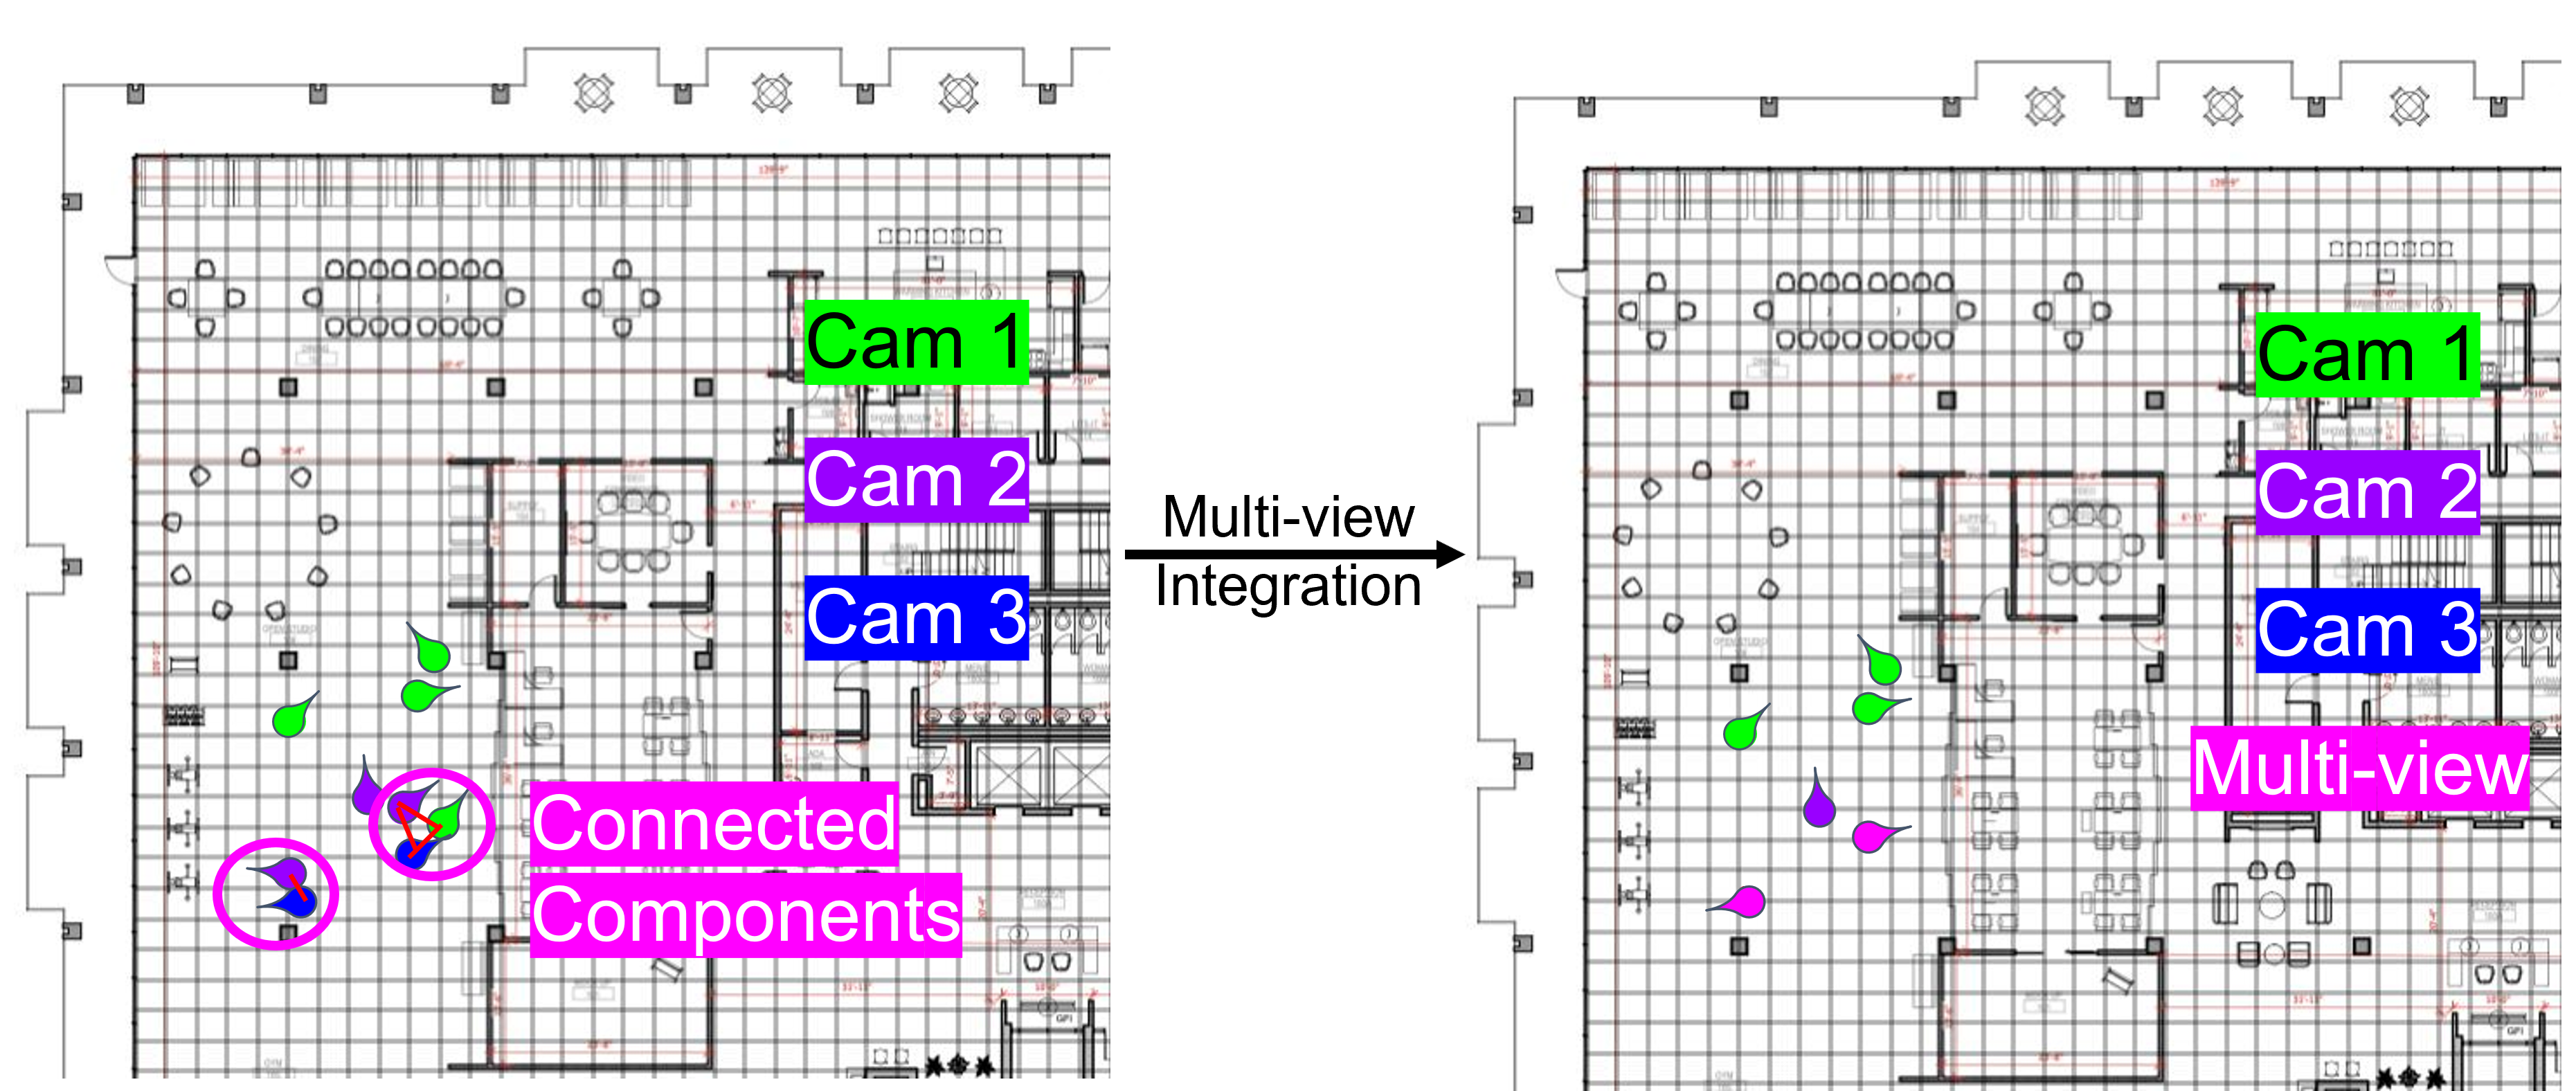
To eliminate duplicated samples that may occur due to overlapping camera fields-of-view, we adopt a method that involves detecting people across multiple cameras and consolidating these detections into a single sample, potentially representing the person’s actual location, as illustrated in Figure 5. To identify duplicate detections, we construct a graph, denoted as . In this graph, the vertices, represented as , correspond to the locations of samples from all 39 cameras. The edges, denoted as , signify the connections between samples from different cameras that are sufficiently close in distance. We assume that duplicates originate from the same person captured by different cameras if their Euclidean distance is within . This threshold takes into account the potential errors in our localization technique. While variations may occur due to lens distortions, which can lead to discrepancies in the perspective transformations, our empirical findings suggest that a margin of 1.5 meters is adequate [25].
Once the graph is established, duplicate samples are identified as connected components (CC) within the graph, following principles from graph theory [26]. The integration of duplicate sample locations considers the distance of cameras from the detected sample. More precisely, during the integration of duplicated samples, a penalty is applied when the distance between the estimated person’s location and the camera is substantial. This approach acknowledges the strong correlation between localization errors and the distance between the camera and the target person in our analysis. This is represented by the equation:
| (1) |
Here, denotes the integrated sample location, and signifies the Euclidean distance between the sample, , and the camera, .
Similarly, the orientation of the duplicated samples is integrated for the vertices within the connected components (CC), taking camera distances into account. This multi-view integration process results in unique locations, denoted as , and orientation vectors, for each person at each time step.
2.3.6 Multi-person Tracking
 (a)
(b)
(c)
(a)
(b)
(c)
We implement Kalman filter-based tracking for the locations denoted as and the orientation vector represented by . This approach assumes that people’s facing orientation closely follows their walking direction [27] and can be expressed as follows:
| (2) |
Here, the parameter acts as a weighting factor for the influence of the movement direction (or velocity) on the current orientation, and denotes the time interval between frames, which is set at 1 second. To further enhance tracking performance, we apply Rauch–Tung–Striebel (RTS) smoothing to completed tracks, which takes into account temporal dynamics across the entire trajectory of a person.
2.4 Benchmark Data Collection
In order to methodically assess the effectiveness of our system for localization, body orientation estimation, and tracking, we created an annotated dataset. This dataset features four to five individuals moving and interacting within the study site. The benchmark dataset encompasses scenarios where people are 1) walking together, 2) walking past each other, or 3) conversing in place while adjusting their facing orientations. We marked the entire area with 1-meter intervals to provide ground-truth reference points. The subjects were instructed to follow predetermined group formations and designated walking paths. As the individuals moved within the space, an observer recorded the time and location of each subject at one-second intervals. Additionally, the observer manually annotated the body orientation of the subjects, using the north direction (as indicated by the upper side of Figure 1) as a reference point. Below, we outline the three distinct datasets we generated to capture various activities within the space.
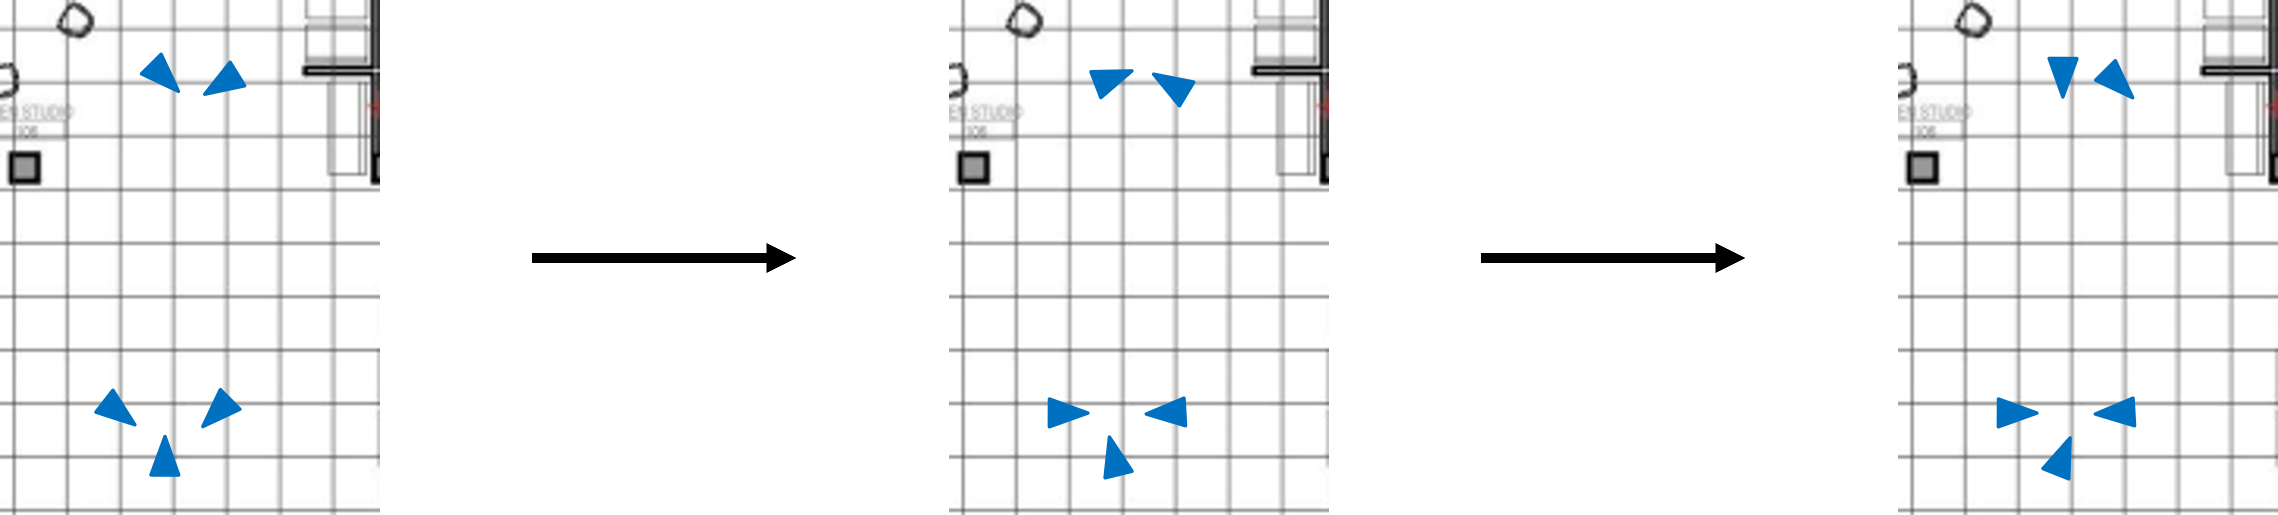
2.4.1 4 People Walking around Entire Space
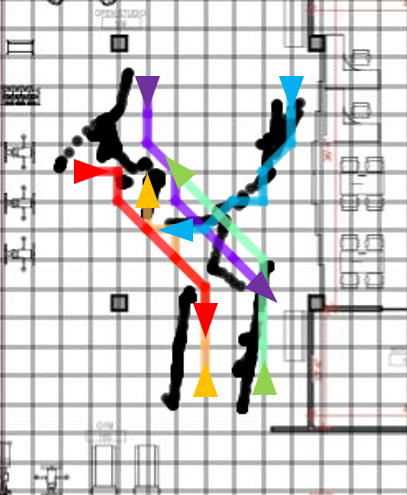
In the first benchmark dataset, we had four individuals moving throughout the study site. To ensure that our dataset encompasses realistic use cases for visitors in the study site, we carefully selected locations and paths as depicted in Figure 6. These areas were of particular interest for tracking behaviors within the study space (Figure 6a). These locations included spaces frequently used by visitors for activities like dining, kitchen usage, physical exercises, relaxation, and staff zones (Figure 1), where participants had given their consent to be recorded.
For annotation purposes, we utilized the closest 1-meter markers as the ground-truth reference points for the subjects while they were walking. This level of detail was sufficient to account for variations in foot size and stride length among the participants. As the subjects walked, we introduced changes in their group formation to simulate realistic movement patterns within the space (Figure 6c). In wider corridors, we arranged two or three people to walk side by side, while in narrower corridors, multiple subjects proceeded in straight lines. This approach allowed us to assess the impact of occlusions, where subjects might not be visible from certain camera viewpoints.
2.4.2 5 People Walking Past Each other
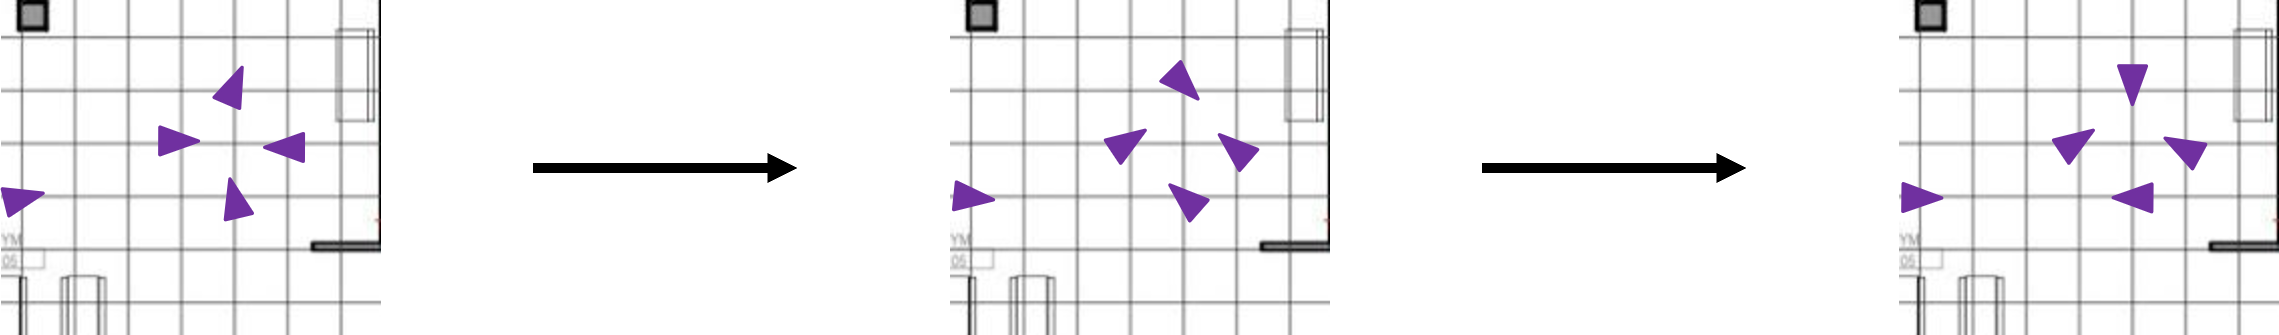
As depicted in Figure 6b, we recreated a scenario in the activity area where multiple individuals walked towards one another and passed by each other, a situation that often results in occlusions. Such occlusions are common during activities like dancing or group exercises.
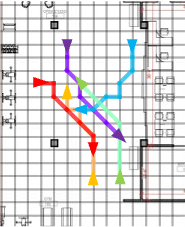
2.4.3 5 people Changing Orientations in Place
| Session 1 (Group size: 2 & 3) |
 |
| Session 2 (Group size: 4) |
 |
| Session 3 (Group size: 5) |
 |
Distance between
Facing angle
Horizontal
Vertical
camera and target (m)
away from camera
angle/Field-of-View
angle/Field-of-View
 (a)
(b)
(c)
(d)
(a)
(b)
(c)
(d)
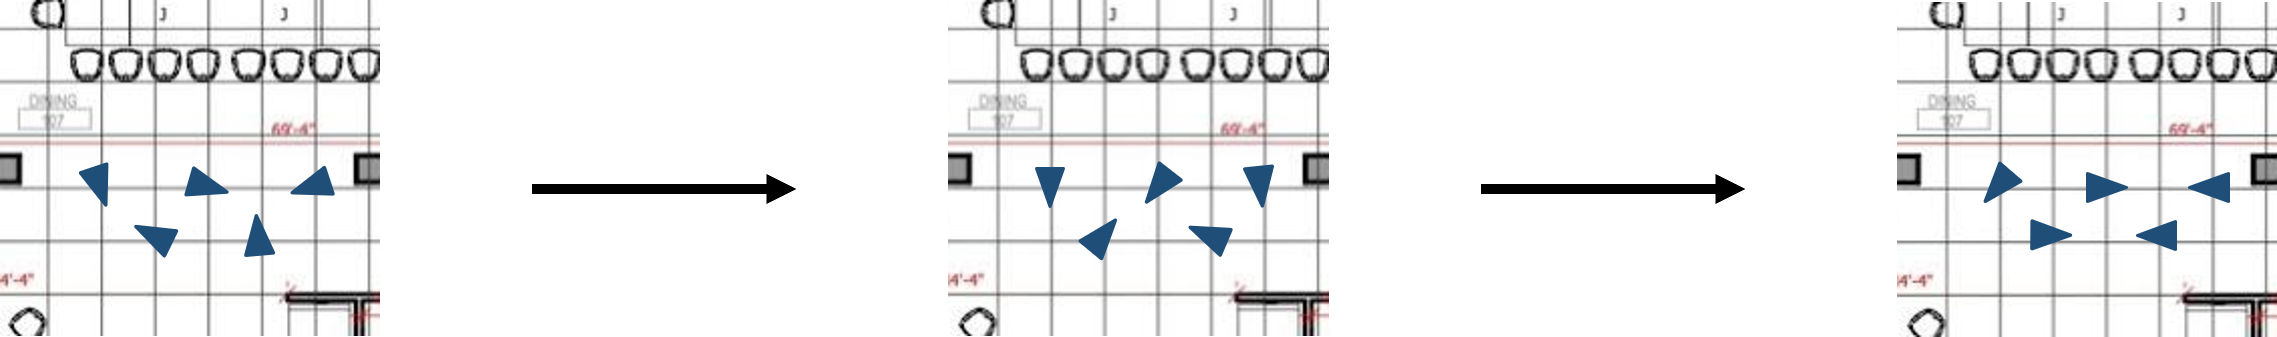
During group conversations, individuals often remain seated or stand stationary, adjusting their facing directions to interact. In this dataset, we focused on situations where people made subtle changes in their facing orientation while staying in one spot, as shown in Figure 7. We conducted this dataset in three sessions, starting with a smaller social group of two participants and gradually increasing it to five. In this context, a social group refers to people engaging in active communication within a distance of less than 2 meters, taking into account pandemic-related social distancing guidelines. Participants followed instructions to gradually modify their facing direction as part of the data collection process.
2.5 Evaluating Multi-person Tracking and Localization
We assess the performance of our activity monitoring system by examining its localization, tracking, and body orientation estimation capabilities, following established evaluation methods [28, 24]. Since there isn’t a singular metric for evaluating multi-person tracking methods, we employ a set of metrics to comprehensively evaluate the proposed system [29]. In the evaluation, metrics denoted by indicate better performance when higher, while those marked with signify better performance when lower.
-
•
MOTA (Multi-Object Tracking Accuracy) combines three kinds of error sources, which are false positives, missed targets, and identity switches.
-
•
IDF1 (ID F1 score) is the ratio of correctly identified detections over the average number of ground-truth and computed detections.
-
•
MT (Mostly Tracked targets) measures the ratio of ground-truth trajectories that are covered by a track hypothesis for at least 80% of their respective life span.
-
•
ML (Mostly Lost targets) measures the ratio of ground-truth trajectories that are covered by a track hypothesis for at most 20% of their respective life span.
-
•
FPR (False Positives Rate) measures the average number of false alarms per frame.
-
•
FNR (False Negatives Rate) measures the average number of missed targets per frame.
-
•
Rcll (Recall) measures the ratio of correct detections to the total number of ground-truth locations.
-
•
Prcn (Precision) measures the number of detected objects over the sum of detected and false positives.
-
•
IDSR (ID Switch Ratio) measures the number of ID switches (IDS) over recall.
-
•
Frag (Fragmentation) measures the total number of times a trajectory is fragmented, which are interruptions during tracking.
In particular, we assess the system’s performance using the MOTA metric, defined as follows:
| (3) |
Here, , , , and represent false negatives (missed detections), false positives, ID switches, and ground-truths at time , respectively.
An essential evaluation that precedes tracking is detection. Here, we define a ground-truth target at time as ”detected” if the estimated sample location falls within a 1.5-meter Euclidean distance. Otherwise, the target is considered ”missed.” The choice of a 1.5-meter threshold is based on the observation that people typically walk at speeds below 1.42 m/s in everyday situations [30, 31, 32]. To showcase the accuracy of the estimated sample locations, we also report the multiple object tracking precision, denoted as MOTP:
| (4) |
Here, represents the Euclidean distance between the th detected ground-truth sample and the estimated sample, and is the number of detections at time . In simpler terms, MOTP provides the average Euclidean distance error for the detected samples, indicating the system’s ability to estimate the precise location of target samples, independent of tracking trajectories or ID switches.
2.6 Evaluating Body Orientation Estimation
Consistent with previous definitions of body orientation found in earlier works [24, 33, 34], we represent human orientation, denoted as , within the range of . This angle corresponds to the direction in which the chest is facing in the study site coordinate system. The north (top) direction serves as the reference point, with clockwise rotation applied. For the assessment of body orientation, we utilize two metrics as also employed in previous studies [24]:
-
•
Mean Absolute Error (MAE) of Angular Distance: This metric quantifies the average absolute angular difference between predicted and ground-truth orientations.
-
•
Accuracy-: Accuracy- is defined as the proportion of predictions falling within a deviation of compared to the ground-truth orientation. By considering different values of within the range of , this metric provides a fine-grained measure of model accuracy. Specifically, we evaluate Accuracy- for a set of values including [24].
2.7 Impact of Camera Installation
We conducted a quantitative analysis to delve deeper into the influence of camera placement on four distinct factors that impact the performance of our system, as illustrated in Figure 8. In particular, we aim to establish the correlation between the subjects’ positions and facing orientations as captured within the video frames of each camera, and how these aspects affect the accuracy of both localization and body orientation estimation. This analytical approach sheds light on the error budget arising from per-camera indoor localization (Section 2.3.3) and body orientation estimation (Section 2.3.4), ultimately contributing to our understanding of the overall system performance.
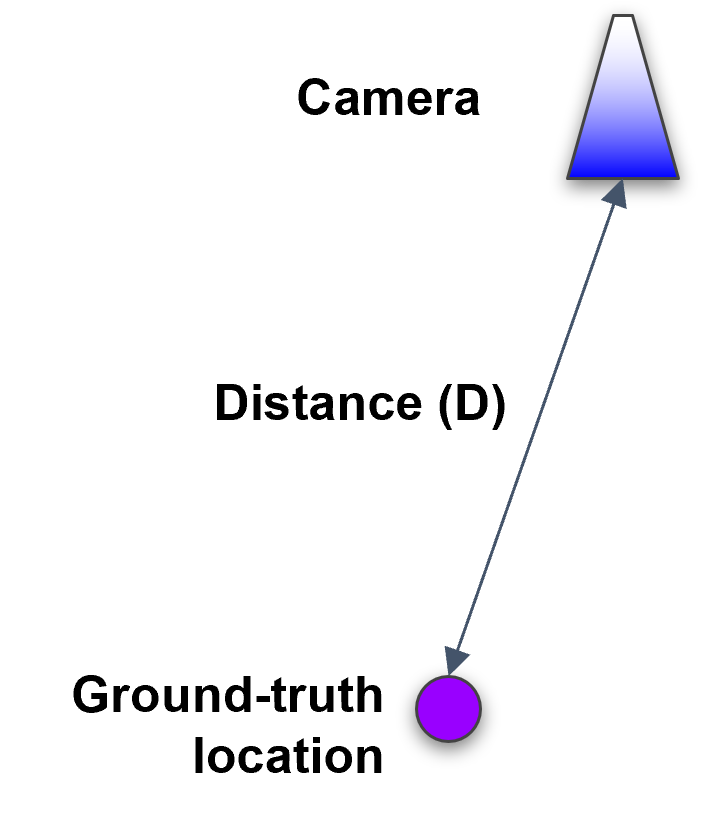
2.7.1 Distance Between Camera and Person
For all cameras, we assessed the distance between individuals captured in relation to the camera’s center, as depicted in Figure 8a. This distance measurement is instrumental in evaluating the impact on localization and orientation errors.
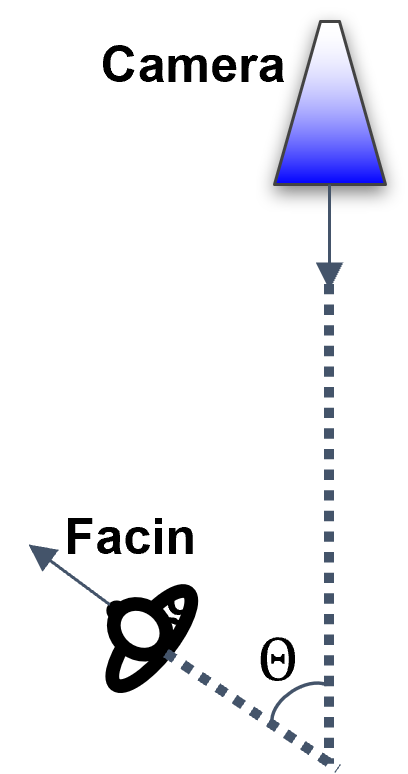
2.7.2 Facing Angle with respect to Camera Viewpoint
 |
 |
| (a) | (b) |
Area Size () \faCamera MOTP MOTA IDF1 MT ML FPR FNR Rcll Prcn IDSR Frag A Activity Area 7 0.886 0.584 4 0 0.17 0.25 0.936 0.956 9.61 6 B Kitchen 3 0.671 0.427 1 0 0.28 1.01 0.747 0.913 17.38 11 C Left Corridor 3 0.545 0.435 1 0 0.27 1.53 0.616 0.901 12.97 4 D Lounge 1 0.334 0.501 0 2 0 2.66 0.334 1.0 0.0 0 E Right Corridor 2 0.602 0.468 2 0 0.01 1.56 0.610 0.993 13.10 9 F Staff Zone 4 0.734 0.659 3 0 0.65 0.40 0.899 0.845 4.44 1 Overall - - 0.629 0.512 1.833 0.333 0.23 1.23 0.690 0.934 9.58 5.16 5 people 4 0.798 0.700 5 0 0.65 0.34 0.932 0.877 6.43 1
We gathered data on the extent to which the facing directions of individuals deviate from the camera viewpoints, as visualized in Figure 8b. Subsequently, we performed a correlation analysis to assess the relationship between these deviations and the associated localization and orientation errors.
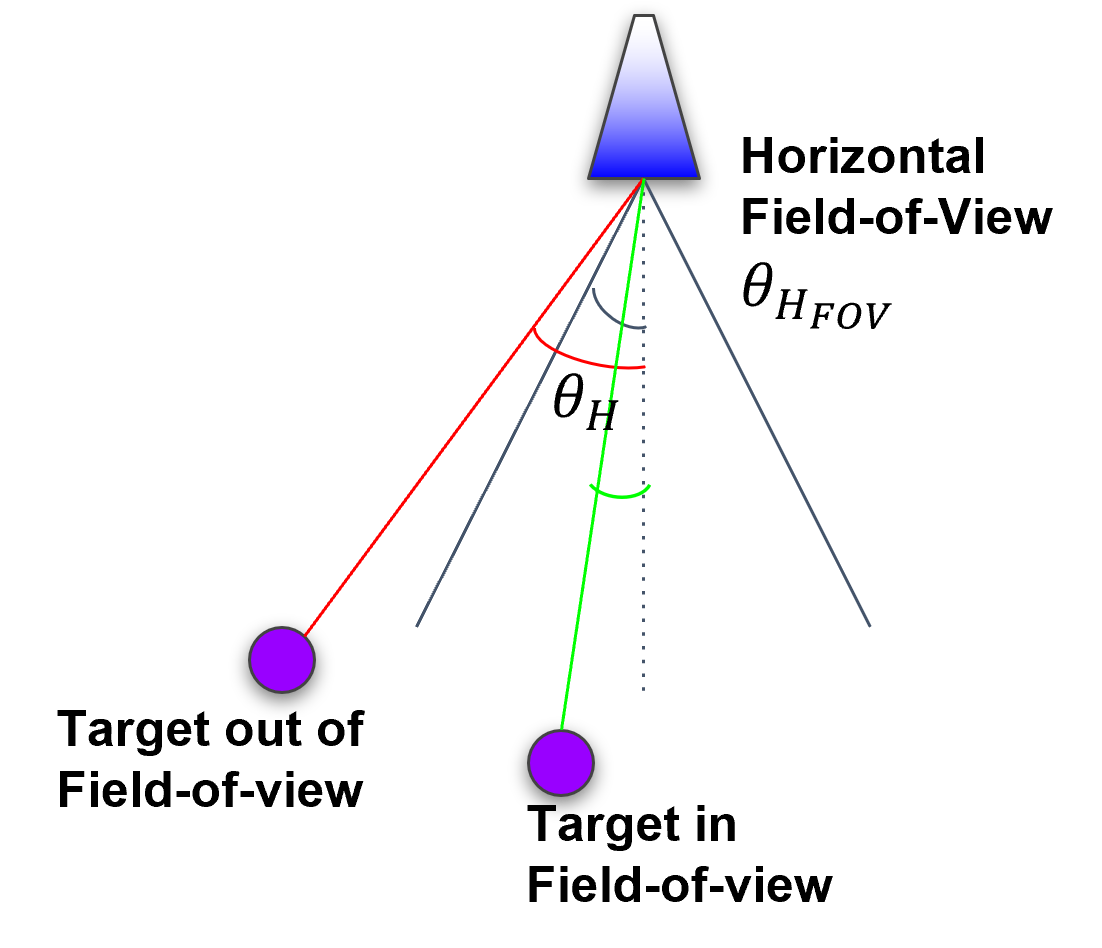
2.7.3 Horizontal Displacement from Camera Center
We studied the impact of the horizontal displacement of individuals from the camera center, as illustrated in Figure 8c. To quantify this horizontal displacement, we introduced a normalized horizontal angle, denoted as , where represents the horizontal angle of the person from the camera center, and is the horizontal field-of-view.
When a person moves closer to the horizontal center of the camera, the normalized horizontal angle approaches zero. Conversely, it increases to a value of when the person reaches the edge of the frame. If the value exceeds , it indicates that only a portion of the person’s body is visible within the camera’s field of view. We explore how localization and orientation errors are influenced by the degree of horizontal displacement.
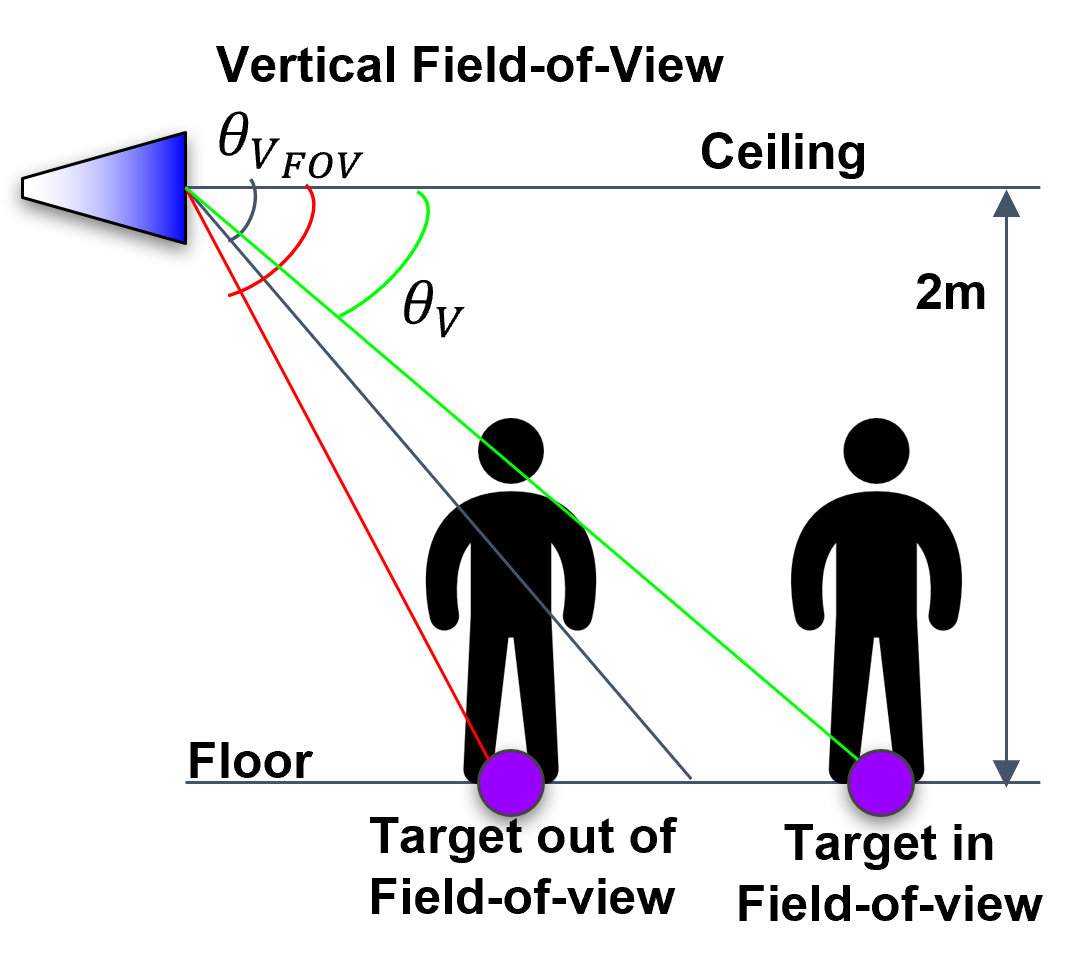
2.7.4 Vertical Displacement from Camera Center
We investigated the impact of vertical displacement of an individual from the camera center, as indicated in Figure 8d. To measure this vertical displacement, we introduced a normalized vertical angle denoted as . Here, represents the vertical angle at which the person is captured from the camera center, and is the vertical field-of-view, which is obtained from the camera datasheet. We specifically focused on the foot location as a reference point to calculate the normalized vertical angle. When a person is closer to the camera, the normalized vertical angle increases, and only the upper body is partially visible in the camera frame due to the limited vertical field of view. Conversely, as the person moves away from the camera, the normalized vertical angle decreases, allowing for the full body to be captured within the field of view. However, this comes at the cost of increased distance between the camera and the person. We examined how changes in localization and orientation errors are influenced by the vertical displacement of the captured individual.
3 Results
3.1 Multi-person Tracking and Localization
3.1.1 4 People Walking around Entire Space
Area Size () \faCamera MAE- Acc.- Acc.- Acc.- Acc.- Acc.- Acc.- A Activity Area 7 25.91° 0.319 0.622 0.723 0.800 0.855 0.912 B Kitchen 3 31.06° 0.207 0.489 0.590 0.650 0.748 0.916 C Left Corridor 3 21.68° 0.223 0.578 0.706 0.793 0.887 0.955 D Lounge 1 47.37° 0.038 0.137 0.302 0.423 0.554 0.846 E Right Corridor 2 32.41° 0.214 0.479 0.556 0.602 0.674 0.946 F Staff Zone 4 33.68° 0.096 0.324 0.464 0.589 0.778 0.942 Overall - - 28.97° 0.220 0.506 0.615 0.693 0.789 0.930 5 people 4 48.33° 0.149 0.328 0.417 0.512 0.629 0.814 In-place (Sess. 1) 3 73.73° 0.087 0.181 0.255 0.261 0.322 0.644 In-place (Sess. 2) 2 65.28° 0.078 0.212 0.236 0.290 0.375 0.672 In-place (Sess. 3) 4 50.47° 0.111 0.265 0.454 0.580 0.692 0.769 In-place (Overall) - - 63.40° 0.091 0.218 0.310 0.371 0.457 0.693
In this section, we present the system’s overall performance when four people walk together throughout the entire study site. The results of multi-person tracking and localization are depicted in Figure 9, and detailed in Table 1, where each functional area is assessed individually. It’s worth noting that different locations within the study site have varying sizes of the captured area (as shown in the second column of Table 1) and a different number of cameras (as indicated in the third column of Table 1), all of which captured 85% of the samples. The overall MOTA score stands at 62.9%, and the localization performance, measured by MOTP, is . These results indicate that our system achieved accurate localization and tracking in over 60% of cases, taking into account false positives, false negatives, and identity switches. A more detailed analysis of the impact of camera installation on localization accuracy is provided in Section 3.3.
3.1.2 5 People Walking Past Each other
Both qualitative and quantitative outcomes are presented in Figure 9b and in the last row of Table 1, respectively. Despite the challenging scenarios, the system demonstrated robust performance when individuals were passing by each other. The MOTA score, MOTP score, and IDF1 score reached 79.8%, 1.44m, and 70%, respectively, indicating strong performance with minimal ID switch errors in situations where people were crossing paths.
3.2 Body Orientation Estimation
The results of body orientation estimation are provided in Table 2. Our evaluations encompass scenarios involving four individuals walking across the entire space and five individuals passing by each other in the Activity Area. Additionally, we conducted assessments of body orientation for a scenario in which five individuals remained stationary while altering their orientations within different group formations.
3.2.1 4 People Walking around Entire Space
During the walking scenario with four participants, the overall mean absolute error (MAE) in body orientation estimation was 28.97, and the accuracy within a 45 margin reached 78.9%, as indicated in the seventh row of Table 2. Further examination of the correlation between camera installation and body orientation estimation is presented in Section 3.3.
3.2.2 5 People Walking Past Each other
In situations where individuals were walking closely past each other, our body-orientation estimation technique faced challenges due to the presence of multiple people with different orientations captured within the same human bounding box. As illustrated in the eighth row of Table 2, this posed difficulties, resulting in a high mean absolute error (MAE) of 48.33 and a lower accuracy within a 45 margin (62.9%).
3.2.3 5 people Changing Orientations in Place
The final four rows in Table 2 present the estimation performance when an individual remains stationary but rotates their orientation. In this scenario, the overall performance indicated an mean absolute error (MAE) of 63.40.
Distance between
Facing angle
Horizontal
Vertical
camera and target (m)
away from camera
angle/Field-of-View
angle/Field-of-View
Localization
error (meter)
 Orientation
error (degree)
Orientation
error (degree)
 D (m)
°
D (m)
°
3.3 Impact of Parameters of Camera Installation
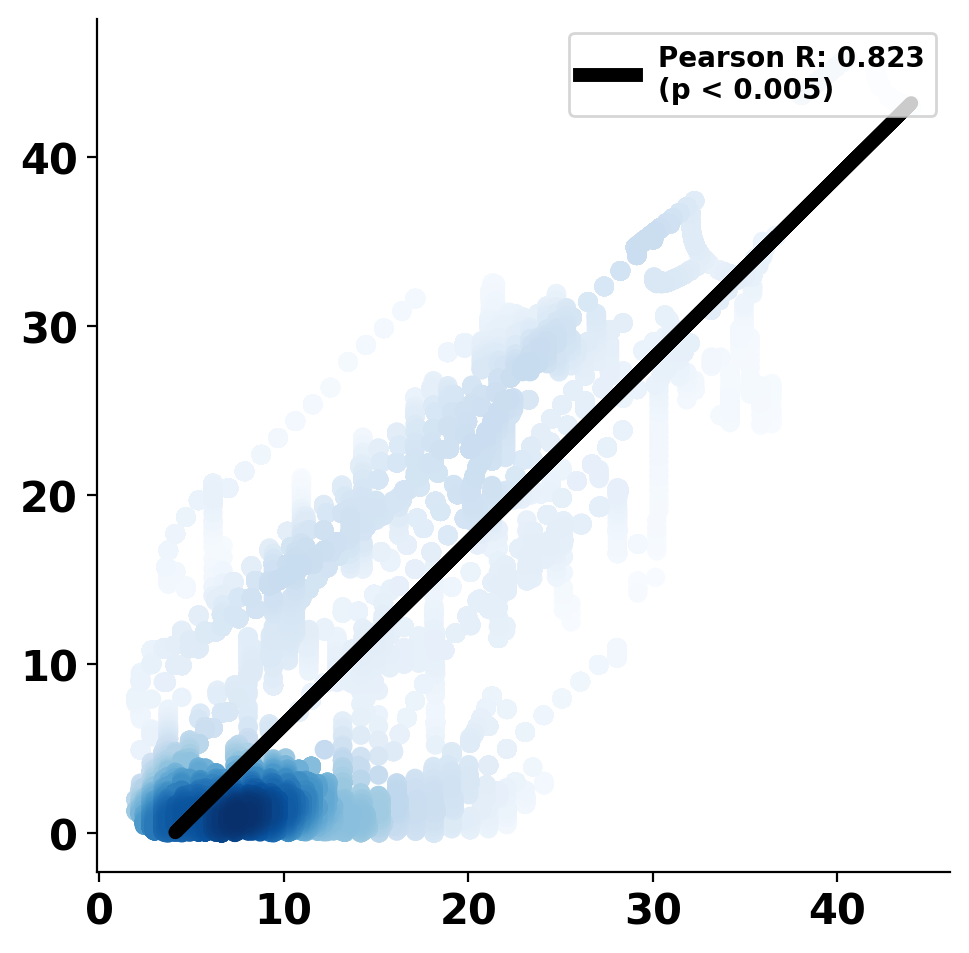
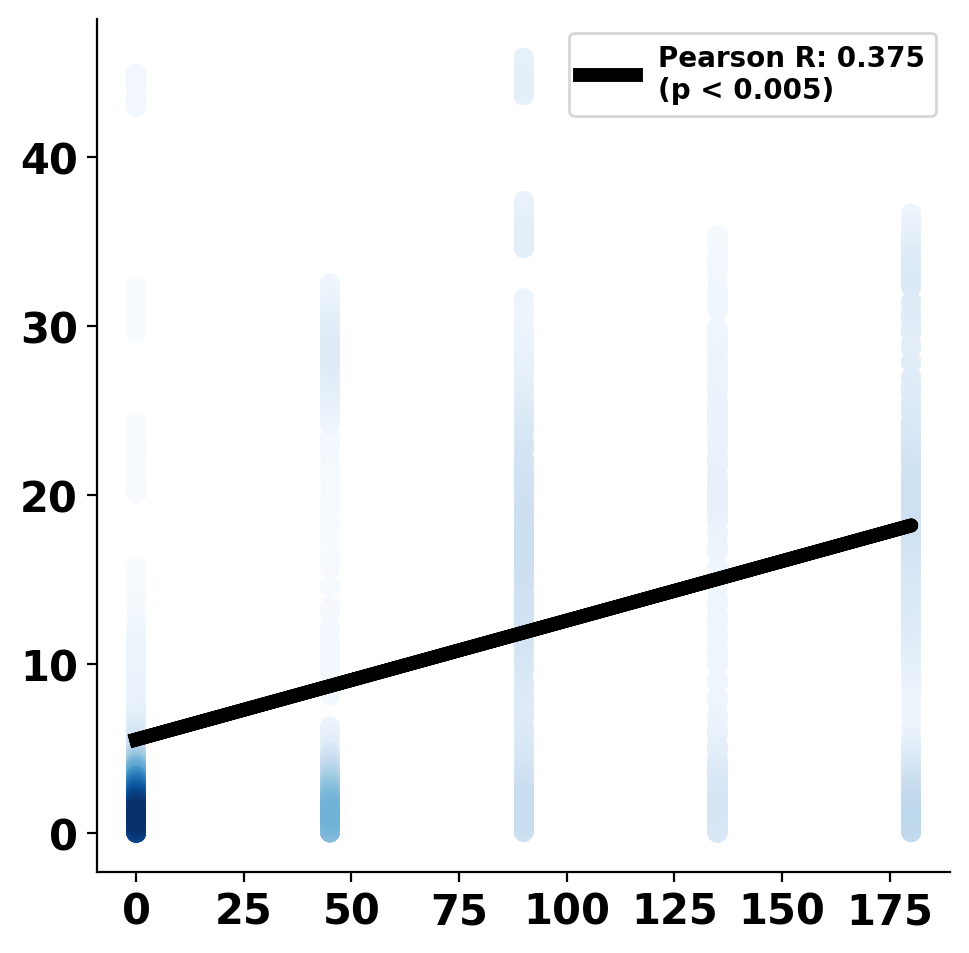
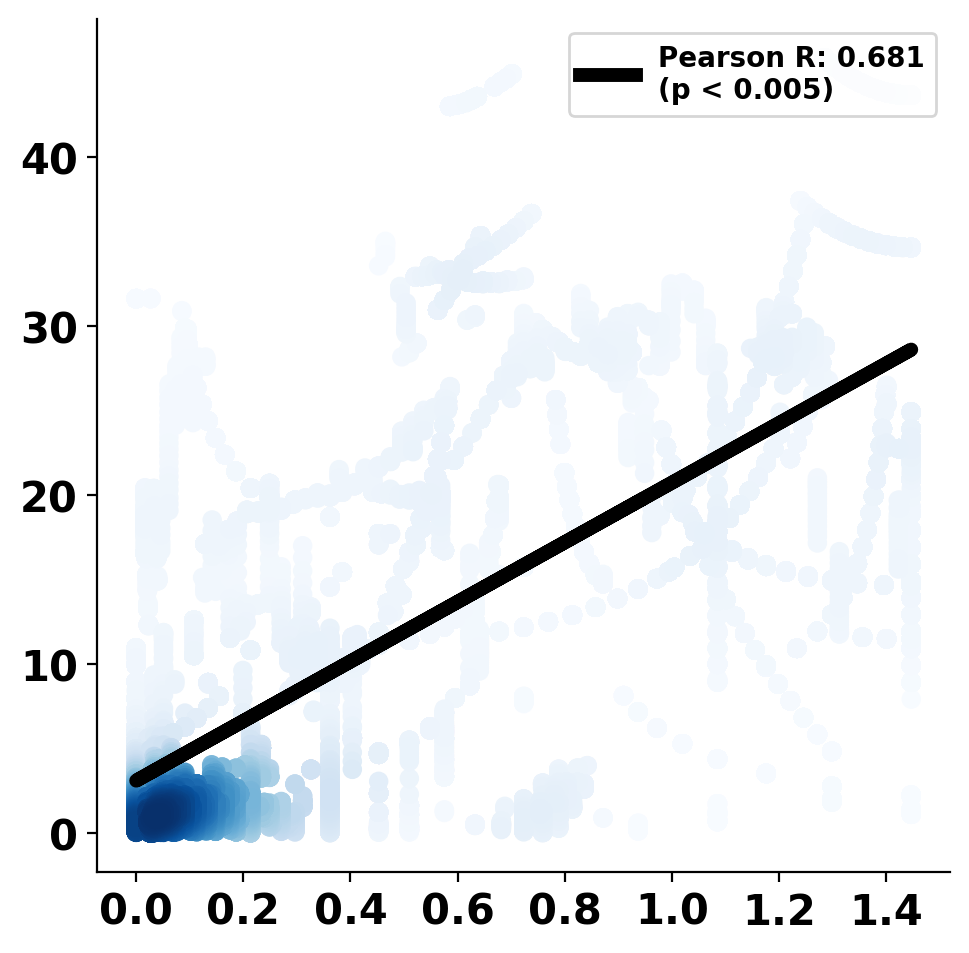
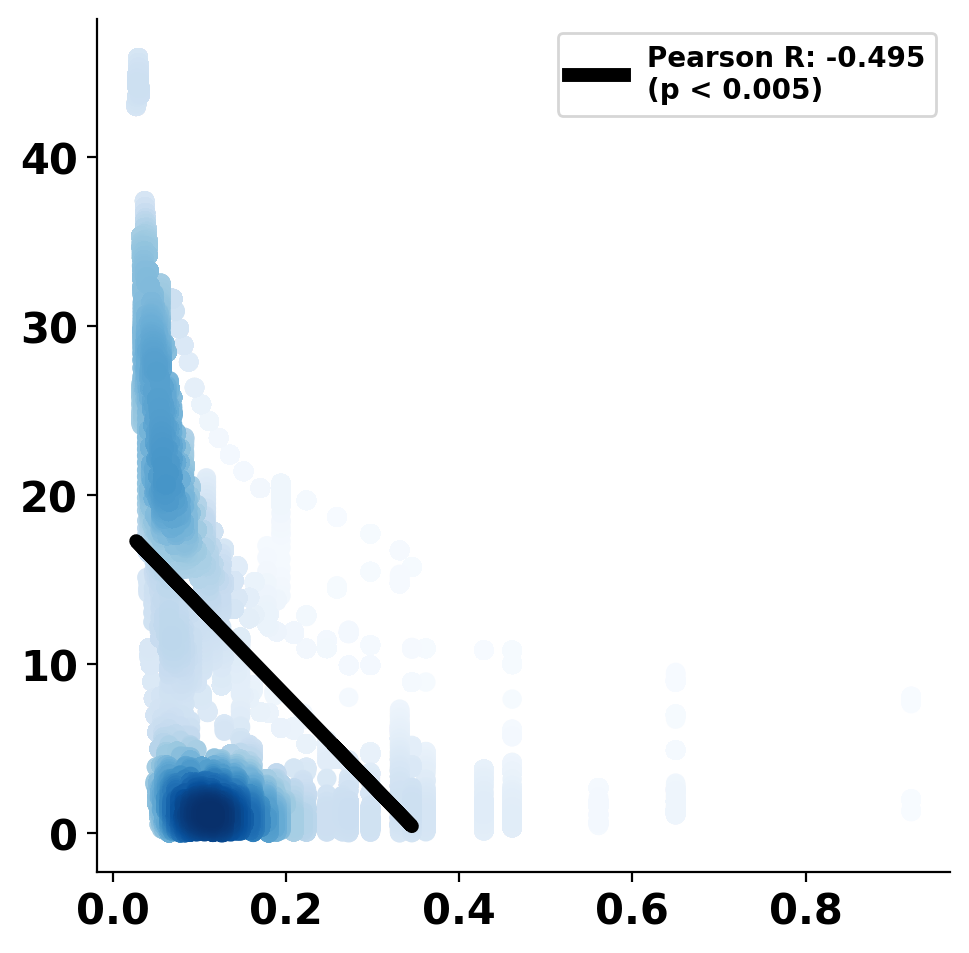
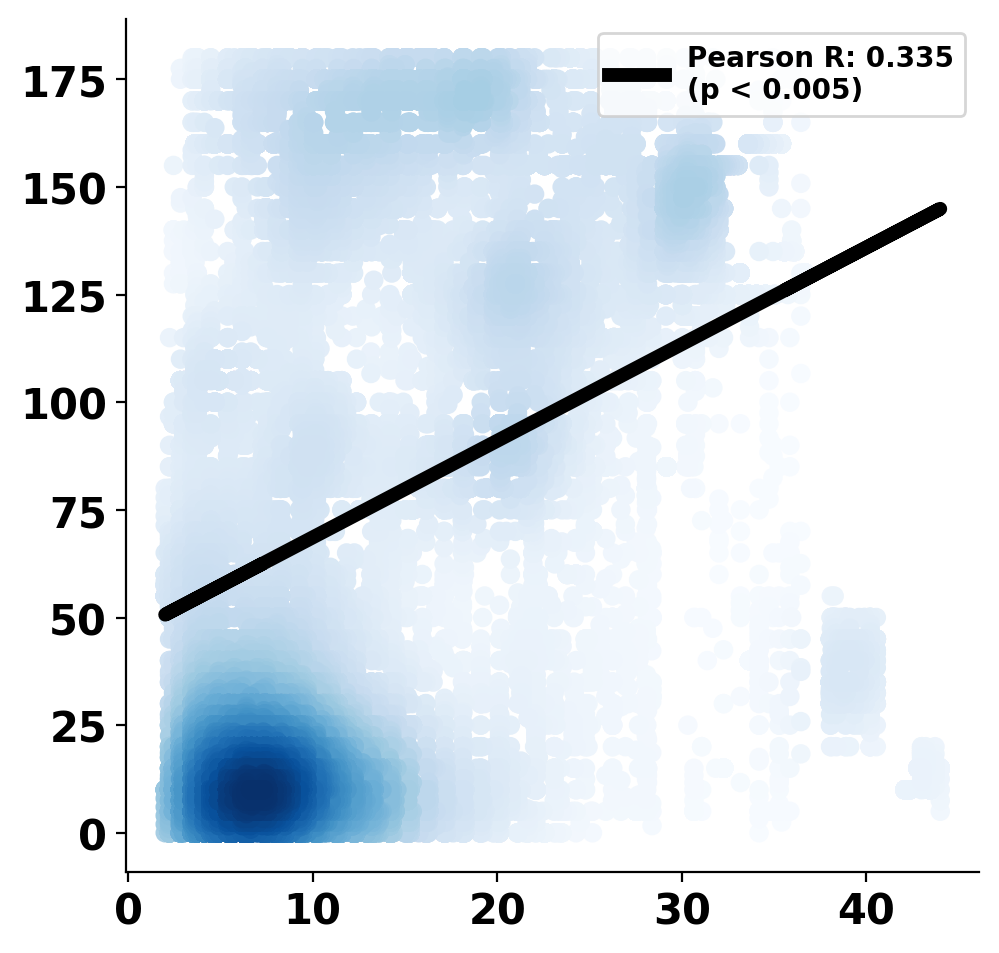
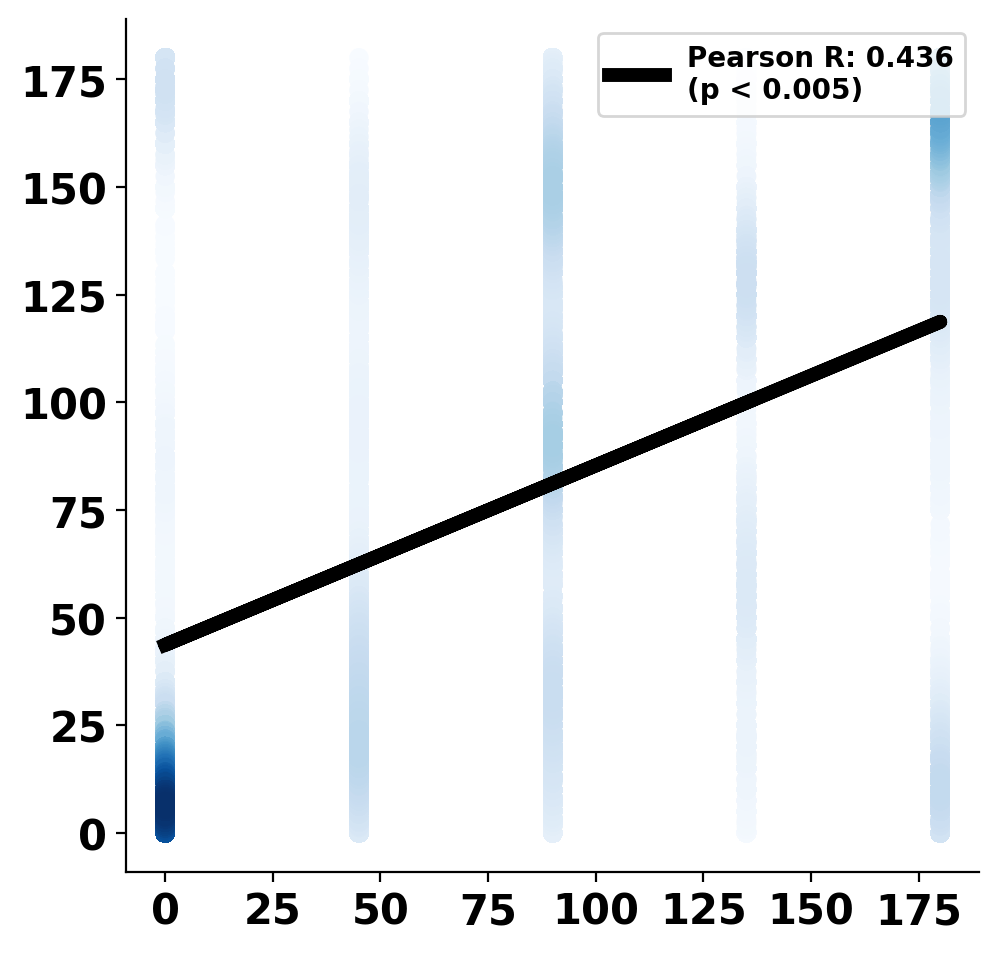
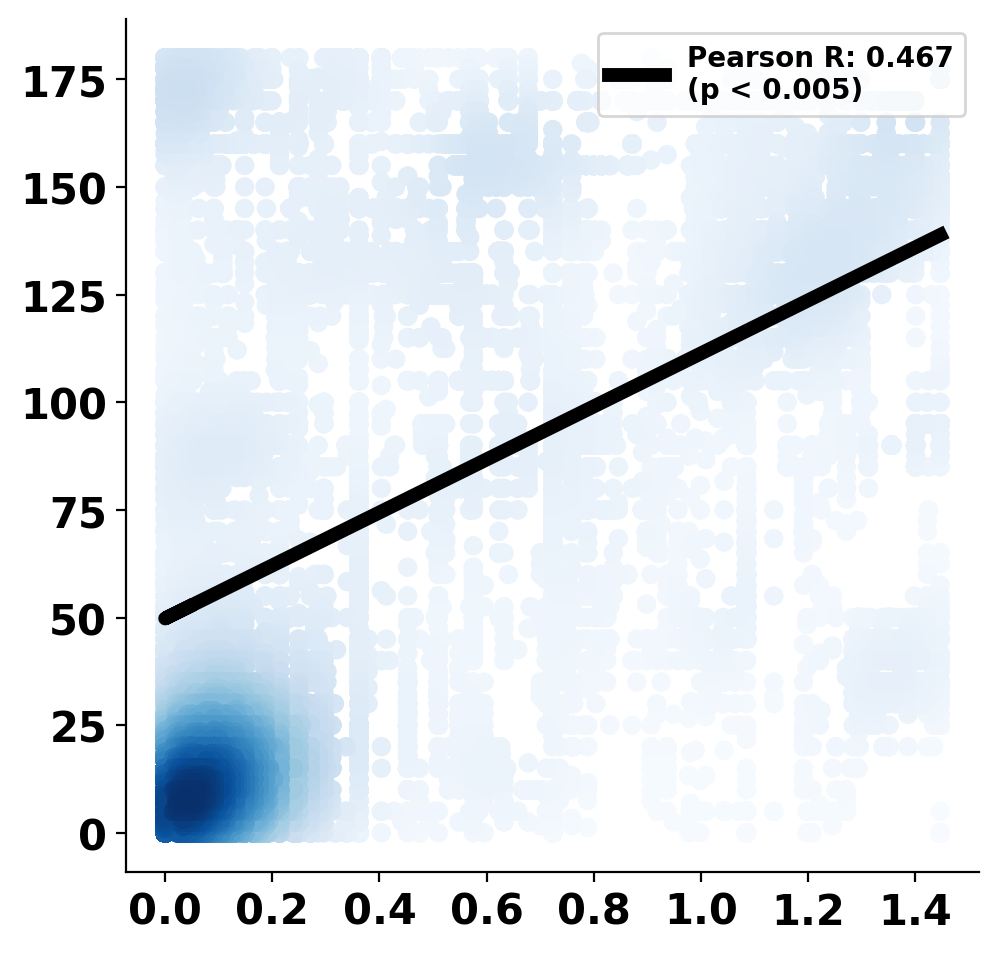
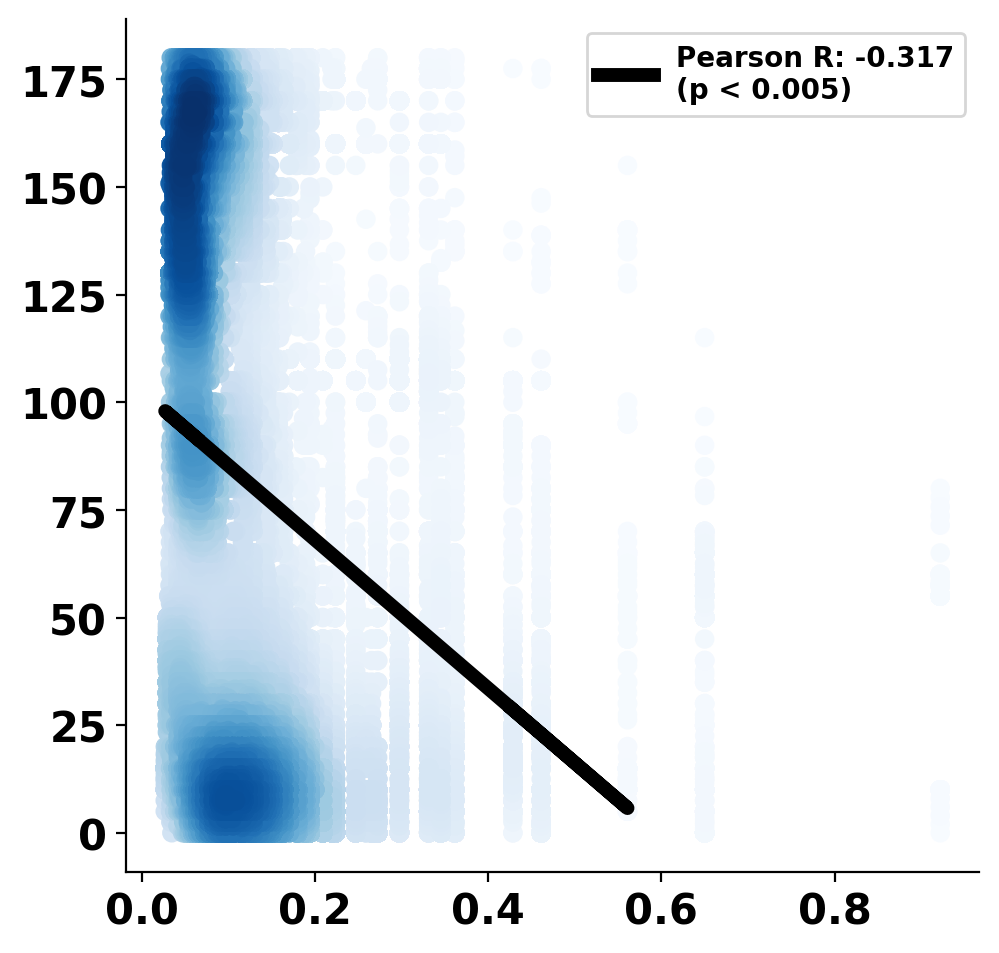
In Figure 10, a Pearson correlation analysis is presented, highlighting the relationship between each factor from Figure 8 and localization and orientation errors. In the figure, areas with denser samples are represented in a deeper shade of blue.
3.3.1 Distance Between Camera and Person
In Figure 10, in the first column, a strong positive correlation is evident between the localization error (first row) and the camera distance, especially when the distance exceeds 20 meters (, ). Similarly, the orientation error (first column, second row) also exhibits a positive correlation with an increase in the distance between the captured individual and the camera (, ).
3.3.2 Facing Angle with Respect to Camera Viewpoint
In Figure 10, the second column, a strong positive correlation is observed between the facing angle concerning the camera viewpoint and both localization (, ) and body orientation estimation (, ) errors.
3.3.3 Horizontal Displacement from Camera Center
In Figure 10, in the third column, it is evident that the localization and body orientation estimation errors displayed significant increases, with strong positive correlations, as the captured individual moved away from the horizontal center. The correlation coefficients for localization and body orientation estimation errors were and , respectively, both with .
3.3.4 Vertical Displacement from Camera Center
As the individual moved closer to the vertical camera center, there was a notable reduction in both the localization and orientation estimation errors. This decrease in errors can be attributed to the increased coverage of more body parts within the camera’s field of view. This relationship was marked by strong negative correlations, with correlation coefficients of for localization and for orientation estimation, both with .
4 Discussion
Our experiment results demonstrated the possibility of using edge computing devices and cameras to continuously monitor fine-grained activities across large indoor spaces.
4.1 Multi-person Tracking and Localization
4.1.1 4 People Walking around Entire Space
The evaluations shows that the proposed model consistently tracks individuals throughout the sequence as long as they are initially detected. Furthermore, the system exhibits an ability to handle a certain degree of missing detections (false negatives) arising from the limitations of the multi-person pose detection model on edge computing systems. To run the pose detection model in real-time on an edge computing system, which is a resource-constrained device, we are currently using a model that is specifically tailored to emphasize efficiency over performance compared to the state-of-the-art models [10]. This emphasis on efficiency is reflected in the system’s high precision (93.48%), high MT (1.83), and low ML (0.33). The overall performance of localization remains within a reasonable error range, given our tracking rate of 1 Hz, which is adequate considering that people typically walk at a rate of in everyday activities [30, 31, 32]. Additionally, the precision of our ground truth annotations includes a margin of 1-meter error since participants’ locations were recorded as the nearest 1-meter interval marker in the space.
The model’s performance exhibited variations based on the regions within the study space. In the Activity area (A), where most physical activities occur, the MOTA score was 88.63%, with a MOTP of , high Precision (95.6%) and Recall (93.62%), which are sufficient for detecting, tracking, and understanding group activities and space usage behavior in this area. In the Activity Area (A), seven cameras were tracking movements, emphasizing the importance of multi-view cameras in noisy detection scenarios. The overlapping viewpoints of these cameras facilitated capturing people from various angles, including the front, back, and sides during walking, as demonstrated in Figure 2.
On the other hand, lower MOTA scores were observed in regions with only a few cameras covering a wide capture space. Specifically, the Kitchen, Left Corridor, and Right Corridor recorded MOTA scores of 67.16%, 54.53%, and 60.25%, with corresponding MOTP values of , , and . These regions featured long corridors with dimensions of , , and , respectively. The limited camera coverage for these regions, and capturing individuals from a distance, led to challenges related to occlusion and pose detection. The small pixel region allocated for each person resulted in elevated false negative rates (FNRs) of 1.01, 1.53, and 1.56, respectively. Nonetheless, our system exhibited consistently high Precision (95.6%, 91.3%, 100%) in these regions, indicating that the detected objects were predominantly accurately localized.
The Staff Zone is equipped with four cameras positioned to capture movements from the sides (left and right) while walking. The size of the Staff Zone, which measures , is the smallest among all areas, leading to cameras capturing individuals at closer distances. As a result, this area achieved a higher MOTA score of 73.47% and had a lower MOTP score of and reduced false negative rates (FNRs) of 0.40 compared to other areas. Conversely, the Lounge area only features a single camera covering the entire space and exhibited the lowest performance, with a MOTA score of 33.44%. This was primarily attributed to the lack of power and network resources near the lounge area, limiting the use of a single camera for coverage. Additionally, occlusions from the front desk, chairs, and other objects in the lounge further impacted the tracking accuracy. In summary, our experimental results highlight the importance of multi-view cameras positioned at closer distances to individuals. These factors are essential for addressing challenges associated with noisy pose estimations in edge computing devices, ultimately leading to lower MOTP scores and improved MOTA performance.
4.1.2 5 People Walking Past Each Other
Our findings indicate that employing four multi-view cameras to capture activities from different perspectives can help mitigate occlusions when individuals are in motion, even in the presence of noisy or missing pose estimations.
4.2 Body Orientation Estimation
4.2.1 4 People Walking around Entire Space
The body-orientation estimation performance reliably distinguished between eight orientations (N, NE, E, SE, S, SW, W, NW). However, the performance of orientation estimation varied depending on the size of the captured area and the overlap between multi-view cameras. In the Activity Area, which had seven cameras capturing views from different angles, the orientation estimation errors were relatively low, with a mean absolute error (MAE) of 25.91° (Table 2, 1st row). The Staff Zone, equipped with four cameras providing overlapping views and close proximity to individuals, also exhibited lower MAE (32.41°) (Table 2, 6th row).
Surprisingly, the Left and Right Corridors, despite having low MOTA scores, demonstrated low orientation estimation errors with MAEs of 21.68° and 32.41°, respectively (Table 2, 3rd and 5th rows). These areas faced challenges in localization and tracking due to fewer cameras covering long and narrow distances. When estimating body orientations, the narrow width of the corridors made people tend to face forward or opposite to the camera viewpoints when they move, making it easier for the model to estimate body orientations. In contrast, the Lounge area, covered by a single camera and experiencing occlusions from objects, found it challenging to identify body orientations. This resulted in a higher MAE of 47.37° and lower Accuracy-45° of 55.4% (Table 2, 4th row). Overall, the placement of cameras is dependent on the space’s structural characteristics. Fewer cameras (1 or 2) suffice for narrow corridors to capture linear movements, while open spaces benefit from multi-view cameras to account for complex and unrestricted wandering.
4.2.2 5 People Walking Past Each other
The body orientation estimation model struggled with occlusions when people were close to each other. However, it still managed to achieve an Accuracy-90° score of 81.4%. This indicates that our model can reliably identify the four cardinal directions (N, E, S, W) even when people are in close proximity to each other and changing group formations dynamically. These insights establish a foundation for analyzing group activities in crowded areas, as successful group activity analysis necessitates the identification of group formations and facing directions during movement.
4.2.3 5 people Changing Orientations in Place
In this scenario, our model was capable of identifying the four cardinal directions (N, E, S, W) with a minimum accuracy of 69.3% (Acc.-90°). Similar to the previous experiment, the primary source of error was occlusions between people who were in close proximity, resulting in multiple individuals being captured in a single human bounding box. Additionally, our body orientation estimation model struggled to detect subtle changes in facing direction (approximately 5° to 10°) between consecutive frames, as it estimates orientations frame by frame. This indicates that our model performed better when individuals were walking, as our multi-person tracking method updated the orientation information based on their movement directions.
The accuracy of each session varied based on the number of cameras and the size of the areas they covered. In Session 1 (Table 2, 9th row), which was covered by three cameras and had a space of , the mean absolute error (MAE) was 73.7°. It’s worth noting that the samples in this session consisted of smaller groups with only two or three members. Session 2 (Table 2, 10th row) had a slightly lower MAE of 65.2°. In this session, group sizes were larger (four members), but the covered area was smaller () than in Session 1. This demonstrates the significance of multi-view cameras for improved accuracy. Session 3 (Table 2, 11th row) was particularly noteworthy, as it had the lowest MAE (50.4°) among all three sessions. Despite having a larger social group of five people, the capture space was only , and there were four cameras available, highlighting the importance of smaller areas and more cameras for better performance.
4.3 Impact of Parameters of Camera Installation
4.3.1 Distance Between Camera and Person
The majority of our samples exhibited localization errors within approximately 2 meters and orientation errors within 25 degrees when the distance between the person and the camera was less than 15 meters. This observation highlights that for the edge computing cameras, the portion of pixels corresponding to a person significantly diminishes as the person moves beyond 15 meters. The models faced more challenges when individuals obscured each other, making it appear as if multiple people were a single person when viewed from a distance. Additionally, the pose estimation models often struggled to distinguish between frontal and rear views of a person, particularly when the person was positioned over away from the camera, resulting in distorted keypoint predictions.
4.3.2 Facing Angle with Respect to Camera Viewpoint
The orientation at which the captured person was facing had a pronounced influence on the accuracy of both localization and body orientation estimation. Facing angles within 50 degrees of the camera’s line of sight were identified as pivotal in achieving a localization error of less than 2 meters and a body orientation error of less than 25 degrees. The 2D pose estimation model exhibited its optimal performance when the person was facing the camera directly, resulting in more confident estimations.
4.3.3 Horizontal Displacement from Camera Center
To achieve a localization error of less than and an orientation error of less than 25 degrees, it is essential that a person is within 30% of the horizontal field of view. When a person is captured too close to the frame boundaries, the lens distortion in the edge computing camera disrupts the planar assumption of the floor, leading to a degradation in the perspective transformation (as discussed in Sec. 2.3.3). This disruption significantly increases the localization error. Additionally, when subjects are only partially within the frame boundaries, the orientation estimation error also escalates.
4.3.4 Vertical Displacement from Camera Center
As illustrated in Figure 10 (4th column), our edge computing camera module exhibited limitations when it came to capturing the foot locations of individuals with normalized vertical angle. In such cases, the pose estimation model failed to detect the person. On the contrary, when the value of approached zero, both localization and body orientation errors showed a significant increase, primarily due to the greater distance between the captured person and the camera. The optimal range for the normalized vertical angle was found to be between . This corresponds to distances ranging from approximately 6 meters to 23 meters between the captured person and the camera. This observation aligns with the conclusions drawn from the analysis of horizontal camera distance discussed earlier.
4.4 Limitations
We identified structural variances of approximately compared to the building blueprint, which was used to develop our localization model in Sec. 2.3.3. Nevertheless, we deemed a margin of 2 meters for localization error to be acceptable for effectively tracking participant behavior at our study site in future applications.
When it comes to annotating body orientation, achieving precise turns in exact intervals of proved to be challenging for our participants. However, we consider an error range of up to to be reasonable for tracking social interactions during group activities. The normal horizontal field-of-view of the human eye is about 135°, and our system can detect dyadic interactions from overlapping field-of-view between two people with at most margin of error. In our analysis, the mean absolute error (MAE) for body orientation was found to be overall, which falls well within the acceptable margin of error.
The areas that were not covered in our evaluation are filled with tables, yoga mats, or gym equipment. Future studies will examine how complex movements and occlusions affect our tracking and body orientation estimation methods when people interact with those furniture and equipment. Despite these limitations in our evaluation, the proposed work shows promise as an initial step towards analyzing complex movements in open spaces using a privacy-preserving camera-based activity monitoring system using secure edge computing framework.
4.5 Future Applications
Clinical Application: Our system allows continuous and objective assessment of gait, spatial navigation, and group activities. Our system can be used to understand behavior and potentially detect behavioral changes in individuals with various motor and cognitive impairments [35]. The future work will further enable a system that may be able to predict falling episodes in real-time, thereby preventing an adverse event, by directly using 2D poses from multi-view cameras across the facility [36, 37].
Workspace Design: Social interactions at work, which are highly correlated with productivity and well-being, are influenced by workplace design [38]. Our system can provide detailed information on socio-spatial formation patterns, such as space occupancy, behavioral mapping [39], Proxemics (physical distance between the people) [40, 41], F-formation (shape and size of group formation) [42, 43], which allows the designer to take into account to design the workplace.
5 Conclusion
Camera-based movement monitoring systems are gaining popularity thanks to the progress in edge computing platforms and computer vision technologies. In this work, we demonstrated the practicality of employing edge computing cameras to localize, estimate body orientations and track multiple individuals within a large indoor space while not compromising on privacy. Our sensing hub leveraged cost-effective edge computing components, including a Raspberry Pi, its camera module, a Tensor Processing Unit (TPU), and a computing infrastructure that can be easily installed in pre-existing building setups.
In our study, the described system demonstrated highly reliable multi-person tracking ( MOTA) and body orientation estimation (29.0°) across various functional spaces. For the region with more cameras (), our system could track people in crowded activities with a higher level of accuracy (88.6% MOTA). Additionally, we anticipate that our comprehensive examination of camera installation will offer valuable insights for individuals interested in implementing our system to enhance their environments. In our future work, we plan to increase the camera density based on the insights from our analysis. We will also assess the viability of tracking social interactions in more intricate settings, such as those involving group activities amid furnishings or the use of gym equipment.
6 References
References
- [1] A. Haque, M. Guo, A. Alahi, S. Yeung, Z. Luo, A. Rege, J. Jopling, L. Downing, W. Beninati, A. Singh, T. Platchek, A. Milstein, and L. Fei-Fei, “Towards vision-based smart hospitals: a system for tracking and monitoring hand hygiene compliance,” in Machine Learning for Healthcare Conference. PMLR, 2017, pp. 75–87.
- [2] A. C. Yang, N. Lau, and J. C. Ho, “The role of bedroom privacy in social interaction among elderly residents in nursing homes: An exploratory case study of hong kong,” Sensors, vol. 20, no. 15, p. 4101, 2020.
- [3] P. E. Lopez-de Teruel, F. J. Garcia, O. Canovas, R. Gonzalez, and J. A. Carrasco, “Human behavior monitoring using a passive indoor positioning system: a case study in a sme,” Procedia Computer Science, vol. 110, pp. 182–189, 2017.
- [4] O. Dogan, J. Bayo-Monton, C. Fernandez-Llatas, and B. Oztaysi, “Analyzing of gender behaviors from paths using process mining: A shopping mall application,” Sensors, vol. 19, no. 3, p. 557, 2019.
- [5] N. K. Vuong, S. Chan, and C. T. Lau, “Automated detection of wandering patterns in people with dementia,” Gerontechnology, vol. 12, no. 3, pp. 127–147, 2014.
- [6] I. cheol Jeong, D. Bychkov, S. Hiser, J. D. Kreif, L. M. Klein, E. H. Hoyer, and P. C. Searson, “Using a real-time location system for assessment of patient ambulation in a hospital setting,” Archives of Physical Medicine and Rehabilitation, vol. 98, no. 7, pp. 1366–1373, 2017.
- [7] T. Van Haute, E. De Poorter, P. Crombez, F. Lemic, V. Handziski, N. Wirström, A. Wolisz, T. Voigt, and I. Moerman, “Performance analysis of multiple indoor positioning systems in a healthcare environment,” International Journal of Health Geographics, vol. 15, no. 1, pp. 1–15, 2016.
- [8] S. Yoo, S. Kim, E. Kim, E. Jung, K. Lee, and H. Hwang, “Real-time location system-based asset tracking in the healthcare field: lessons learned from a feasibility study,” BMC Medical Informatics and Decision Making, vol. 18, no. 1, pp. 1–10, 2018.
- [9] Y. Dai, Z. Hu, S. Zhang, and L. Liu, “A survey of detection-based video multi-object tracking,” Displays, p. 102317, 2022.
- [10] E. S. dos Reis, L. A. Seewald, R. S. Antunes, V. F. Rodrigues, R. da Rosa Righi, C. A. da Costa, L. G. da Silveira Jr, B. Eskofier, A. Maier, T. Horz et al., “Monocular multi-person pose estimation: A survey,” Pattern Recognition, vol. 118, p. 108046, 2021.
- [11] T. Tsai, C. Chang, and S. Chen, “Vision based indoor positioning for intelligent buildings,” in 2016 2nd International Conference on Intelligent Green Building and Smart Grid (IGBSG). IEEE, 2016, pp. 1–4.
- [12] A. Cosma, I. E. Radoi, and V. Radu, “Camloc: Pedestrian location estimation through body pose estimation on smart cameras,” in 2019 International Conference on Indoor Positioning and Indoor Navigation (IPIN). IEEE, 2019, pp. 1–8.
- [13] Z. Luo, J. Hsieh, N. Balachandar, S. Yeung, G. Pusiol, J. Luxenberg, G. Li, L. Li, N. L. Downing, A. Milstein, and L. Fei-Fei, “Computer vision-based descriptive analytics of seniors’ daily activities for long-term health monitoring,” Machine Learning for Healthcare (MLHC), vol. 2, no. 1, 2018.
- [14] D. Xue, A. Sayana, E. Darke, K. Shen, J. Hsieh, Z. Luo, L. Li, N. L. Downing, A. Milstein, and L. Fei-Fei, “Vision-based gait analysis for senior care,” arXiv preprint arXiv:1812.00169, 2018.
- [15] X. Jin, L. Li, F. Dang, X. Chen, and Y. Liu, “A survey on edge computing for wearable technology,” Digital Signal Processing, vol. 125, p. 103146, 2022.
- [16] P. B. Suresha, C. Hegde, Z. Jiang, and G. D. Clifford, “An edge computing and ambient data capture system for clinical and home environments,” Sensors, vol. 22, no. 7, p. 2511, 2022.
- [17] J. Barthélemy, N. Verstaevel, H. Forehead, and P. Perez, “Edge-computing video analytics for real-time traffic monitoring in a smart city,” Sensors, vol. 19, no. 9, p. 2048, 2019.
- [18] G. Papandreou, T. Zhu, L. Chen, S. Gidaris, J. Tompson, and K. Murphy, “Personlab: Person pose estimation and instance segmentation with a bottom-up, part-based, geometric embedding model,” in Proceedings of the European conference on computer vision (ECCV), 2018, pp. 269–286.
- [19] T. Lin, M. Maire, S. Belongie, J. Hays, P. Perona, D. Ramanan, P. Dollár, and C. L. Zitnick, “Microsoft coco: Common objects in context,” in Computer Vision–ECCV 2014: 13th European Conference, Zurich, Switzerland, September 6-12, 2014, Proceedings, Part V 13. Springer, 2014, pp. 740–755.
- [20] X. Li, K. Wang, W. Wang, and Y. Li, “A multiple object tracking method using kalman filter,” in The 2010 IEEE international conference on information and automation. IEEE, 2010, pp. 1862–1866.
- [21] R. E. Kalman, “A New Approach to Linear Filtering and Prediction Problems,” Journal of Basic Engineering, vol. 82, no. 1, pp. 35–45, 03 1960.
- [22] W. Chan and F. Hsiao, “Implementation of the rauch-tung-striebel smoother for sensor compatibility correction of a fixed-wing unmanned air vehicle,” Sensors, vol. 11, no. 4, pp. 3738–3764, 2011.
- [23] M. Sun, L. Zhang, Y. Liu, X. Miao, and X. Ding, “See-your-room: Indoor localization with camera vision,” in Proceedings of the ACM turing celebration conference-China, 2019, pp. 1–5.
- [24] C. Wu, Y. Chen, J. Luo, C. Su, A. Dawane, B. Hanzra, Z. Deng, B. Liu, J. Z. Wang, and C. Kuo, “Mebow: Monocular estimation of body orientation in the wild,” in Proceedings of the IEEE/CVF Conference on Computer Vision and Pattern Recognition, 2020, pp. 3451–3461.
- [25] Z. Zhang, “A flexible new technique for camera calibration,” IEEE Transactions on Pattern Analysis and Machine Intelligence, vol. 22, no. 11, pp. 1330–1334, 2000.
- [26] C. John and H. D. Allan, A first look at graph theory. Allied Publishers, 1995.
- [27] H. W. Kuhn, “The hungarian method for the assignment problem,” Naval Research Logistics Quarterly, vol. 2, no. 1-2, pp. 83–97, 1955.
- [28] K. Bernardin, A. Elbs, and R. Stiefelhagen, “Multiple object tracking performance metrics and evaluation in a smart room environment,” in Sixth IEEE International Workshop on Visual Surveillance, in conjunction with ECCV, vol. 90, no. 91. Citeseer, 2006.
- [29] P. Dendorfer, H. Rezatofighi, A. Milan, J. Shi, D. Cremers, I. Reid, S. Roth, K. Schindler, and L. Leal-Taixé, “Mot20: A benchmark for multi object tracking in crowded scenes,” arXiv preprint arXiv:2003.09003, 2020.
- [30] R. C. Browning, E. A. Baker, J. A. Herron, and R. Kram, “Effects of obesity and sex on the energetic cost and preferred speed of walking,” Journal of Applied Physiology, vol. 100, no. 2, pp. 390–398, 2006.
- [31] B. J. Mohler, W. B. Thompson, S. H. Creem-Regehr, H. L. Pick, and W. H. Warren, “Visual flow influences gait transition speed and preferred walking speed,” Experimental Brain Research, vol. 181, no. 2, pp. 221–228, 2007.
- [32] R. V. Levine and A. Norenzayan, “The pace of life in 31 countries,” Journal of Cross-cultural Psychology, vol. 30, no. 2, pp. 178–205, 1999.
- [33] D. Yu, H. Xiong, Q. Xu, J. Wang, and K. Li, “Continuous pedestrian orientation estimation using human keypoints,” in 2019 IEEE International Symposium on Circuits and Systems (ISCAS). IEEE, 2019, pp. 1–5.
- [34] M. Andriluka, S. Roth, and B. Schiele, “Monocular 3d pose estimation and tracking by detection,” in 2010 IEEE Computer Society Conference on Computer Vision and Pattern Recognition. Ieee, 2010, pp. 623–630.
- [35] M. Lindh-Rengifo, S. B. Jonasson, S. Ullén, E. Stomrud, S. Palmqvist, N. Mattsson-Carlgren, O. Hansson, and M. H. Nilsson, “Components of gait in people with and without mild cognitive impairment,” Gait & Posture, vol. 93, pp. 83–89, 2022.
- [36] H. W. Lach, B. E. Harrison, and S. Phongphanngam, “Falls and fall prevention in older adults with early-stage dementia: an integrative review,” Research in Gerontological Nursing, vol. 10, no. 3, pp. 139–148, 2017.
- [37] G. Allali and J. Verghese, “Management of gait changes and fall risk in mci and dementia,” Current Treatment Options in Neurology, vol. 19, pp. 1–18, 2017.
- [38] B. Lee, M. Lee, P. Zhang, A. Tessier, and A. Khan, “An empirical study of how socio-spatial formations are influenced by interior elements and displays in an office context,” Proceedings of the ACM on Human-Computer Interaction, vol. 3, no. CSCW, pp. 1–26, 2019.
- [39] A. Cox, J. Loebach, and S. Little, “Understanding the nature play milieu: using behavior mapping to investigate children’s activities in outdoor play spaces,” Children, Youth and Environments, vol. 28, no. 2, pp. 232–261, 2018.
- [40] T. Ballendat, N. Marquardt, and S. Greenberg, “Proxemic interaction: designing for a proximity and orientation-aware environment,” in ACM International Conference on Interactive Tabletops and Surfaces, 2010, pp. 121–130.
- [41] E. T. Hall, “A system for the notation of proxemic behavior,” American Anthropologist, vol. 65, no. 5, pp. 1003–1026, 1963.
- [42] M. Danninger, R. Vertegaal, D. P. Siewiorek, and A. Mamuji, “Using social geometry to manage interruptions and co-worker attention in office environments,” in Proceedings of Graphics Interface 2005. Citeseer, 2005, pp. 211–218.
- [43] A. Kendon, “Spatial organization in social encounters: The f-formation system,” Conducting Interaction: Patterns of Behavior in Focused Encounters, 1990.