Exploring the nature of UV-bright galaxies detected by JWST:
star formation, black hole accretion, or a non-universal IMF?
Abstract
We use the Cosmic Archaeology Tool (CAT) semi-analytical model to explore the contribution of Population (Pop) III/II stars and active galactic nuclei (AGNs) to the galaxy UV luminosity function (LF) evolution at . We compare in particular with recent JWST data in order to explore the apparent tension between observations and theoretical models in the number density of bright galaxies at . The model predicts a star formation history dominated by UV faint () galaxies, with a Pop III contribution of () at (). Stars are the primary sources of cosmic reionization, with of ionizing photons escaping into the intergalatic medium at , while the contribution of unobscured AGNs becomes dominant only at . The predicted stellar and AGN UV LFs reproduce the observational data at . At higher redshift, CAT predicts a steeper evolution in the faint-end slope (), and a number density of bright galaxies () consistent with data at , but smaller by 0.8 dex at , and 1.2 dex at , when compared to the values estimated by recent studies. Including the AGN emission does not affect the above findings, as AGNs contribute at most to of the total UV luminosity at and . Interestingly, considering a gradual transition in the stellar IMF, modulated by metallicity and redshift as suggested by recent simulations, the model agrees with JWST data at , and the disagreement at is reduced to 0.5 dex.
keywords:
cosmology: theory – cosmology: dark ages, reionisation, first stars – galaxies: high-redshift – galaxies: luminosity function, mass function – galaxies: active – quasars: supermassive black holes1 Introduction
The launch of James Webb Space Telescope (JWST) represents a major breakthrough in our understanding of the high-redshift Universe. The early release observations enabled the detection of several galaxy candidates with photometric redshifts (Castellano et al., 2022; Naidu et al., 2022; Labbe et al., 2022; Bradley et al., 2022; Harikane et al., 2023c; Tacchella et al., 2022; Williams et al., 2023; Adams et al., 2023b; Atek et al., 2023; Donnan et al., 2023; Tacchella et al., 2023), some of which with spectroscopic confirmation (Schaerer et al., 2022; Curti et al., 2023; Wang et al., 2022; Heintz et al., 2022b, a; Bunker et al., 2023; Arrabal Haro et al., 2023; Harikane et al., 2023b), including the currently most distant galaxy at (Curtis-Lake et al., 2022). This provides an unprecedented opportunity to explore the properties of the galaxy population in the first few hundreds million years of cosmic history, and to constrain their evolution. In particular, deep JWST observations are starting to constrain the low-mass end of the black hole (BH) mass function at (Übler et al., 2023; Kocevski et al., 2023; Harikane et al., 2023a; Maiolino et al., 2023c), observe accreting supermassive black holes (SMBHs) in the nuclei of galaxies at (Larson et al., 2023; Maiolino et al., 2023a), and detect potential signatures of the first stellar populations (Wang et al., 2022; Welch et al., 2022; Vanzella et al., 2023; Maiolino et al., 2023b).
The wealth of early JWST observations is already starting to challenge theoretical models. In particular, the number density of bright galaxies and its apparent lack of evolution between and are in tension with standard model predictions (Finkelstein et al., 2022a). Several physical causes have already been proposed to relieve this tension. A first possibility is that the observed UV bright galaxies arise as outliers of the general population, due to variations in halo formation histories, which lead to young ages ( Myr) and high star formation rates (Mason et al., 2023). Alternatively, the observed UV luminosity function at can be reproduced if the interstellar dust is evacuated by radiatively driven outflows during the earliest phase of galaxy build-up (Ferrara et al., 2022; Fiore et al., 2022; Ziparo et al., 2023). An overabundance of bright objects could also be explained if galaxies produce stars or UV photons more efficiently than expected due to a lack of star formation suppression at pre-reionization epochs (Harikane et al., 2023c), feedback-free starbursts (Dekel et al., 2023), less efficient stellar-driven winds (Yung et al., 2023), or to a more top-heavy stellar initial mass function (IMF) characterizing stellar populations at high redshift (Harikane et al., 2023c, b; Finkelstein et al., 2022a; Inayoshi et al., 2022; Yung et al., 2023). Indeed, the fraction of massive stars in high redshift stellar populations is expected to increase as a result of both the low metallicity (Omukai et al., 2005; Hirano et al., 2014, 2015; Chon et al., 2021) and the higher temperature of the Cosmic Microwave Background (CMB; Schneider & Omukai 2010; Chon et al. 2022). A considerable evolution of the stellar IMF might therefore be expected at , resulting into a reduced mass-to-light ratio in early galaxies. To test this hypothesis, spectroscopic signatures associated to the presence of massive stars, such as strong nebular line emission and significant SN-driven galactic winds, will be tested by forthcoming observations (Nakajima & Maiolino, 2022; Katz et al., 2022; Trussler et al., 2022). By looking at the inferred properties of JWST photometric sources (stellar masses, ages, and UV slopes), Mirocha & Furlanetto (2023) argue that a combination of increased star formation efficiency, short-term temporal variations in the star formation rate, and dust attenuation is required to match the observations. When the comparison is made with spectroscopically confirmed sources (Curtis-Lake et al., 2022; Robertson et al., 2023; Arrabal Haro et al., 2023), Keller et al. (2023) and McCaffrey et al. (2023) show that that existing cosmological simulations with varying resolution can generally reproduce the observations in terms of galaxy stellar masses, star formation rates, and number density of galaxies at . Similarly, Prada et al. (2023) show that forecasts of a standard cosmological galaxy formation model111They combine Uchuu N-body simulations (Ishiyama et al., 2021) with the Universe Machine galaxy formation algorithm (Behroozi et al., 2019). are consistent with the abundance of photometrically selected JWST/HST galaxies at and 10, and with the properties of spectroscopically confirmed galaxies at the same redshift; an exception is represented by the sample of red massive photometrically selected galaxies identified by Labbe et al. (2022) at , whose stellar masses exceeding may be affected by systematic errors, but if real would require a revision of the standard galaxy formation model (see e.g. Menci et al. 2022).
The above quoted studies show the complexity of interpreting early JWST measurements. One additional possibility is that at least a fraction of the observed UV luminosity densities at are produced by active galactic nucleus (AGN) activity (Pacucci et al., 2022). Indeed, ongoing JWST surveys, such as JADES Medium/Deep, CEERS, and PRIMER, are expected to be sensitive enough to detect tens of accreting BHs with masses at , with JADES Deep having the sensitivity to detect growing BHs with masses at (Trinca et al., 2023). While most of the JWST candidates show extended morphologies (Harikane et al., 2023c), JWST NIRSpec spectroscopy have detected broad emission lines from low-luminosity AGNs at (Kocevski et al., 2023; Übler et al., 2023; Harikane et al., 2023a; Maiolino et al., 2023c) and from sources at (Larson et al., 2023; Maiolino et al., 2023a), suggesting that AGN activity may contribute to the UV luminosity of at least a fraction of these sources. The estimated BH masses are and the ratio is higher than the empirical relationship measured for nearby broad-line AGNs with comparable BH masses (Reines & Volonteri, 2015). These findings are consistent with the expectations of theoretical models (Schneider et al., 2023), which show that JWST surveys have the sensitivity to detect early accreting black holes out to (Trinca et al., 2023), provided that these systems are overmassive with respect to their host galaxy stellar mass (Volonteri et al., 2022). Interestingly, none of the systems is detected in X-rays, and their position on the BPT (Baldwin et al., 1981), or the OHNO (Backhaus et al., 2022) diagrams is similar to that of star-forming galaxies observed at similar redshift. This means that the identification of these systems must be aided by properly designed color-selection techniques (Natarajan et al., 2017; Valiante et al., 2018; Zhang et al., 2021; Goulding & Greene, 2022; Inayoshi et al., 2022), or spectral diagnostics based on high-ionization lines, such as HeII and NeV (Nakajima & Maiolino, 2022; Cleri et al., 2023), but may ultimately rely on the detection of their broad emission lines (Kocevski et al. 2023; Übler et al. 2023; Larson et al. 2023; Harikane et al. 2023a; Maiolino et al. 2023c).
In this work, we aim to assess the impact of AGN emission and Population (Pop) III/II stars on the high-redshift galaxy UV luminosity function. We base our predictions on the Cosmic Archaeology Tool (CAT, Trinca et al. 2022), and we focus, in particular, on the redshift range probed by JWST, from out to (Harikane et al., 2023c; Bouwens et al., 2023; Pérez-González et al., 2023; Harikane et al., 2023b).
The paper is organized as follows. In section 2 we summarize the mean features of CAT and the improvements made in the modeling of the first sources. In section 3 and 4 we present our results. In particular, we first illustrate how the model complies with global constraints on the star formation (sec. 3.1) and cosmic reionization histories (sec. 3.3), and how our predictions compare with independent models. Then, we present the predicted redshift evolution of the galaxy luminosity function (sec. 4.1), tracing the contribution of AGNs (sec. 4.2) and Pop III stars (sec. 4.3) in different luminosity bins, and the potential effects of a gradual change in the stellar IMF with redshift and metallicity (sec. 4.3.2). Finally, in section 5 we summarize our findings and draw our main conclusions.
2 Modeling the first sources with CAT
Here we briefly recall the main features of the CAT model, presented in detail in Trinca et al. (2022), and the improved modeling that we have made for the present study (see sections 2.2 and 2.6).
CAT is a semi-analyical model which has been developed to follow the co-evolution of the first galaxies and their nuclear black holes through cosmic times. A large sample of dark matter (DM) hierarchical merger histories, representative of the evolution of the entire galaxy population, is generated from up to using the galform galaxy formation model (Parkinson et al., 2008), which is based on the extended Press-Schechter formalism. To describe star formation occurring in molecular and atomic-cooling halos, corresponding to virial temperatures and , respectively, we adopt a mass resolution that corresponds to a virial temperature of . Hence, the minimum resolved halo mass ranges from at to at . Once each DM halo virializes and collapses, the gas is accreted and, depending on the virial temperature, redshift and composition, it cools down and forms stars. The baryonic evolution is followed by means of a set of physically motivated prescriptions, that we briefly summarize below, with a set of free parameters: the star formation efficiency , the BH accretion parameter , the SN and AGN wind efficiencies , (see Eq.1, 3, 7, and 8). These are calibrated to reproduce the observed stellar mass density and star formation rate density at , and the SMBHs masses and luminosities inferred for the quasar population (for further details see section 3 in Trinca et al. 2022).
2.1 Star formation
The fraction of gas mass available for star formation depends on the balance between cooling and dynamical timescales. The star formation rate (SFR) is computed in each galaxy as:
| (1) |
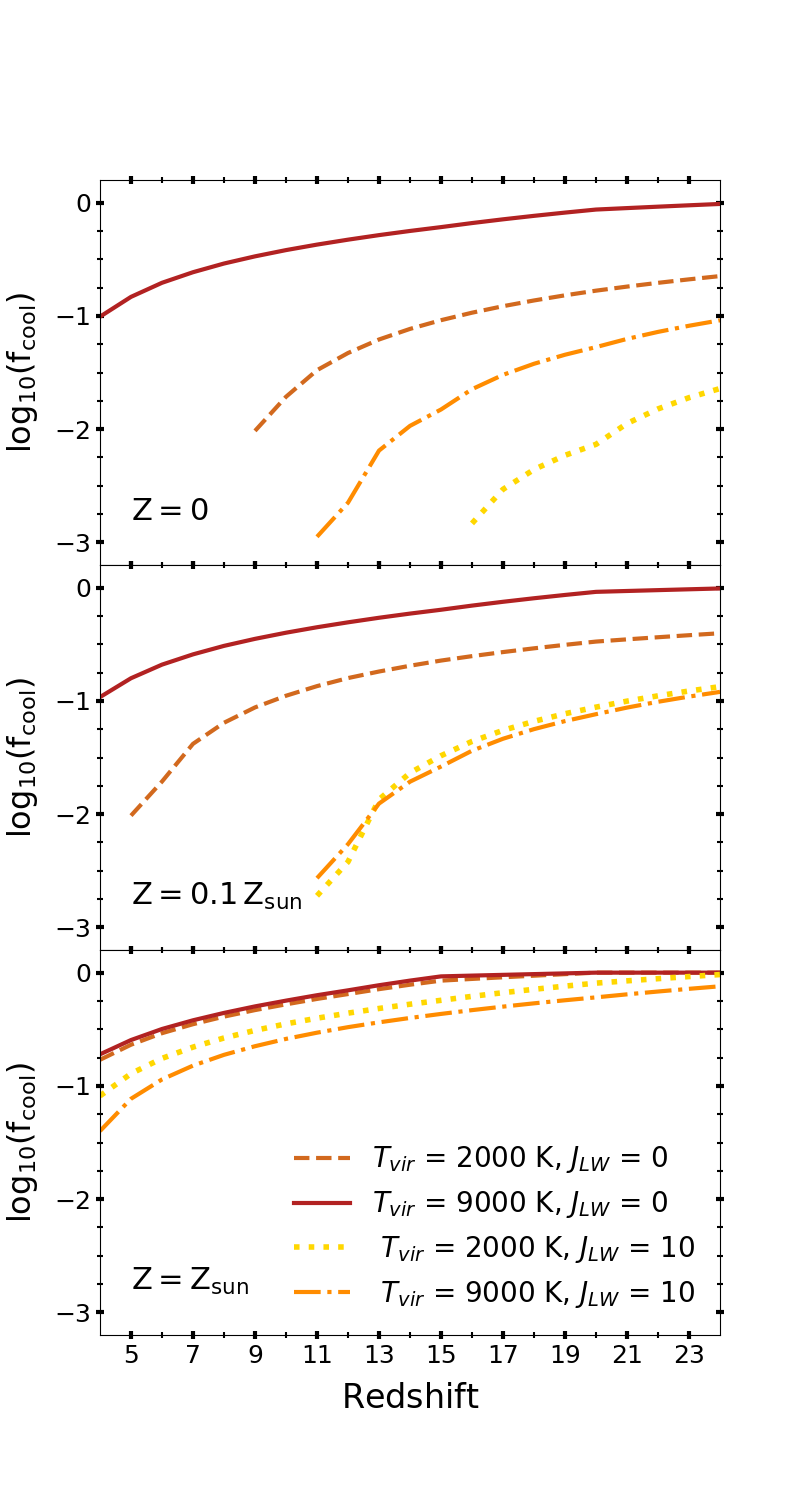
where is the available gas mass reservoir, is the dynamical time of the system, and is the star formation efficiency, which has been calibrated to match the star formation rate density and stellar mass density evolution at (see section 3 in Trinca et al. 2022). The parameter quantifies the reduced cooling efficiency inside molecular cooling halos (also referred to as minihalos) with respect to more massive atomic-cooling halos. In fact, in minihalos, where , the only efficient cooling channel in the primordial gas is provided by the roto-vibrational emission of molecular hydrogen (). If the star forming regions are exposed to a sufficiently large flux in the Lyman-Werner energy band, , emitted by nearby galaxies, the formation of can be strongly suppressed, decreasing the cooling efficiency (Fialkov et al., 2013; Sugimura et al., 2014; Valiante et al., 2016; Wolcott-Green et al., 2017). Once the gas in the galaxy inter-stellar medium (ISM) starts to become metal-enriched due to stellar evolution, metals and dust enhance the cooling efficiency in minihalos. Hence, the parameter in Eq. 1 depends on the halo virial temperature, redshift, gas metallicity, and intensity of the illuminating LW radiation. A thorough discussion of these physical dependencies of can be found in the Appendix A of Valiante et al. (2016). Here we provide a more synthetic description, and we show in Fig. 1 the value of as a function of redshift for minihalos with and , assuming two different values for the intensity of the illuminating LW flux ( and ), and three different gas metallicities: (primordial composition), and (see also Fig.1 in Sassano et al. 2021). When , the value of is close to unity for the most massive () mini-halos at high redshift, but it decreases with increasing and with decreasing metallicity. Concurrently, the cooling efficiency is reduced for smaller mini-halos () and it decreases toward lower redshift. Even moderate values of () lead to a significant drop in the cooling efficiency, particularly for metal-free and metal-poor gas compositions. Conversely, in atomic cooling halos we set .
2.2 Improved treatment of Population III stars
Relying on recent state-of-the-art hydrodynamical simulations, which follow in detail the formation of stellar systems in very metal-poor environments (Chon et al., 2021; Chon et al., 2022), we imposed a further requirement for the onset of star formation inside pristine halos. Since simulations suggest that cold gas clouds need to accumulate a sufficient amount of gas before undergoing collapse and fragmentation, we assumed that the cold gas mass inside each halo must be larger than a minimum value of to form stars. We also adopted an enhanced SF efficiency during Pop III star formation, assuming , while maintaining the standard efficiency (see Trinca et al., 2022) for subsequent stellar populations. This improved modeling sets the minimum total stellar mass formed in each Pop III star formation episodes to , in agreement with simulation results (Chon et al., 2022).
Theoretical studies suggest that at extremely low metallicities, such as the ones characterizing the first star forming regions, very massive stars are preferentially formed (Omukai & Nishi, 1998; Bromm et al., 2001; Omukai & Palla, 2003; Yoshida et al., 2008; Hosokawa et al., 2011). The initial mass function (IMF) of the first generation of stars, also referred to as PopIII stars, is therefore supposed to be top-heavy, with typical masses ranging from few 10s up to 100s of solar (Hirano et al., 2014, 2015; Susa et al., 2014; Hosokawa et al., 2016; Sugimura et al., 2020). Here we assume, for Pop III stars, a Larson IMF:
| (2) |
where is the characteristic mass, and the mass ranges between . Our choice is motivated by stellar archaeology studies and appears to best match the observed Galactic halo metallicity distribution function and the properties of C-enhanced and C-normal stars at [Fe/H] (de Bennassuti et al., 2014, 2017; Fraser et al., 2017; Magg et al., 2022; Aguado et al., 2023).
Under the environmental conditions where Pop III stars form (pristine galaxies hosted in DM minihalos), the total stellar mass formed in a dynamical timescale might be too small to fully sample the IMF of Pop III stars.222In fact, a total stellar mass of (Valiante et al., 2016) would be required to fully sample the Pop III IMF following a single star formation episode. Therefore, we stochastically sample the IMF during each episode of Pop III star formation, building up the population star by star until we saturate the total stellar mass formed. In addition, Pop III stars are often assumed to die instantaneously due to the rapid evolutionary timescales of very massive stars. However, for less massive stars, with and lifetimes , this assumption might lead to a significant underestimation of their total radiative output, as well as of the characteristic timescale of metal enrichment following their supernova (SN) explosions. For this reason, following each star formation episode, we define the lifetime of the stellar population as the lifetime of the most massive star formed, which represents the characteristic timescale for metal enrichment inside the host halo. As a result, multiple Pop III star formation episodes can occur within the same host halo before the most massive stars explode as SN, enriching the gas above the critical threshold of metallicity , and suppressing star formation due to mechanical feedback (see section 2.4).
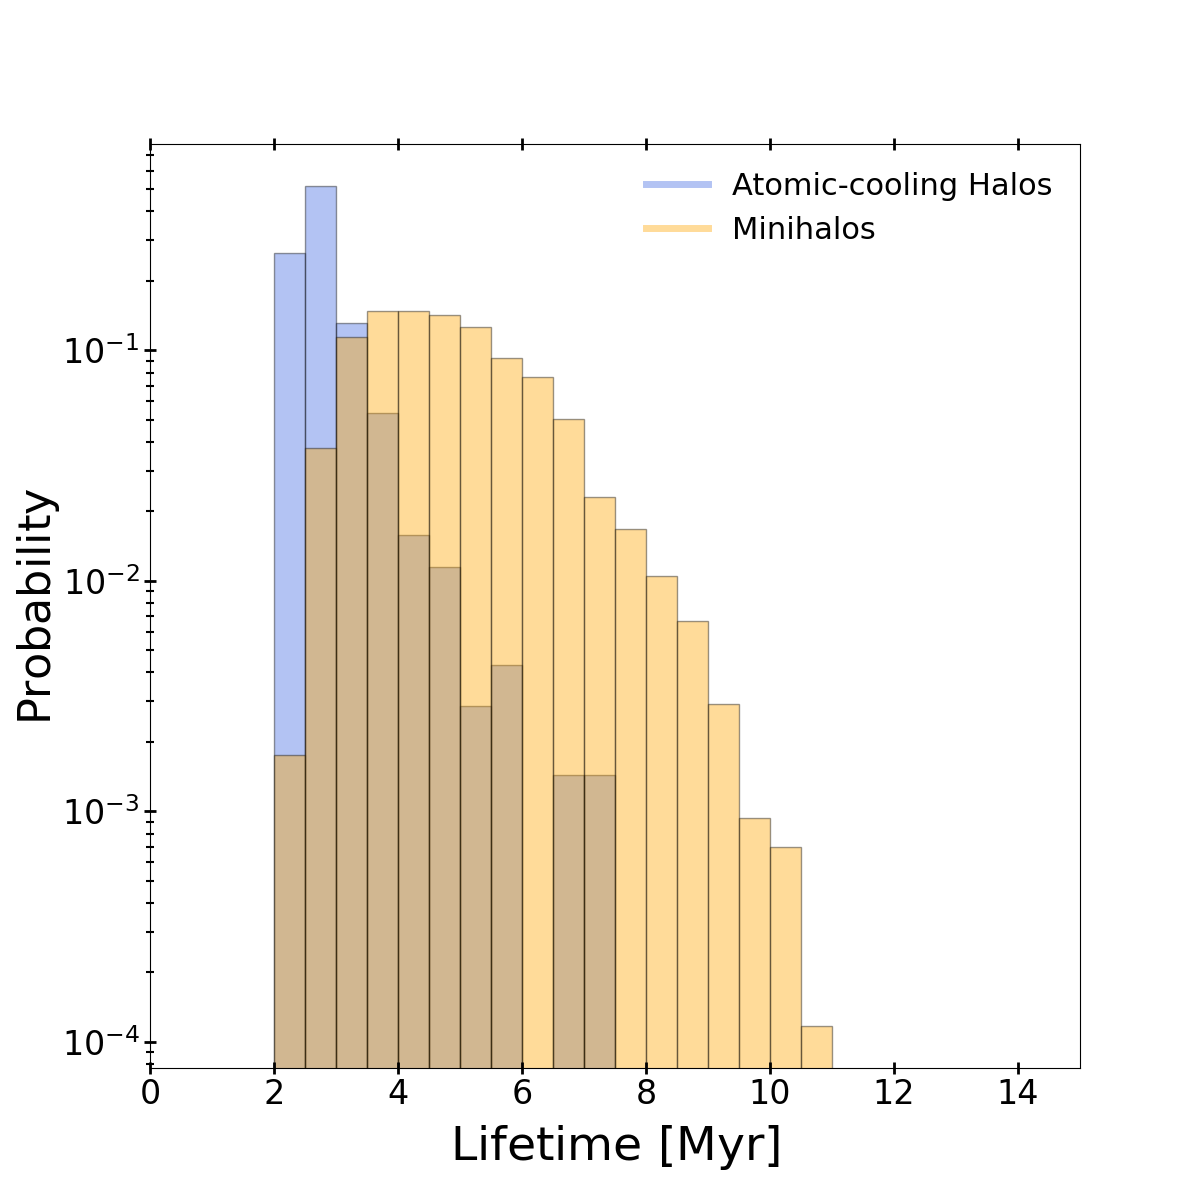
Figure 2 compares the resulting distribution of stellar lifetimes for Pop III stars formed in minihalos and atomic cooling halos. It is evident how the distribution changes depending on the halo properties. Inside minihalos, Pop III stars are characterized by longer lifetimes since fewer and less massive stars form. In fact, atomic cooling halos are more massive and characterized by more efficient cooling, providing a reservoir of cold gas large enough to sample the high mass end of the IMF (), leading to shorter Pop III lifetimes. In this case, the host halo will be more rapidly enriched, promptly transitioning towards Pop II star formation.
At higher metallicities, emission through metal-fine structure lines and the presence of dust increase the cooling efficiency. This leads to a transition toward lower characteristic masses. Therefore, above a critical metallicity of , we assume that the formation of Pop II stars follows a Larson IMF, given in Eq.2, with in the mass range [0.1, 100] .
2.3 Black hole seeds formation and growth
At the end of each Pop III star formation episode, we assume that the heaviest among the newly formed BH remnants forms a light BH seed. Inside atomic-cooling halos (where ), if metal and dust cooling are still inefficient () and molecular cooling is suppressed by a strong illuminating LW flux333This condition is usually expressed as , where is the cumulative flux into the LW energy band in units of . For consistency with our previous studies (Trinca et al., 2022, 2023), here we adopt a threshold value of . A thorough discussion on the value of for heavy BH seed formation can be found in Woods et al. (2019) and Inayoshi et al. (2020)., the gas collapses almost isothermally with no fragmentation. This leads to the formation of a single supermassive star that becomes unstable, due to nuclear exhaustion or GR instabilities, forming a heavy BH seed with a mass of (Hosokawa et al., 2012; Inayoshi et al., 2014; Latif et al., 2013; Ferrara et al., 2014; Becerra et al., 2015; Latif & Ferrara, 2016; Becerra et al., 2018). Note that we do not consider intermediate mass BH seeds, which are supposed to from runaway mergers in dense stellar clusters (see Sassano et al. 2021 for a recent investigation that considers all the three BH seeds populations).
Once formed, BH seeds are assumed to settle at the center of the host galaxy, where they can accrete gas and grow in mass. High resolution zoom-in simulations show that if the BH seed mass is less than , its dynamical evolution is very perturbed by the irregular gas and stellar distribution in high-redshift galaxies (Pfister et al., 2019; Sassano et al., 2023). This effect will further suppress the growth of light BH seeds, as discussed by Trinca et al. (2022), but have a smaller impact on the observable population of accreting BHs, which largely descend from heavy BH seeds (Trinca et al., 2023).
The gas accretion rate onto BHs is described by the Bondi-Hoyle-Lyttleton (BHL) formula (Hoyle & Lyttleton, 1941; Bondi, 1952):
| (3) |
where is the sound speed, is the gas density evaluated at the radius of gravitational influence of the BH and . The boost factor is included to take into account the density enhancement at small scales around the BH and is one of the free parameters of the model, which has been calibrated to reproduce the range of BH mass and bolometric luminosity of the observed quasar population at (Trinca et al., 2022).
In our reference model, the gas accretion rate, , cannot exceed the Eddington limit, so that:
| (4) |
and the BH mass growth rate is computed as:
| (5) |
where, , is the adopted radiative efficiency, and is the Eddington luminosity ( is the speed of light, is the proton mass and is the Thomson scattering cross section).
During galaxy mergers, the two nuclear BHs may sink to the center of the newly formed galaxy, form a binary system and merge. The timescale of this process can be considerably longer than halo sinking timescales (Tremmel et al., 2018), but the formation of coalescing BH pairs may be facilitated if the BHs have masses and are hosted in galaxies with high central stellar and gas densities (Volonteri et al., 2020). Here we take a very simplified approach, and assume that two BHs coalesce during major mergers, i.e. if the mass ratio of their interacting host DM halos is (Tanaka & Haiman, 2009; Valiante et al., 2011). Conversely, in minor mergers (), only the most massive among the two nuclear BHs is assumed to migrate to the center of the newly formed galaxy. We note here that this oversimplification has a relatively small impact on BH mass growth, which is largely dominated by gas accretion (Dubois et al., 2014; Valiante et al., 2016; Pacucci & Loeb, 2020).
2.4 Mechanical and radiative feedback
The abundance of gas inside each galaxy is affected by mechanical feedback due to galaxy-scale outflows driven by the energy released by SN explosions and BH accretion,
| (6) |
where and are the SN- and AGN-driven outflow rates. The first term is defined as:
| (7) |
where is the explosion energy per SN, is the escape velocity of the galaxy, is a free parameter representing the SN-driven wind efficiency, and is the SN explosion rate. The latter quantity depends on the star formation history and on the nature of the stellar populations hosted by each galaxy: for Pop III stars, is assumed to be erg, while for Pop II/I stars, erg.
The second term in Eq. 6 is computed as,
| (8) |
where is the AGN-driven wind efficiency. Following Trinca et al. (2022), in our reference model, we assume that . While quasars accreting at (or above) the Eddington limit are more likely to show strong outflows that contribute to evacuate the gas from the inner galactic regions, broad, blushifted absorption lines tracing outflowing gas have also been detected in AGNs accreting at more moderately pace, down to few percent Eddington (see e.g. Ganguly et al. 2007). Following Trinca et al. (2022, 2023), we parametrize BH feedback as described in Eq. 8 even when BHs do not exceed the Eddington limit, as in the model that we discuss in the present work (see also Weinberger et al. 2017; Negri & Volonteri 2017; Tremmel et al. 2019; Piana et al. 2022 for similar descriptions of BH feedback).
In addition to the radiative feedback induced by LW photons, described in section 2.1, during the process of cosmic reionization the photo-heating due to the increased gas temperature in photo-ionized regions can suppress star formation in haloes with virial temperatures below the temperature of the intergalactic medium (IGM, Valiante et al. 2016). We consider , where , and the filling factor of HII regions, , is computed as described below.
2.5 Metal and dust enrichment
Following Valiante et al. (2014) and de Bennassuti et al. (2014), CAT follows the metal and dust enrichment in each galaxy adopting a two-phase ISM model, with a cold atomic/molecular phase, where star formation occurs and where dust grains can grow in mass by accreting gas-phase metals, and a hot/warm diffuse phase where dust can be destroyed by SN shocks. Following DM halo virialization, the gas is initially accreted into the diffuse phase, then it condenses into the cold/molecular phase, where star formation occurs. Stars evolve and return gas, metal and dust into the diffuse phase. Finally, mechanical feedback due to SN explosions and AGN eject gas from the diffuse and condensed phases, following the description provided in section 2.4. Metal and dust enrichment in the two-phase ISM is described by a system of differential equations, which relies on mass- and metallicity-dependent metal and dust yields and follows the release of nucleosynthetic products on the stellar characteristic lifetimes. We refer the interested readers to Valiante et al. (2014) and de Bennassuti et al. (2014) for a thorough description of the chemical evolution model implemented in CAT.
2.6 Photo-ionizing emission and reionization
CAT follows the formation of the first stars and BHs across cosmic epochs in our galaxy sample. Therefore, we can investigate the relative contribution of different classes of sources to cosmic reionization. In particular, at different redshifts, we can compute the photo-ionizing emissivities from Pop II stars, Pop III stars and early accreting BHs evolving in each galaxy of our sample.
For Pop III stars we compute the photo-ionizing emission rate from the mass-dependent emissivities tabulated by Schaerer (2002) for zero metallicity stars with no mass loss. For Pop II stars, we adopt the metallicity- and age-dependent intrinsic emissivities computed using Bruzual & Charlot (2003) population synthesis model. To compute the emission rate of ionizing photons from early accreting BHs, we model their spectral energy distribution (SED) as a multicolor-disk spectrum up to energies of plus a non-thermal power-law component with at higher energies (Shakura & Sunyaev, 1973).
Two additional effects need to be considered in order to model cosmic reionization: (i) only a fraction of the ionizing photons emitted will escape the galaxy and reach the outer medium, and (ii) the IGM density increases its inhomogeneity with time, leading to higher gas opacity to ionizing photons, and to a slower reionization process. These effects are usually modeled with two parameters that are still poorly constrained by theoretical models and observations; the escape fraction, , i.e. the fraction of ionizing photons that are able to escape the galaxy, and the clumping factor, , which quantifies the increased clumpiness of the IGM.
Starting from the source emissivities, these two additional parameters allow us to predict the redshift evolution of the volume filling factor of ionized hydrogen, . Several works showed that a decreasing trend with redshift of is required to simultaneously accommodate the production rate of ionizing photons associated with star formation and the available constraints on the IGM electron scattering optical depth . Therefore, following Dayal et al. (2020), we assume a redshift dependent escape fraction for ionizing photons emitted by Pop II and Pop III stars:
| (9) |
where we choose and , such that varies between for . The range of values assumed for the galaxy escape fraction is in broad agreement with empirical constraints obtained from early JWST observations. Recent results by Mascia et al. (2023), based on a sample of 24 lensed galaxies at , suggest typical mean values of , while Schaerer et al. (2022) find smaller values, , for three systems at . For the AGN ionizing emission, instead, we make the assumption that the fraction of unobscured AGNs can be used as a tracer of the escape fraction (Ricci et al., 2017; Dayal et al., 2020). Therefore, following Ueda et al. (2014), we adopt a luminosity-dependent parametrization:
| (10) |
with , , , and is the AGN X-ray luminosity in the energy band (for further details see Trinca et al., 2022).
For the IGM clumping, we rely on the parametrization proposed by Iliev et al. (2005), and we adopt the following redshift dependent clumping factor:
| (11) |
The time evolution of the volume filling factor for ionized hydrogen, , can be written as (Barkana & Loeb, 2001):
| (12) |
where is the total emission rate of ionizing photons per unit volume computed summing over all the available sources, is the number density of the hydrogen gas in the IGM, is the hydrogen mass fraction, is the IGM gas number density and is case-B hydrogen recombination rate. From , we can compute the IGM optical depth to electron scattering as:
| (13) |
where is the Thomson cross section, is the speed of light and is the mean electron number density at , which can be written as:
| (14) |
where is the mean baryon number density at .
3 Global observational constraints
In this section, we first describe the redshift evolution of the comoving star formation rate density predicted by the model. Then, we show the predicted redshift evolution of the hydrogen ionizing emissivity and neutral hydrogen fraction, and how these compare with available observational data.
3.1 Star Formation History
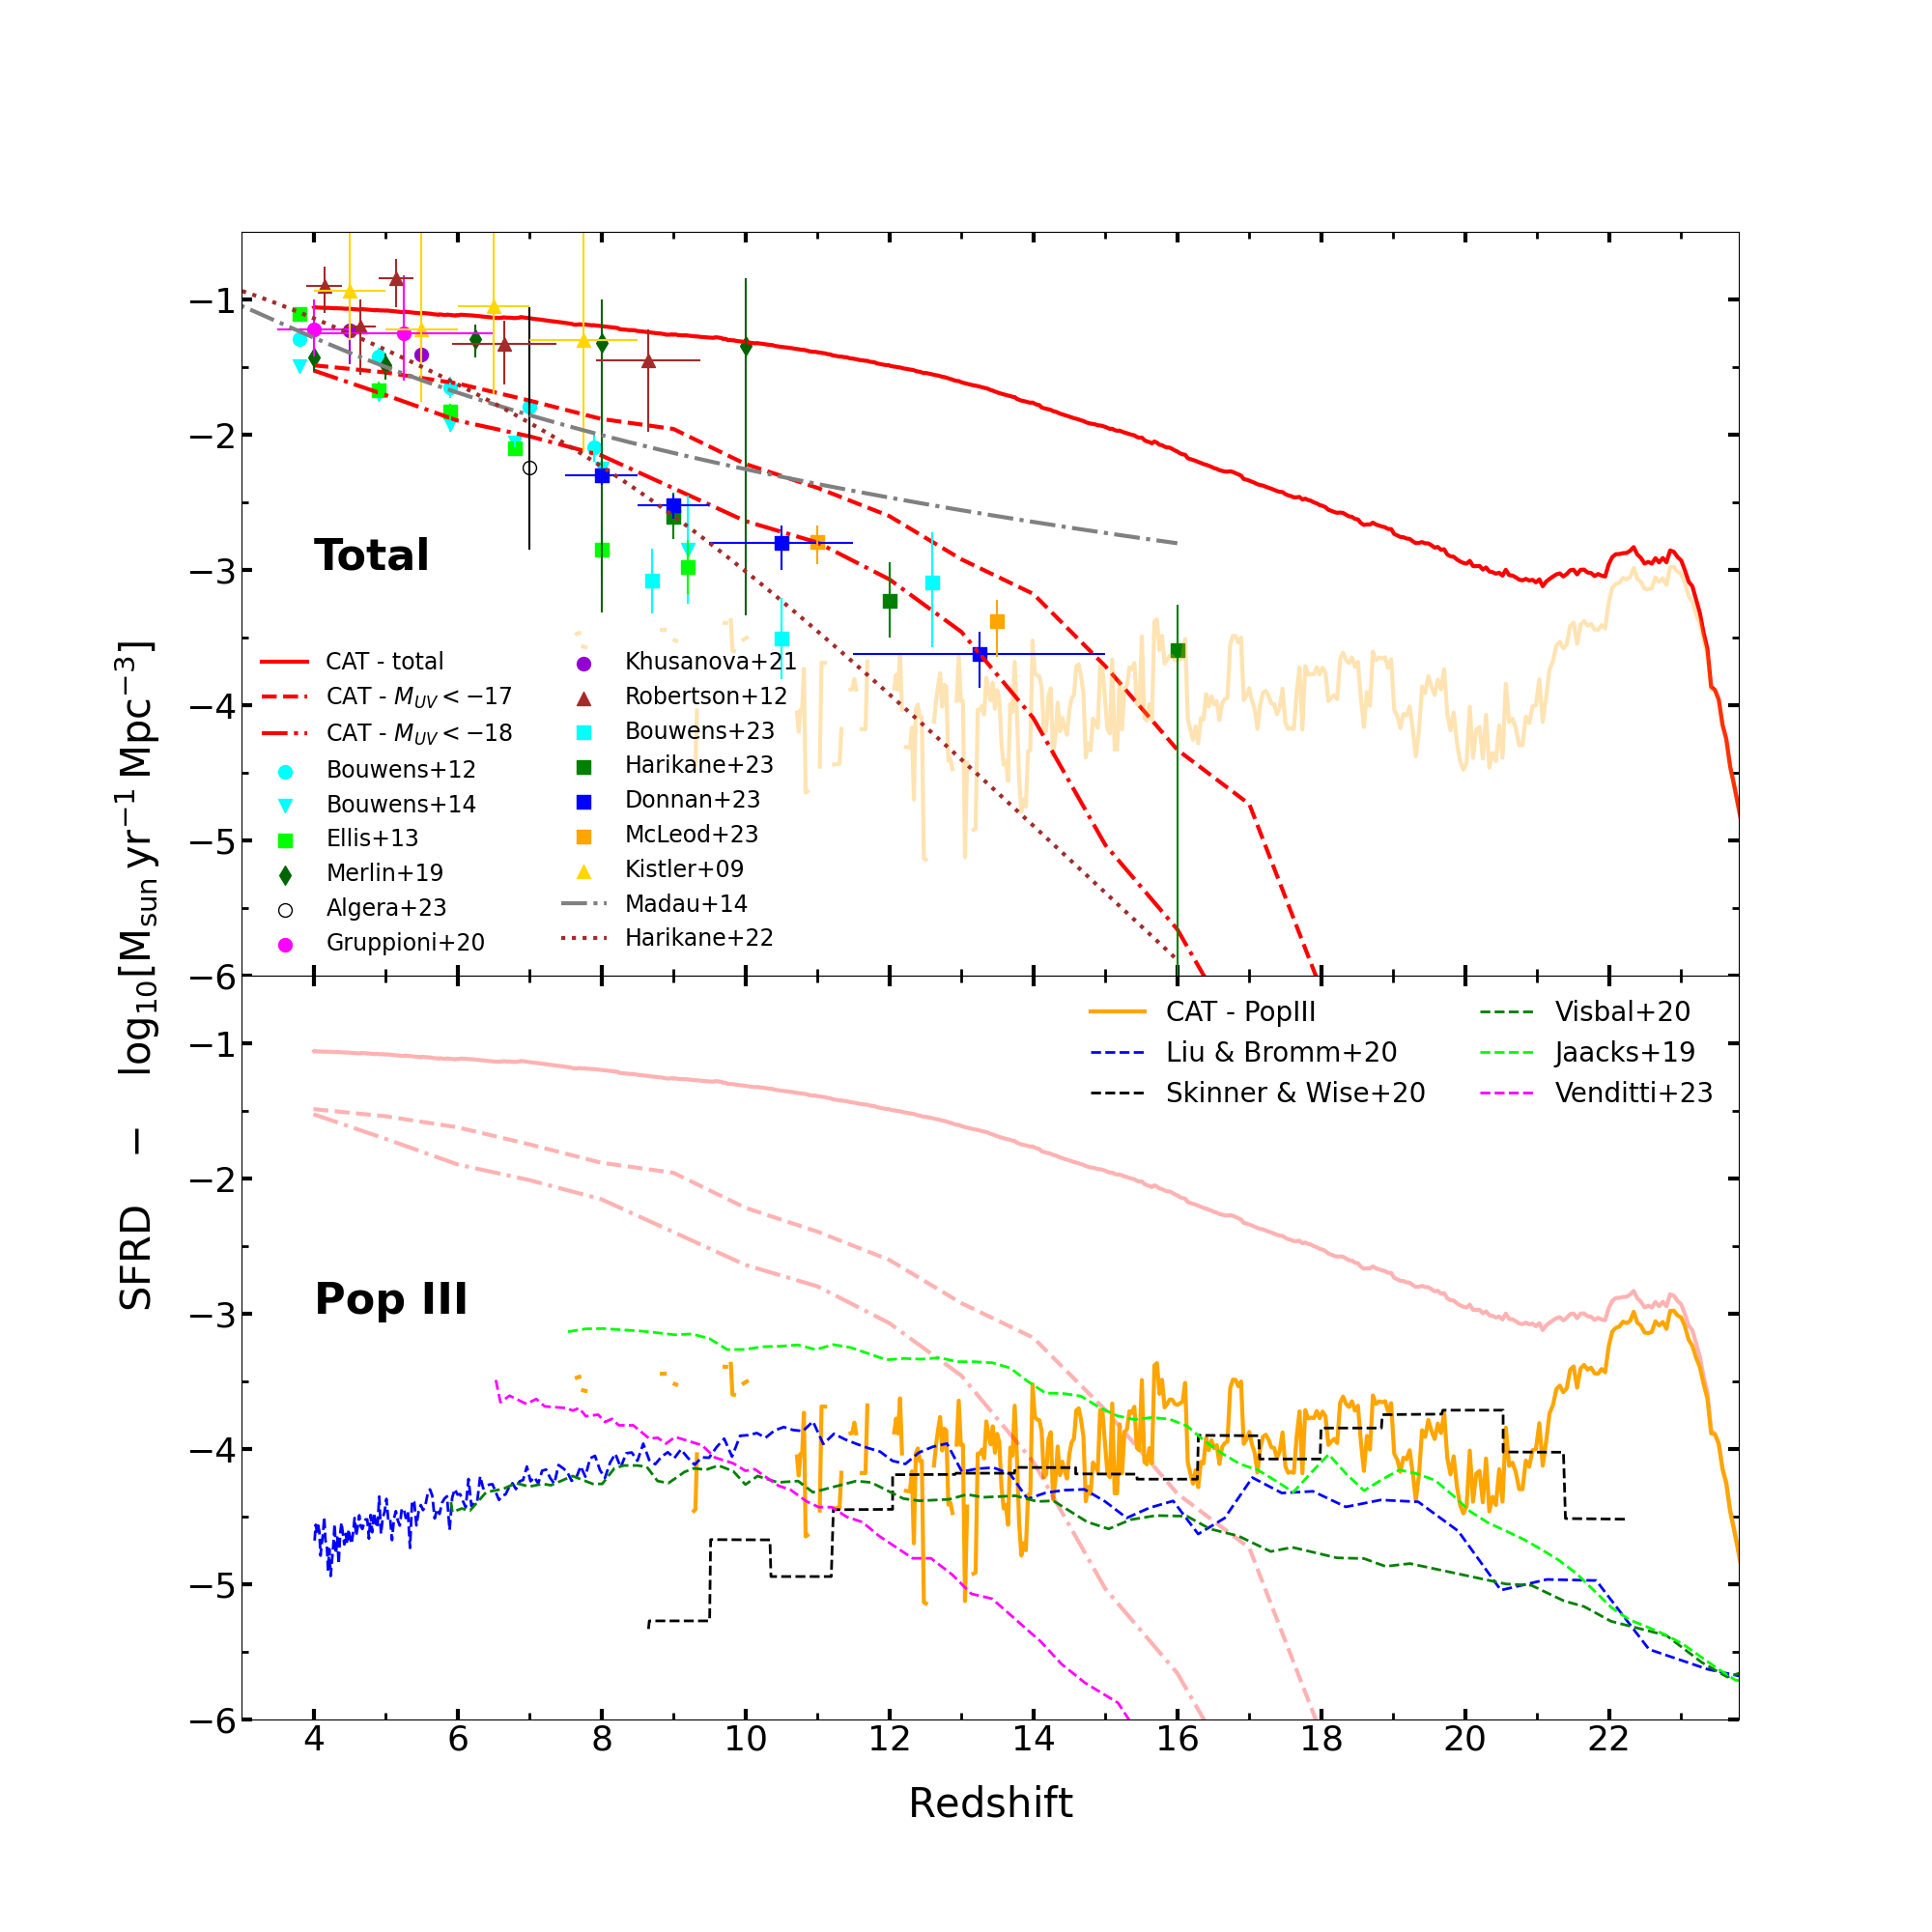
In the upper panel of Figure 3 we show the star formation rate density (SFRD) evolution predicted by CAT at . The red solid line represents the total SFRD, while the dashed and dash-dotted red lines indicate the SFRD for galaxies with intrinsic UV magnitude smaller, i.e., brighter, than and , respectively (see also Trinca et al. 2022). We compare our results with observational constraints by Bouwens et al. (2012, 2014); Ellis et al. (2013); Merlin et al. (2019), and with recent JWST data at (Bouwens et al., 2023; Harikane et al., 2023c; Donnan et al., 2023; McLeod et al., 2023). We also show the empirical relations proposed by Madau et al. (2014) extrapolated to (gray dashed-dot line) and the constant star formation efficiency model by Harikane et al. (2023c) (maroon dotted line). In the redshift range , CAT predictions for the total SFRD are in good agreement with data from Merlin et al. (2019), who estimated the contribution of high-redshift passive galaxies to the global SFRD during their phase of activity. It is also consistent with the SFRD estimated from ALMA large surveys, in particular from ALPINE data by Khusanova et al. (2021) and Gruppioni et al. (2020), and from REBELS data by Algera et al. (2023), and it is in very good agreement with the SFRD inferred from gamma-ray burst observations, which are sensitive to both obscured and unobscured star formation (Kistler et al., 2009; Robertson & Ellis, 2012). Conversely, the SFRD derived from the rest-frame UV luminosity are better reproduced by CAT when only the contribution of the sources brightest than is considered (Trinca et al., 2022). We stress that the total SFRD computed with CAT accounts for both intrinsically faint objects and for obscured sources, which are better traced by rest-frame FIR observations.
3.2 Pop III Star Formation History
In the lower panel of Figure 3 we also show the predicted SFRD for Pop III stars (solid orange line). The Pop III SFRD predicted by CAT is characterised by an initial steep rise at , and then declines to follow a relatively flat evolution. Indeed, despite the scatter due to the intrinsic burstiness of Pop III star formation, we find an almost constant SFRD of over the redshift range , below which the ISM metal enrichment of galaxies causes Pop III star formation to become progressively rarer. In Figure 3, we also show the Pop III SFRD predicted by high-resolution (Jaacks et al., 2019; Liu & Bromm, 2020; Skinner & Wise, 2020) and large-scale (Venditti et al., 2023) hydrodynamical simulations, and the results of the semi-analytical model by Visbal et al. (2020). Orders of magnitude differences are found between different studies. In particular, the mass resolution and scale of the simulations significantly affect the predicted SFRD at early times, where SAM models and small scale hydrodynamical simulations better resolve the large population of star forming minihalos (Visbal et al., 2020; Skinner & Wise, 2020). Further discrepancies can be ascribed to the different treatment of radiative feedback, which can be implemented sub-grid or properly accounted for by adopting a full radiative transfer scheme (Maio et al., 2016; Xu et al., 2016). Likewise, the implementation of chemical evolution can vary among different studies, with only few models adopting mass and metallicity-dependent stellar yields and accounting for the presence of cosmic dust. Finally, distinct assumptions are made in different simulations regarding the Pop III stellar IMF and the critical metallicity threshold for Pop II star formation (see e.g. Venditti et al., 2023, for a detailed discussion). CAT results appear to be in broad agreement with high-resolution simulations (Jaacks et al., 2019; Skinner & Wise, 2020), which tend to predict larger SFRDs, especially in the redshift range . This might be related to the ability of resolving Pop III star formation in small DM minihalos, which are generally below the resolution threshold of large-scale simulations (Sarmento & Scannapieco, 2022; Venditti et al., 2023). Interestingly, the Pop III SFRD predicted by CAT is in very good agreement with the predictions of Skinner & Wise (2020) down to , below which their SFRD quickly decreases, due to the strong impact of LW radiation inside the simulated comoving box. The high Pop III SFRD predicted by CAT at is a consequence of the lack of self-regulation in the early star-forming regions hosted by the first mini-halos. The description of Pop III star formation in these systems implemented in CAT accounts for the stochasticity in their IMF, and the population is evolved over the typical lifetimes of the more massive stars formed; these masses are generally smaller in mini-halos than in Lyman-alpha cooling halos (see Figure 2), as a result of the reduced gas mass available for star formation. Because of this, mechanical feedback acts on longer timescales. Once feedback becomes efficient, star formation begins to self-regulate, as indicated by the descending trend of the SFRD at , only Myr after the first star-forming episodes at . Different assumptions are made in other semi-analytical models. For instance, in the work by Visbal et al. (2020), a constant time delay of is assumed after the first episode of Pop III SF before subsequent metal-enriched SF can occur, to account for the gas recovery time after SN explosions. This different treatment of Pop III SF can account for the large discrepancy in the predicted SFRD at very early times, before stellar feedback starts to efficiently self-regulate the SF process, leading to much closer trends at .
3.3 Cosmic Reionization
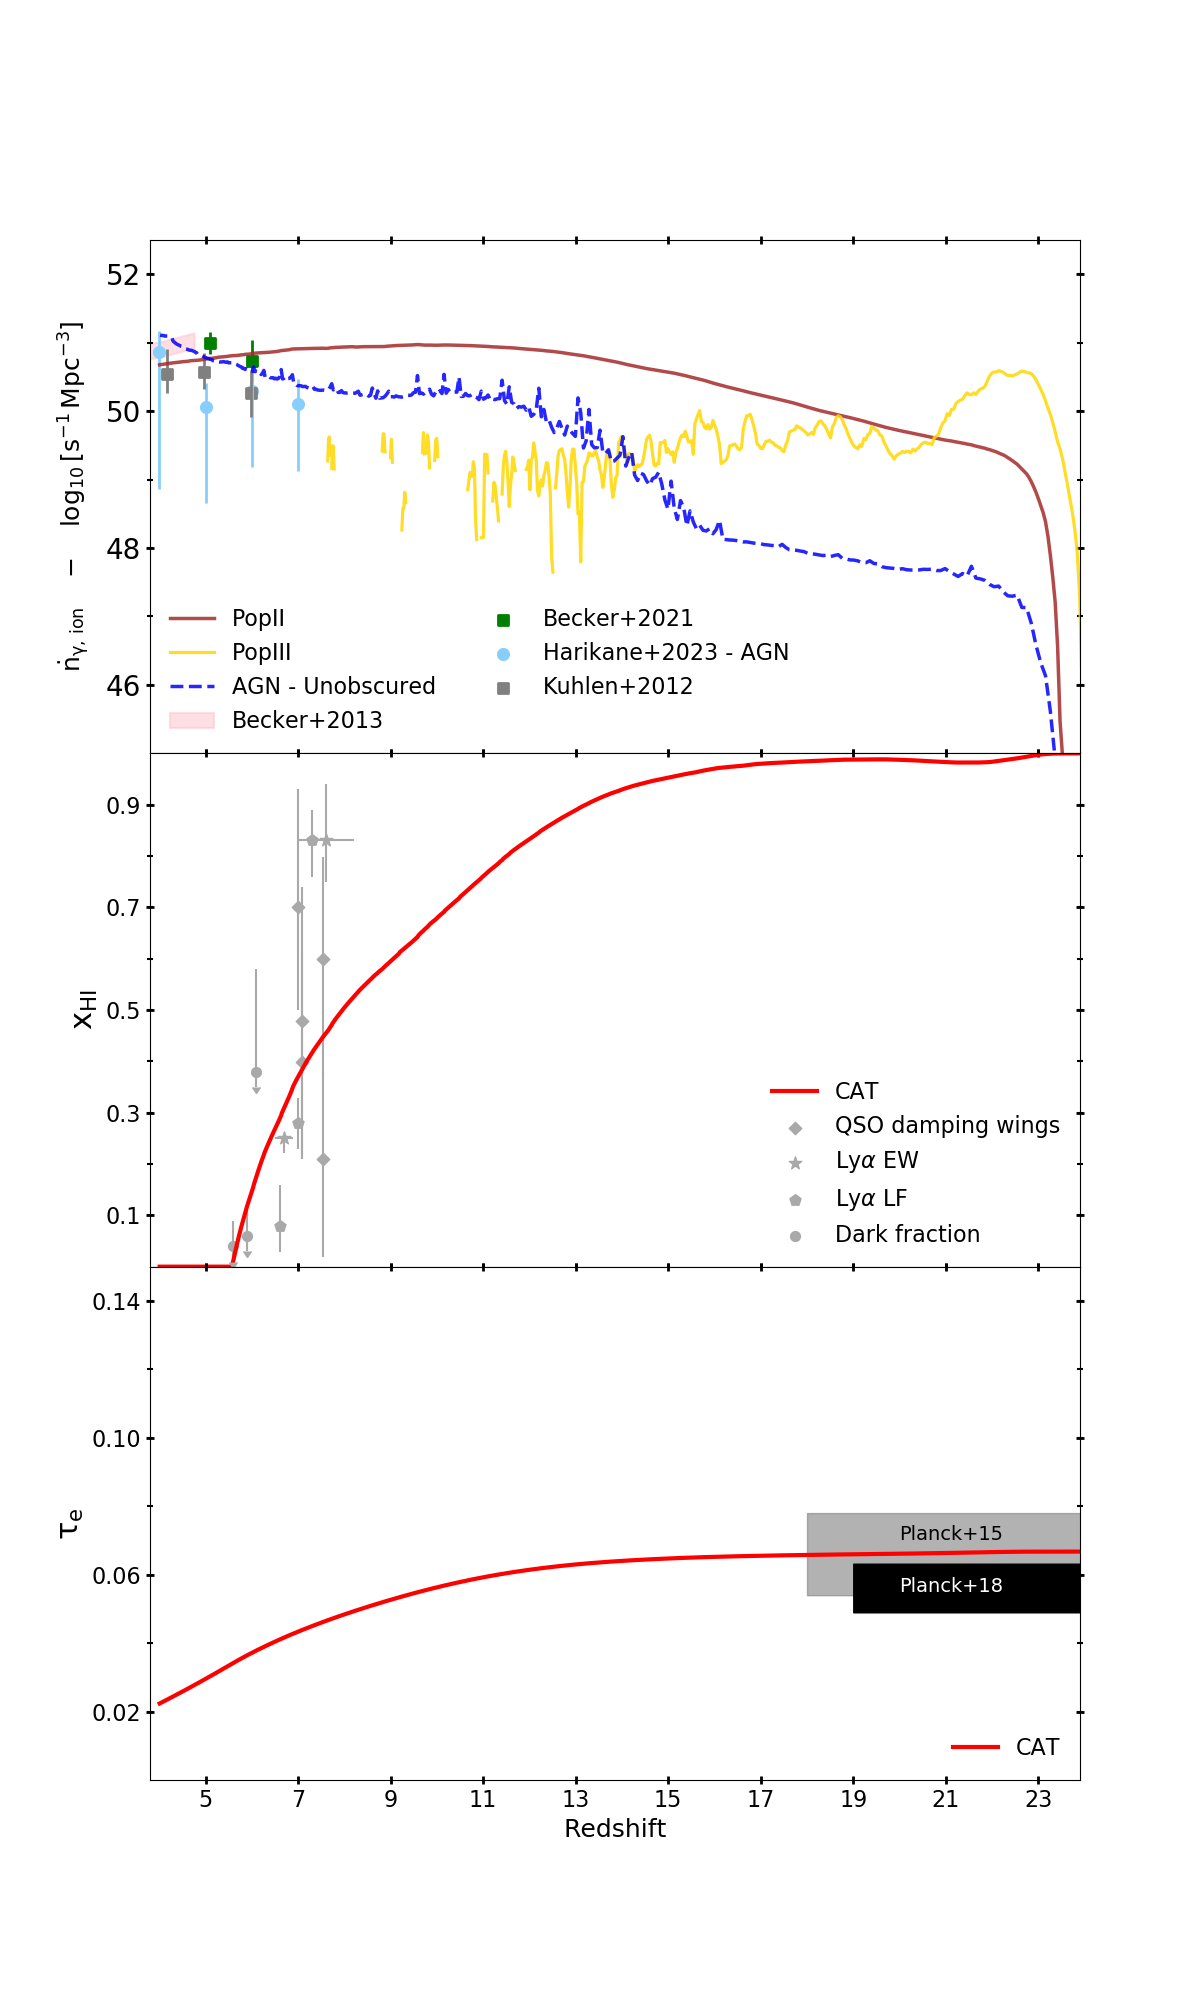
In Figure 4, we illustrate the reionization history predicted by CAT, with the relative role played by different sources of ionizing photons. In the upper panel, we show the evolution in redshift of the global photo-ionizing emissivity, i.e. the rate of ionizing photons injected into the IGM by the entire galaxy population. Different colored lines represent the contribution of Pop II stars (solid brown), Pop III stars (solid yellow), and AGNs (blue dashed), which we assume to include the entire population of early accreting nuclear BHs. For all sources, the intrinsic photon rates are corrected for the adopted escape fractions (Eq. 9 for Pop II and Pop III stars and Eq. 10 for AGNs).
The emissivity of Pop III stars initially rises quickly and peaks at , to remain then almost constant with , closely tracing the Pop III SFRD evolution, down to the last few episodes of Pop III star formation at . The contribution of Pop II stars shows a smooth increase from to , below which it slowly declines, despite the increasing trend of the Pop II SFRD, as a consequence of the decrease in the escape fraction . The parametric evolution of described by Eq. 9, translates into values of at , respectively. Despite the large uncertainties that still affect observational constraints, these values are consistent with recent results (Finkelstein et al., 2019; Naidu et al., 2020; Schaerer, 2002; Mascia et al., 2023), which suggest a global averaged escape fraction between at , and a rising emissivity with increasing redshift throughout the epoch of reionization. It is interesting to note that the Pop II emissivity starts to significantly dominate over the Pop III contribution only at , when the SFRD of Pop III stars is already below the Pop II one (see Figure 3). This is a result of the different stellar IMF and metallicity of the two populations, with massive and very massive Pop III stars having much harder spectra and higher ionizing photon emissivities per unit stellar mass.
In our reference model, stars are the primary source of ionizing photons in the IGM. At , the BHs hosted in galaxy nuclei are descendants of light seeds, with typical initial masses of . Their mass growth proceeds in the Bondi-Hoyle gas accretion regime, and is highly inefficient, as shown in Trinca et al. (2022). As a consequence, the first accreting BHs at are intrinsically faint sources of photo-ionizing radiation. At , heavy BH seeds form, with masses , and their gas accretion is more efficient. As a result, the AGN ionizing emissivity starts to increase, but remains subdominant with respect to the Pop II stellar emission down to .
In the redshift range the photo-ionizing emissivity predicted by CAT is in good agreement with the empirical constraints on the ionizing ultraviolet background obtained by Becker & Bolton (2013) and Becker et al. (2021), with unobscured AGNs (blue dashed line) providing the dominant contribution only at . The predicted AGN emissivity appears to be consistent with the recent estimates from Harikane et al. (2023a), based on the first census of 10 faint broad-line AGNs at detected in early JWST observations.
In the central panel of Figure 4, we show the IGM fraction of neutral hydrogen, , predicted by CAT (red solid curve), compared with empirical constraints presented by Bolan et al. (2022, grey data points) and obtained with different inference methods, based on Lyman-break galaxy (LBG) samples (Morales et al., 2021; Bolan et al., 2022), constraints from the dark pixel fraction in the Ly- and Ly- forest (McGreer et al., 2015), and quasar damping wings (Davies et al., 2018; Greig et al., 2019; Wang et al., 2020). We find that the ionization process is complete around , in agreement with the end of the reionization epoch expected from observational constraints. In addition, we find a good agreement with observations at , although it is important to notice that empirical estimates at are inferred from different tracers and show a large scatter. In particular, analysis based on damping wings of bright quasars (Davies et al., 2018) suggest a lower neutral fraction at with respect to estimates obtained from LBG samples, and are in closer agreement with CAT predictions. These uncertainties in the higher redshift range will improve with forthcoming deep JWST surveys at , which will put tighter constraints on the evolution of the IGM neutral fraction with combined photometric and spectroscopic data.
Finally, the lower panel of Figure 4 shows the evolution of the electron scattering optical depth , compared to recent constrains obtained by the Planck cosmological survey and, in particular, with the results from Planck
Collaboration et al. (2018). We find a value , which is consistent within with the Planck estimates .
4 Predicting galaxy UV emission
In the previous sections, we showed that CAT model predictions appear to be consistent with current constraints on the redshift evolution of the SFRD and the history of cosmic reionization. The natural extension of this analysis is therefore to characterize the luminosity distribution of the population of high-redshift galaxies, and follow its evolution in time. In what follows, we present CAT model predictions for the galaxy UV luminosity function at , considering the contribution of stellar populations - including Pop III stars -, BH accretion, and the effects of a gradual change in the stellar IMF with redshift and metallicity, as suggested by recent hydrodynamical simulations (Chon et al., 2021; Chon et al., 2022).
4.1 Galaxy UV luminosity function at
For the present study, we improve our modeling of the total UV emission arising from each galaxy with respect to what has been presented in Trinca et al. (2022), where the galaxy intrinsic UV luminosity was obtained from the SFR adopting a standard conversion factor (Madau & Dickinson, 2014).
We compute the UV luminosity of each galaxy, , by summing over the emission of its active stellar populations, adopting age and metallicity dependent SEDs, as explained in section 2.6. Following Mancini et al. (2016), we account for dust obscuration by correcting the galaxy UV luminosity as:
| (15) |
where is the gas surface density within a radius (Mo
et al., 1998), the dust-to-gas mass ratio, and is the extinction coefficient per unit mass in the energy band of interest.
The value of has been inferred considering the extinction curve of the Small Magellanic Cloud (SMC, Weingartner &
Draine 2001).
Since CAT is able to track the fraction of the ISM that resides in the warm/hot diffuse medium (see section 2.5), we assume here a simple screen model, where the optical depth is computed considering the contribution of the diffuse gas and dust mass inside the galaxy.
However, this modeling may appear oversimplified if compared to more sophisticated two-phase dust extinction models (see e.g. Mancini
et al., 2016), and may underestimate the impact of dust obscuration. Indeed, the increased compactness of high-redshift galaxies would result in lower values of , leading to a larger column density and dust optical depth. At the same time, while here we assume every galaxy to form a disk, these early systems are expected to show more complex morphologies and dust distributions, with UV dark and bright regions within the same system. For these reasons, the dust obscuration provided by our model has to be considered as an average over systems with comparable halo masses, but very likely different relative stellar/dust geometries and dust optical depths.
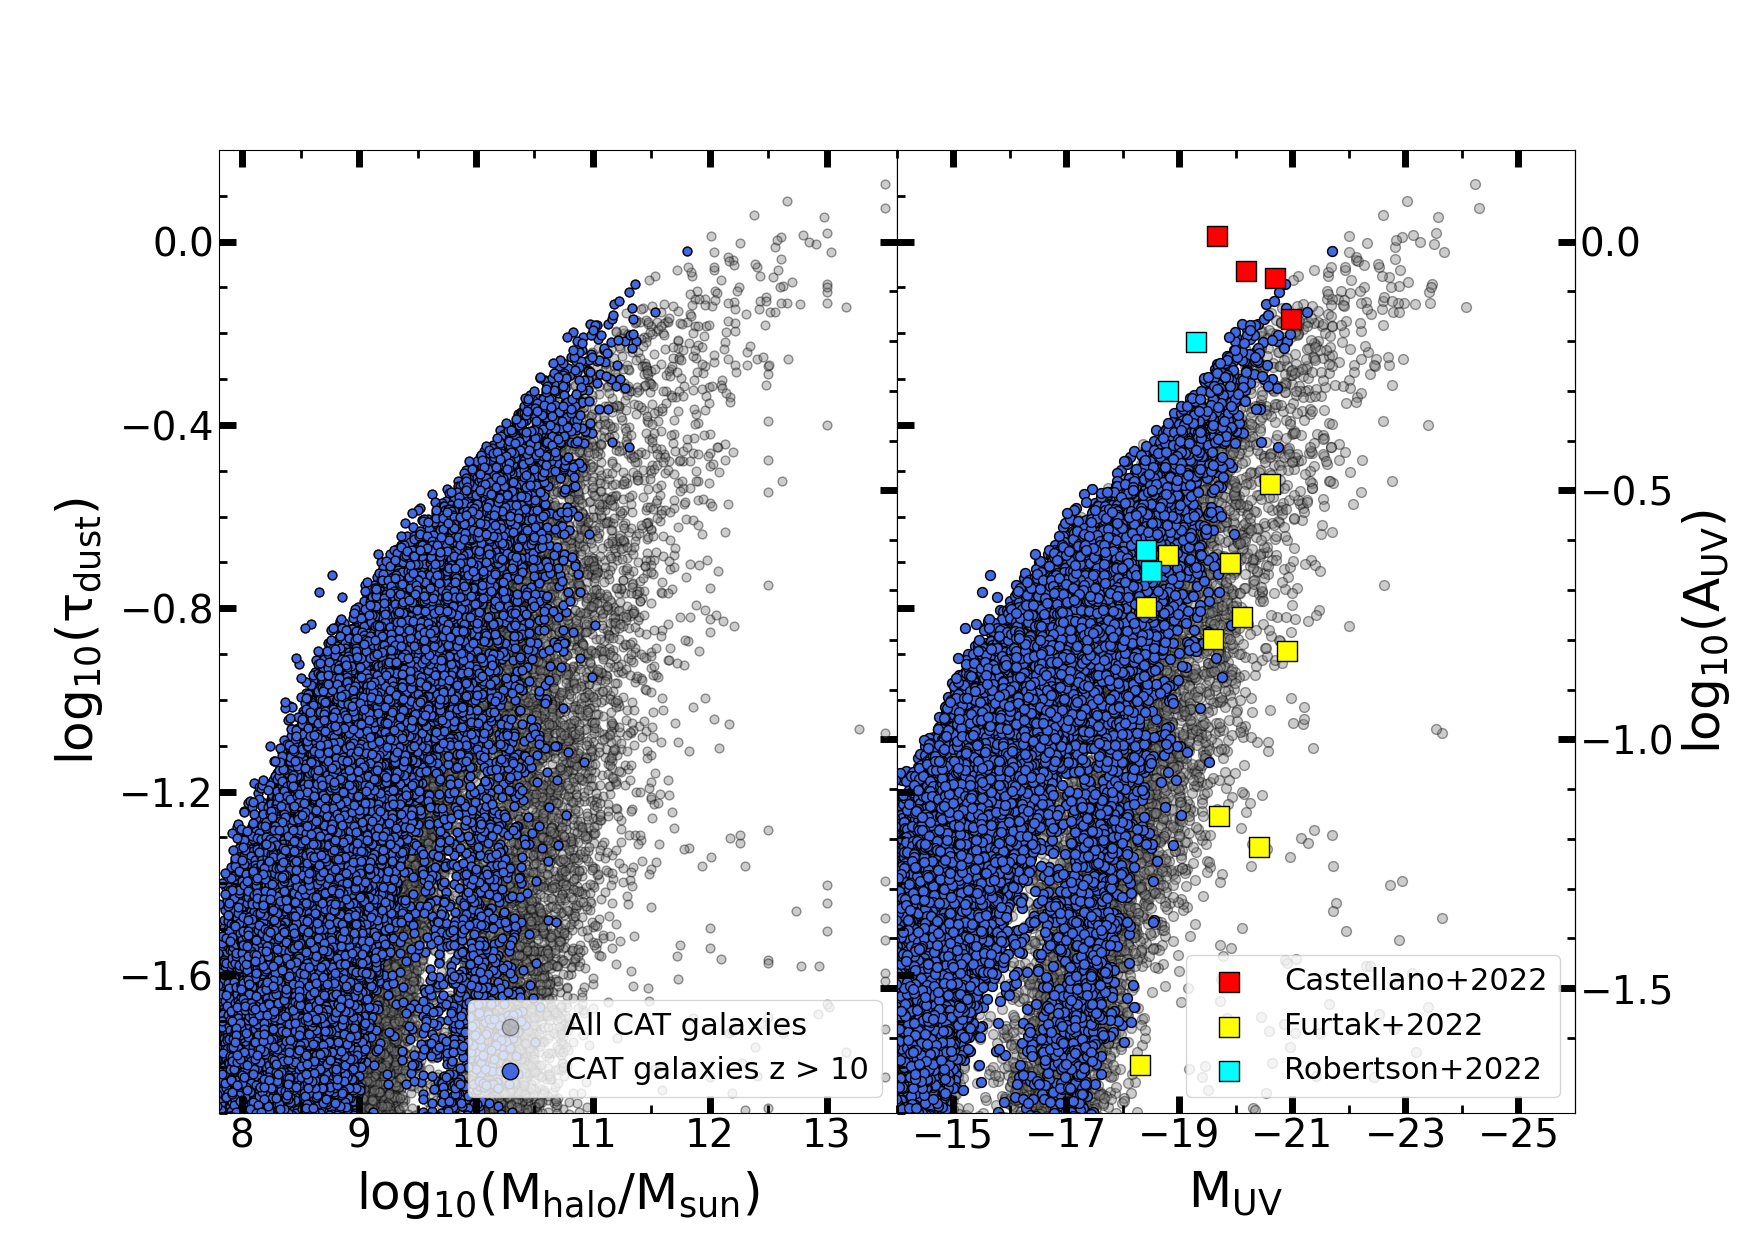
In Figure 5 we show the attenuation predicted by CAT (grey points) as a function of the host halo mass (left panel) and UV magnitude (right panel), highlighting the systems at redshift (blue points). When compared with the extinction values derived by Castellano
et al. (2023); Furtak et al. (2023); Robertson
et al. (2023) for a sample of high-redshift galaxies observed with JWST at , we see that - despite representing a lower limit to the potential dust obscuration - our simplified approach predicts a range of values consistent with the observations.
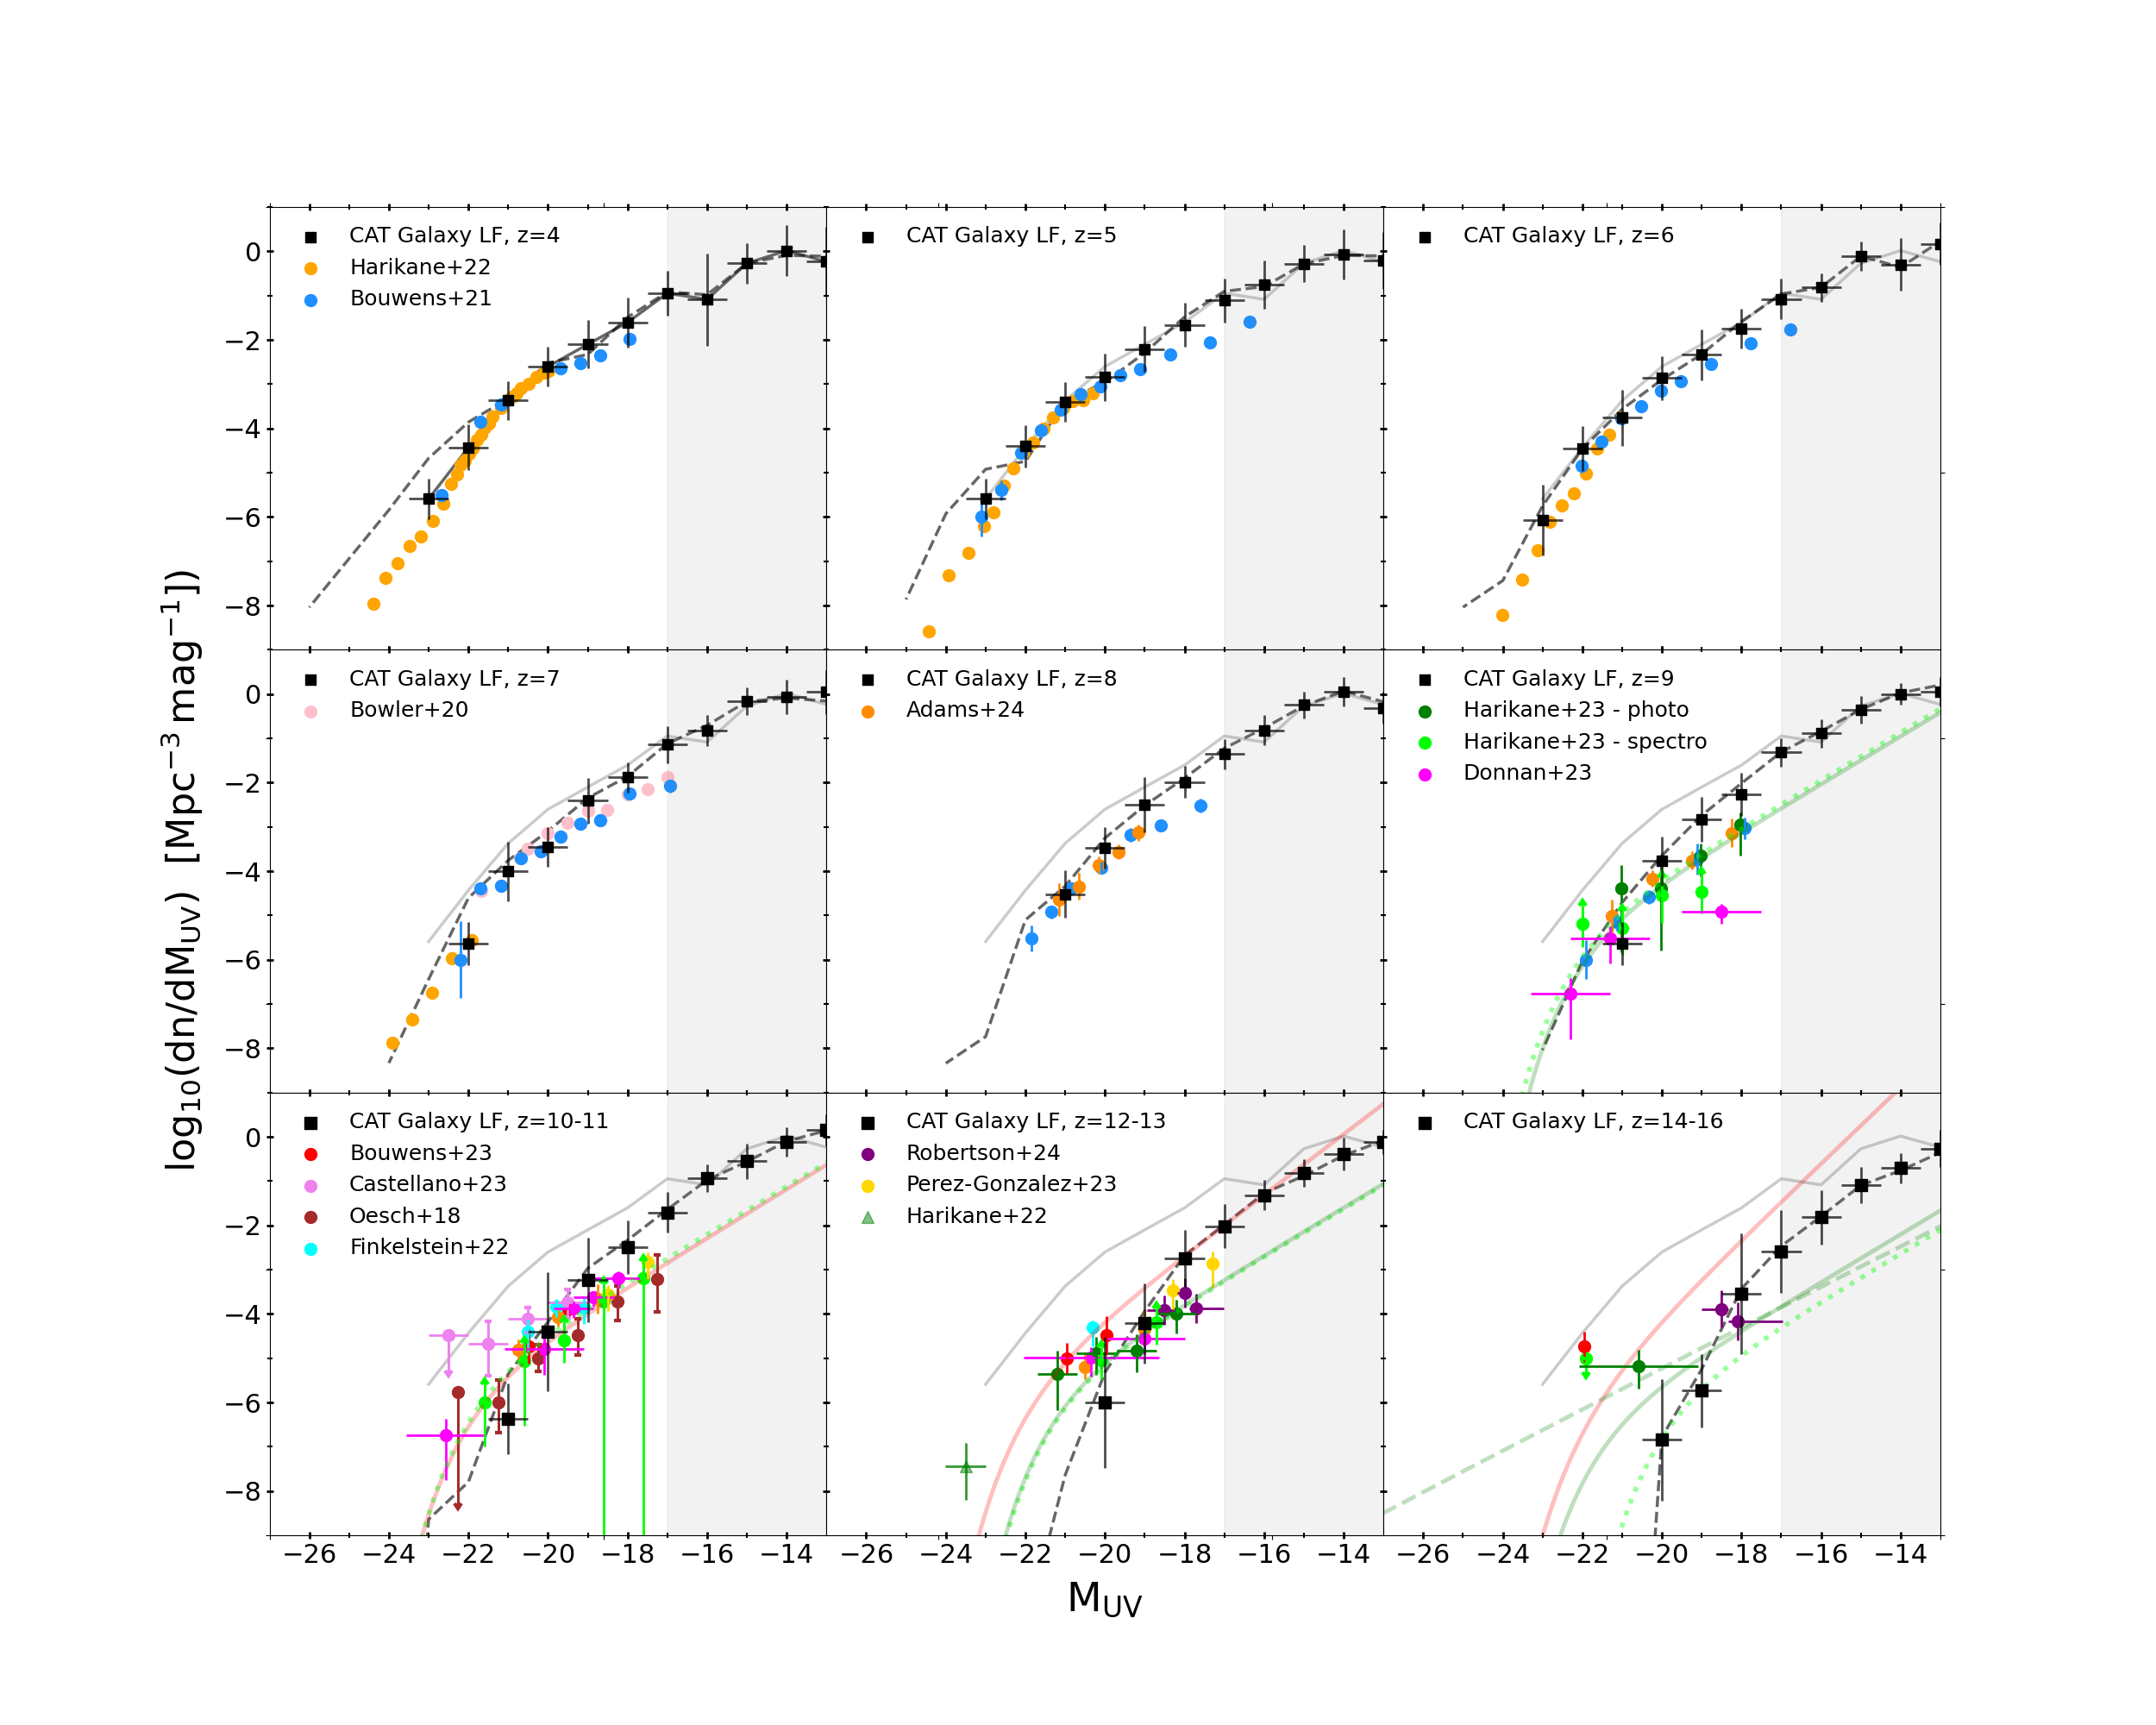
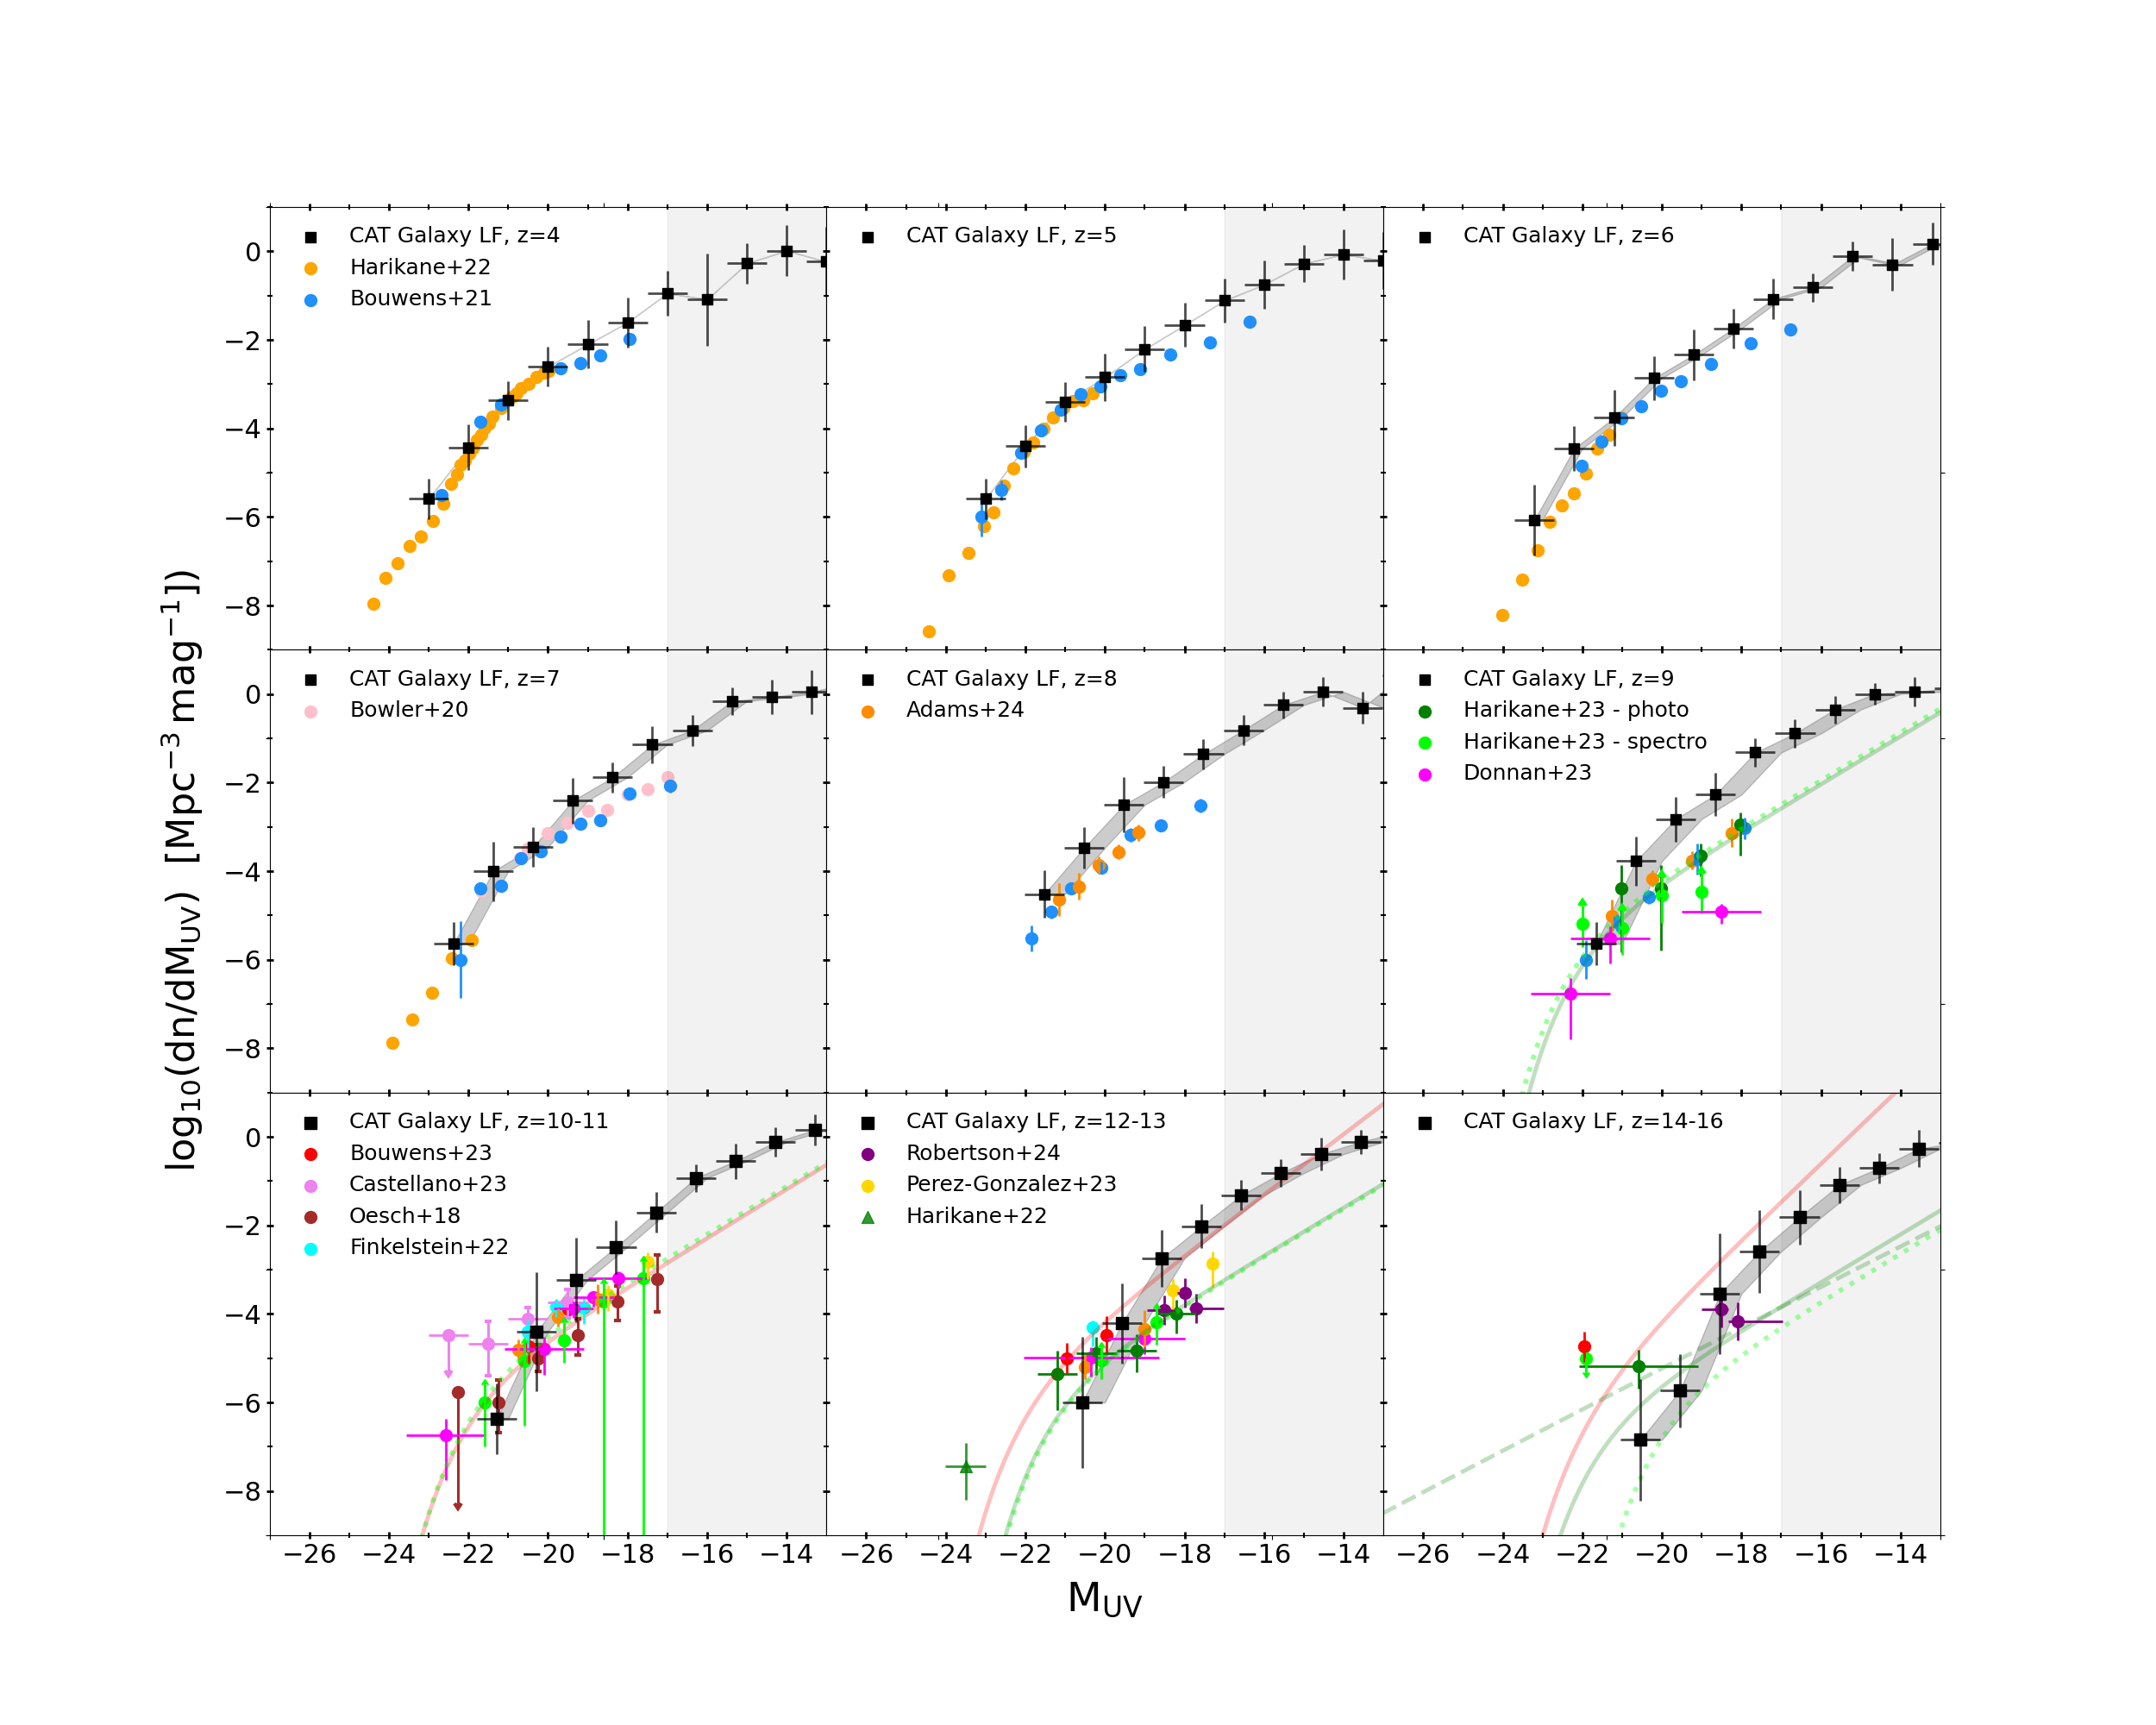
In Figure 6 we show the predicted evolution of the galaxy UV luminosity function in the redshift range . Here we only consider the UV luminosity coming from stellar emission, (i.e. we do not consider the additional contribution to the UV emission from accreting BHs). At , given the restricted number of sources currently observed and the potential uncertainties in their redshift determination, we decided to show the galactic LF predicted by CAT averaged over three redshift ranges , , .
CAT results are compared to several observational data (see Harikane et al. 2023c and references therein), including results coming from JWST observations (Castellano et al., 2023; Harikane et al., 2023c, b; Finkelstein et al., 2022b; Donnan et al., 2023; Adams et al., 2023a; Robertson et al., 2023; Pérez-González et al., 2023). The model predictions are in good agreement with observational data in the redshift range .
At , the mild evolution observed in the galaxy LF is well reproduced by CAT, except for the bins of highest luminosity, at , where, despite the large statistical uncertainties, the galaxy number density predicted by the model is smaller than the value inferred by some observational studies. These, however, show significant variations, depending on the surveyed area and JWST program considered, hinting to the potential presence of galaxy overdensities in some of these fields (Castellano et al., 2023), to the effect of cosmic variance (Yung et al., 2023; Adams et al., 2023b), as well as to the possible contamination of low-redshift systems in the photometric samples (Naidu et al., 2022; Zavala et al., 2023; Arrabal Haro et al., 2023).
Finally, at , CAT predictions are compared with the recent constraints from Harikane et al. (2023c) and Bouwens et al. (2023), based on two candidate galaxies with estimated redshift and . At this very early epoch, the model predicts a number density of bright galaxies that appears to be significantly lower with respect to what is suggested by JWST observations, with a number density of sources with , which is lower than the best-fit distribution obtained by Harikane et al. (2023b) assuming a Schechter function (see also Figure 12 for a quantitative comparison). It has to be noted, though, that if the spectroscopic confirmation were to favour redshift values on the lower bound of the uncertainty range, CAT predictions would stand at from the constraint proposed by Harikane et al. (2023b). In addition, we also show the best-fit distribution obtained by Harikane et al. (2023c) at , where they perform the analysis considering only sources with a spectroscopic confirmation. Given the lack of any spectroscopically confirmed galaxy at , they extrapolated the best-fit Schechter function obtained for toward higher redshift. In this case CAT predictions for are consistent with the observed LF, which, however, needs to be interpreted as a lower limit. Hence, spectroscopic identification of galaxy candidates observed at will be crucial to confirm the excess of UV bright sources compared to current model predictions. CAT predictions are also compared with recent observational constraints on the galaxy LF at by Robertson et al. (2023), based on the photometric detection of three candidate galaxies at . Interestingly, the number density predicted by CAT is in good agreement with the data at these fainter luminosities.
To evaluate the potential impact of dust obscuration in the comparison between CAT predictions and observational constraints, we overplot in Figure 6 the intrinsic galaxy UVLF at different redshifts as black-dashed lines. It is clear how dust attenuation mostly affects the range of luminosity covered by the galaxy population, while it does not affect the overall normalization of the distribution. Indeed, only the bright-end of the LF in the lower redshift range, , is significantly lowered when accounting for obscuration, and at even the intrinsic distribution cannot reproduce the high number density of bright galaxies observed by JWST. In the following section, we will explore whether the contribution to the UV luminosity from accreting BHs can partially relieve the current tension between CAT predictions and the bright end of the UV LF at derived from photometric candidates (Harikane et al., 2023b; Bouwens et al., 2023).
4.1.1 Evolution of the galaxy faint-end
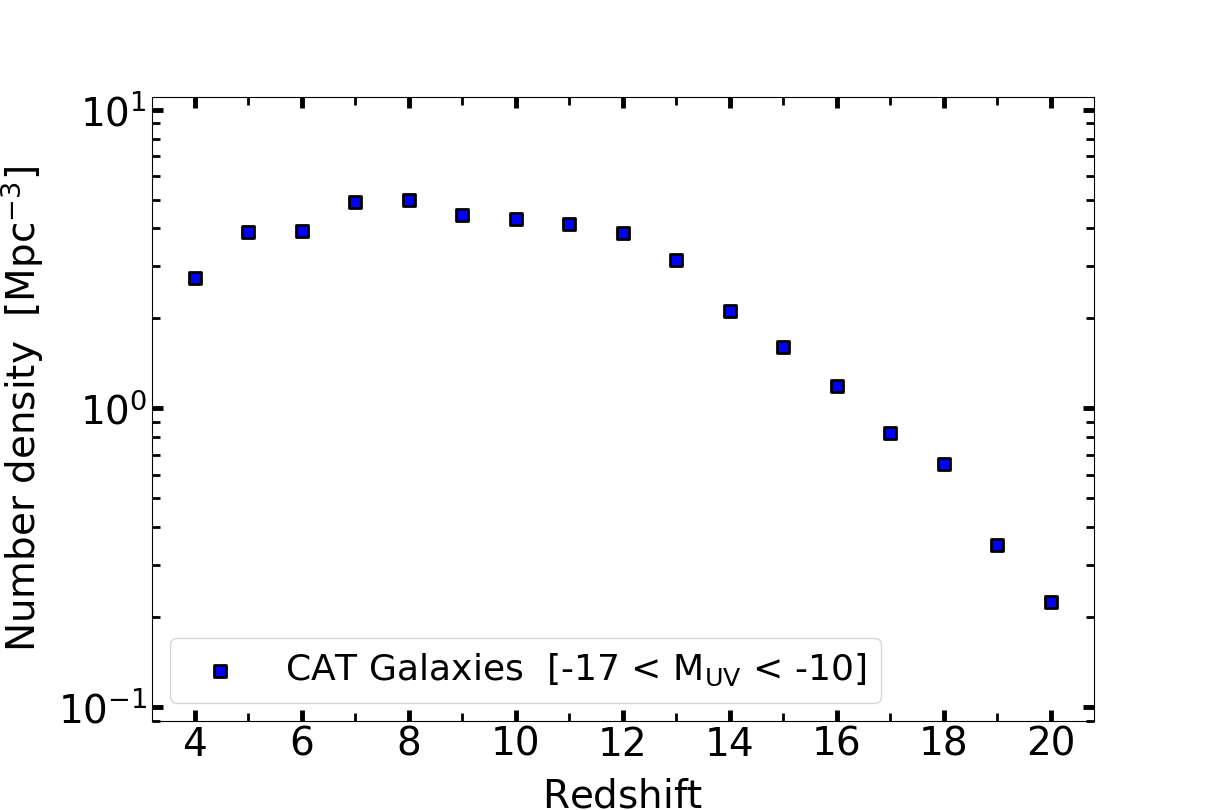
An interesting prediction of the CAT model is the number density of sources fainter than at redshift , which appears to be larger than the value obtained by extrapolating the faint end of the observationally estimated LF. This might be due to the incompleteness of the observed samples at these faint magnitudes, or to a higher impact of dust attenuation (see e.g. Barrufet et al., 2023). At the same time, it may point to a too efficient rate of star formation or to a too inefficient feedback in the galaxies populating the faint end of the galaxy UV LF at these epochs in our model. We also note that, at these faint magnitudes, the UV LF predicted by CAT shows a very mild evolution between and , which can be appreciated in Figure 6 by comparing the predicted LF at with the light grey solid line, which represents the LF predicted at . This is an interesting prediction of the model, reflecting the interplay of different physical processes during the evolution of fainter star forming systems. To investigate more closely this low luminosity regime, in Figure 7 we show the predicted evolution in redshift of the cumulative number density of galaxies with . At early times, a progressive increase in the number density of faint galaxies is observed down to . This reflects the widespread availability of gas in the early phases of galaxy evolution, and the increasing fraction of faint galaxies hosting active Pop III stellar populations (as it will be further discussed in Section 4.3), which can boost the UV luminosity of less massive galaxies. At later times, the number density of faint galaxies remains almost constant, tracing a plateau which extends between . This behaviour reflects the increasing importance of mechanical feedback due to SNe in regulating star formation of less massive systems. In addition, the gradual build up of the Lyman-Werner background leads to a decrease in the star formation efficiency of mini-halos and, consequently, of the galaxy number density at the faint end. At , the number density starts to mildly decline, leading to a reduction in the number density of faint galaxies of 50% between and . This effect is due to photo-heating of reionized regions, which prevents gas accretion onto mini-halos. The net result of this evolution is a faint-end slope of the UV LF which increases by from to . A similar mild evolution has been recently obtained also by Williams et al. (2023). Performing detailed hydrodynamical simulations, they found that streaming velocities, i.e. the supersonic relative motions between dark matter and baryonic overdensities, have a strong impact in enhancing the faint end of the LF at , since the suppression of star formation inside small halos at very early times leads to brighter dwarf galaxies at later times. While this is an intriguing result on its own that needs additional analysis, in the following sections we primarily focus on the model predictions for the bright-end of the galaxy LF, at .
4.2 Can BH accretion explain the UV luminosity function at ?
In addition to stellar emission, we also account for the possible contribution of the UV luminosity emitted by the nuclear BH, . In fact, for high redshift systems, AGN contamination in the UV rest-frame emission might be significant (Pacucci et al., 2022), as we will analyze more in detail below.
From the BH accretion rate (see Eq. 3), we estimate the BH bolometric luminosity as:
| (16) |
and then convert this into the UV luminosity relying on the bolometric correction proposed by Duras et al. (2020), and assuming (as described in detail in Trinca et al., 2022).
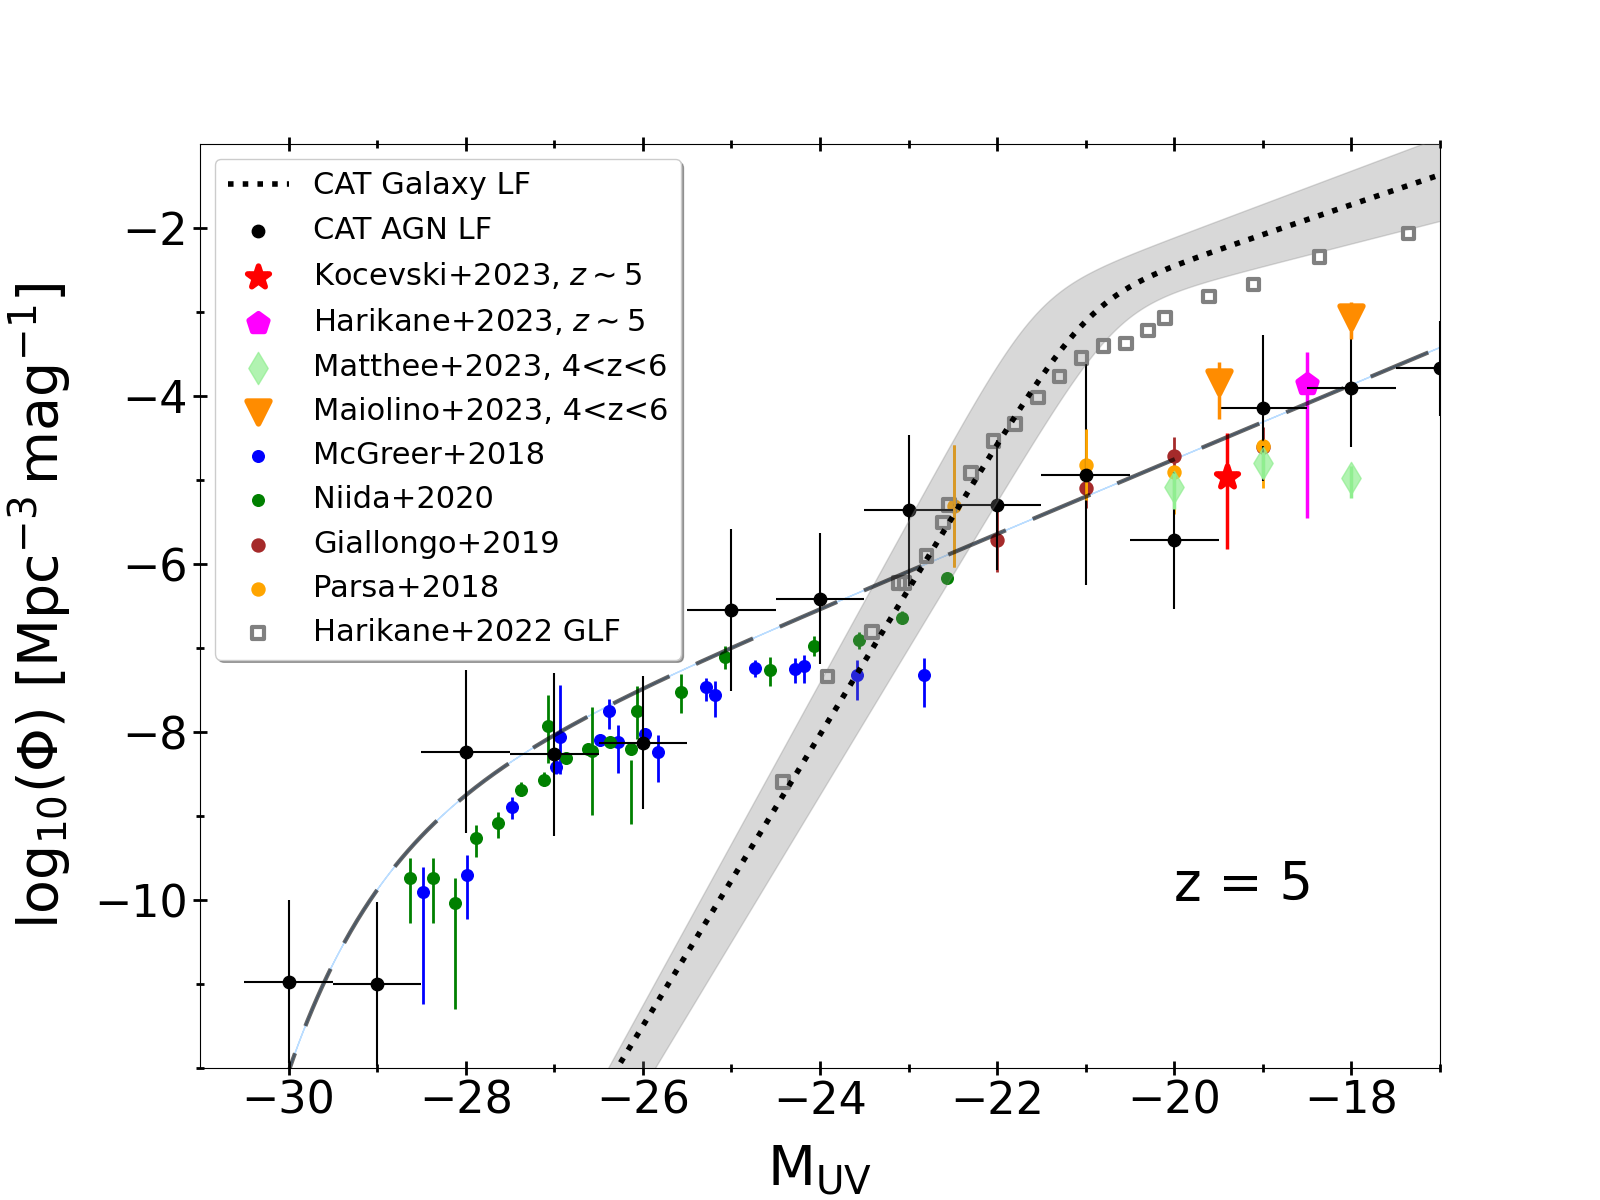
A thorough comparison between the AGN LF predicted by CAT in the UV and X-ray bands has been presented by Trinca et al. (2022), finding a good agreement between our reference model prediction and the available observational constraints. To provide an example, here we show in Figure 8 the predicted AGN UV luminosity function at (filled black data points and black dashed line). This is compared to observational constraints from McGreer et al. (2018) and Niida et al. (2020) at the bright-end (), and from Parsa et al. (2018); Giallongo et al. (2019); Kocevski et al. (2023); Harikane et al. (2023a); Maiolino et al. (2023c) and Matthee et al. (2023) at the faint-end. We also show the galaxy UV LF predicted by CAT (the black dotted line and grey shaded region represent, respectively, the double power-law best fit and spread of the distribution) and observed (empty grey squares, Harikane et al. 2022a). The comparison confirms that CAT model predictions are in good agreement with the observed galaxy and AGN UV luminosity function at , reproducing remarkably the surprisingly high number density of faint AGNs suggested by the most recent estimates based on JWST data (Matthee et al., 2023; Maiolino et al., 2023c; Greene et al., 2023).
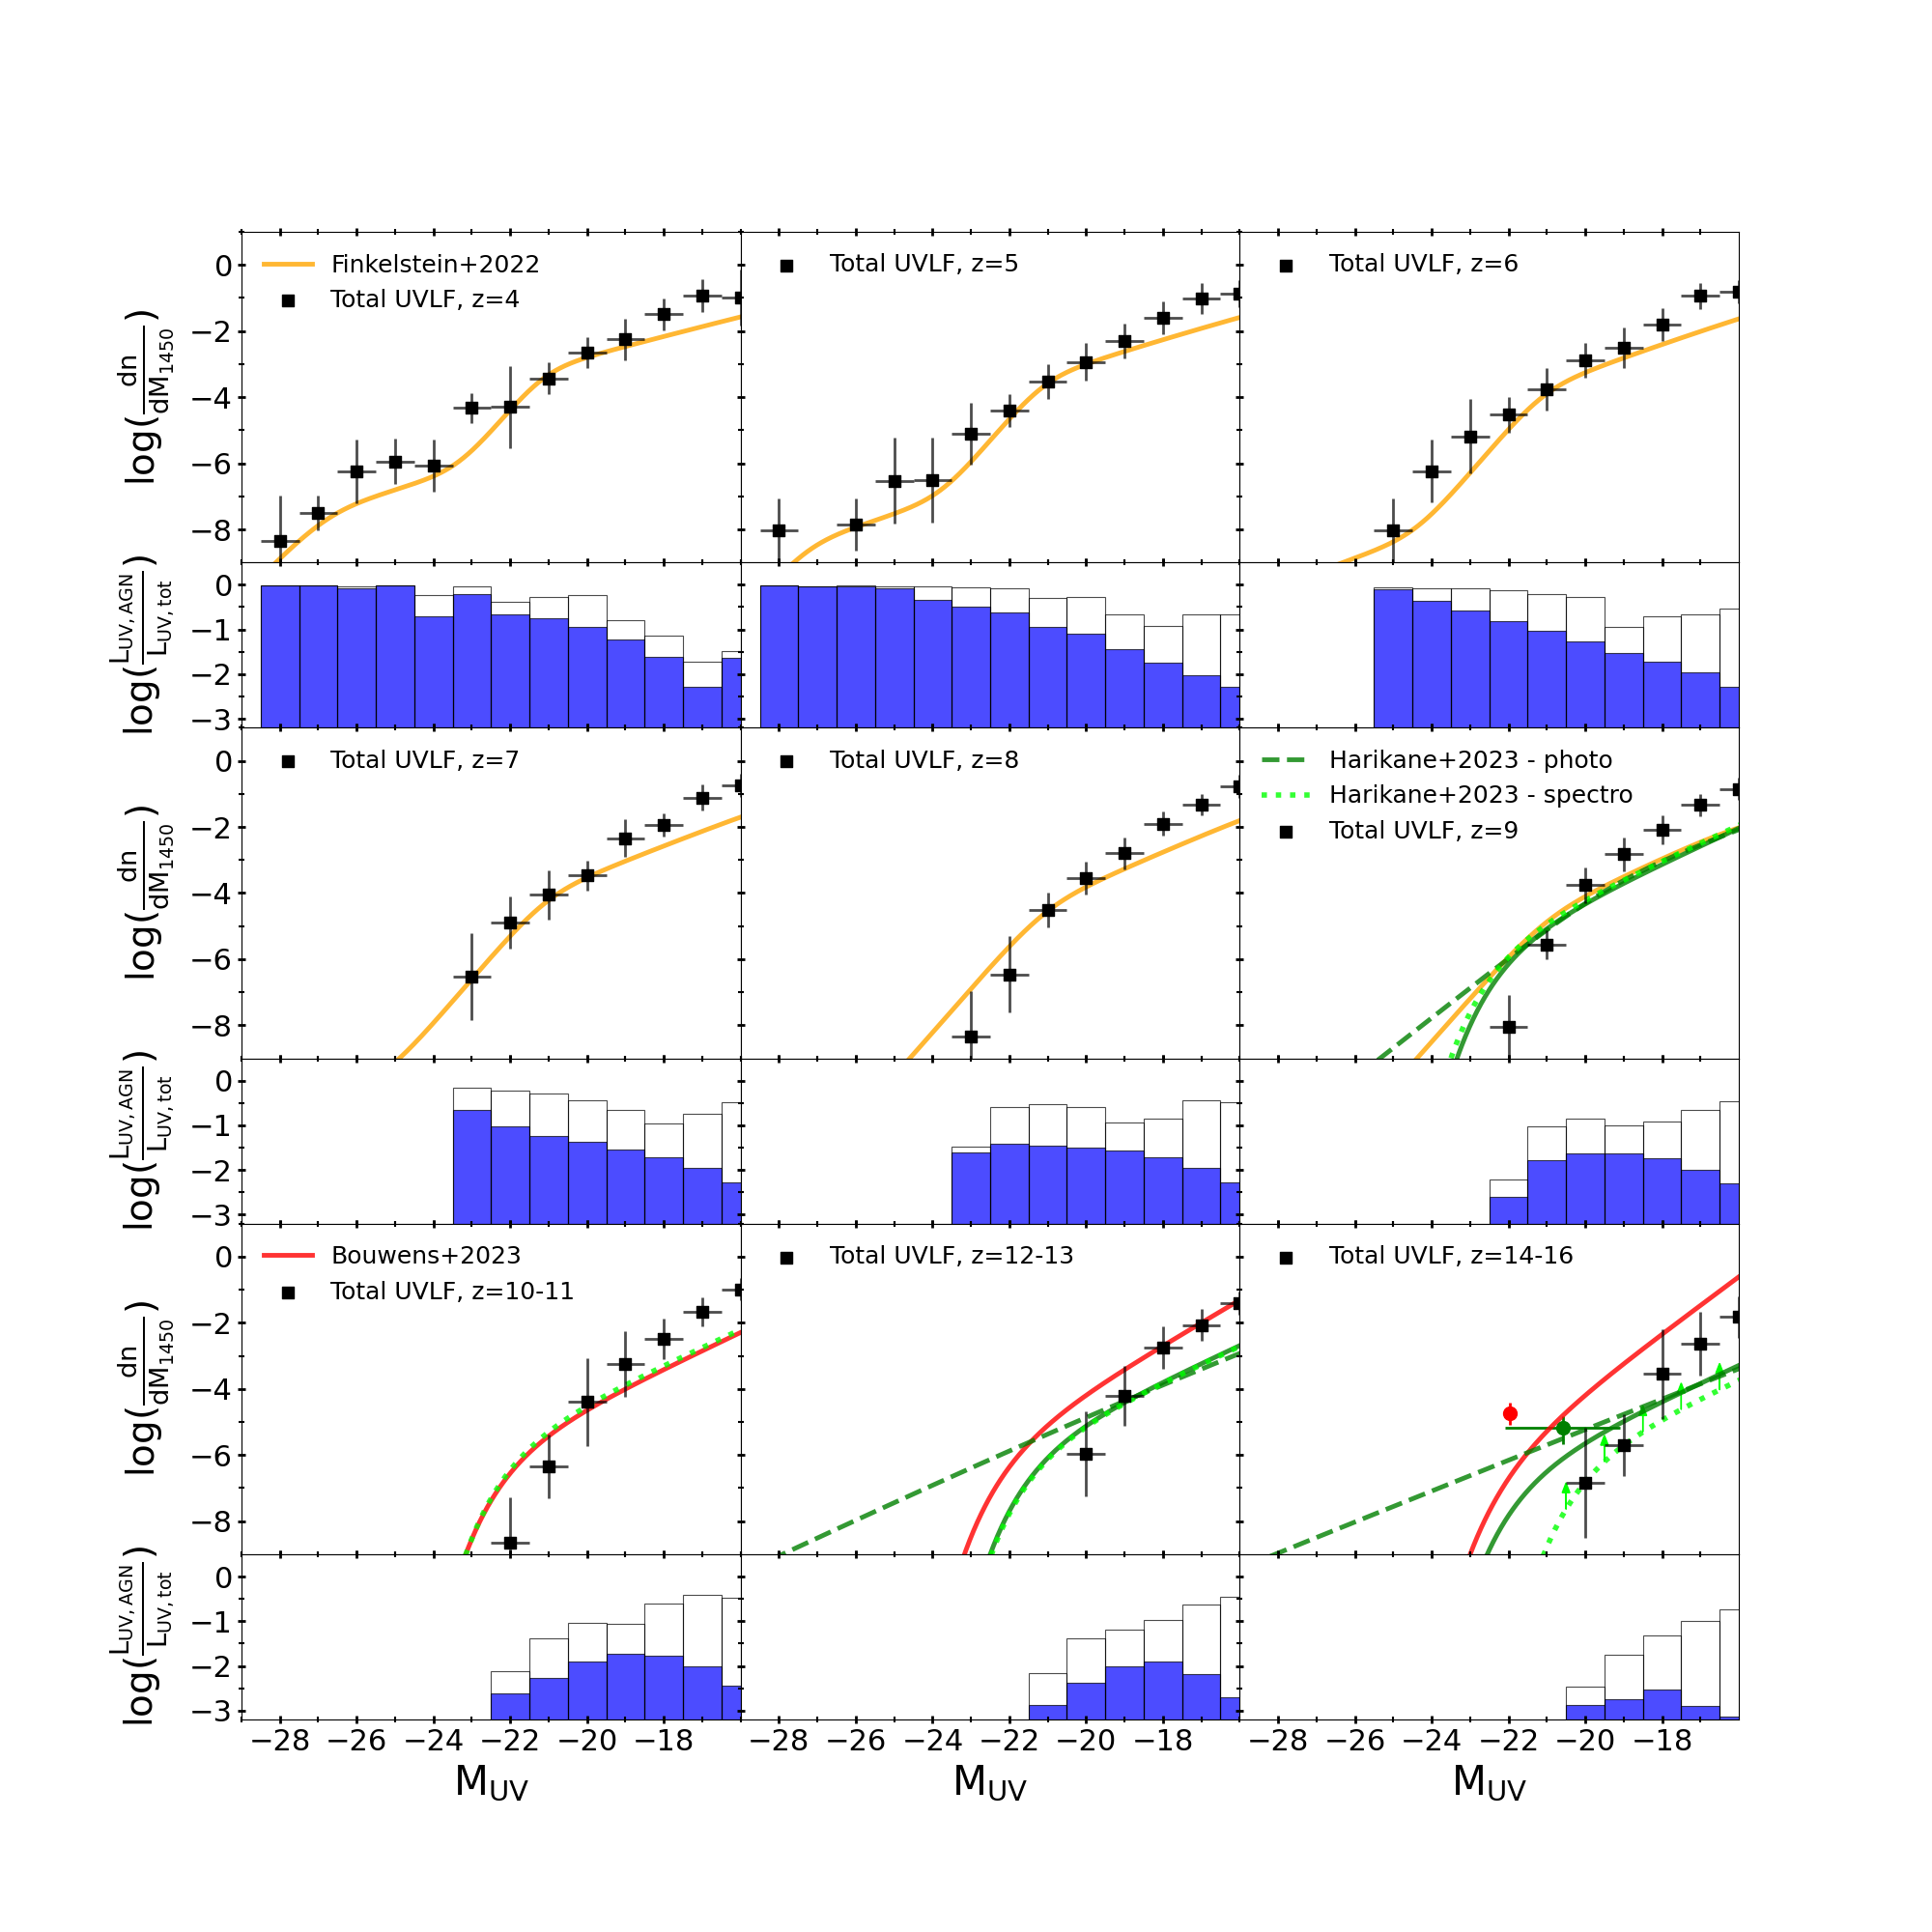
We then recompute the UV LF considering both emission from stars and accreting BHs, at , and estimate the mean and maximum contribution of the AGNs to the total galaxy emission in different ranges of magnitude. This is shown in Figure 9.
At , the total (galaxy + AGN) UV LF predicted by CAT is compared to the fit of the combined LF for both AGN and star forming galaxies derived by Finkelstein & Bagley (2022), finding a good agreement. At , we compare our predictions with the best-fit distributions proposed by Bouwens et al. (2023); Harikane et al. (2023b), also shown in Figure 6. On average, we find that the contribution of accreting BHs to the galaxy UV luminosity is negligible at these redshifts (see the filled histograms). At , during the formation epoch of heavy BH seeds, the AGN emission contributes on average to of the total UV emission, with the largest contribution being at most in the brightest bins of magnitude, at (see the empty histograms). At even higher redshifts, , the AGN emission is even smaller, due to the stunted growth of light seeds predicted by our reference model (see Trinca et al., 2022). Considering the joint UV emission of stars and accreting BHs, we still find that the number density of systems with predicted by CAT is lower than the best-fit distribution obtained by Harikane et al. (2023b) assuming a Schechter function, similarly to what was found when only stellar emission was considered. At the same time, model predictions closely match the distribution obtained by Harikane et al. (2023c) considering only spectroscopically confirmed galaxies (see Figure 12).
At , we observe a growing impact of AGNs to the total UV emission, with an average contribution between of the galaxy luminosity, and peaks of maximum contribution reaching of the total emission, especially in the brightest luminosity bins. Finally, at , we predict the AGN population to dominate the bright-end of the total UV LF, accounting on average for of the emission coming from systems brighter than . The average AGN contribution decreases for fainter galaxies, where it appears to be subdominant, though it might still reach of the total UV emission for specific systems.
We thus find that the AGN contribution does not have a significant impact on the emission of galaxies, and it cannot resolve the discrepancy between model predictions and observations on the number density of bright sources with . However, while the AGN UV luminosity appears to be - on average - subdominant in fainter high-redshift galaxies, detailed selection criteria applied to deep JWST surveys (Trinca et al., 2023) might be able to identify systems hosting the brightest and more luminous BHs from the general population (Nakajima & Maiolino, 2022; Goulding & Greene, 2022; Volonteri et al., 2022), enabling to constrain their contribution to the total luminosity function.
Recent works advocated for super-Eddington accretion to explain the observed deviation from the local scaling relation of the population of high-redshift AGNs. This could be relevant to interpret the bright excess observed in the galaxy UV LF, since the presence of BHs accreting very efficiently already at early epochs might in principle provide a higher contribution to the global emission of the host galaxy with respect to what is shown in Figure 9. In a recent work (Schneider et al., 2023) we compared our model predictions for the population of accreting BHs with recent JWST observations of AGNs for both an Eddington-limited and a super-Eddington BH growth scenario, where brief periods of enhanced accretion are assumed to be triggered during major galaxy mergers. Both models are able to account for current observations of extreme BH candidates at , despite a super-Eddington accretion history predicts a significantly higher number density of massive systems at these high redshifts, and they both provide similar predictions for the bright end of the AGN luminosity function (see Trinca et al., 2022). However, given the typical short timescales of the super-Eddington accretion phase, on the order of a few Myr, even in this alternative growth scenario it is unlikely that accreting BHs will provide a significant boost to the galaxy LF at early times. A more thorough study is however required to support this conclusion and hence we defer a deeper analysis to a future work, where we will implement a more refined treatment of the super-Eddington accretion mechanism to investigate its potential impact on the overall galaxy evolution through cosmic time.
4.3 Can a top-heavy IMF explain the UV luminosity function at ?
The UV emissivity of stellar populations is very sensitive to their IMF, metallicity and ages. Mason et al. (2023) argue that current galaxies observed by JWST are dominated by systems with young ages ( Myr) and high star formation rates. Harikane et al. (2023b) show that, for a given star formation rate, the UV luminosity from Pop III stars characterized by a top-heavy IMF is times larger than that of Pop II stars with a normal Salpeter-like IMF. Here we first discuss CAT model predictions regarding the UV emission from Pop III stars, and then we estimate the potential effect on the galaxy UV LF of a more gradual transition from a top-heavy IMF for Pop III stars to a standard, Salpeter-like IMF for Pop II stars, modulated by metallicity and redshift, as suggested by recent numerical simulations of star cluster formation in low-metallicity environments resolving individual forming stars (Chon & Omukai, 2020; Chon et al., 2022).
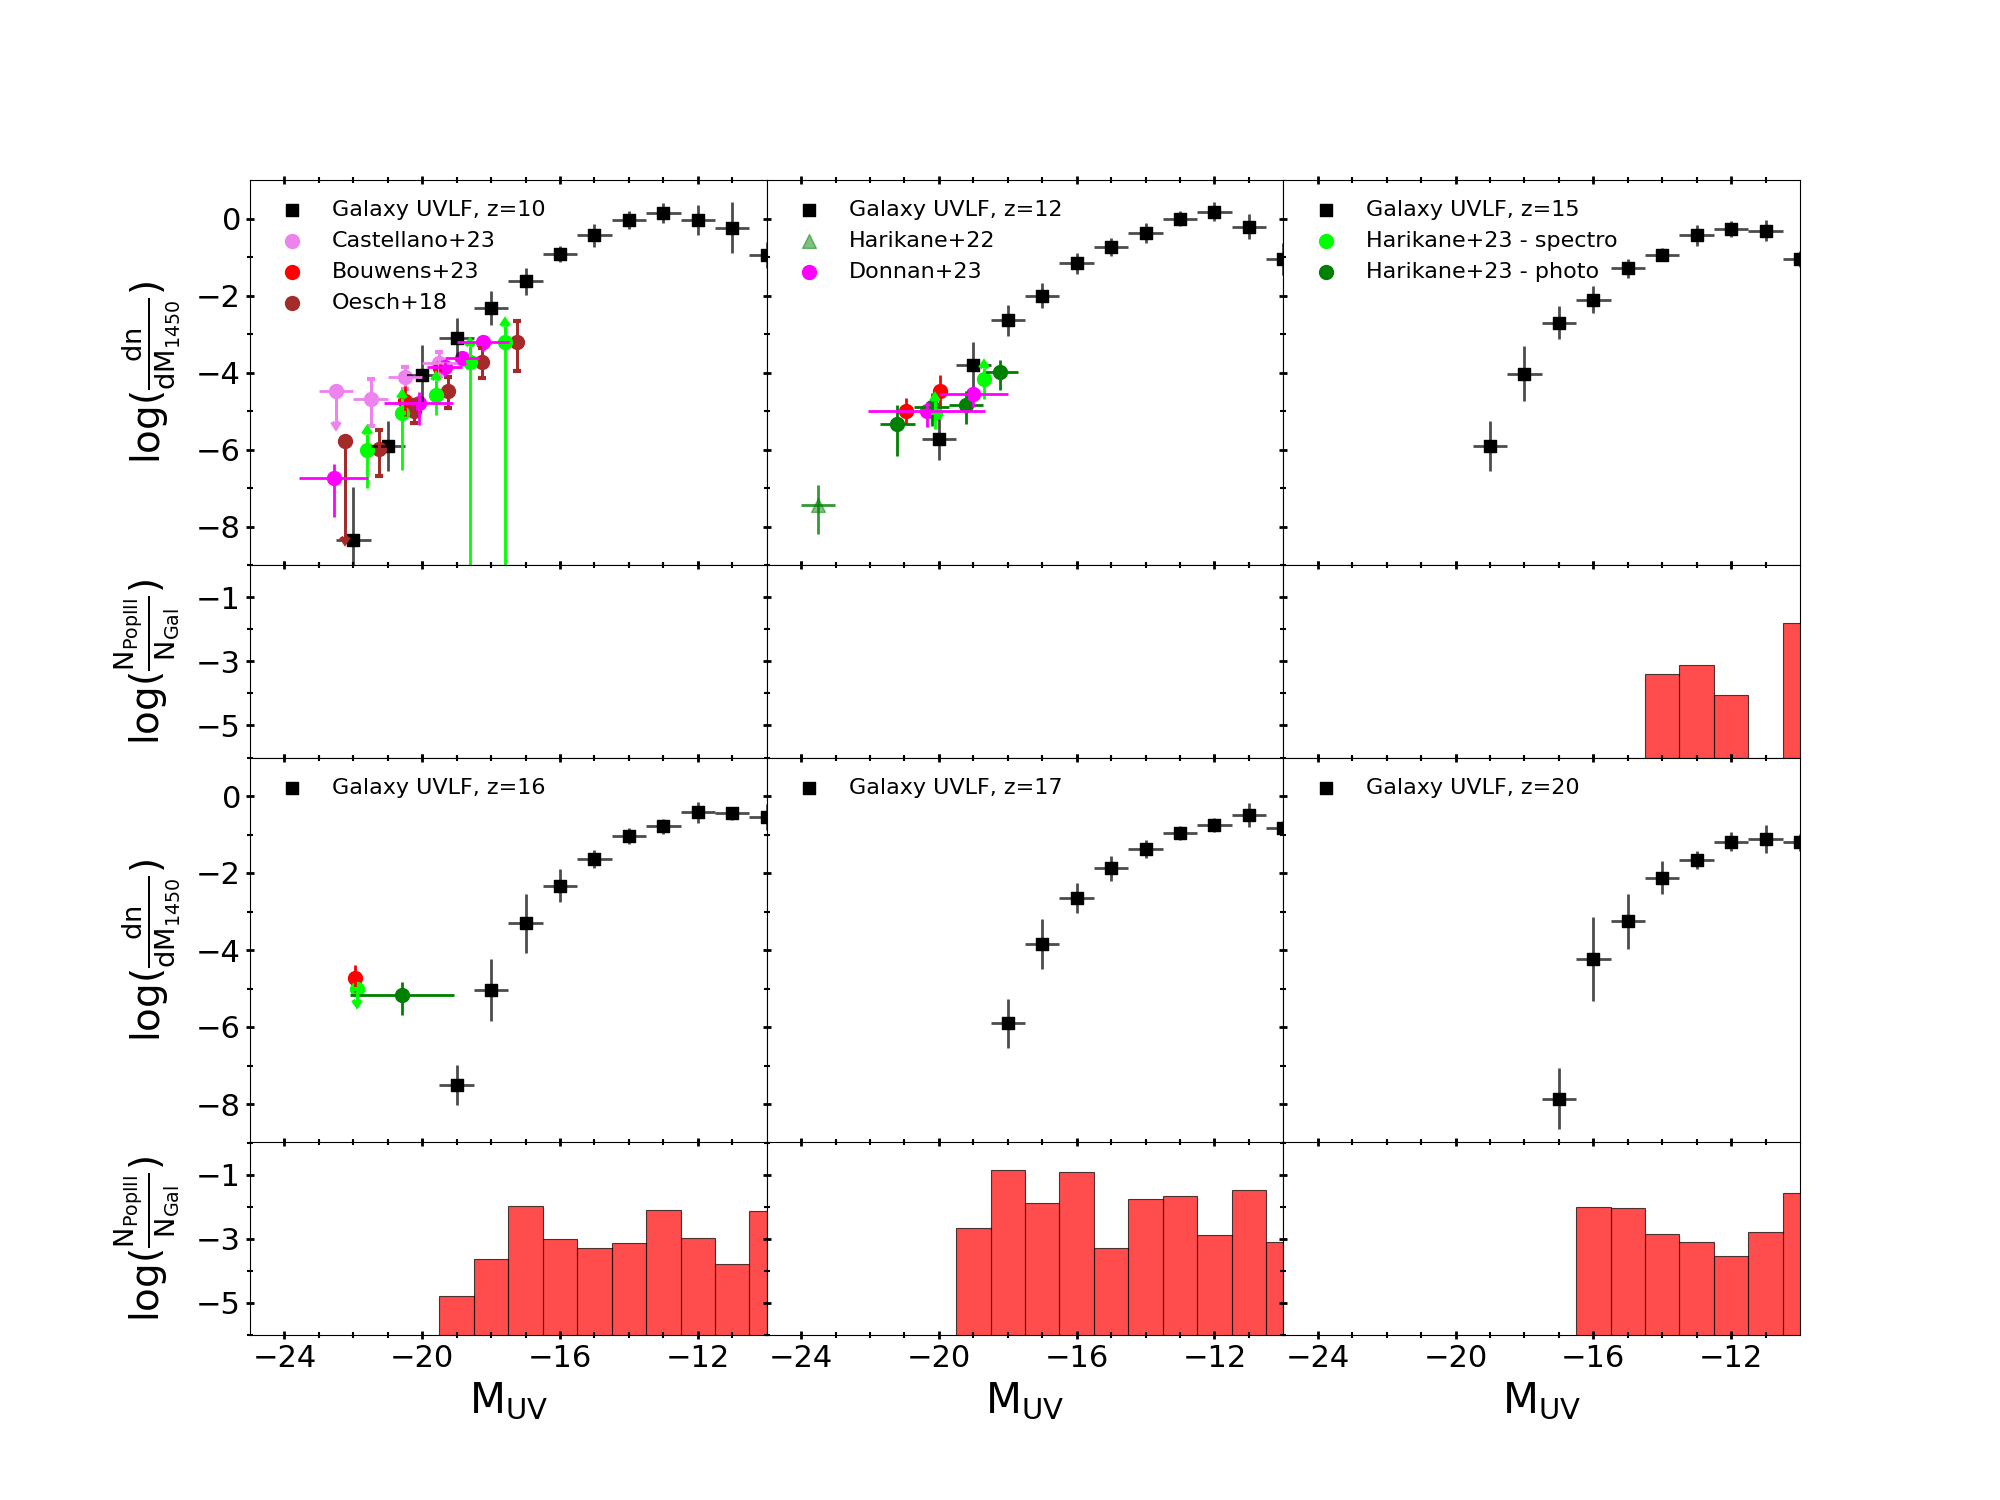
4.3.1 The role of Pop III stars: CAT model prediction
CAT models stellar populations in high redshift galaxies depending on whether their initial metallicity is smaller or larger than the critical metallicity . We therefore have an abrupt transition in the IMF, from a top-heavy IMF for Pop III stars () to a normal, Salpeter-like IMF for Pop II/I stars (). We have shown in Figure 6 that, according to CAT, stellar emission, including Pop III stars, cannot account for the overabundance of bright UV galaxies observed by JWST. To further clarify this point, in Figure 10, we report the fraction of galaxies hosting active Pop III populations predicted by CAT at and 20 (red histograms), together with the corresponding galaxy UV LF at the same redshift. At , the fraction of galaxies hosting Pop III stars is always relatively small, and progressively shifted to fainter luminosity bins. Interestingly, however, we find that 10% of some of the brightest systems at , with host active Pop III stars. This may be ascribed to a less efficient chemical feedback at these very early times, where subsequent generations of Pop III stars form before the medium is enriched above the critical metallicity, leading to a transition in the stellar IMF. The occurrence of active Pop III stars inside bright and more massive galaxies might also be favoured by mergers with smaller metal-free DM halos, which are supposed to occur with higher frequency at very high redshift. At , chemical feedback leads to a drop in the occupation fraction of active Pop III stars, especially at the bright-end of the distribution. At Pop III populations survive only in fainter and less evolved galaxies, where the gas still maintains a pristine composition. In these smaller halos, Pop III star formation is less efficient and leads preferentially to the formation of stars at the lower mass end of the Pop III IMF, which evolve on longer timescales (see Figure 2). Finally, below CAT predicts a sharp transition in the brightest systems towards Pop II star formation. Thereafter, Pop III stars continue to form only inside more pristine and fainter galaxies, with , despite a sustained Pop III star formation survives down to , where the rapid enrichment leads to a complete suppression of metal-poor star formation, as shown in Figure 3.
An important caveat of the current model is represented by the assumption of homogeneous metal enrichment and radiative feedback. Various techniques based on statistical descriptions of the DM halo distribution (Dijkstra et al., 2014; Salvadori et al., 2014; Inayoshi et al., 2014; Sassano et al., 2021) or on N-body simulations to reconstruct their spatial distributions and redshift evolution (see e.g. Visbal et al. 2020; Spinoso et al. 2022; Hartwig et al. 2022; Ventura et al. 2024 for recent studies) have been developed to allow semi-analytical models to account for these spatial inhomogeneities. Our model lacks this information, although the DM halo merger trees generated with galform (Parkinson et al., 2008; Trinca et al., 2022) enables us to explore different overdensities, sampling at the same time less- and more-evolved environments.
In addition, small and large scale gas dynamics and turbulence have been shown to be very important to allow the formation of Pop III and Pop II stellar populations in different regions of the same galaxy (Tornatore et al., 2007; Johnson et al., 2013; Pallottini et al., 2015; Xu et al., 2016; Sarmento et al., 2019; Liu & Bromm, 2020; Sarmento & Scannapieco, 2022). Recent cosmological simulations by Venditti et al. (2023) show that Pop III SF might extend down to in the outskirts of more metal-enriched galaxies. In particular, they predict that active Pop III stars might survive in of massive galaxies with at , although with a Pop III/Pop II mass fraction %. This suggests that Pop III stars formed in particularly unpolluted regions of standard main sequence galaxies might survive below the redshift range predicted by CAT, and in a larger fraction of galaxies. However, even in this scenario, it is very unlikely that Pop III stellar systems will provide a significant contribution to the observed UV luminosity function. The same numerical simulations show that the fraction in mass of Pop III stars inside the galaxies which mostly contribute to the LF () is between . Pop III dominated systems are expected to have fainter luminosities () and lower stellar masses (see e.g. the recent observations by Vanzella et al. 2023 and Maiolino et al. 2023b).
4.3.2 A more gradual transition in the stellar IMF
Recent high-resolution 3D hydrodynamical simulations of low-metallicity star forming regions show that the metallicity-driven transition in the stellar IMF might be smoother than predicted by the critical metallicity scenario, and that a larger fraction of massive stars than predicted by a standard Salpeter-like IMF persists up to a metallicity of (Chon et al., 2021). The main effect is due to the interplay between the cooling timescale and the timescale of turbulence decay. When , star formation begins after the turbulent motion decays, and a single massive cloud core monolithically collapses to form a central massive stellar cluster; despite dust-induced fragmentation occurs at , promoting the formation of low-mass stars , the large gas accretion rate from the circumstellar disc preferentially feeds the central massive stars, making the mass distribution top-heavy. When , efficient metal-line cooling and collisions of the turbulent flows promote the onset of star formation in a highly filamentary gas structure. In this case, the mass supply to the massive stars is limited by the local gas reservoir and shared among the stars, leading to a standard Salpeter-like IMF.
In addition, the larger temperature of the CMB radiation at suppresses cloud fragmentation and reduces the number of low-mass stars in star-forming regions with metallicities (Schneider & Omukai, 2010; Chon et al., 2022). As a result, stellar populations with metallicity of or forming at are expected to be characterised by a mass spectrum consisting of a low-mass Salpeter-like component, peaking at , and a top-heavy component at , with the mass fraction in the latter increasing with redshift, and decreasing with metallicity.
While these results rely so far only on sophisticated theoretical studies, it is tempting to investigate their potential impact on the high- galaxy UV LF, particularly given that galaxies are expected to be more metal-poor at high redshift. Indeed, galaxies observed with JWST at have been found to be relatively young, with estimated ages Myr, and with metallicities in the range (see Nakajima & Maiolino 2022 and references therein), and similar properties have been derived for galaxies confirmed to be at (Curtis-Lake et al., 2022; Tacchella et al., 2022; Bunker et al., 2023; Tacchella et al., 2023).
To quantify the effect of a redshift-modulated stellar IMF on the galaxy UV LF, here we take a simple approach and we assume that galaxies populating the bright-end of the galaxy UV LF at have metallicities and stellar ages Myr. Following Tanikawa et al. (2022), we model the transitional stellar IMF as a composition of a Kroupa IMF in the mass range (Kroupa, 2001),
and of a Log-flat IMF for ,
with a relative mass-weight that depends on and and that have been obtained by fitting the simulations results of Chon et al. (2022). For a metallicity of , the weight of the Log-flat IMF can be expressed as for and it is at , meaning that below this redshift all the stars follow a Kroupa IMF. Following Madau & Dickinson (2014), we use the flexible stellar population synthesis code (FSPS, Conroy et al. 2009; Conroy & Gunn 2010) to compute the conversion factor between the intrinsic specific luminosity at 1500 Å, (expressed in units of erg s-1 Hz-1) and the SFR (in units of yr-1),
| (17) |
assuming a constant SFR and our adopted transitional stellar IMF for . At redshift , we find that for a stellar age of Myr, and for Myr. Hence, a stellar population with the same metallicity and age is predicted to emit up to times more FUV radiation per unit SFR at than at .
In Figure 11 we show how the predicted galaxy UV LF changes when applying to the Pop II stellar emission a correction for consistent with a stellar population characterized by a composite IMF. We assume a boost in the luminosity of each galaxy of a factor , where and are the expected correction factors for, respectively, the Kroupa and the composite IMFs, assuming a stellar population of with . We see how this correction impacts significantly on the UV LF, especially at . In particular, CAT predictions are now consistent with observational constraints in the redshift ranges and . At , the model predicts number density of UV bright sources that is still smaller than estimated from photometric candidates (Harikane et al., 2023b) and consistent with the lower limit inferred from the spectroscopic analysis (Harikane et al., 2023b) but the difference from their best-fit model is now reduced to and at, respectively, and (see Figure 12).
Hence, by considering a gradual transition in the stellar IMF modulated by metallicity and redshift, we are able to recover a better match with the observational estimates of the number density of bright sources at . A minor discrepancy persists in the highest redshift range, , where the model predictions are also affected by large statistical uncertainties. In a future study, we plan to incorporate these new theoretical findings into a more sophisticated modeling of stellar populations in CAT, as a transitional IMF that depends on metallicity and redshift not only affect the emissivity of the first galaxies, but it also changes the rate of supernova explosion, hence the effects of mechanical and chemical feedback. In addition, it modifies the mass function of BH remnants, with interesting consequences on the BH seed populations.
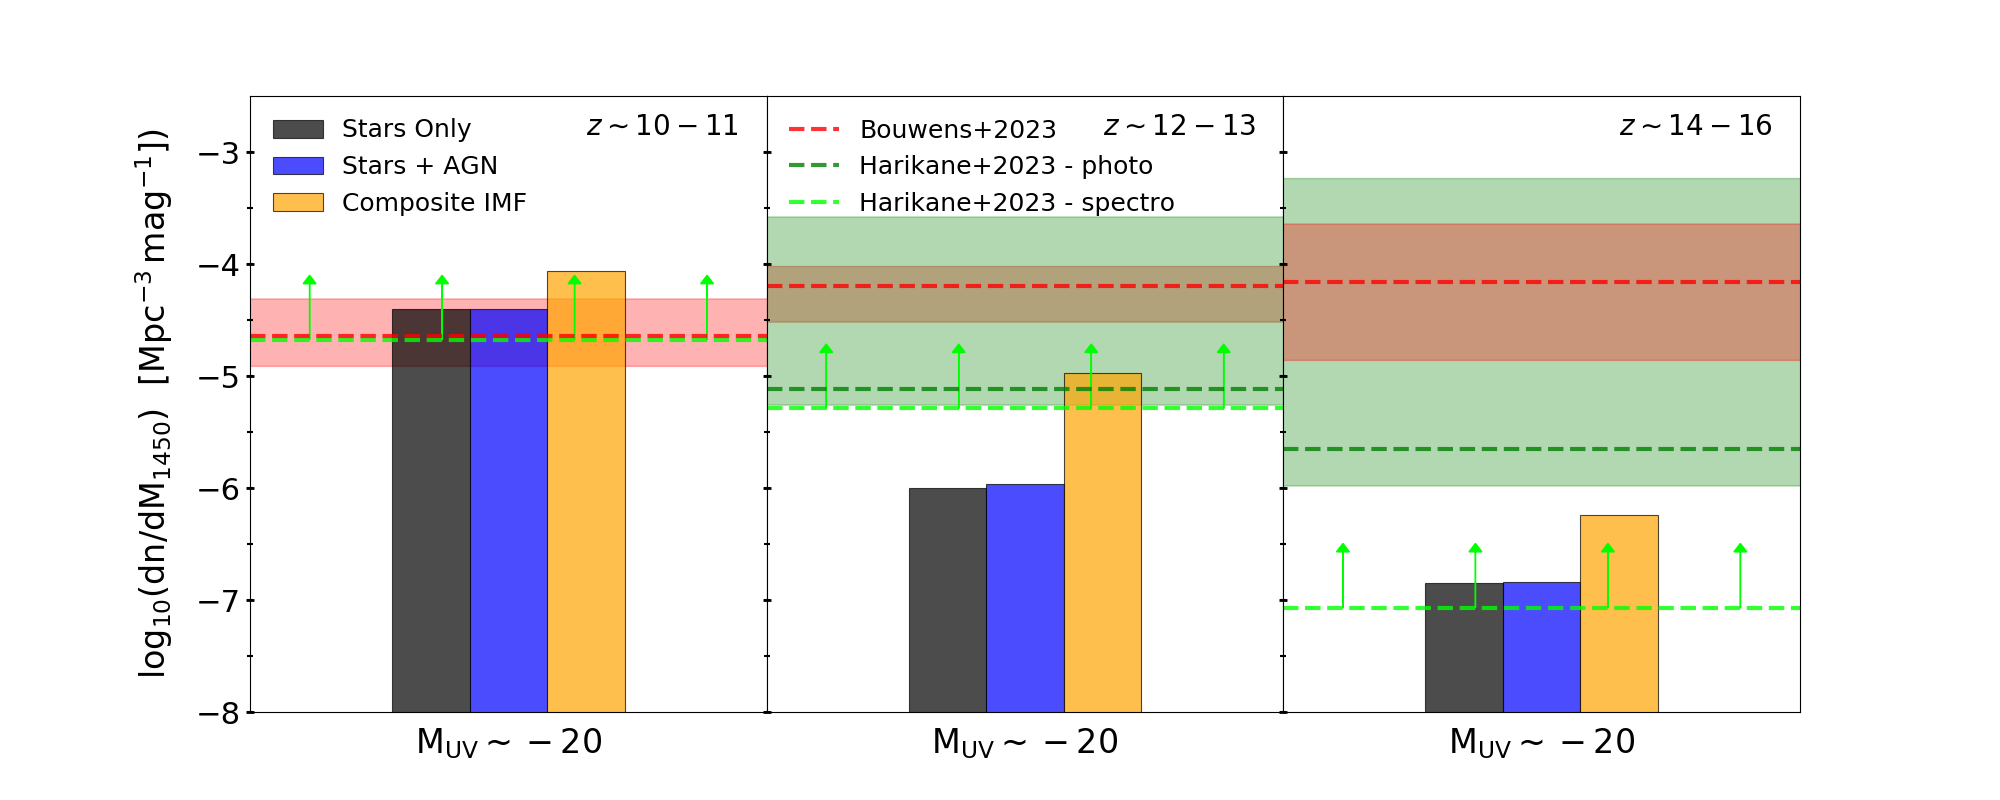
4.4 Quantifying the tension with JWST data
We quantify the tension between the predictions of the model that we have explored with current observations in Figure 12, where we compare the number density of galaxies with predicted by CAT (coloured histograms) in the redshift range (left panel), (middle panel) and (right panel), with the observational estimates of Bouwens et al. (2023, horizontal red line) and Harikane et al. (2023c, horizontal green line), based on photometric candidates, and with analysis of Harikane et al. (2023b, horizontal light green), based on spectroscopically confirmed galaxies. The values obtained from the photometric samples have been estimated from the Schechter fits444In general, the LF are best-fit assuming both a double-power-law and a Schechter function, but due to the uncertainties in the measurements, the difference between the two is small at , and negligible at and 16 Harikane et al. (2023c). of the LF at reported in the original papers, with their associated errors. The value estimated from the spectroscopic sample is reported as a lower limit. The three coloured histograms represent the number density of sources predicted by CAT when the UV luminosity is computed according to CAT reference model considering only the emission from stars (black) and from stars and accreting BHs (blue), while the orange histograms show the result of computing the stellar emission according to a transitional IMF. As anticipated, considering the AGN contribution in addition to the stellar emission does not significantly increase the number density of sources with at . CAT reference model predictions are consistent with observations at , but fall short by 0.8 dex at , and 1.2 dex at , compared to the values estimated by Harikane et al. (2023c), and by 1.8 dex at , and 2.7 dex at , compared to the values estimated by Bouwens et al. (2023), while being consistent with the lower limit estimated by Harikane et al. (2023b) at . Interestingly, the increase in the UV luminosity predicted by a transitional IMF brings the model in agreement with the observational estimate at by Harikane et al. (2023c), and reduces the disagreement with their best-fit value to 0.6 dex at , while the estimated values from Bouwens et al. (2023) are still 0.8 dex (2.1 dex) higher than the model predictions at ().
5 Conclusions
In this study we have explored the contribution of Pop III/II stars and accreting BH seeds to the UV luminosity evolution at using the Cosmic Archaeology Tool (CAT) model. We first presented the predictions of CAT regarding the cosmic star formation history and the contributions of the first galaxies and their nuclear BHs to cosmic reionization. We then compared the galaxy UV luminosity function at with available observations, from deep HST and JWST data, discussing the contribution of emission from stars, including Pop III stars, and accreting BHs. We find that:
-
•
The model predicts a cosmic star formation history dominated by UV faint () galaxies populated by Pop II/I stars. In the redshift range , CAT predictions for the total SFRD are in very good agreement with data inferred from gamma-ray burst observations, which are sensitive to both obscured and unobscured star formation (Kistler et al., 2009; Robertson & Ellis, 2012). Conversely, the SFRD derived from the rest-frame UV luminosity are better reproduced by CAT when only the contribution of the sources brightest than is considered (Trinca et al., 2022).
-
•
At , the formation of Pop III stars is strongly self-regulated, their SFRD remains almost constant, and their contribution to the total SFRD ranges from down to . Below , chemical feedback prevents further episodes of Pop III star formation.
-
•
CAT predicts a cosmic reionization process consistent with current observational constraints. Stars are the primary sources of cosmic reionization, with of ionizing photons escaping into the IGM at , in good agreement with recent results (Finkelstein et al., 2019; Naidu et al., 2020; Schaerer, 2002; Mascia et al., 2023). Due to their top-heavy IMF and lower metallicity, Pop III stars dominate the emissivity down to . The AGN ionizing emissivity remains subdominant with respect to the Pop II stellar emission down to .
Having satisfied these global constraints, we have investigated the redshift evolution of the galaxy UV luminosity function predicted by CAT, comparing it with deep HST data and with recent JWST observations. We find that:
-
•
The stellar and AGN UV luminosity functions predicted by CAT are in good agreement with observations at . At higher redshift, CAT predicts a steeper faint-end slope than the observed best-fit luminosity functions extrapolated at , suggesting that stars may form too efficiently, feedback may be too inefficient, or that current observational samples may be still incomplete at these faint luminosities.
-
•
When considering only the emission from stars, the UV LF predicted by CAT at the bright end shows a mild evolution at , consistent with observations, except for the highest luminosity bins, at , where the model seems to underestimate the number of bright objects, despite the large statistical uncertainties. We quantified this tension by comparing the number density of galaxies with recent JWST data, finding that the model predictions are consistent with observations at , but fall short by 0.8 dex at , and 1.2 dex at , compared to the values estimated by Harikane et al. (2023c), and by 1.8 dex at , and 2.7 dex at , compared to the values estimated by Bouwens et al. (2023), while being consistent with the lower limit estimated by Harikane et al. (2023b) at .
-
•
Including the emission by AGNs does not affect these findings. In fact, at , the AGN emission appears negligible, due to the stunted growth of light seeds predicted by our reference model (see Trinca et al., 2022). At , during the formation epoch of heavy BH seeds, the AGN emission contributes on average to of the total UV emission, and their largest contamination reaches in the brightest bins of magnitude, at . However, the AGN emission becomes progressively more important at lower redshift, with an average (maximum) contribution of () at , and of at in systems with .
-
•
Metal-free and very metal-poor stellar populations might also increase the UV luminosity of galaxies at . Our results suggest that Pop III stars, with their harder emission spectra, contribute to the UV luminosity in up to of high-redshift systems at , while their contribution becomes significantly smaller with decreasing redshift, due to the progression of metal enrichment.
-
•
Finally, we have explored the effects on the UV luminosities of a more gradual transition in the stellar IMF, as suggested by recent high-resolution numerical simulations (Chon et al., 2021; Chon et al., 2022). We model this transitional IMF as a superposition of a Kroupa and a Log-flat IMF, with a relative weight that depends both on redshift and on the initial stellar metallicity, . Assuming a fixed value of and a constant stellar age of Myr, we find that galaxies emit more UV photons per unit SFR at and at than at , where a standard Kroupa IMF applies. When accounting for this effect, the number density of galaxies predicted by the model is in agreement with the observational estimate at by Harikane et al. (2023c), and reduces the disagreement with their best-fit value to 0.6 dex at , while the estimated values from Bouwens et al. (2023) are still 0.8 dex (2.1 dex) higher than the model predictions at ().
If the current tension between theoretical models and JWST observations will consolidate on the basis of a larger sample of spectroscopically confirmed galaxies at , this opens up the prospective of exploring the nature of the first sources that inhabit early galaxies, and to improve our understanding of the physical processes that shape the assembly of cosmic structures at these remote cosmic epochs.
Acknowledgements
We acknowledge support from the PRIN 2022 MUR project 2022CB3PJ3 - First Light And Galaxy aSsembly (FLAGS) funded by the European Union – Next Generation EU, from the Amaldi Research Center funded by the MIUR program “Dipartimento di Eccellenza ”(CUP:B81I18001170001), and from the INFN TEONGRAV specific initiative. This research is supported in part by Grants-in-Aid for Scientific Research (KO: 17H06360, 17H01102, 17H02869, 22H00149) from the Japan Society for the Promotion of Science.
Data Availability
The simulated data underlying this article will be shared on reasonable request to the corresponding author.
References
- Adams et al. (2023a) Adams N. J., et al., 2023a, arXiv e-prints, p. arXiv:2304.13721
- Adams et al. (2023b) Adams N. J., et al., 2023b, MNRAS, 518, 4755
- Aguado et al. (2023) Aguado D. S., et al., 2023, A&A, 669, L4
- Algera et al. (2023) Algera H. S. B., et al., 2023, MNRAS, 518, 6142
- Arrabal Haro et al. (2023) Arrabal Haro P., et al., 2023, arXiv e-prints, p. arXiv:2303.15431
- Atek et al. (2023) Atek H., et al., 2023, MNRAS, 519, 1201
- Backhaus et al. (2022) Backhaus B. E., et al., 2022, ApJ, 926, 161
- Baldwin et al. (1981) Baldwin J. A., Phillips M. M., Terlevich R., 1981, PASP, 93, 5
- Barkana & Loeb (2001) Barkana R., Loeb A., 2001, Phys. Rep., 349, 125
- Barrufet et al. (2023) Barrufet L., et al., 2023, MNRAS,
- Becerra et al. (2015) Becerra F., Greif T. H., Springel V., Hernquist L. E., 2015, MNRAS, 446, 2380
- Becerra et al. (2018) Becerra F., Marinacci F., Bromm V., Hernquist L. E., 2018, MNRAS, 480, 5029
- Becker & Bolton (2013) Becker G. D., Bolton J. S., 2013, MNRAS, 436, 1023
- Becker et al. (2021) Becker G. D., D’Aloisio A., Christenson H. M., Zhu Y., Worseck G., Bolton J. S., 2021, MNRAS, 508, 1853
- Behroozi et al. (2019) Behroozi P., Wechsler R. H., Hearin A. P., Conroy C., 2019, MNRAS, 488, 3143
- Bolan et al. (2022) Bolan P., et al., 2022, MNRAS, 517, 3263
- Bondi (1952) Bondi H., 1952, MNRAS, 112, 195
- Bouwens et al. (2012) Bouwens R. J., et al., 2012, ApJ, 754, 83
- Bouwens et al. (2014) Bouwens R. J., et al., 2014, ApJ, 795, 126
- Bouwens et al. (2021) Bouwens R. J., et al., 2021, AJ, 162, 47
- Bouwens et al. (2023) Bouwens R., Illingworth G., Oesch P., Stefanon M., Naidu R., van Leeuwen I., Magee D., 2023, MNRAS,
- Bowler et al. (2020) Bowler R. A. A., Jarvis M. J., Dunlop J. S., McLure R. J., McLeod D. J., Adams N. J., Milvang-Jensen B., McCracken H. J., 2020, MNRAS, 493, 2059
- Bradley et al. (2022) Bradley L. D., et al., 2022, arXiv e-prints, p. arXiv:2210.01777
- Bromm et al. (2001) Bromm V., Kudritzki R. P., Loeb A., 2001, ApJ, 552, 464
- Bruzual & Charlot (2003) Bruzual G., Charlot S., 2003, MNRAS, 344, 1000
- Bunker et al. (2023) Bunker A. J., et al., 2023, arXiv e-prints, p. arXiv:2302.07256
- Castellano et al. (2022) Castellano M., et al., 2022, ApJ, 938, L15
- Castellano et al. (2023) Castellano M., et al., 2023, ApJ, 948, L14
- Chon & Omukai (2020) Chon S., Omukai K., 2020, MNRAS, 494, 2851
- Chon et al. (2021) Chon S., Hosokawa T., Omukai K., 2021, MNRAS, 502, 700
- Chon et al. (2022) Chon S., Ono H., Omukai K., Schneider R., 2022, MNRAS, 514, 4639
- Cleri et al. (2023) Cleri N. J., et al., 2023, arXiv e-prints, p. arXiv:2301.07745
- Conroy & Gunn (2010) Conroy C., Gunn J. E., 2010, ApJ, 712, 833
- Conroy et al. (2009) Conroy C., Gunn J. E., White M., 2009, ApJ, 699, 486
- Curti et al. (2023) Curti M., et al., 2023, MNRAS, 518, 425
- Curtis-Lake et al. (2022) Curtis-Lake E., et al., 2022, arXiv e-prints, p. arXiv:2212.04568
- Davies et al. (2018) Davies F. B., et al., 2018, ApJ, 864, 142
- Dayal et al. (2020) Dayal P., et al., 2020, MNRAS, 495, 3065
- Dekel et al. (2023) Dekel A., Sarkar K. S., Birnboim Y., Mandelker N., Li Z., 2023, arXiv e-prints, p. arXiv:2303.04827
- Dijkstra et al. (2014) Dijkstra M., Ferrara A., Mesinger A., 2014, Monthly Notices of the Royal Astronomical Society, 442, 2036
- Donnan et al. (2023) Donnan C. T., et al., 2023, MNRAS, 518, 6011
- Dubois et al. (2014) Dubois Y., Volonteri M., Silk J., 2014, MNRAS, 440, 1590
- Duras et al. (2020) Duras F., et al., 2020, A&A, 636, A73
- Ellis et al. (2013) Ellis R. S., et al., 2013, ApJ, 763, L7
- Ferrara et al. (2014) Ferrara A., Salvadori S., Yue B., Schleicher D., 2014, MNRAS, 443, 2410
- Ferrara et al. (2022) Ferrara A., Pallottini A., Dayal P., 2022, arXiv e-prints, p. arXiv:2208.00720
- Fialkov et al. (2013) Fialkov A., Barkana R., Visbal E., Tseliakhovich D., Hirata C. M., 2013, MNRAS, 432, 2909
- Finkelstein & Bagley (2022) Finkelstein S. L., Bagley M. B., 2022, ApJ, 938, 25
- Finkelstein et al. (2019) Finkelstein S. L., et al., 2019, ApJ, 879, 36
- Finkelstein et al. (2022a) Finkelstein S. L., et al., 2022a, arXiv e-prints, p. arXiv:2211.05792
- Finkelstein et al. (2022b) Finkelstein S. L., et al., 2022b, ApJ, 940, L55
- Fiore et al. (2022) Fiore F., Ferrara A., Bischetti M., Feruglio C., Travascio A., 2022, arXiv e-prints, p. arXiv:2211.08937
- Fraser et al. (2017) Fraser M., Casey A. R., Gilmore G., Heger A., Chan C., 2017, MNRAS, 468, 418
- Furtak et al. (2023) Furtak L. J., Shuntov M., Atek H., Zitrin A., Richard J., Lehnert M. D., Chevallard J., 2023, MNRAS, 519, 3064
- Ganguly et al. (2007) Ganguly R., Brotherton M. S., Cales S., Scoggins B., Shang Z., Vestergaard M., 2007, ApJ, 665, 990
- Giallongo et al. (2019) Giallongo E., et al., 2019, ApJ, 884, 19
- Goulding & Greene (2022) Goulding A. D., Greene J. E., 2022, arXiv e-prints, p. arXiv:2208.02822
- Greene et al. (2023) Greene J. E., et al., 2023, arXiv e-prints, p. arXiv:2309.05714
- Greig et al. (2019) Greig B., Mesinger A., Bañados E., 2019, MNRAS, 484, 5094
- Gruppioni et al. (2020) Gruppioni C., et al., 2020, A&A, 643, A8
- Harikane et al. (2022a) Harikane Y., et al., 2022a, ApJS, 259, 20
- Harikane et al. (2022b) Harikane Y., et al., 2022b, ApJ, 929, 1
- Harikane et al. (2023a) Harikane Y., et al., 2023a, arXiv e-prints, p. arXiv:2303.11946
- Harikane et al. (2023b) Harikane Y., Nakajima K., Ouchi M., Umeda H., Isobe Y., Ono Y., Xu Y., Zhang Y., 2023b, arXiv e-prints, p. arXiv:2304.06658
- Harikane et al. (2023c) Harikane Y., et al., 2023c, ApJS, 265, 5
- Hartwig et al. (2022) Hartwig T., et al., 2022, ApJ, 936, 45
- Heintz et al. (2022a) Heintz K. E., et al., 2022a, arXiv e-prints, p. arXiv:2212.02890
- Heintz et al. (2022b) Heintz K. E., et al., 2022b, arXiv e-prints, p. arXiv:2212.06877
- Hirano et al. (2014) Hirano S., Hosokawa T., Yoshida N., Umeda H., Omukai K., Chiaki G., Yorke H. W., 2014, The Astrophysical Journal, 781, 60
- Hirano et al. (2015) Hirano S., Zhu N., Yoshida N., Spergel D., Yorke H. W., 2015, ApJ, 814, 18
- Hosokawa et al. (2011) Hosokawa T., Omukai K., Yoshida N., Yorke H. W., 2011, Science, 334, 1250
- Hosokawa et al. (2012) Hosokawa T., Omukai K., Yorke H. W., 2012, ApJ, 756, 93
- Hosokawa et al. (2016) Hosokawa T., Hirano S., Kuiper R., Yorke H. W., Omukai K., Yoshida N., 2016, ApJ, 824, 119
- Hoyle & Lyttleton (1941) Hoyle F., Lyttleton R. A., 1941, MNRAS, 101, 227
- Iliev et al. (2005) Iliev I. T., Scannapieco E., Shapiro P. R., 2005, ApJ, 624, 491
- Inayoshi et al. (2014) Inayoshi K., Omukai K., Tasker E., 2014, MNRAS, 445, L109
- Inayoshi et al. (2020) Inayoshi K., Visbal E., Haiman Z., 2020, ARA&A, 58, 27
- Inayoshi et al. (2022) Inayoshi K., Onoue M., Sugahara Y., Inoue A. K., Ho L. C., 2022, ApJ, 931, L25
- Ishiyama et al. (2021) Ishiyama T., et al., 2021, MNRAS, 506, 4210
- Jaacks et al. (2019) Jaacks J., Finkelstein S. L., Bromm V., 2019, MNRAS, 488, 2202
- Johnson et al. (2013) Johnson J. L., Dalla Vecchia C., Khochfar S., 2013, MNRAS, 428, 1857
- Katz et al. (2022) Katz H., Kimm T., Ellis R. S., Devriendt J., Slyz A., 2022, arXiv e-prints, p. arXiv:2207.04751
- Keller et al. (2023) Keller B. W., Munshi F., Trebitsch M., Tremmel M., 2023, ApJ, 943, L28
- Khusanova et al. (2021) Khusanova Y., et al., 2021, A&A, 649, A152
- Kistler et al. (2009) Kistler M. D., Yüksel H., Beacom J. F., Hopkins A. M., Wyithe J. S. B., 2009, ApJ, 705, L104
- Kocevski et al. (2023) Kocevski D. D., et al., 2023, arXiv e-prints, p. arXiv:2302.00012
- Kroupa (2001) Kroupa P., 2001, MNRAS, 322, 231
- Kuhlen & Faucher-Giguère (2012) Kuhlen M., Faucher-Giguère C.-A., 2012, MNRAS, 423, 862
- Labbe et al. (2022) Labbe I., et al., 2022, arXiv e-prints, p. arXiv:2207.12446
- Larson et al. (2023) Larson R. L., et al., 2023, arXiv e-prints, p. arXiv:2303.08918
- Latif & Ferrara (2016) Latif M. A., Ferrara A., 2016, Publ. Astron. Soc. Australia, 33, e051
- Latif et al. (2013) Latif M. A., Schleicher D. R. G., Schmidt W., Niemeyer J. C., 2013, MNRAS, 436, 2989
- Liu & Bromm (2020) Liu B., Bromm V., 2020, MNRAS, 497, 2839
- Madau & Dickinson (2014) Madau P., Dickinson M., 2014, ARA&A, 52, 415
- Madau et al. (2014) Madau P., Haardt F., Dotti M., 2014, ApJ, 784, L38
- Magg et al. (2022) Magg M., Schauer A. T. P., Klessen R. S., Glover S. C. O., Tress R. G., Jaura O., 2022, ApJ, 929, 119
- Maio et al. (2016) Maio U., Petkova M., De Lucia G., Borgani S., 2016, MNRAS, 460, 3733
- Maiolino et al. (2023a) Maiolino R., et al., 2023a, arXiv e-prints, p. arXiv:2305.12492
- Maiolino et al. (2023b) Maiolino R., et al., 2023b, arXiv e-prints, p. arXiv:2306.00953
- Maiolino et al. (2023c) Maiolino R., et al., 2023c, arXiv e-prints, p. arXiv:2308.01230
- Mancini et al. (2016) Mancini M., Schneider R., Graziani L., Valiante R., Dayal P., Maio U., Ciardi B., 2016, MNRAS, 462, 3130
- Mascia et al. (2023) Mascia S., et al., 2023, arXiv e-prints, p. arXiv:2301.02816
- Mason et al. (2023) Mason C. A., Trenti M., Treu T., 2023, MNRAS,
- Matthee et al. (2023) Matthee J., et al., 2023, arXiv e-prints, p. arXiv:2306.05448
- McCaffrey et al. (2023) McCaffrey J., Hardin S., Wise J., Regan J., 2023, arXiv e-prints, p. arXiv:2304.13755
- McGreer et al. (2015) McGreer I. D., Mesinger A., D’Odorico V., 2015, MNRAS, 447, 499
- McGreer et al. (2018) McGreer I. D., Fan X., Jiang L., Cai Z., 2018, AJ, 155, 131
- McLeod et al. (2023) McLeod D. J., et al., 2023, arXiv e-prints, p. arXiv:2304.14469
- Menci et al. (2022) Menci N., Castellano M., Santini P., Merlin E., Fontana A., Shankar F., 2022, ApJ, 938, L5
- Merlin et al. (2019) Merlin E., et al., 2019, MNRAS, 490, 3309
- Mirocha & Furlanetto (2023) Mirocha J., Furlanetto S. R., 2023, MNRAS, 519, 843
- Mo et al. (1998) Mo H. J., Mao S., White S. D. M., 1998, MNRAS, 295, 319
- Morales et al. (2021) Morales A. M., Mason C. A., Bruton S., Gronke M., Haardt F., Scarlata C., 2021, ApJ, 919, 120
- Naidu et al. (2020) Naidu R. P., Tacchella S., Mason C. A., Bose S., Oesch P. A., Conroy C., 2020, ApJ, 892, 109
- Naidu et al. (2022) Naidu R. P., et al., 2022, ApJ, 940, L14
- Nakajima & Maiolino (2022) Nakajima K., Maiolino R., 2022, MNRAS, 513, 5134
- Natarajan et al. (2017) Natarajan P., Pacucci F., Ferrara A., Agarwal B., Ricarte A., Zackrisson E., Cappelluti N., 2017, The Astrophysical Journal, 838, 117
- Negri & Volonteri (2017) Negri A., Volonteri M., 2017, MNRAS, 467, 3475
- Niida et al. (2020) Niida M., et al., 2020, ApJ, 904, 89
- Oesch et al. (2018) Oesch P. A., Bouwens R. J., Illingworth G. D., Labbé I., Stefanon M., 2018, ApJ, 855, 105
- Omukai & Nishi (1998) Omukai K., Nishi R., 1998, The Astrophysical Journal, 508, 141
- Omukai & Palla (2003) Omukai K., Palla F., 2003, The Astrophysical Journal, 589, 677
- Omukai et al. (2005) Omukai K., Tsuribe T., Schneider R., Ferrara A., 2005, The Astrophysical Journal, 626, 627
- Pacucci & Loeb (2020) Pacucci F., Loeb A., 2020, ApJ, 895, 95
- Pacucci et al. (2022) Pacucci F., Dayal P., Harikane Y., Inoue A. K., Loeb A., 2022, MNRAS, 514, L6
- Pallottini et al. (2015) Pallottini A., et al., 2015, MNRAS, 453, 2465
- Parkinson et al. (2008) Parkinson H., Cole S., Helly J., 2008, MNRAS, 383, 557
- Parsa et al. (2018) Parsa S., Dunlop J. S., McLure R. J., 2018, MNRAS, 474, 2904
- Pérez-González et al. (2023) Pérez-González P. G., et al., 2023, arXiv e-prints, p. arXiv:2302.02429
- Pfister et al. (2019) Pfister H., Volonteri M., Dubois Y., Dotti M., Colpi M., 2019, MNRAS, 486, 101
- Piana et al. (2022) Piana O., Dayal P., Choudhury T. R., 2022, MNRAS, 510, 5661
- Planck Collaboration et al. (2016) Planck Collaboration et al., 2016, A&A, 594, A13
- Planck Collaboration et al. (2018) Planck Collaboration et al., 2018, arXiv e-prints, p. arXiv:1807.06209
- Prada et al. (2023) Prada F., Behroozi P., Ishiyama T., Klypin A., Pérez E., 2023, arXiv e-prints, p. arXiv:2304.11911
- Reines & Volonteri (2015) Reines A. E., Volonteri M., 2015, ApJ, 813, 82
- Ricci et al. (2017) Ricci F., Marchesi S., Shankar F., La Franca F., Civano F., 2017, MNRAS, 465, 1915
- Robertson & Ellis (2012) Robertson B. E., Ellis R. S., 2012, ApJ, 744, 95
- Robertson et al. (2023) Robertson B. E., et al., 2023, Nature Astronomy,
- Salvadori et al. (2014) Salvadori S., Tolstoy E., Ferrara A., Zaroubi S., 2014, MNRAS, 437, L26
- Sarmento & Scannapieco (2022) Sarmento R., Scannapieco E., 2022, ApJ, 935, 174
- Sarmento et al. (2019) Sarmento R., Scannapieco E., Côté B., 2019, ApJ, 871, 206
- Sassano et al. (2021) Sassano F., Schneider R., Valiante R., Inayoshi K., Chon S., Omukai K., Mayer L., Capelo P. R., 2021, MNRAS, 506, 613
- Sassano et al. (2023) Sassano F., Capelo P. R., Mayer L., Schneider R., Valiante R., 2023, MNRAS, 519, 1837
- Schaerer (2002) Schaerer D., 2002, A&A, 382, 28
- Schaerer et al. (2022) Schaerer D., Marques-Chaves R., Barrufet L., Oesch P., Izotov Y. I., Naidu R., Guseva N. G., Brammer G., 2022, A&A, 665, L4
- Schenker et al. (2013) Schenker M. A., et al., 2013, ApJ, 768, 196
- Schneider & Omukai (2010) Schneider R., Omukai K., 2010, MNRAS, 402, 429
- Schneider et al. (2023) Schneider R., Valiante R., Trinca A., Graziani L., Volonteri M., Maiolino R., 2023, MNRAS, 526, 3250
- Shakura & Sunyaev (1973) Shakura N. I., Sunyaev R. A., 1973, A&A, 500, 33
- Skinner & Wise (2020) Skinner D., Wise J. H., 2020, MNRAS, 492, 4386
- Spinoso et al. (2022) Spinoso D., Bonoli S., Valiante R., Schneider R., Izquierdo-Villalba D., 2022, arXiv e-prints, p. arXiv:2203.13846
- Sugimura et al. (2014) Sugimura K., Omukai K., Inoue A. K., 2014, Monthly Notices of the Royal Astronomical Society, 445, 544
- Sugimura et al. (2020) Sugimura K., Matsumoto T., Hosokawa T., Hirano S., Omukai K., 2020, arXiv e-prints, p. arXiv:2002.00012
- Susa et al. (2014) Susa H., Hasegawa K., Tominaga N., 2014, ApJ, 792, 32
- Tacchella et al. (2022) Tacchella S., et al., 2022, arXiv e-prints, p. arXiv:2208.03281
- Tacchella et al. (2023) Tacchella S., et al., 2023, arXiv e-prints, p. arXiv:2302.07234
- Tanaka & Haiman (2009) Tanaka T., Haiman Z., 2009, ApJ, 696, 1798
- Tanikawa et al. (2022) Tanikawa A., Yoshida T., Kinugawa T., Trani A. A., Hosokawa T., Susa H., Omukai K., 2022, ApJ, 926, 83
- Tornatore et al. (2007) Tornatore L., Ferrara A., Schneider R., 2007, Monthly Notices of the Royal Astronomical Society, 382, 945
- Tremmel et al. (2018) Tremmel M., Governato F., Volonteri M., Quinn T. R., Pontzen A., 2018, MNRAS, 475, 4967
- Tremmel et al. (2019) Tremmel M., et al., 2019, MNRAS, 483, 3336
- Trinca et al. (2022) Trinca A., Schneider R., Valiante R., Graziani L., Zappacosta L., Shankar F., 2022, MNRAS, 511, 616
- Trinca et al. (2023) Trinca A., Schneider R., Maiolino R., Valiante R., Graziani L., Volonteri M., 2023, MNRAS, 519, 4753
- Trussler et al. (2022) Trussler J. A. A., Conselice C. J., Adams N. J., Maiolino R., Nakajima K., Zackrisson E., Ferreira L., 2022, arXiv e-prints, p. arXiv:2211.02038
- Übler et al. (2023) Übler H., et al., 2023, arXiv e-prints, p. arXiv:2302.06647
- Ueda et al. (2014) Ueda Y., Akiyama M., Hasinger G., Miyaji T., Watson M. G., 2014, ApJ, 786, 104
- Valiante et al. (2011) Valiante R., Schneider R., Salvadori S., Bianchi S., 2011, Monthly Notices of the Royal Astronomical Society, 416, 1916
- Valiante et al. (2014) Valiante R., Schneider R., Salvadori S., Gallerani S., 2014, Monthly Notices of the Royal Astronomical Society, 444, 2442
- Valiante et al. (2016) Valiante R., Schneider R., Volonteri M., Omukai K., 2016, Monthly Notices of the Royal Astronomical Society, 457, 3356
- Valiante et al. (2018) Valiante R., Schneider R., Zappacosta L., Graziani L., Pezzulli E., Volonteri M., 2018, MNRAS, 476, 407
- Vanzella et al. (2023) Vanzella E., et al., 2023, ApJ, 945, 53
- Venditti et al. (2023) Venditti A., Graziani L., Schneider R., Pentericci L., Di Cesare C., Maio U., Omukai K., 2023, arXiv e-prints, p. arXiv:2301.10259
- Ventura et al. (2024) Ventura E. M., Qin Y., Balu S., Wyithe J. S. B., 2024, arXiv e-prints, p. arXiv:2401.07396
- Visbal et al. (2020) Visbal E., Bryan G. L., Haiman Z., 2020, ApJ, 897, 95
- Volonteri et al. (2020) Volonteri M., et al., 2020, MNRAS, 498, 2219
- Volonteri et al. (2022) Volonteri M., Habouzit M., Colpi M., 2022, arXiv e-prints, p. arXiv:2212.04710
- Wang et al. (2020) Wang F., et al., 2020, ApJ, 896, 23
- Wang et al. (2022) Wang X., et al., 2022, arXiv e-prints, p. arXiv:2212.04476
- Weinberger et al. (2017) Weinberger R., et al., 2017, MNRAS, 465, 3291
- Weingartner & Draine (2001) Weingartner J. C., Draine B. T., 2001, ApJ, 548, 296
- Welch et al. (2022) Welch B., et al., 2022, ApJ, 940, L1
- Williams et al. (2023) Williams H., et al., 2023, Science, 380, 416
- Wolcott-Green et al. (2017) Wolcott-Green J., Haiman Z., Bryan G. L., 2017, MNRAS, 469, 3329
- Woods et al. (2019) Woods T. E., et al., 2019, Publ. Astron. Soc. Australia, 36, e027
- Xu et al. (2016) Xu H., Norman M. L., O’Shea B. W., Wise J. H., 2016, ApJ, 823, 140
- Yoshida et al. (2008) Yoshida N., Omukai K., Hernquist L., 2008, Science, 321, 669
- Yung et al. (2023) Yung L. Y. A., Somerville R. S., Finkelstein S. L., Wilkins S. M., Gardner J. P., 2023, arXiv e-prints, p. arXiv:2304.04348
- Zavala et al. (2023) Zavala J. A., et al., 2023, ApJ, 943, L9
- Zhang et al. (2021) Zhang H., Behroozi P., Volonteri M., Silk J., Fan X., Hopkins P. F., Yang J., Aird J., 2021, arXiv e-prints, p. arXiv:2105.10474
- Ziparo et al. (2023) Ziparo F., Ferrara A., Sommovigo L., Kohandel M., 2023, MNRAS,
- de Bennassuti et al. (2014) de Bennassuti M., Schneider R., Valiante R., Salvadori S., 2014, MNRAS, 445, 3039
- de Bennassuti et al. (2017) de Bennassuti M., Salvadori S., Schneider R., Valiante R., Omukai K., 2017, MNRAS, 465, 926