Fine-Tuning of Colloidal Polymer Crystals by Molecular Simulation
Abstract
Through extensive molecular simulations we determine a phase diagram of attractive, flexible polymer chains in two and three dimensions. A surprisingly rich collection of distinct crystal morphologies appear, which can be finely tuned through the range of attraction. In three dimensions these include the face centered cubic, hexagonal close packed, simple hexagonal and body centered cubic crystals and the Frank-Kasper phase. A simple geometric model is proposed, based on the concept of cumulative neighbours of ideal crystals, which can accurately predict most of the observed structures and the corresponding transitions. The attraction range can thus be considered as an adjustable parameter for the design of colloidal polymer crystals with tailored morphologies.
I Introduction
Crystallization is one of the most intriguing physicochemical processes in science and technology. While of paramount importance in materials design and engineering, key aspects of the phenomenon remain rather poorly understood. Thus, it is imperative to establish a connection between behavior at the level of atoms and molecules, the ensuing ordered structures and eventually the macroscopic properties of the end material.
Very recently through the emergence of “digital alchemy” [1] the concept is tackled through a new perspective: one starts from the target morphologies and searches, mainly through computational tools, for the molecular shape and size that would produce them [2]. Such reverse engineering methods, combined with robust algorithms, machine learning and predictive modeling have led to significant advances in the computer-aided design of soft materials made of self-assembled colloids and nanoparticles [3, 4]. As an alternative, the shape/size of hard-body objects can be effectively replaced by fine tuning the pair-wise interactions between the species, be particles or atoms, in order to achieve the desired geometric patterns [5, 6, 7]. These simulation breakthroughs have been accompanied by vigorous progress in colloidal synthesis allowing for a systematic, instead of trial-and-error, fabrication of optimal structures based on self organization from properly selected building blocks [8, 9, 10, 11, 12, 13].
The phase behavior of macromolecular systems is equally important [14] and more complex compared to the one of monomeric analogs due to the wide spectrum of characteristic length and time scales involved. Designing crystals made of soft/hard colloidal polymers and molecules [15, 16] remains a formidable challenge in spite of the important experimental [17, 18, 19, 20, 21, 22, 23] and modeling [24, 25, 26, 27, 28] advances in synthesis, characterization and property-prediction.
In the present contribution we demonstrate a hierarchical modeling approach for the design and morphological fine tuning of crystals of colloidal polymers with short-range attractive interactions. First, we describe the macromolecular system at hand, then we introduce a geometric neighbor model to predict the thermodynamically stable crystal, and finally we resort to simulations to verify and extend analytical predictions.
II Model, Systems and Methodology
II.1 Molecular model
The colloidal polymer model we have chosen (in two and three dimensions) is a bulk assembly of linear, freely-jointed chains of tangent, non-overlapping spheres of uniform diameter , which is further the characteristic unit length of the system, taken here as unity. Bonded monomers along the chain backbone are tangent within a numerical tolerance of . Practically, this means that no gaps exist between bonded sites that are known to profoundly affect the phase behavior of chains and the ensuing crystal morphologies [29, 30]. Short-range, pair-wise attraction is realized through the square well (SW) potential, described by
| (1) |
where the tunable parameters correspond to intensity (depth) and the range of interaction , the latter being expressed in units of (). In Eq. 1, is the energy that corresponds to the interaction of two monomers and whose centers lie at a distance .
Since the early works of Young and Alder [31, 32] the SW model has been applied to study (free) energy-driven processes in monomeric and more complex systems, and has provided insights into the phase behavior, coalescence and percolation of monomers [33, 34, 35, 36, 37, 38, 39, 40, 41], and protein folding and self-assembly of single chains [42, 43, 44, 45, 46].
II.2 Geometric Neighbor Model
The proposed geometric neighbor model is particularly simple and it follows a concept similar to the one proposed by Serrano-Illán . as analyzed in [39]. Given the entirely attractive nature of the interactions, thermodynamic stability of the crystals is primarily dictated by the number of neighbours as a function of distance. The more neighbours packed within a radius equal to the attraction range , the lower the potential energy and (ignoring entropic differences among polymorphs, which are known to be quite small [47, 48, 49, 50, 51]) the more stable the corresponding crystal.
The tangency condition imposed by chain connectivity simplifies the analysis of polymeric analogs. First, because only strictly tangent polymer crystals have to be considered. Second, the bonds along the chain backbone stabilize cluster formation compared to monomeric analogs for the same attraction intensity.
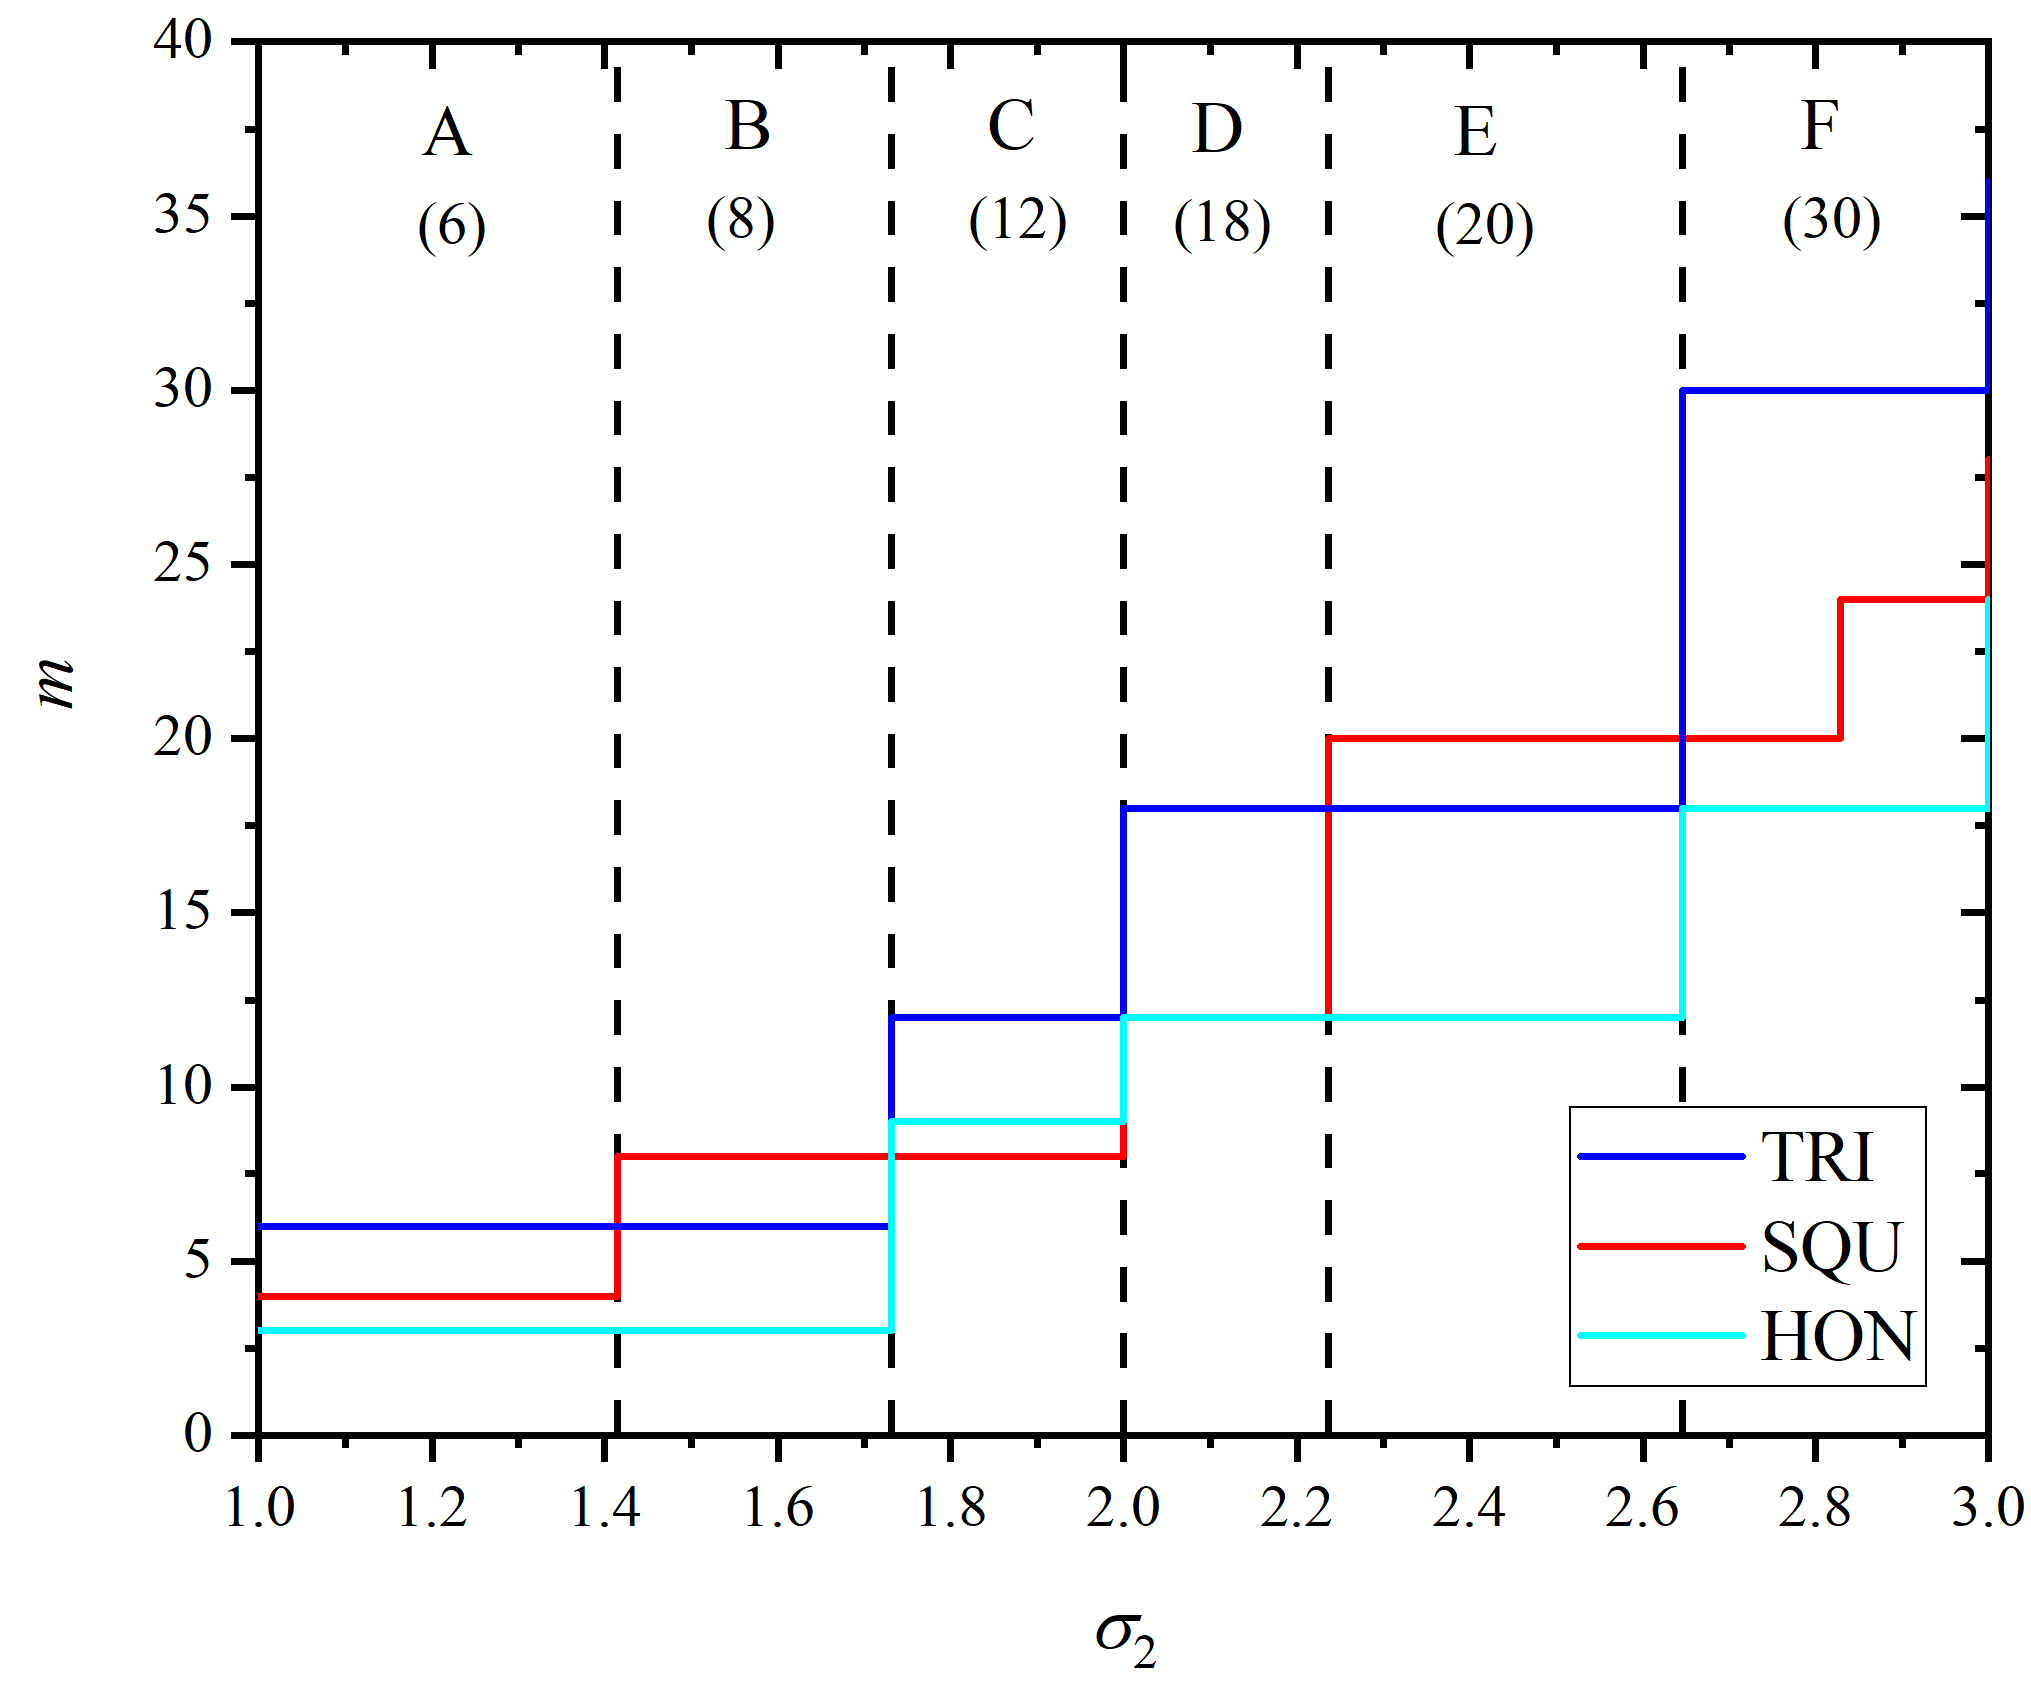
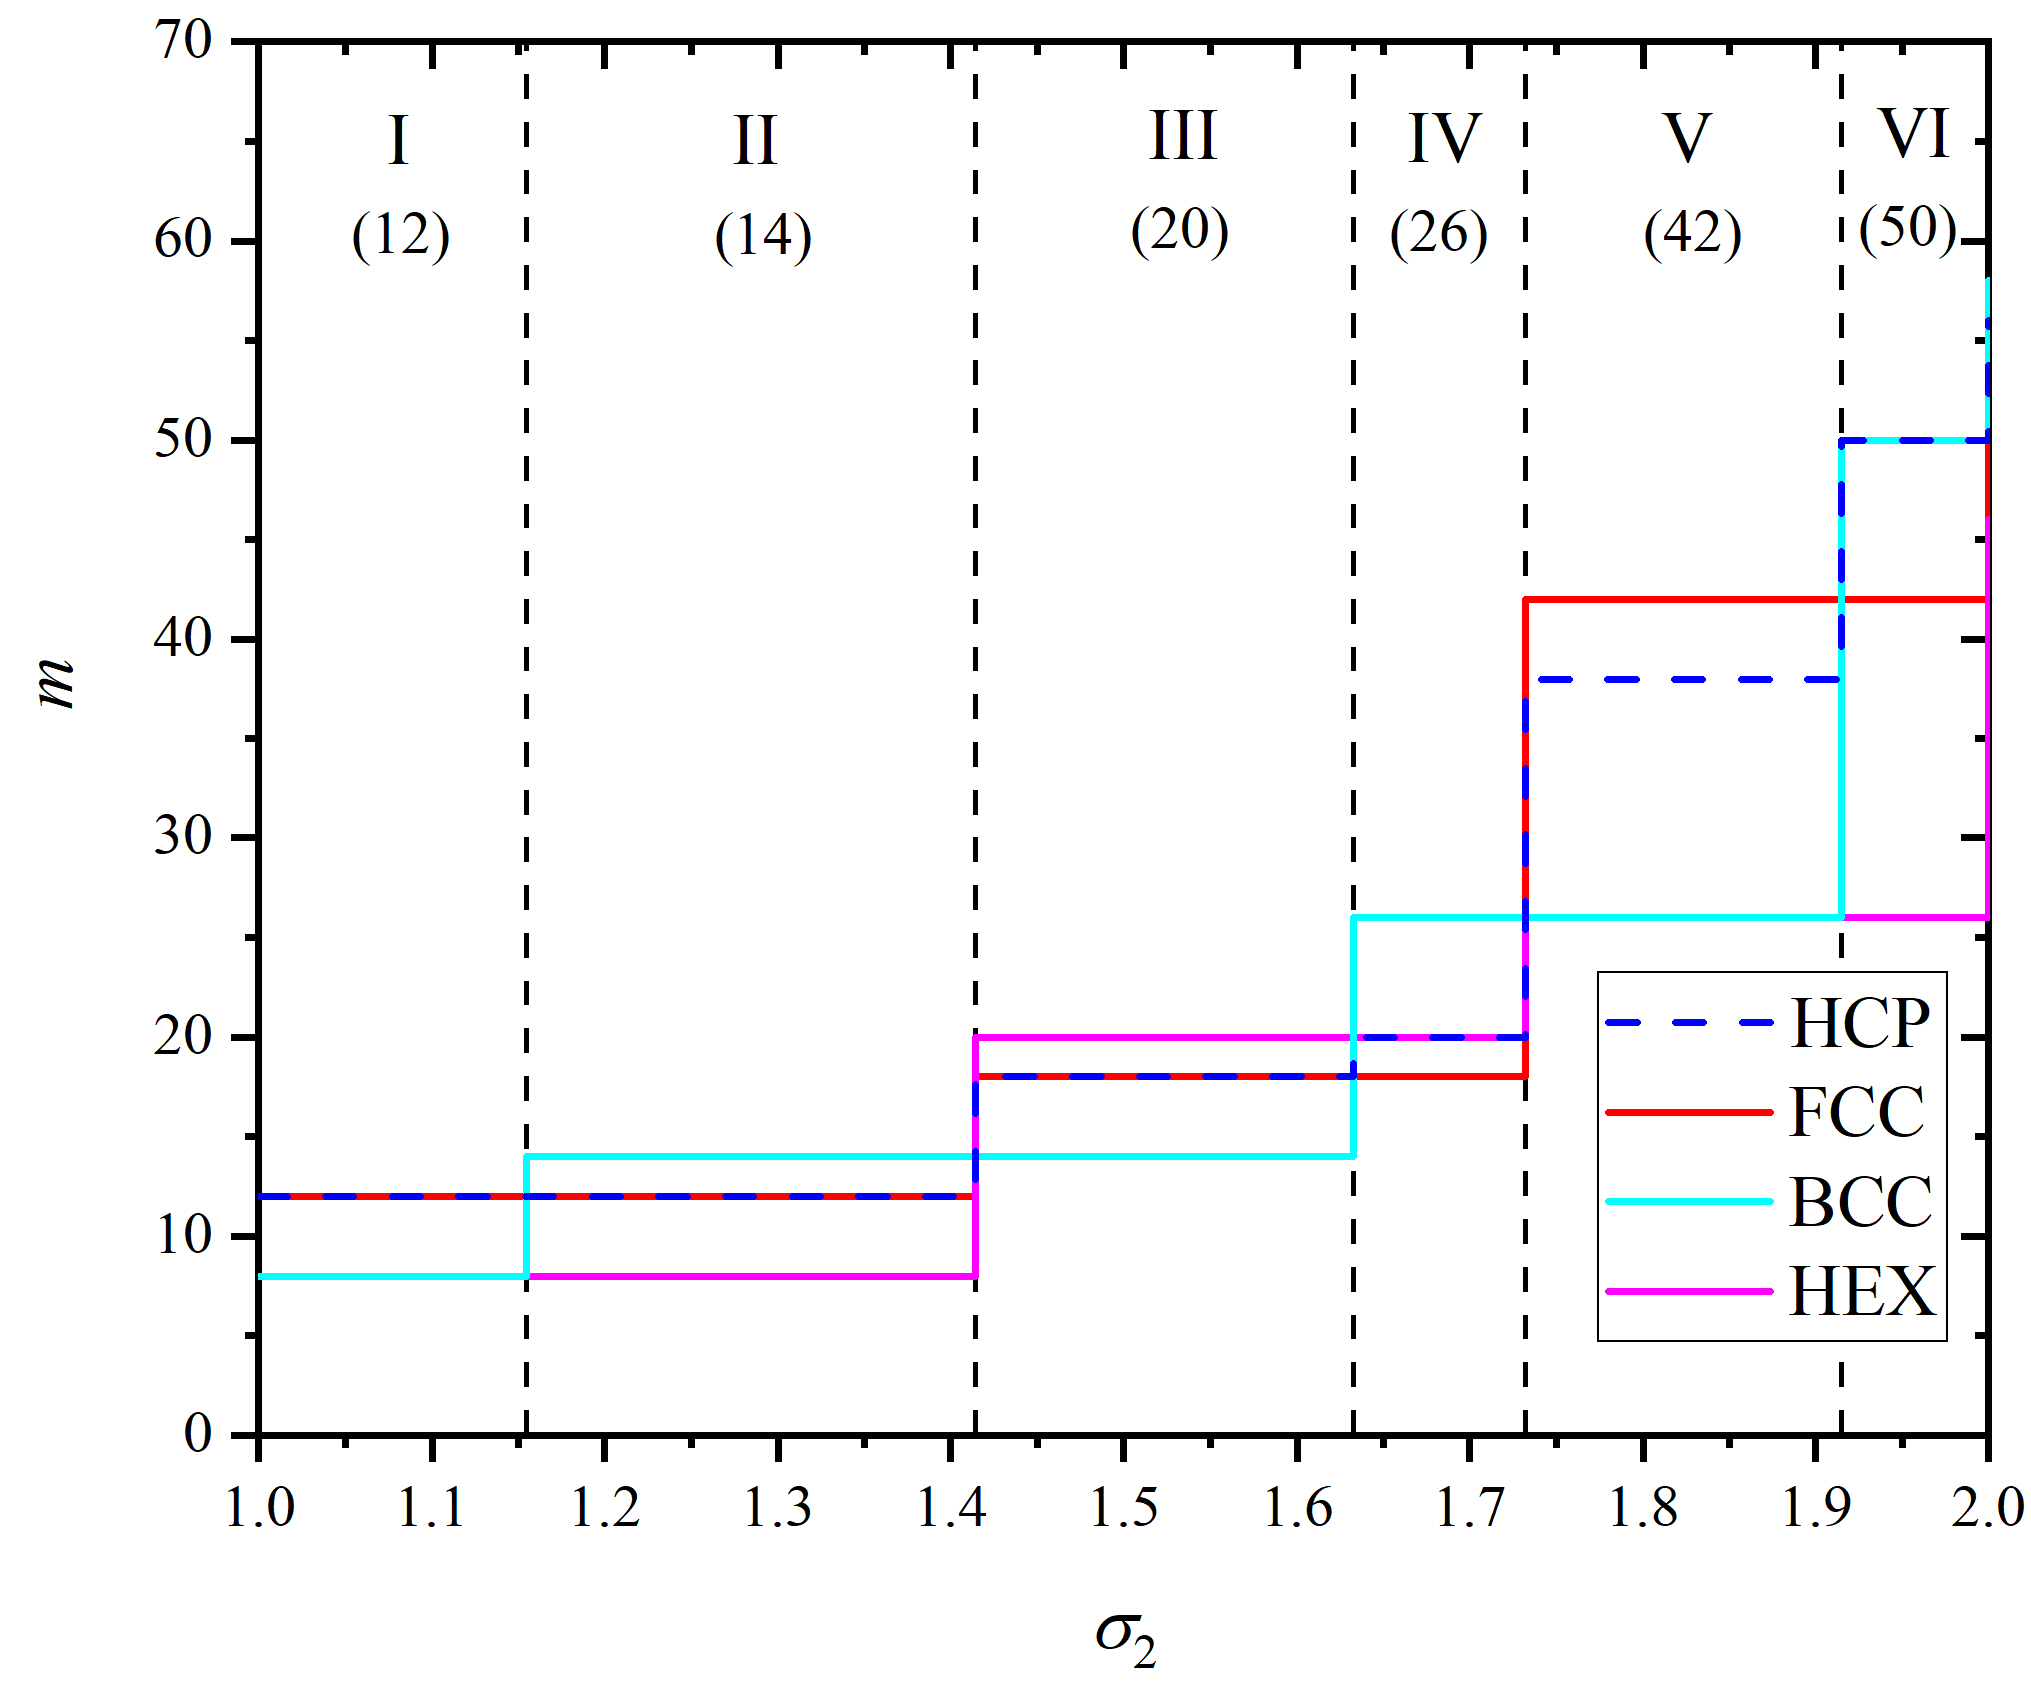
The following crystals have been considered for the geometric neighbor model: honeycomb (HON), square (SQU) and triangular (TRI) 2-D crystals, and the face centered cubic (FCC), hexagonal close packed (HCP), holoedric 6/mmm (simple hexagonal or HEX), and body centered cubic (BCC) 3D crystals, whose structures and properties can be found in [52].
Fig.1 shows the number of neighbours as a function of distance for the above crystal types in 2D (top panel) and 3D (bottom panel). Starting with 2D, the geometric model predicts that the TRI crystal is the prevailing one from the point of view of energy in all ranges except the intervals (Region B) and (Region E) where a site in the SQU crystal has more neighbours within a circle of diameter . The HON is systematically more dilute and thus the least stable crystal.
In the 3D case, six distinct regions can be identified. The initial dominance of HCP/FCC (Region I) is succeeded by BCC (Region II), HEX (Region III), again BCC (Region IV), FCC (Region V) and HCP/BCC (Region VI). At a first glimpse it is quite surprising that for distances in the range of the non-compact HEX and BCC crystals prevail. Still, the dominance of non-compact crystals, as calculated here, is in agreement with the density-based calculations in Ref [39].
The phase diagram of Fig. 1, as predicted by the geometric neighbor model, raises a number of intriguing questions, especially whether the expected ordered morphologies can appear “in reality”. We remind here that any entropic contributions, both translational and conformational, are ignored. Information in the geometric neighbor model about chain connectivity is solely incorporated through the tangency condition, effectively enforcing the absence of gaps between the inter-lattice sites. Thus, this straightforward geometric argument can only be considered as a first order approximation (but an exceedingly successful one, as will be shown below).
II.3 Monte Carlo Simulations
To validate the predictive capacity of the proposed model, we carry out extensive simulations for the generation and equilibration of the systems composed of 100 attractive chains of average chain length for a total of interacting sites. Regarding the simulations and the successive structural identification of the generated system configurations, we employ Simu-D, a home-made simulator/descriptor software suite [53]. The simulator component is a Monte Carlo (MC) protocol based on local, cluster and chain-connectivity-altering moves (CCAMs) [54, 55, 56] as in all our recent works on (free)energy-driven [57] and athermal [58, 59, 60] polymer-based systems. The MC mix is composed of: (i) rotation (10%), (ii) reptation (10%), (iii) flip (34.7%), (iv) intermolecular reptation (25%), (v) configurational bias (20%), (vi) simplified end-bridging (0.1%), (vii) simplified intermolecular end-bridging (0.1%) and cluster moves (0.1%) where numbers in parenthesis correspond to attempt probabilities. Furthermore, a cluster analysis is attempted at regular intervals ( steps) to disable cluster moves when there is just one cluster. Clusters are detected using an approach similar to the DBSCAN algorithm [61, 62], where the distance criterion is set to 1.2 (in units of ). As explained in detail in [55, 56, 53] every local MC move is executed in a configurational bias pattern. To increase computational performance the number of attempts depends on cluster population, being when there is just one cluster and when several exist.
Simulations are carried out in NVT ensemble for 3D simulations, and in the NPT ensemble for 2D. In both cases, temperature is set equal to , where is the Boltzmann constant. Pressure is fixed at 1 bar (NPT simulations) and packing density at (or equivalently number density ) (NVT simulations). Due to the application of chain-connectivity-altering moves, dispersity in chain lengths is introduced. These vary uniformly with the minimum and maximum allowed lengths being set at 6 and 18 monomers, respectively. Selected simulations on polymers with longer lengths ( = 24), under the same conditions, revealed no appreciable difference in the phase behavior.
We start from a fully equilibrated athermal system of fully flexible chains of tangent hard spheres at low packing density and activate the SW potential. As explained in detail in [57], this corresponds practically to instantaneous quenching with the attraction intensity adopting the role of an effective quench rate: the higher the value of , the higher the temperature difference. 2D polymer configurations are created by shrinking the original 3D systems until a film thickness of unit length is reached through a process that is described in [63]. By fixing all other parameters (, or and ) and the interaction intensity at , we systematically explore the effect of interaction range in the interval in steps of 0.01 for 3D systems and in steps of 0.02 for 2D systems. As a first design step, a representative value of the well depth was selected because it is a) large enough to prevent entropy from overwhelming the internal energy advantage of specific crystals, and b) not so high that the simulations would become trapped in local energy minima, leading to glass formation instead of crystallization (see for example Figure 5 in [57] on the phase behavior as a function of attraction intensity).
Equilibration of the systems is traced through a hierarchical, two-step evolution: 1) A single cluster is formed including all chains and their monomers. Quantification of this step is trivial by tracking the evolution of the number of formed clusters as the simulation evolves. Activation of cluster-based MC moves is a necessity especially for low values of and/or high values of [57]; 2) The state of order in the formed cluster becomes stable. This final step is quantified through the evolution of the degree of crystallinity, practically being equal to the sum of all order parameters for all reference crystals (see next section). To check the reproducibility of the presented results we have conducted additional simulations starting from different initial athermal configurations (but still under very dilute conditions) and with different seeds for the random number generators. For the whole range of studied values no appreciable difference is detected in the established morphologies between independent MC simulations.
II.4 Structural Analysis of Computer-Generated System Configurations
We employ the Characteristic Crystallographic Element (CCE) norm [64, 52] for the structural analysis of the computer-generated system configurations. In 3D, we use the CCE norm to detect hexagonal close packed (HCP), face centered cubic (FCC), simple hexagonal (HEX), and body centered cubic (BCC) crystals as well as non-crystallographic fivefold (FIV) local symmetry. Regarding the 2D analysis, we compare against the triangular (TRI), square (SQU), and honeycomb (HON) crystals, as well as pentagonal (PEN) local symmetry. Every monomer in the system, be in 2D or 3D, is tested against all corresponding reference crystals as described above. Accordingly, a norm value is obtained for site with respect to a reference crystal . Here, a threshold value of is adopted below which a site is considered as of -type. Furthermore, we can measure the order parameter, of a given crystal as:
| (2) |
where is the probability distribution function over all monomers for a given configuration. In order to avoid considering the monomers that lie on the surface of the formed cluster the value of is multiplied by , where is the number of sites in the simulation ( in all simulations reported here) and is the is the number of monomers on the outer surface of the formed cluster. This is because in 3D under dilute conditions surface monomers lack a complete Voronoi environment and thus are characterized by a highly disordered local structure.
III Results
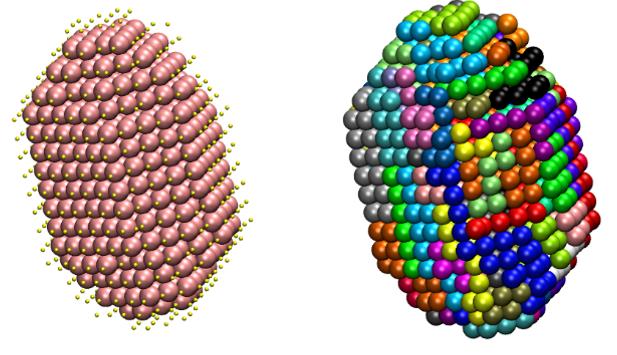
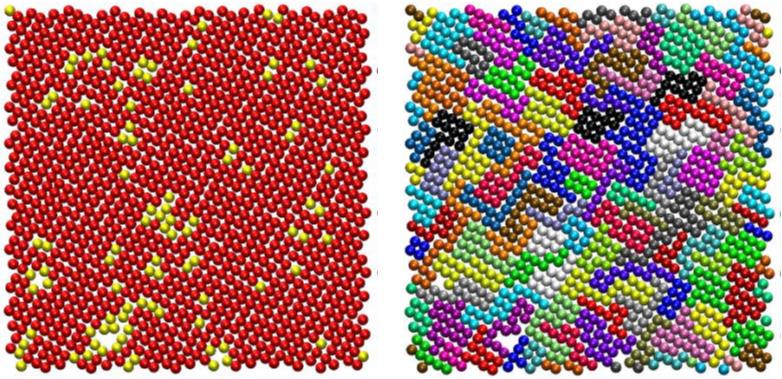
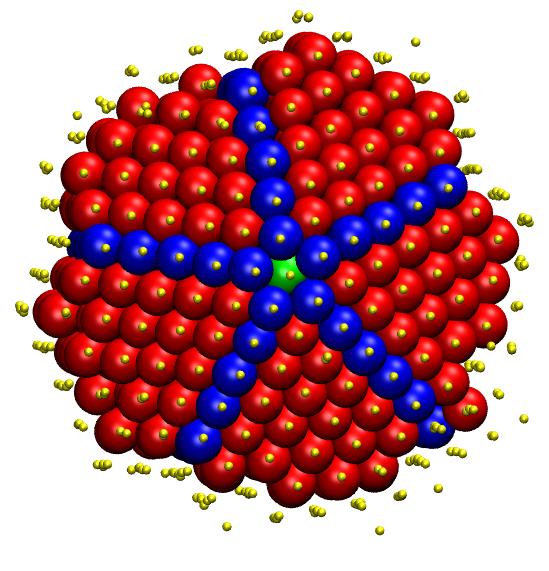
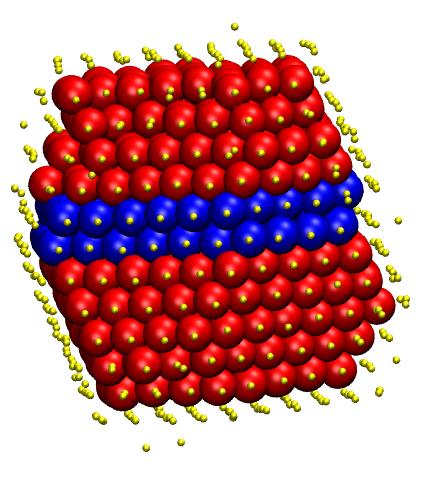
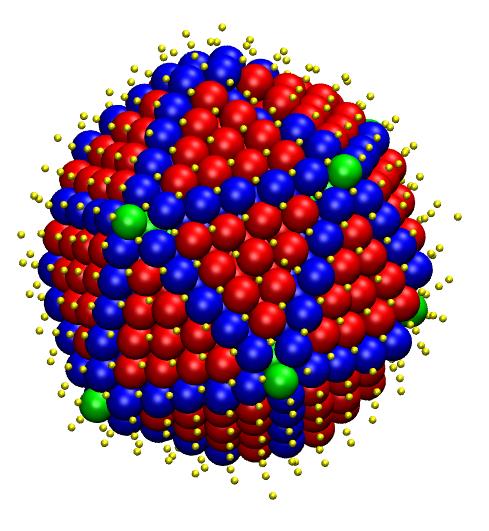
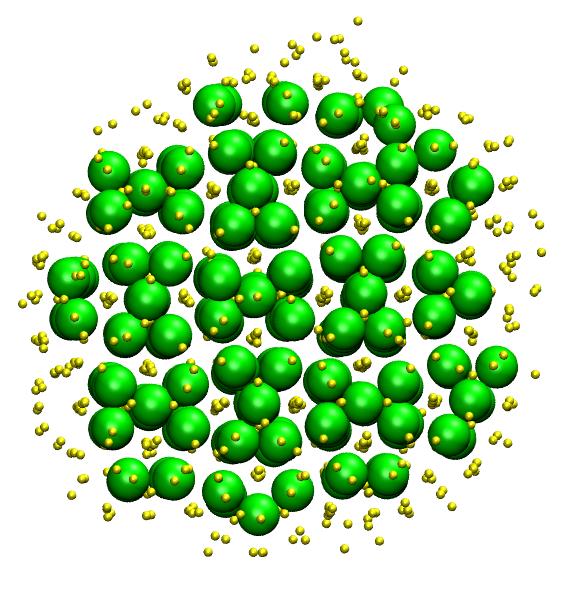
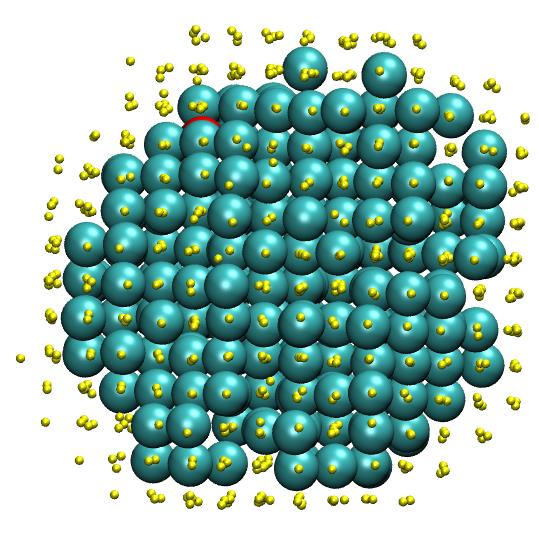
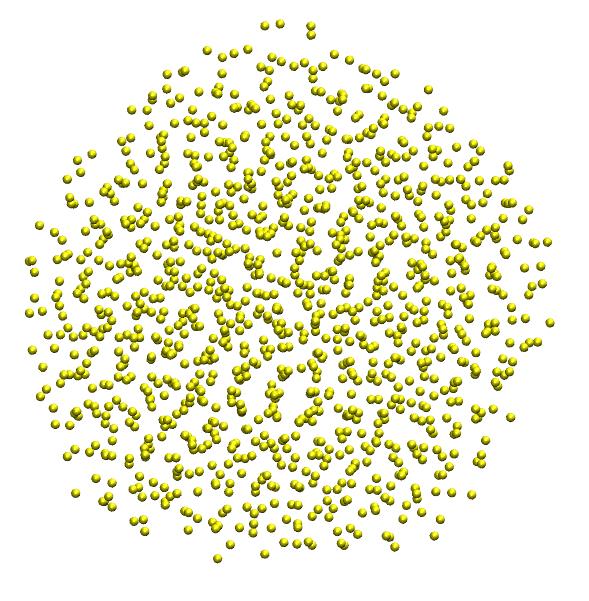
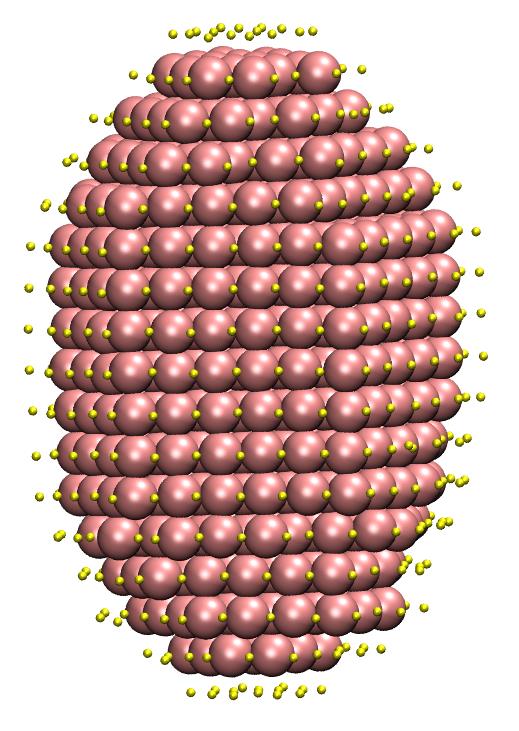
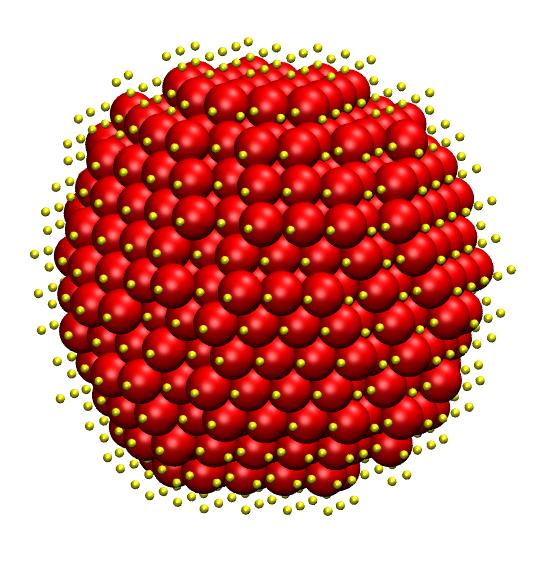
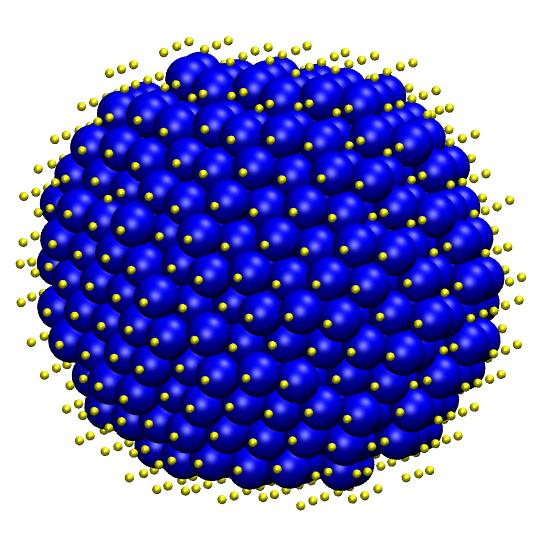
The activation of attractive potential dictating all intra- and inter-chain interactions leads to aggregation of the polymer chains and to the eventual formation of a single cluster, which may crystallize depending on the values of interaction range and intensity. As stated earlier the selected value of under the specific simulation conditions guarantees crystallization over glass formation as demonstrated in [57]. Once the single cluster containing all chains and monomers is formed, the CCE descriptor is employed to quantify the structural characteristics and the possible similarity to one of the reference crystals in 2D or 3D. Throughout the manuscript the following color convention is used: Blue, red, green, pink, and cyan colors correspond to HCP, FCC, FIV, HEX, and BCC similarity, respectively, for 3D systems; Blue, red, green, and cyan colors correspond to TRI, SQU, PEN, and HON similarity, respectively, for 2D systems. Amorphous (or more precisely unidentified or ”none of the above”) sites (AMO) are shown in yellow (and with reduced dimensions in 3D for clarity).
An example of the formed single cluster of polymers at the end of the simulation and its structural identification through the CCE norm descriptor can be seen in Figs. 2 and 3, for 3D and 2D systems, respectively. On the left panel sites are colored according to their structural type, as quantified by the crystallographic analysis, and on the right panel monomers are colored according to the parent chain.
In the literature, simulation results are typically reported in reduced units of temperature and pressure , where and are the applied temperature and pressure and is Boltzmann’s constant. Here, we deviate from the traditional approach and examine the important dependence on the attraction intensity, which, unlike or , is a material dependent, adjustable parameter, in accordance with our goal to finely tune specific morphologies of hard colloidal polymers.
Fig. 4 illustrates the strong effect, and hence the great tunability potential, of the interaction range : the fraction of crystalline sites is shown as a function of for the 2D systems, together with the regions predicted by the simple geometric neighbour model and the expected prevailing crystals, based on energetic considerations only. Model predictions and simulation results are in excellent agreement, especially if we consider the simplicity of the model reported above. Not only is the agreement between the predicted and observed crystal types striking, but also the precision in the values of the interaction range at which polymorph transitions take place over the whole interaction range.
The immediate conclusion that can be drawn is that, for the reasonable well depth , entropy differences between polymorphs play a very subordinate role in the selection of a particular polymorph type. This is in agreement with the known small differences in entropy among crystals of monomeric spheres [47, 48, 49, 50, 51], and also with recent quantitative estimates of differences in chain conformational entropy among crystals of polymers of hard spheres [59, 66].
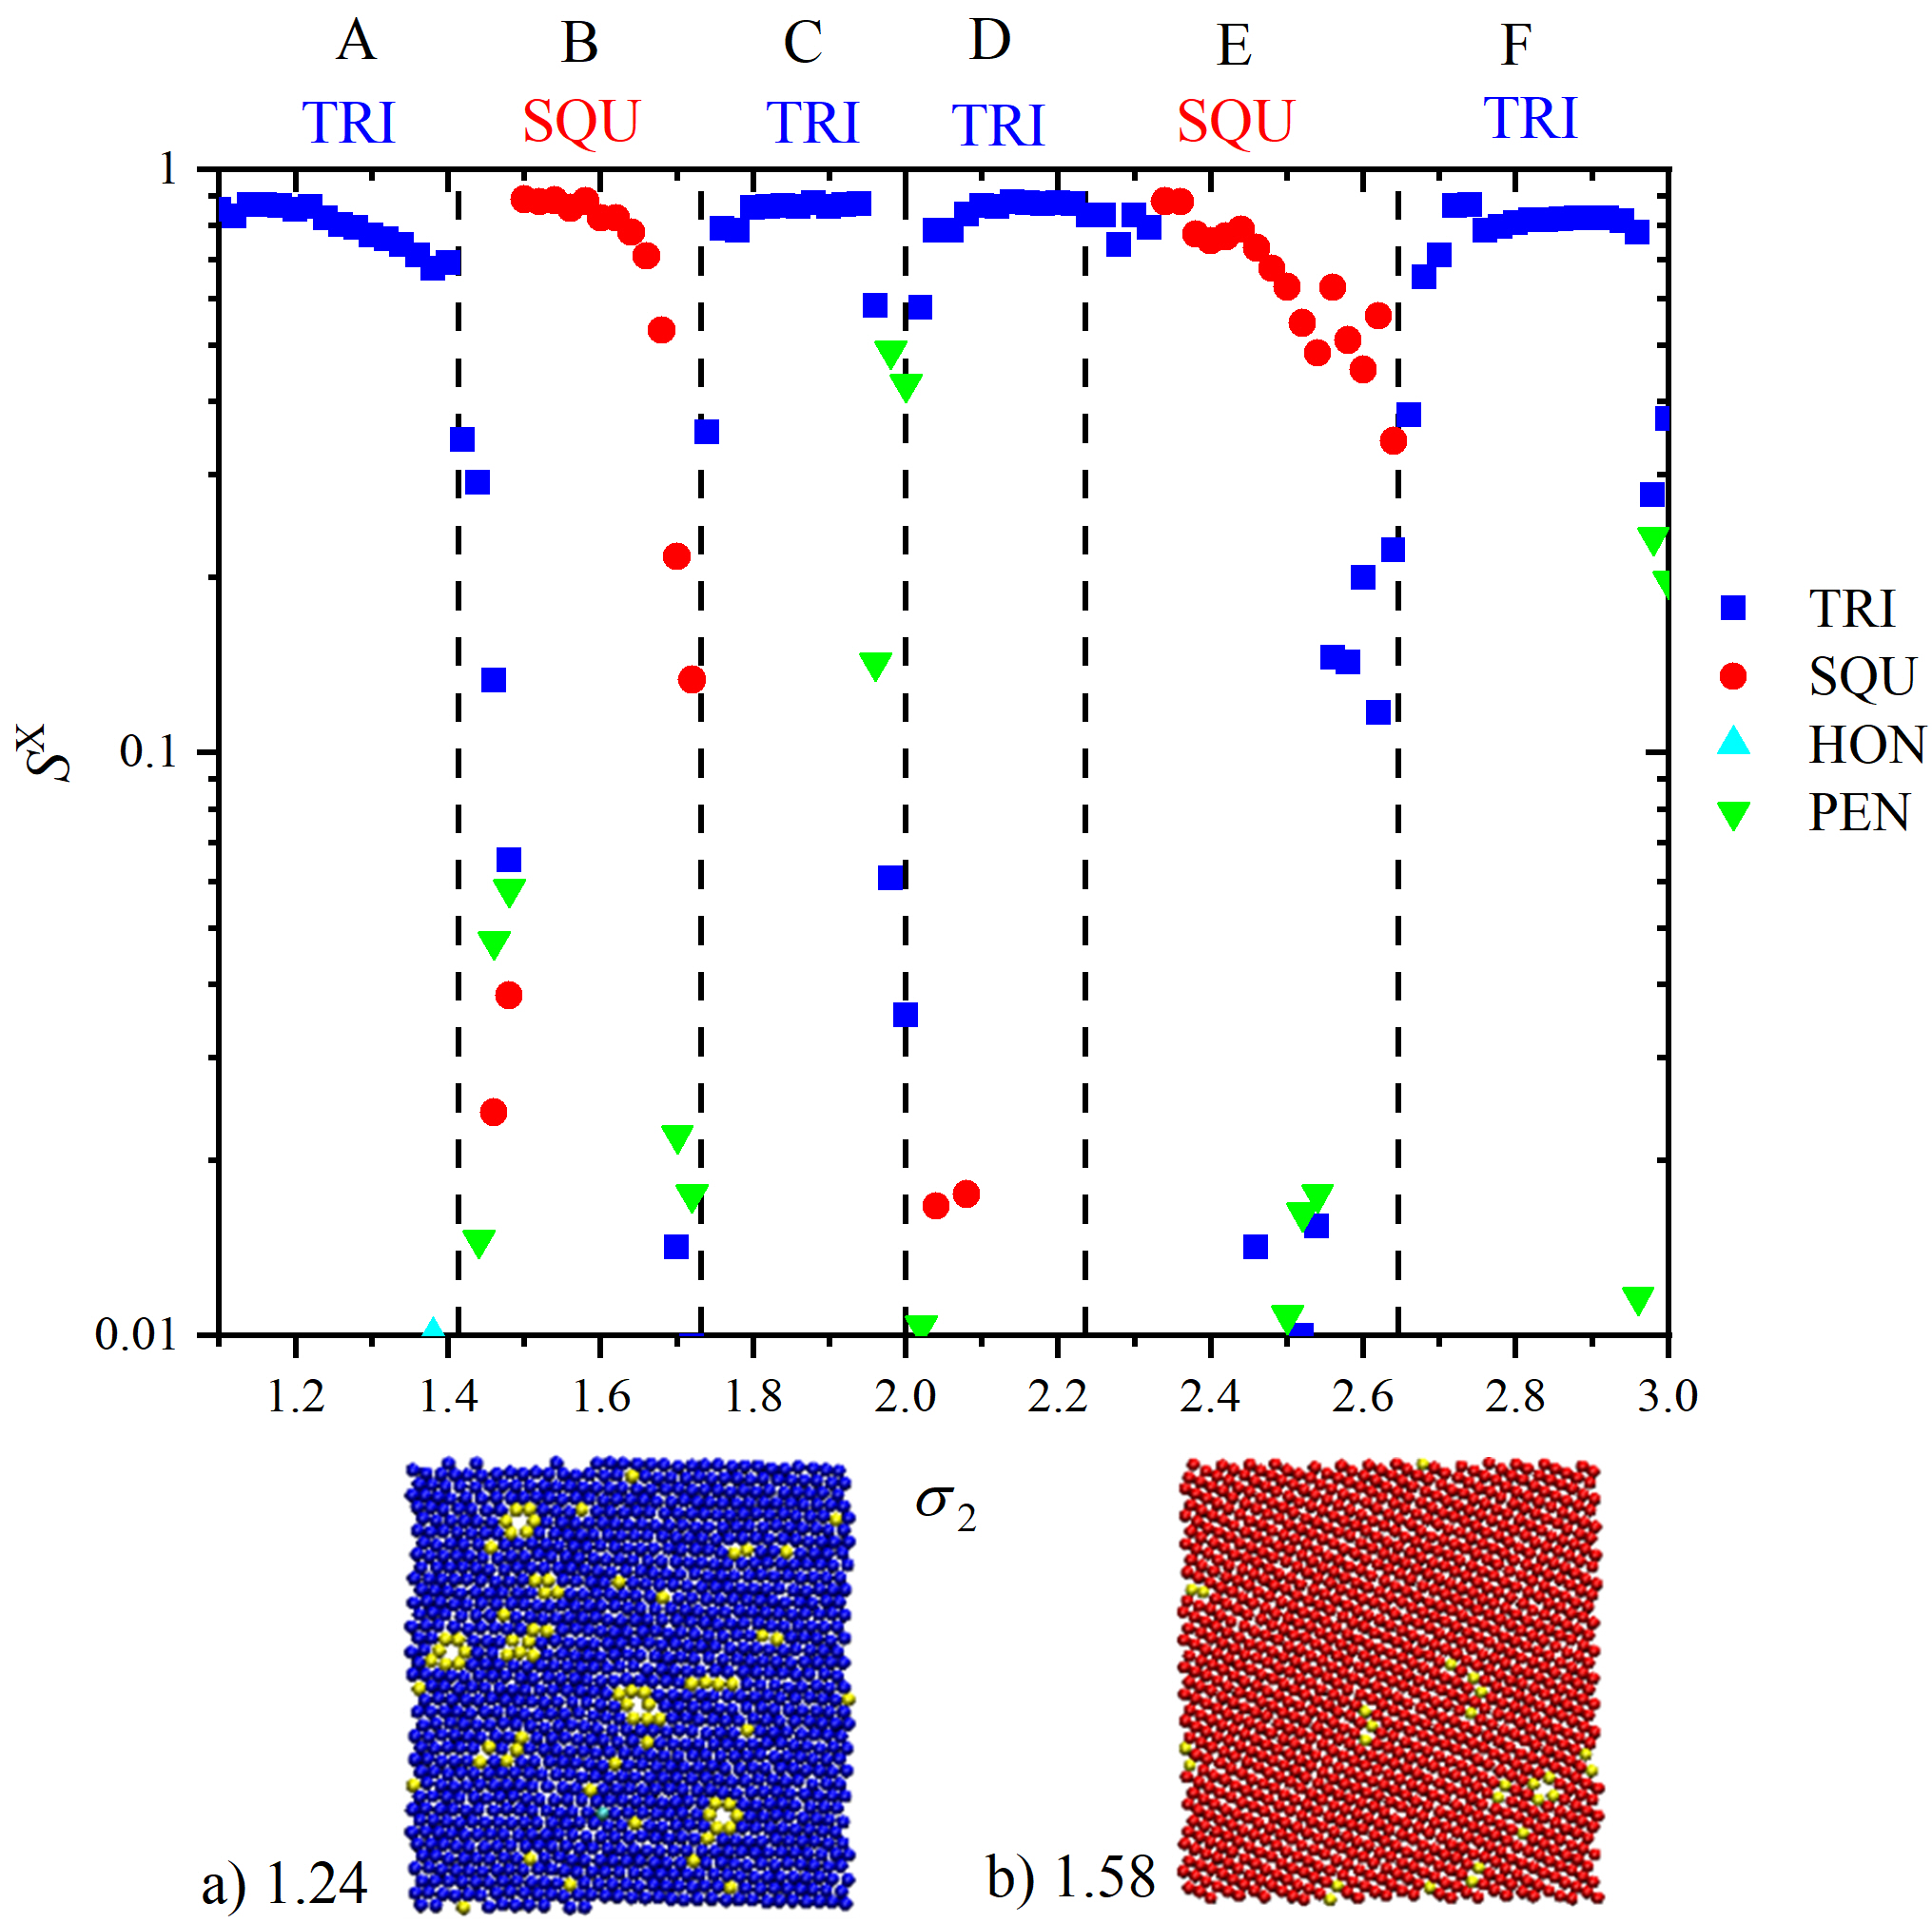
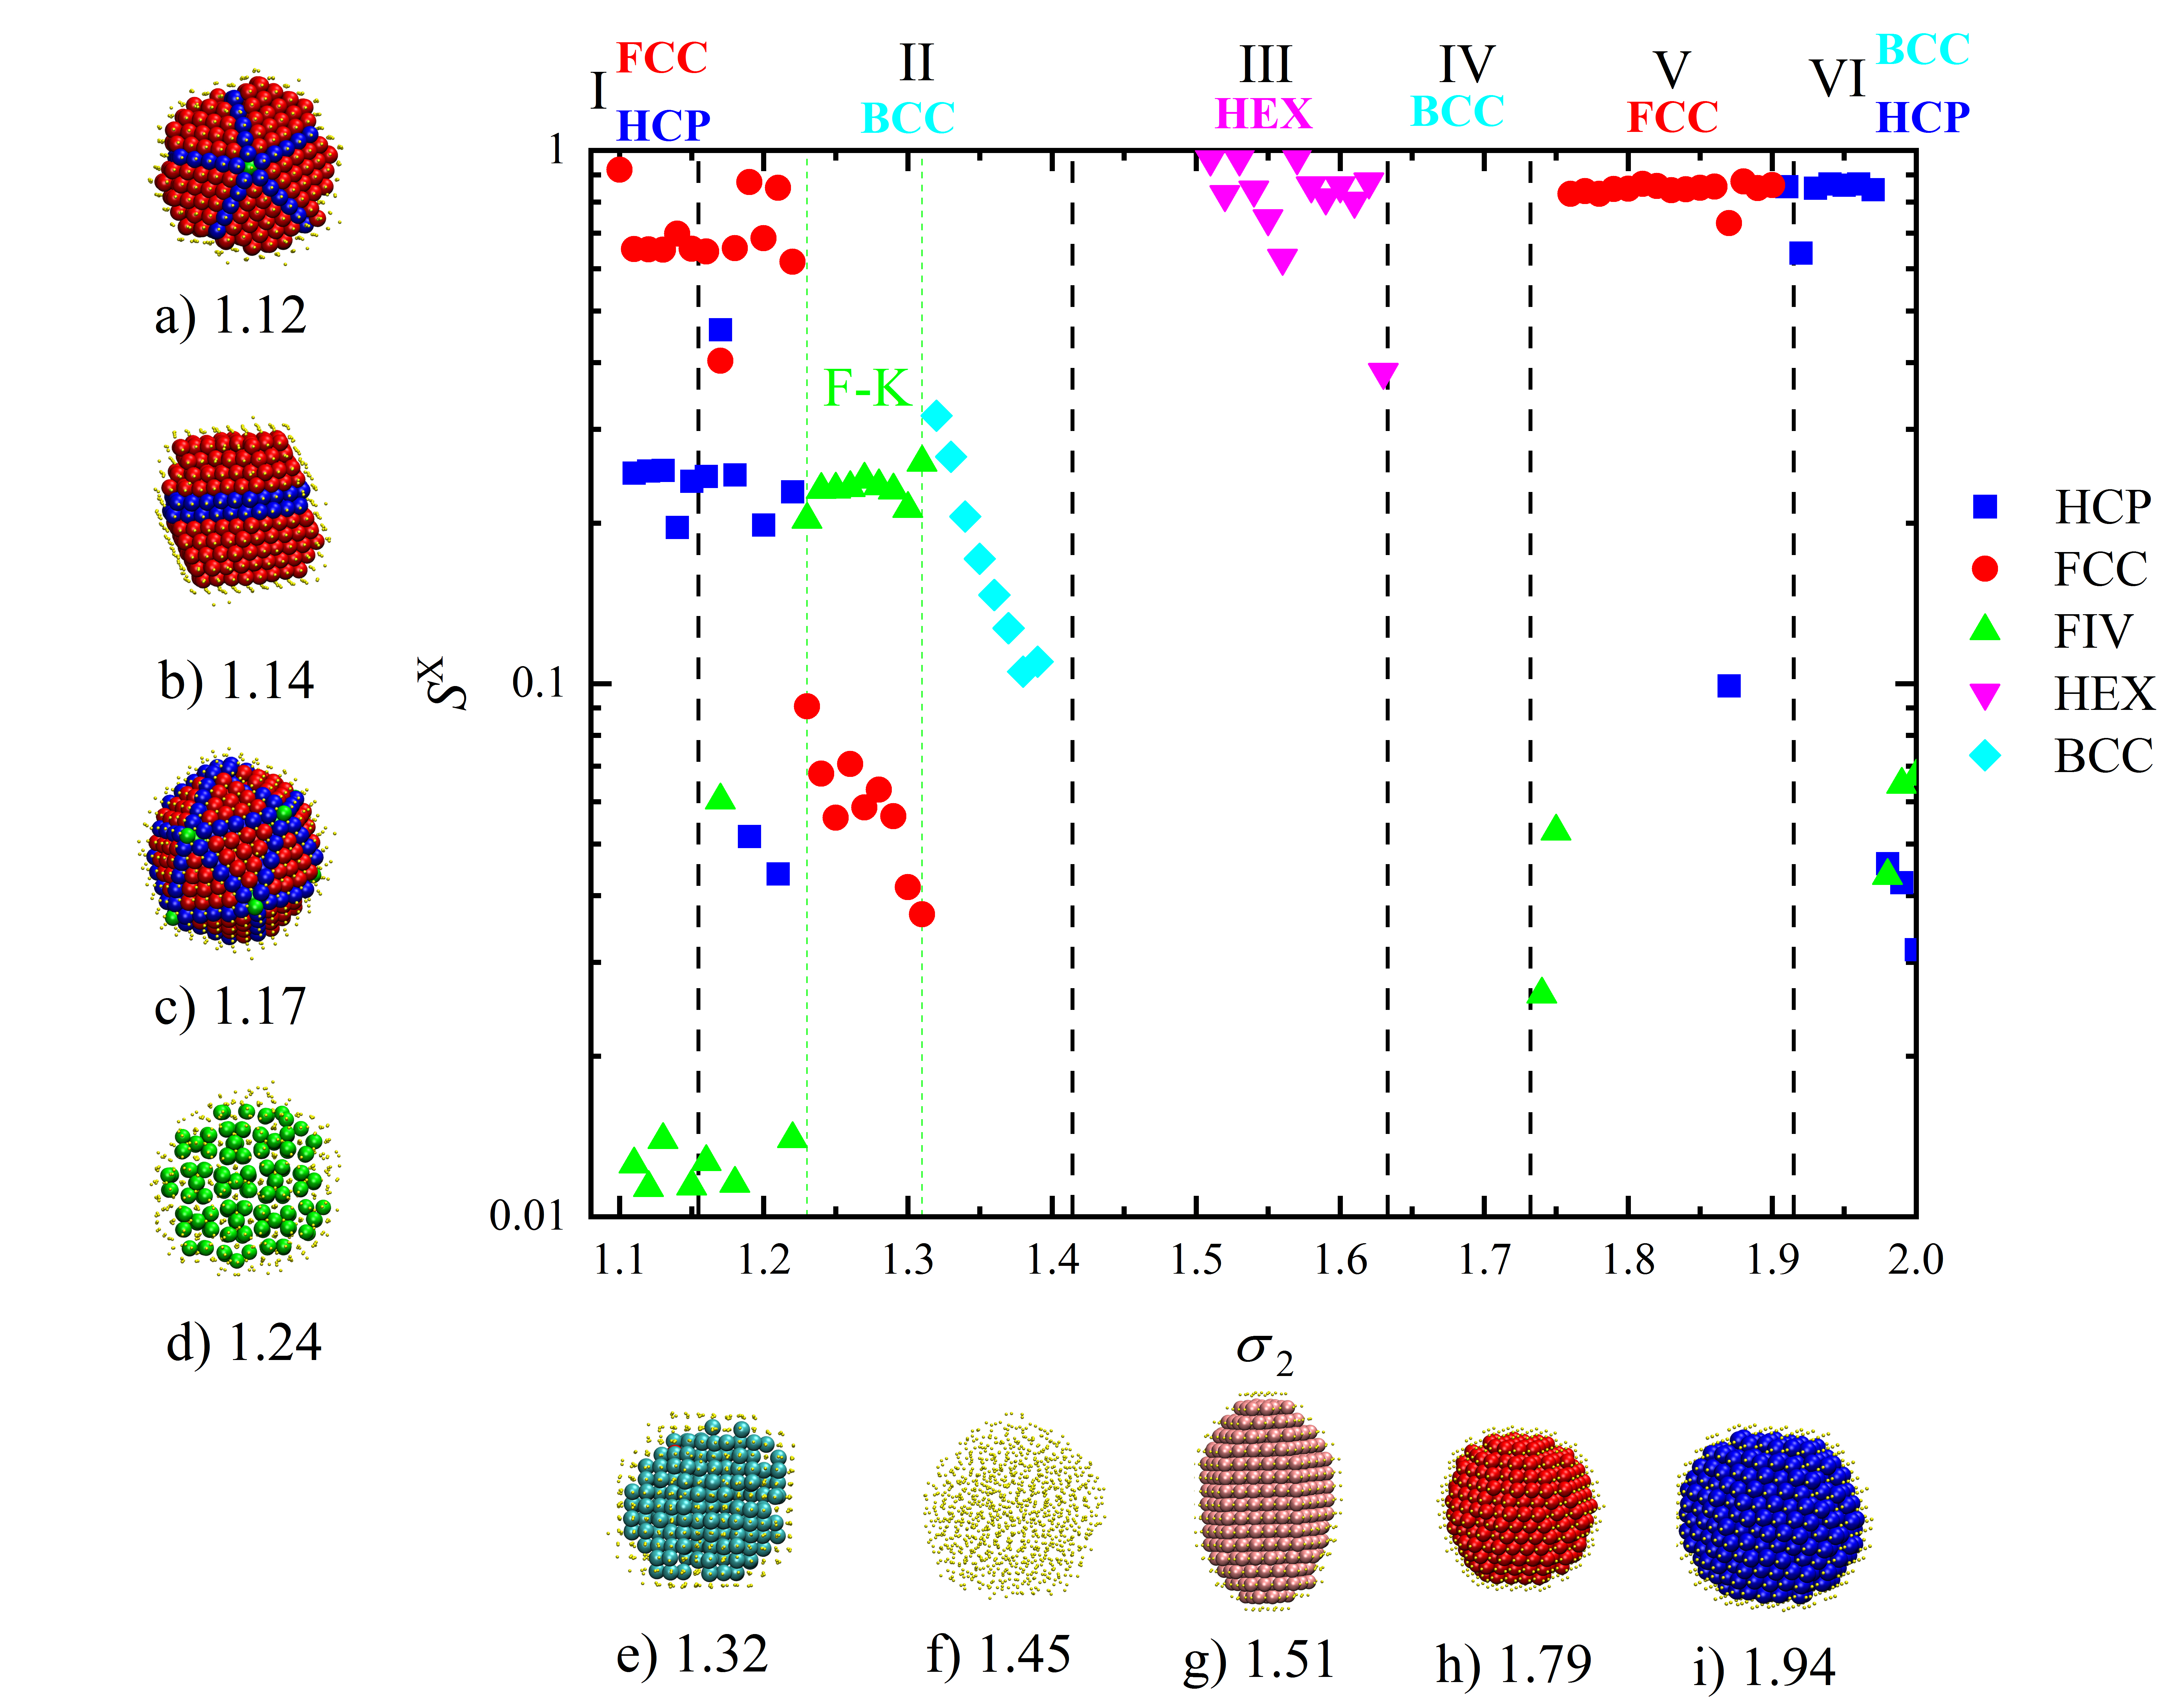
Fig. 5 presents a similar phase diagram for the 3D systems, along with the predictions of the neighbour model, while Fig. 6 hosts representative snapshots at the end of the MC simulations. At short interaction range (Region I) a random hexagonal close packed (rHCP) crystal is observed. The rHCP morphology can have a unique stacking direction of fivefold-free HCP and FCC layers, or multiple stacking directions where the meeting (composition) planes at the crystal boundaries are fivefold-ridden. As the number of neighbours is the same between HCP and FCC no pure crystal prevails and, thus, the rHCP polymorph remains the final ordered morphology in Region I. The rHCP dominance, as gauged by simulations, extends into higher values of than predicted by the neighbor model.
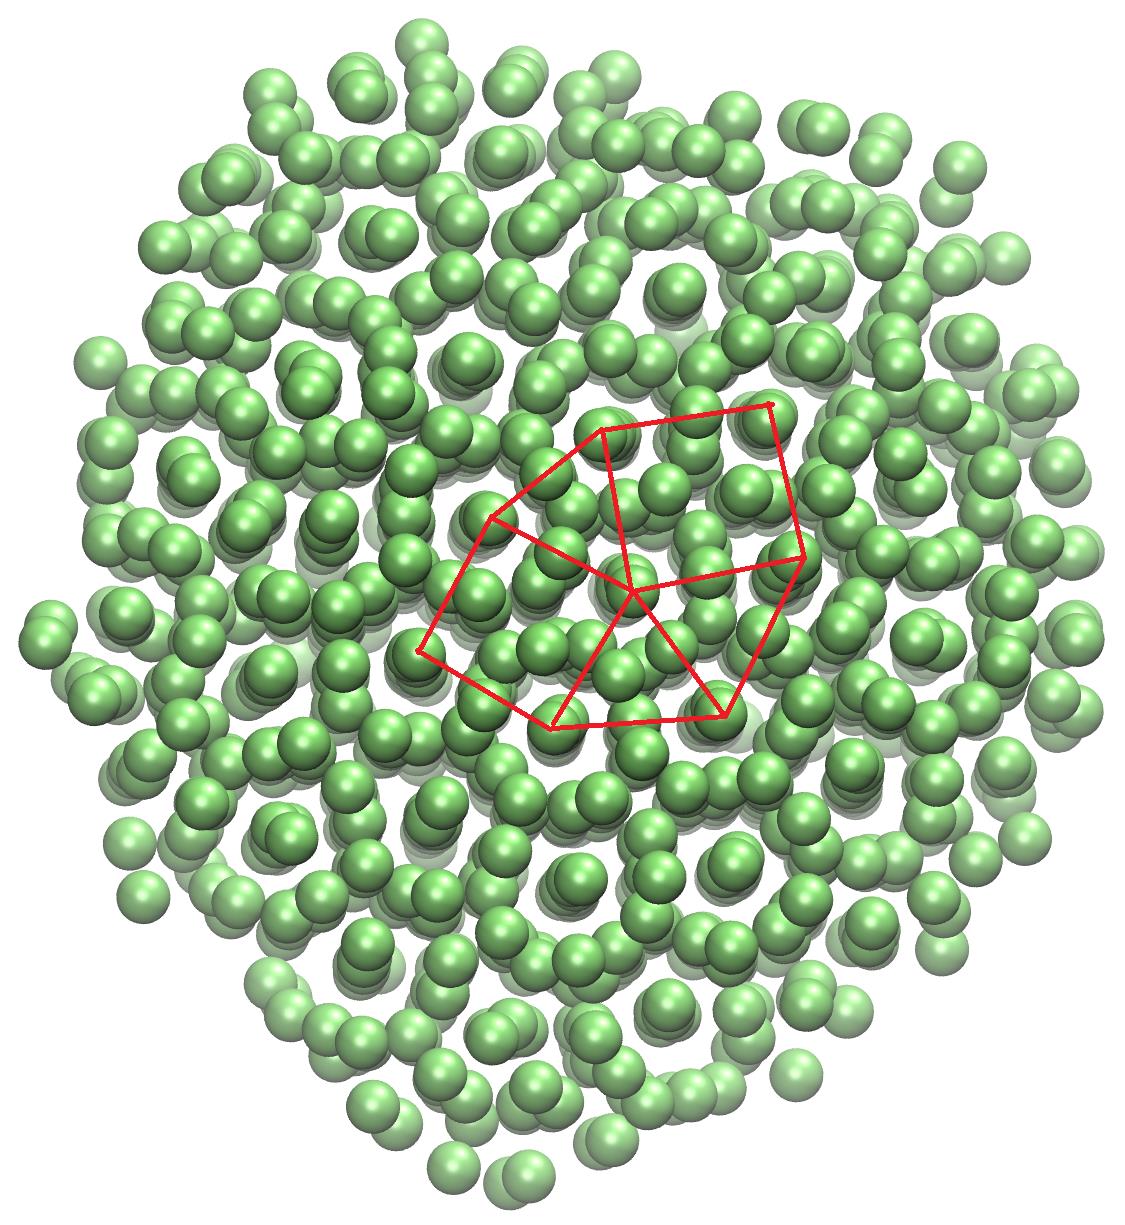
Interestingly, in the region between none of the crystals, expected by the geometric model, appears. The resulting structure is characterized by an abundance of fivefold sites and the absence of any appreciable population of sites with crystal similarity as captured by the CCE-norm descriptor. Close inspection of the established morphology, as hosted in Fig. 7, reveals that it corresponds to the variant of the Frank-Kasper (F-K) phase [68, 69]. In the past, F-K phases have been reported in studies of self organizing soft matter systems, including macromolecules, colloids, surfactants and liquid crystals [70, 71, 72, 73, 74, 75, 76, 77, 78, 79, 80]. Red lines in Fig. 7 connect triangles ‘3’ and squares ‘4’ in the tiling of the sparsely-populated layer of the F-K phase. The resulting tiling of is characteristic of the F-K phase.
The expected dominance of the imperfect BCC crystal sets in at higher values of , compared to the threshold predicted by the neighbour model. The transitions BCC (Region II) HEX (Region III) and HEX (Region III) BCC (Region IV) exist, as clearly captured by the data in Fig. 5. However, they are both accompanied by the presence of regions (called here “amorphous zones”, denoted in the phase diagram as ”AMO”) of glassy, disordered behavior where no crystal traces are detected. The nature and origin of the two AMO zones, along the phase diagram, which is otherwise rich in distinct crystal morphologies, are open topics under study.
The FCC and HCP prevalence and the value of at the transition match very well those expected from the number of neighbours in Regions V and VI. In fact, in Regions V and VI, we can observe the formation of perfect FCC and HCP crystals, in contrast to the behavior in Region I where the rHCP polymorph dominates. This trend can be explained rather trivially by the neighbour model: in Region I there is a tie in the number of neighbours (12) for the HCP and FCC crystals, and hence in internal energy. The tiny entropic difference between FCC and HCP [66] is not sufficient to make FCC dominant in the MC simulation. However, in Regions V and VI the FCC and HCP crystals dominate by a difference of 2 and 10 neighbours, respectively, and are thus the energetically favoured states. The high number of neighbours in these two regions (38 and 50 respectively) also imply that monomers reside in a much deeper potential energy well, so that entropy plays a very minor role in selecting the stable polymorph, and in blurring the boundaries between phases.
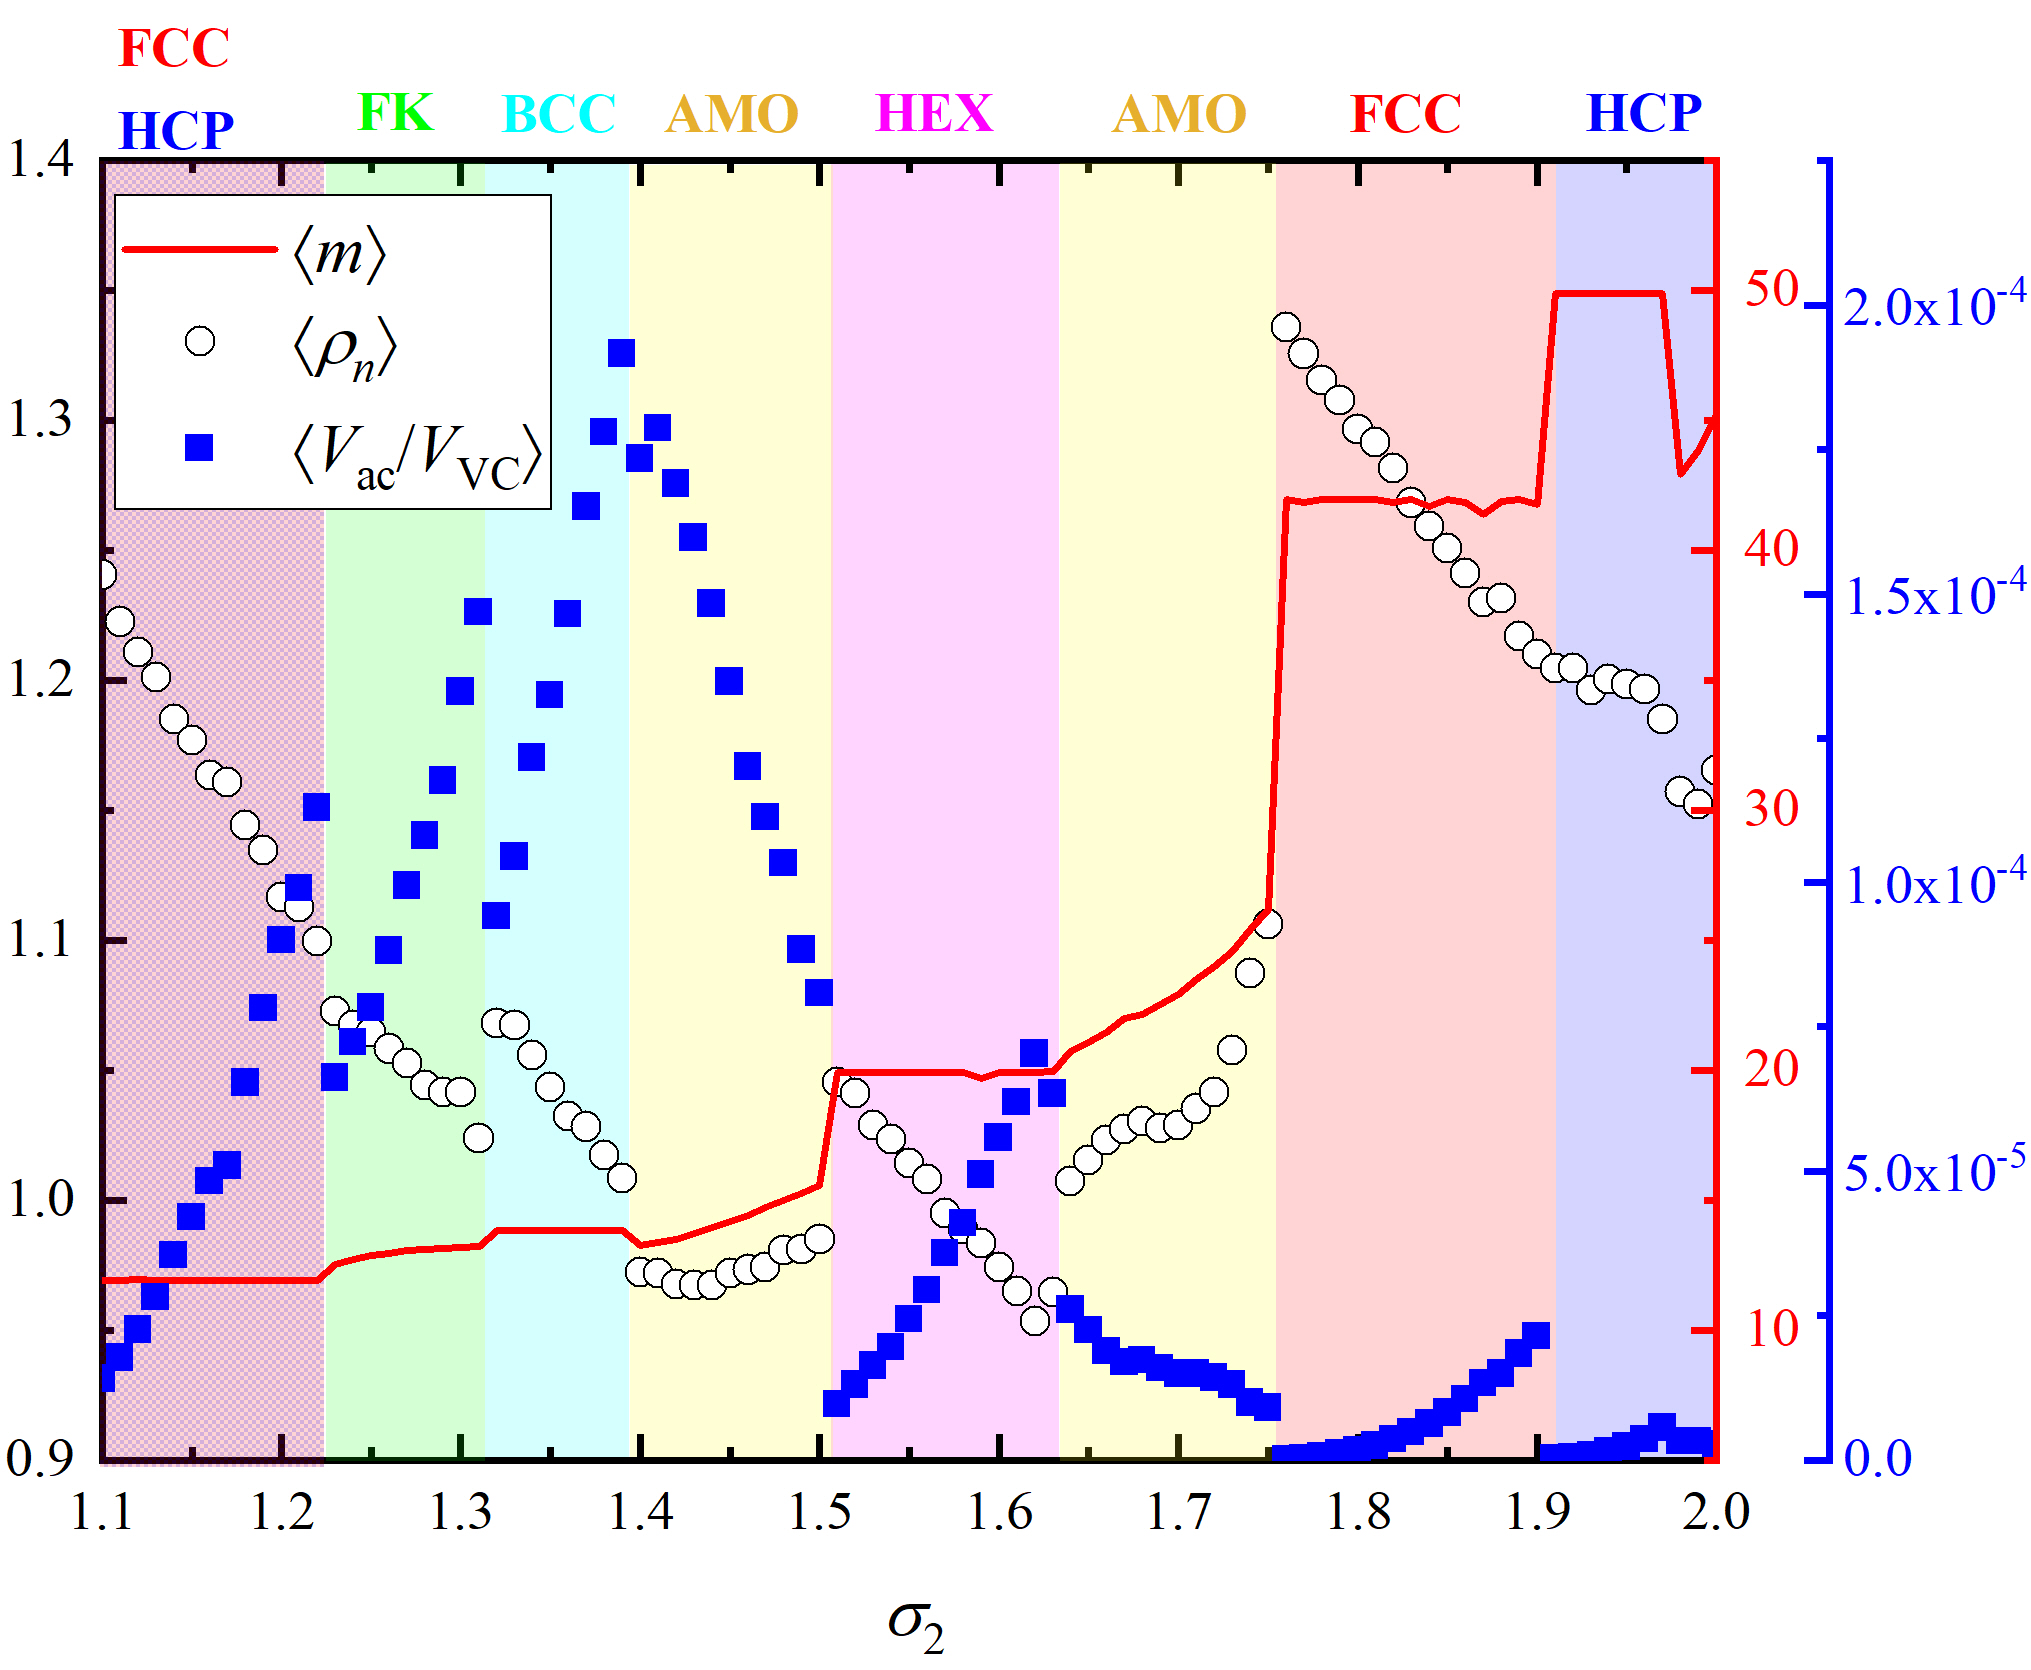
In the present study we let the crystal be self-assembled in almost vacuum conditions, so it can spontaneously adjust its density and structure by obeying the tangency condition, the orientational and radial symmetry and by minimizing its free energy, chiefly by maximizing the number of neighbours within a shell of size . The complex phase diagram is primarily a consequence of this maximization. In order to interpret these observations, we plot in Fig. 8 the local number density, , the number of neighbours, , and the ratio of the accessible volume by the volume of the Voronoi cell, , as a function of interaction range. The brackets denote here averaging over all monomers which have fully developed Voronoi environment, i.e. that do not lie on the surface of the cluster, and over all system configurations in the final stable part of the simulation trajectory. Local number density is calculated as the inverse of the Voronoi cell volume. The Voronoi tessellation, also a requirement for the crystallographic analysis, is done through the voro++ software [81]. The regions observed in the MC simulations are identified in Fig. 8 by the different colors and the corresponding labels. Well defined crystals are characterized by constant number of neighbours in particular ranges of , in excellent qualitative agreement with the model predictions in Fig. 5, and by negative slope in the density curve: within the domain of a given polymorph, the crystal expands as increases, while keeping the number of neighbours constant.
In the crystalline regions where the number of neighbours remains constant, the energy is also strictly constant due to the flatness of the square well potential. Therefore, in these regions minimization of free energy is tantamount to maximization of entropy, most of which is of translational origin [47, 48, 49, 50, 51] and, ignoring for simplicity the shape of the local environment, is proportional to the volume accessible to the monomers. In parallel, an expansion of the Voronoi cell is also taking place, driven by entropy. This expansion is reflected in a higher accessible volume (), which eventually increases the translational entropy of the monomers. The accessible volume can be estimated through MC integration, considering that is effectively the fraction of the Voronoi cell volume () where a spherical monomer can be placed without overlapping with the walls of the enclosing polyhedron. So long as the number of neighbours remains constant, the crystal expands with increasing primarily because of the increase in translational entropy of the chain monomers. Chain conformational entropy changes only very weakly with and is thus not the driving force for crystal expansion with . Fig. 8 shows clearly that the accessible volume increases in the crystal regions, while in the AMO zones, where amorphous behavior is observed, it tends to shrink.
Transitions between well defined crystals, for example the FCC HCP transition, are marked by a jump in the number of neighbours and a moderate change in the (still negative) density slope. The behavior changes drastically in the transition between well defined crystals and the “AMO zones” where disorder prevails. There, the amorphous cluster contracts and the number of neighbours increases in a smooth, rather than step-wise, pattern. This behavior is identical for both AMO zones, which surround the domain of HEX ordered morphologies. Negative density slopes are a rather straightforward consequence of entropic pressure: as long as the sites remain within the interaction range, increasing the cell volume leads to larger translational entropy. The expansion is then energetically neutral and entropically favorable, so that the crystal expands. As grows beyond specific limits, the number of neighbours and thus its stability increases through a transition to another polymorph, mostly driven by internal energy.
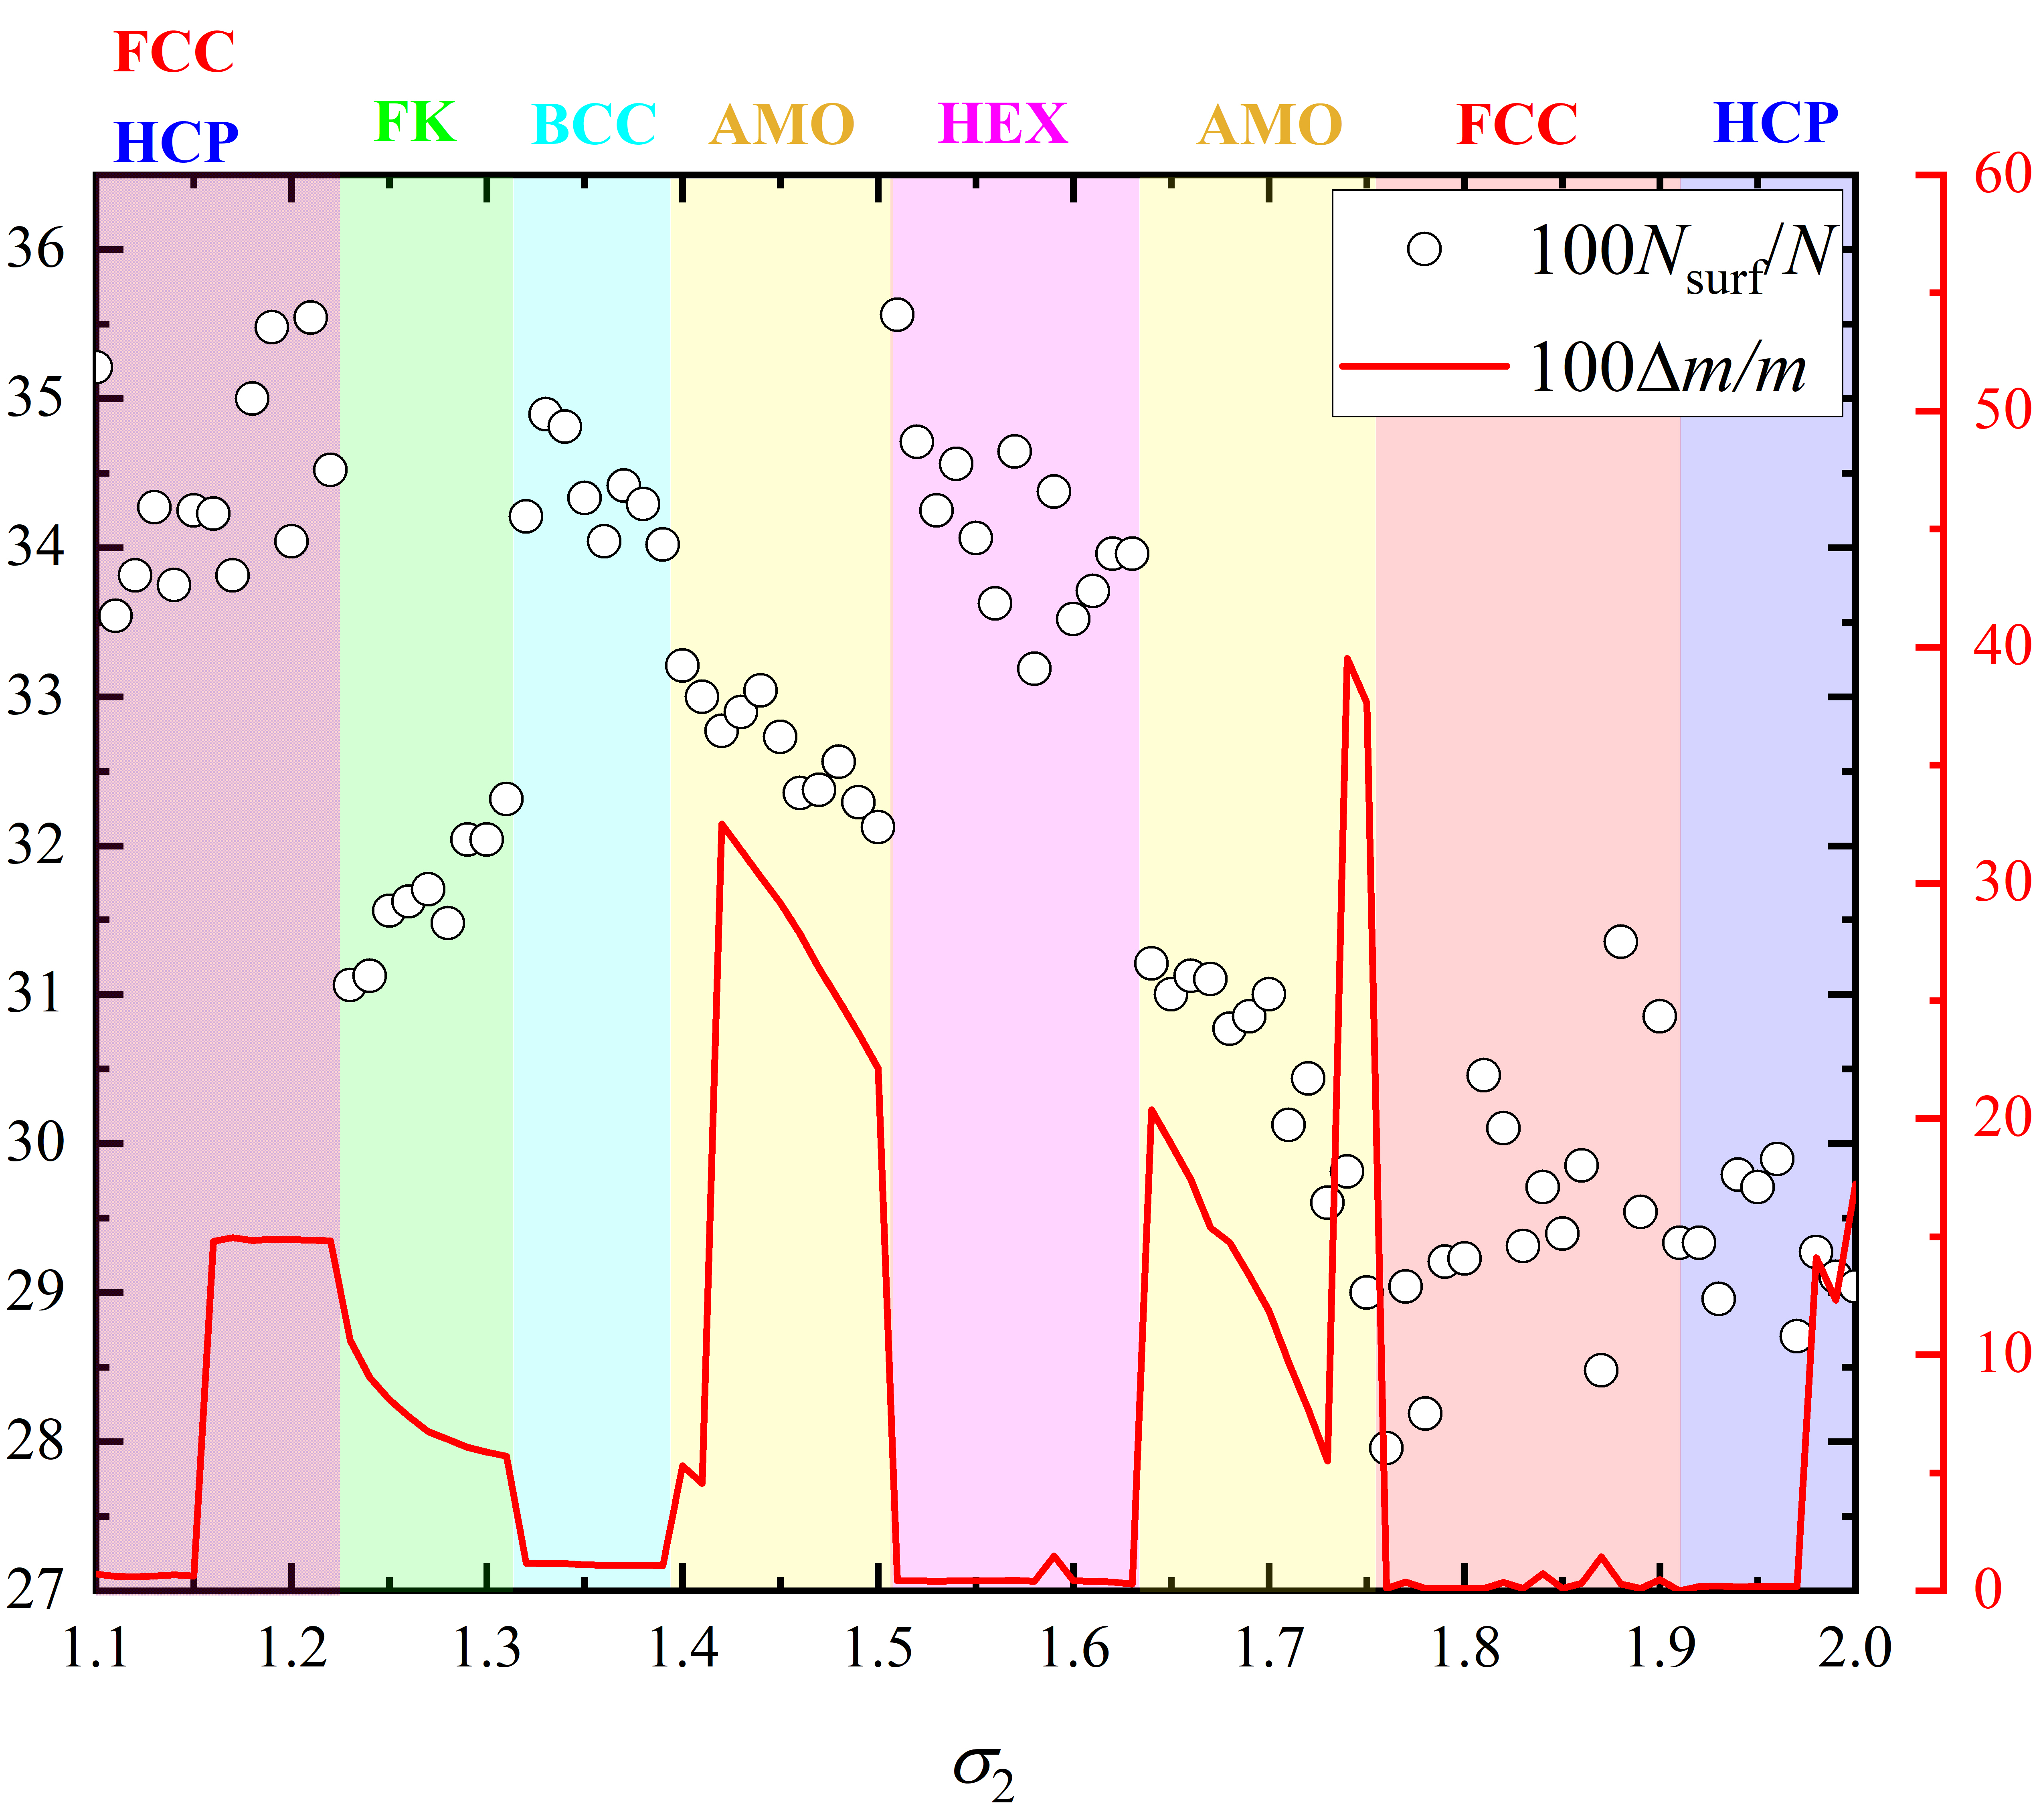
The left panel of Fig. 9 (scattered open symbols) shows the percentage of the monomers lying on the external surface of the formed cluster as a function of interaction range, . Quite small deviations occur within the whole range, with around two thirds of the sites having a fully developed Voronoi cell. Between the formed crystals the HEX one shows the highest surface to volume ratio. In general, the more compact and the more spherical the cluster the fewer the sites on the surface. Two distinct trends can be further observed: the number of surface atoms increases as a function of for the Frank-Kasper phase but decreases monotonically in the amorphous zones. The right panel of Fig. 9 (red solid line) shows the percentage difference of the number of neighbors, , on . is defined here as a the number of neighbors, as predicted by the proposed geometric model, minus the number of neighbors as calculated in the computer-generated system configurations including all snapshots in the equilibrated part of the MC trajectory. Very good to excellent agreement is observed in all regions where the crystal formed in the MC simulations coincides with the dominant one as predicted by the geometric model. Large deviations correspond to the two amorphous zones, an expected trend as these regions are bare of any crystal order. These are further accompanied by abrupt changes marking the AMO HEX and HEX AMO transitions. In the early regime a sharp discrepancy is observed as the expected BCC crystal, according to the model, is not encountered in the computer simulations which lead instead to rHCP morphologies of mixed FCC and HCP character. In parallel, the difference in the number of neighbors adopts the lowest values in the HEX- and FCC-dominated regions. It should be further noted that for the whole interaction range studied here no negative values in are observed. If such values existed it would mean that the MC simulations generate a stable crystal which is denser and thus different than the reference ones incorporated in the geometric neighbor model.
IV Conclusions
The Digital Alchemy proposed by Anders et al. [1] and recent important advances in the synthesis and characterization show how the use of building blocks of low dimensionality by controlling chain stiffness and molecular architecture [15, 17, 19, 20] can lead to the design of tailored colloidal polymers and molecules. The present work demonstrates, at a fundamental level and utilizing a highly idealized model, how fine tuning a single interaction parameter can be used to obtain a rich assortment of target crystal structures in bulk 3-D and ultra-thin 2-D systems of hard colloidal chains of attractive monomers. Towards this, first, we propose a simple geometric model, based on the cumulative number of neighbors, to predict the dominant crystal as a function of attraction range. Then, we embark on Monte Carlo simulations, using the square well potential to equilibrate and successively identify the computer-generated polymer clusters. The flatness of the square well potential makes it ideal to compare the computer-generated structures against the reference crystals predicted by the geometric model. By tuning the attraction range a wealth of well defined ordered structures is observed including hexagonal closed packed, face centered cubic, simple hexagonal and body centered cubic crystals in 3D and triangular and cubic crystals in 2D. The 3D ordered morphologies are further accompanied by Frank-Kasper phases of the variant. Interestingly enough the expected transitions between the HEX and BCC crystals are suppressed by the presence of amorphous zones where no traces of crystallization can be detected. Albeit its simplicity the proposed geometrical model, as demonstrated by the Monte Carlo simulations, is able to predict the dominant phases and the corresponding transitions with surprising accuracy, especially in 2D.
Current efforts focus on gauging the corresponding phase behavior of semi-flexible polymer chains under the same simulation conditions in the bulk (3D) and in extremely confined thin films (2D).
V Acknowledgements
M.H. deeply appreciates the kind hospitality of the COMSE group (NTUA, Athens, Greece) during his stay. Authors acknowledge support through projects PID2021-127533NB-I00 and RTI2018-097338-B-I00 of MICINN/FEDER (Ministerio de Ciencia e Innovación, Fondo Europeo de Desarrollo Regional). M.H. and D.M.F. acknowledge financial support through Programa Propio UPM Santander of Universidad Politécnica de Madrid (UPM) and Santander Bank. The authors gratefully acknowledge UPM for providing computing resources on the Magerit supercomputer through projects r553, r727, s341, t736 and u242.
References
- van Anders et al. [2015] G. van Anders, D. Klotsa, A. S. Karas, P. M. Dodd, and S. C. Glotzer, Digital alchemy for materials design: Colloids and beyond, Acs Nano 9, 9542 (2015).
- Li et al. [2021] B. Li, S. Zhang, J. S. Andre, and Z. Chen, Relaxation behavior of polymer thin films: Effects of free surface, buried interface, and geometrical confinement, Progress in Polymer Science 120, 10.1016/j.progpolymsci.2021.101431 (2021).
- Damasceno et al. [2012] P. F. Damasceno, M. Engel, and S. C. Glotzer, Predictive self-assembly of polyhedra into complex structures, Science 337, 453 (2012).
- Stillinger et al. [1964] F. H. Stillinger, R. L. Kornegay, and E. A. Dimarzio, Systematic approach to explanation of rigid disk phase transition, Journal of Chemical Physics 40, 1564 (1964).
- Hinrichsen et al. [1990] E. L. Hinrichsen, J. Feder, and T. Jossang, Random packing of disks in 2 dimensions, Physical Review A 41, 4199 (1990).
- Visscher and Bolsterl.M [1972] W. M. Visscher and Bolsterl.M, Random packing of equal and unequal spheres in 2 and 3 dimensions, Nature 239, 504 (1972).
- Meyer et al. [2010] S. Meyer, C. M. Song, Y. L. Jin, K. Wang, and H. A. Makse, Jamming in two-dimensional packings, Physica a-Statistical Mechanics and Its Applications 389, 5137 (2010).
- Gong et al. [2017] Z. Gong, T. Hueckel, G. R. Yi, and S. Sacanna, Patchy particles made by colloidal fusion, Nature 550, 234 (2017).
- Kennedy et al. [2022] C. L. Kennedy, D. Sayasilpi, P. Schall, and J. M. Meijer, Self-assembly of colloidal cube superstructures with critical casimir attractions, Journal of Physics-Condensed Matter 34, 10.1088/1361-648X/ac5866 (2022).
- Kuijk et al. [2011] A. Kuijk, A. van Blaaderen, and A. Imhof, Synthesis of monodisperse, rodlike silica colloids with tunable aspect ratio, Journal of the American Chemical Society 133, 2346 (2011).
- Sacanna et al. [2010] S. Sacanna, W. T. M. Irvine, P. M. Chaikin, and D. J. Pine, Lock and key colloids, Nature 464, 575 (2010).
- Sacanna et al. [2013] S. Sacanna, M. Korpics, K. Rodriguez, L. Colon-Melendez, S. H. Kim, D. J. Pine, and G. R. Yi, Shaping colloids for self-assembly, Nature Communications 4, 10.1038/ncomms2694 (2013).
- Xia et al. [2009] Y. N. Xia, Y. J. Xiong, B. Lim, and S. E. Skrabalak, Shape-controlled synthesis of metal nanocrystals: Simple chemistry meets complex physics?, Angewandte Chemie-International Edition 48, 60 (2009).
- Reiter and Sommer [2008] G. Reiter and J. Sommer, Polymer Crystallization: Obervations, Concepts and Interpretations (Springer Berlin Heidelberg, 2008).
- Fan and Walther [2022] X. L. Fan and A. Walther, 1d colloidal chains: recent progress from formation to emergent properties and applications, Chemical Society Reviews 51, 4023 (2022).
- Li et al. [2011] F. Li, D. P. Josephson, and A. Stein, Colloidal assembly: The road from particles to colloidal molecules and crystals, Angewandte Chemie-International Edition 50, 360 (2011).
- Chakraborty et al. [2022] I. Chakraborty, D. J. G. Pearce, R. W. Verweij, S. C. Matysik, L. Giomi, and D. J. Kraft, Self-assembly dynamics of reconfigurable colloidal molecules, Acs Nano 16, 2471 (2022).
- Huil et al. [2015] L. J. Huil, N. Pinna, K. Char, and J. Pyun, Colloidal polymers from inorganic nanoparticle monomers, Progress in Polymer Science 40, 85 (2015).
- Li et al. [2020] W. Y. Li, H. Palis, R. Merindol, J. Majimel, S. Ravaine, and E. Duguet, Colloidal molecules and patchy particles: complementary concepts, synthesis and self-assembly, Chemical Society Reviews 49, 1955 (2020).
- Martinez-Pedrero et al. [2021] F. Martinez-Pedrero, A. Gonzalez-Banciella, A. Camino, A. Mateos-Maroto, F. Ortega, R. G. Rubio, I. Pagonabarraga, and C. Calero, Static and dynamic self-assembly of pearl-like-chains of magnetic colloids confined at fluid interfaces, Small 17, 10.1002/smll.202101188 (2021).
- Stuij et al. [2019] S. Stuij, J. M. van Doorn, T. Kodger, J. Sprakel, C. Coulais, and P. Schall, Stochastic buckling of self-assembled colloidal structures, Physical Review Research 1, 10.1103/PhysRevResearch.1.023033 (2019).
- Verweij et al. [2020] R. W. Verweij, P. G. Moerman, N. E. G. Ligthart, L. P. P. Huijnen, J. Groenewold, W. K. Kegel, A. van Blaaderen, and D. J. Kraft, Flexibility-induced effects in the brownian motion of colloidal trimers, Physical Review Research 2, 10.1103/PhysRevResearch.2.033136 (2020).
- Vutukuri et al. [2012] H. R. Vutukuri, A. F. Demirors, B. Peng, P. D. J. van Oostrum, A. Imhof, and A. van Blaaderen, Colloidal analogues of charged and uncharged polymer chains with tunable stiffness, Angewandte Chemie-International Edition 51, 11249 (2012).
- Dietz and Hoy [2020] J. D. Dietz and R. S. Hoy, Two-stage athermal solidification of semiflexible polymers and fibers, Soft Matter 16, 6206 (2020).
- Mahynski et al. [2015] N. A. Mahynski, S. K. Kumar, and A. Z. Panagiotopoulos, Relative stability of the fcc and hcp polymorphs with interacting polymers, Soft Matter 11, 280 (2015).
- Mahynski et al. [2014] N. A. Mahynski, A. Z. Panagiotopoulos, D. Meng, and S. K. Kumar, Stabilizing colloidal crystals by leveraging void distributions, Nature Communications 5, 10.1038/ncomms5472 (2014).
- Shakirov [2019] T. Shakirov, Crystallisation in melts of short, semi-flexible hard-sphere polymer chains: The role of the non-bonded interaction range, Entropy 21, 10.3390/e21090856 (2019).
- Verweij et al. [2021] R. W. Verweij, P. G. Moerman, L. P. P. Huijnen, N. E. G. Ligthart, I. Chakraborty, J. Groenewold, W. K. Kegel, A. van Blaaderen, and D. J. Kraft, Conformations and diffusion of flexibly linked colloidal chains, Journal of Physics-Materials 4, 10.1088/2515-7639/abf571 (2021).
- Karayiannis et al. [2015] N. C. Karayiannis, K. Foteinopoulou, and M. Laso, The role of bond tangency and bond gap in hard sphere crystallization of chains, Soft Matter 11, 1688 (2015).
- Ni and Dijkstra [2013] R. Ni and M. Dijkstra, Effect of bond length fluctuations on crystal nucleation of hard bead chains, Soft Matter 9, 365 (2013).
- Young and Alder [1979] D. A. Young and B. J. Alder, Studies in molecular-dynamics .17. phase-diagrams for step potentials in 2 and 3 dimensions, Journal of Chemical Physics 70, 473 (1979).
- Young and Alder [1980] D. A. Young and B. J. Alder, Studies in molecular-dynamics .18. the square-well phase-diagram, Journal of Chemical Physics 73, 2430 (1980).
- Armas-Pérez et al. [2014] J. C. Armas-Pérez, J. Quintana-H, G. A. Chapela, E. Velasco, and G. Navascués, Phase diagram of a square-well model in two dimensions, The Journal of Chemical Physics 140, 064503 (2014).
- Attwood and Hall [2003] B. C. Attwood and C. K. Hall, Global phase diagram for monomer/dimer mixtures, Fluid Phase Equilibria 204, 85 (2003).
- Babu et al. [2009] S. Babu, J. C. Gimel, and T. Nicolai, Crystallization and dynamical arrest of attractive hard spheres, Journal of Chemical Physics 130, 10.1063/1.3074310 (2009).
- Haxton et al. [2015] T. K. Haxton, L. O. Hedges, and S. Whitelam, Crystallization and arrest mechanisms of model colloids, Soft Matter 11, 9307 (2015).
- Prabhu et al. [2014] A. Prabhu, S. B. Babu, J. S. Dolado, and J. C. Gimel, Brownian cluster dynamics with short range patchy interactions: Its application to polymers and step-growth polymerization, Journal of Chemical Physics 141, 16 (2014).
- Rżysko et al. [2010] W. Rżysko, A. Patrykiejew, S. Sokołowski, and O. Pizio, Phase behavior of a two-dimensional and confined in slitlike pores square-shoulder, square-well fluid, The Journal of Chemical Physics 132, 164702 (2010).
- Serrano-Illán et al. [2006] J. Serrano-Illán, G. Navascués, and E. Velasco, Noncompact crystalline solids in the square-well potential, Phys Rev E Stat Nonlin Soft Matter Phys 73, 011110 (2006).
- Sevick and Monson [1991] E. M. Sevick and P. A. Monson, Cluster integrals for square-well particles - application to percolation, Journal of Chemical Physics 94, 3070 (1991).
- Takada and Hayakawa [2018] S. Takada and H. Hayakawa, Rheology of dilute cohesive granular gases, Physical Review E 97, 10.1103/PhysRevE.97.042902 (2018).
- Schnabel et al. [2009a] S. Schnabel, M. Bachmann, and W. Janke, Elastic lennard-jones polymers meet clusters: Differences and similarities, Journal of Chemical Physics 131, 10.1063/1.3223720 (2009a).
- Schnabel et al. [2011] S. Schnabel, W. Janke, and M. Bachmann, Advanced multicanonical monte carlo methods for efficient simulations of nucleation processes of polymers, Journal of Computational Physics 230, 4454 (2011).
- Schnabel et al. [2009b] S. Schnabel, T. Vogel, M. Bachmann, and W. Janke, Surface effects in the crystallization process of elastic flexible polymers, Chemical Physics Letters 476, 201 (2009b).
- Taylor et al. [2009] M. P. Taylor, W. Paul, and K. Binder, Phase transitions of a single polymer chain: A wang–landau simulation study, The Journal of Chemical Physics 131, 114907 (2009).
- Zierenberg et al. [2016] J. Zierenberg, M. Marenz, and W. Janke, Dilute semiflexible polymers with attraction: Collapse, folding and aggregation, Polymers 8, 10.3390/polym8090333 (2016).
- Woodcock [1997] L. V. Woodcock, Entropy difference between the face-centred cubic and hexagonal close-packed crystal structures, Nature 385, 141 (1997).
- Polson et al. [2000] J. M. Polson, E. Trizac, S. Pronk, and D. Frenkel, Finite-size corrections to the free energies of crystalline solids, Journal of Chemical Physics 112, 5339 (2000).
- Bolhuis et al. [1997] P. G. Bolhuis, D. Frenkel, S. C. Mau, and D. A. Huse, Entropy difference between crystal phases, Nature 388, 235 (1997).
- Mau and Huse [1999] S. C. Mau and D. A. Huse, Stacking entropy of hard-sphere crystals, Physical Review E 59, 4396 (1999).
- Noya and Almarza [2015] E. G. Noya and N. G. Almarza, Entropy of hard spheres in the close-packing limit, Molecular Physics 113, 1061 (2015).
- Ramos et al. [2020] P. M. Ramos, M. Herranz, K. Foteinopoulou, N. C. Karayiannis, and M. Laso, Identification of local structure in 2-d and 3-d atomic systems through crystallographic analysis, Crystals 10, 10.3390/cryst10111008 (2020).
- Herranz et al. [2021] M. Herranz, D. Martínez-Fernández, P. M. Ramos, K. Foteinopoulou, N. C. Karayiannis, and M. Laso, Simu-d: A simulator-descriptor suite for polymer-based systems under extreme conditions, International Journal of Molecular Sciences 22, 12464 (2021).
- Karayiannis et al. [2002] N. C. Karayiannis, V. G. Mavrantzas, and D. N. Theodorou, A novel monte carlo scheme for the rapid equilibration of atomistic model polymer systems of precisely defined molecular architecture, Physical Review Letters 88, 10.1103/PhysRevLett.88.105503 (2002).
- Karayiannis and Laso [2008] N. C. Karayiannis and M. Laso, Monte carlo scheme for generation and relaxation of dense and nearly jammed random structures of freely jointed hard-sphere chains, Macromolecules 41, 1537 (2008).
- Ramos et al. [2018] P. M. Ramos, N. C. Karayiannis, and M. Laso, Off-lattice simulation algorithms for athermal chain molecules under extreme confinement, Journal of Computational Physics 375, 918 (2018).
- Herranz et al. [2020] M. Herranz, M. Santiago, K. Foteinopoulou, N. C. Karayiannis, and M. Laso, Crystal, fivefold and glass formation in clusters of polymers interacting with the square well potential, Polymers 12, 10.3390/polym12051111 (2020).
- Ramos et al. [2021] P. M. Ramos, M. Herranz, K. Foteinopoulou, N. C. Karayiannis, and M. Laso, Entropy-driven heterogeneous crystallization of hard-sphere chains under unidimensional confinement, Polymers 13, 10.3390/polym13091352 (2021).
- Herranz et al. [2022] M. Herranz, K. Foteinopoulou, N. C. Karayiannis, and M. Laso, Polymorphism and perfection in crystallization of hard sphere polymers, Polymers 14, 10.3390/polym14204435 (2022).
- Martinez-Fernandez et al. [2023] D. Martinez-Fernandez, M. Herranz, K. Foteinopoulou, N. C. Karayiannis, and M. Laso, Local and global order in dense packings of semi-flexible polymers of hard spheres, Polymers 15, 10.3390/polym15030551 (2023).
- Ester et al. [1996] M. Ester, H.-P. Kriegel, J. Sander, and X. Xu, A density-based algorithm for discovering clusters in large spatial databases with noise., in KDD, edited by E. Simoudis, J. Han, and U. M. Fayyad (AAAI Press, 1996) pp. 226–231.
- Schubert et al. [2017] E. Schubert, J. Sander, M. Ester, H. P. Kriegel, and X. W. Xu, Dbscan revisited, revisited: Why and how you should (still) use dbscan, Acm Transactions on Database Systems 42, 10.1145/3068335 (2017).
- Pedrosa et al. [2023] P. Pedrosa, D. Martinez-Fernandez, M. Herranz, K. Foteinopoulou, N. C. Karayiannis, and M. Laso, Densest packing of flexible polymers in 2-d films, Journal of Chemical Physics 158, 10.1063/5.0137115 (2023).
- Karayiannis et al. [2009] N. C. Karayiannis, K. Foteinopoulou, and M. Laso, The characteristic crystallographic element norm: A descriptor of local structure in atomistic and particulate systems, Journal of Chemical Physics 130, 10.1063/1.3077294 (2009).
- Humphrey et al. [1996] W. Humphrey, A. Dalke, and K. Schulten, Vmd: Visual molecular dynamics, Journal of Molecular Graphics & Modelling 14, 33 (1996).
- Herranz et al. [2023] M. Herranz, J. Benito, K. Foteinopoulou, N. C. Karayiannis, and M. Laso, Polymorph stability and free energy of crystallization of freely-jointed polymers of hard spheres, Polymers 15, 10.3390/polym15061335 (2023).
- [67] See supplemental material at https://journals.aps.org/.
- Frank and Kasper [1958] F. C. Frank and J. S. Kasper, Complex alloy structures regarded as sphere packings .1. definitions and basic principles, Acta Crystallographica 11, 184 (1958).
- Frank and Kasper [1959] F. C. Frank and J. S. Kasper, Complex alloy structures regarded as sphere packing .2. analysis and classification of representative structures, Acta Crystallographica 12, 483 (1959).
- Huang et al. [2018] M. J. Huang, K. Yue, J. Wang, C. H. Hsu, L. G. Wang, and S. Z. D. Cheng, Frank-kasper and related quasicrystal spherical phases in macromolecules, Science China-Chemistry 61, 33 (2018).
- Ungar and Zeng [2005] G. Ungar and X. B. Zeng, Frank-kasper, quasicrystalline and related phases in liquid crystals, Soft Matter 1, 95 (2005).
- Huang et al. [2015] M. J. Huang, C. H. Hsu, J. Wang, S. Mei, X. H. Dong, Y. W. Li, M. X. Li, H. Liu, W. Zhang, T. Z. Aida, W. B. Zhang, K. Yue, and S. Z. D. Cheng, Selective assemblies of giant tetrahedra via precisely controlled positional interactions, Science 348, 424 (2015).
- Chang and Bates [2020] A. B. Chang and F. S. Bates, Impact of architectural asymmetry on frank-kasper phase formation in block polymer melts, Acs Nano 14, 11463 (2020).
- Su et al. [2020] Z. B. Su, R. M. Zhang, X. Y. Yan, Q. Y. Guo, J. H. Huang, W. P. Shan, Y. C. Liu, T. Liu, M. J. Huang, and S. Z. D. Cheng, The role of architectural engineering in macromolecular self-assemblies via non-covalent interactions: A molecular lego approach, Progress in Polymer Science 103, 10.1016/j.progpolymsci.2020.101230 (2020).
- Han and Che [2013] L. Han and S. N. Che, Anionic surfactant templated mesoporous silicas (amss), Chemical Society Reviews 42, 3740 (2013).
- Hudson et al. [1997] S. D. Hudson, H. T. Jung, V. Percec, W. D. Cho, G. Johansson, G. Ungar, and V. S. K. Balagurusamy, Direct visualization of individual cylindrical and spherical supramolecular dendrimers, Science 278, 449 (1997).
- Shevchenko et al. [2006] E. V. Shevchenko, D. V. Talapin, N. A. Kotov, S. O’Brien, and C. B. Murray, Structural diversity in binary nanoparticle superlattices, Nature 439, 55 (2006).
- Takagi and Yamamoto [2019] H. Takagi and K. Yamamoto, Phase boundary of frank-kasper sigma phase in phase diagrams of binary mixtures of block copolymers and homopolymers, Macromolecules 52, 2007 (2019).
- Chen et al. [2022] M. Z. Chen, Y. T. Huang, C. Y. Chen, and H. L. Chen, Accessing the frank-kasper sigma phase of block copolymer with small conformational asymmetry via selective solvent solubilization in the micellar corona, Macromolecules 55, 10812 (2022).
- Lindquist et al. [2018] B. A. Lindquist, R. B. Jadrich, W. D. Pineros, and T. M. Truskett, Inverse design of self-assembling frank-kasper phases and insights into emergent quasicrystals, Journal of Physical Chemistry B 122, 5547 (2018).
- Rycroft [2009] C. H. Rycroft, Voro++: A three-dimensional voronoi cell library in c++, Chaos: An Interdisciplinary Journal of Nonlinear Science 19, 041111 (2009).