The Increasingly Strange Polarimetric Behavior of the Barbarian Asteroids
Abstract
Polarization phase-curve measurements provide a unique constraint on the surface properties of asteroids that are complementary to those from photometry and spectroscopy, and have led to the identification of the “Barbarian” asteroids as a class of objects with highly unusual surfaces. We present new near-infrared polarimetric observations of six Barbarian asteroids obtained with the WIRC+Pol instrument on the Palomar Hale telescope. We find a dramatic change in polarimetric behavior from visible to near-infrared for these objects, including a change in the polarimetric inversion angle that is tied to the index of refraction of the surface material. Our observations support a two-phase surface composition consisting of high albedo, high index of refraction inclusions with a small optical size scale embedded in a dark matrix material more closely related to C-complex asteroids. These results are consistent with the interpretation that the Barbarians are remnants of a population of primitive bodies that formed shortly after CAIs. Near-infrared polarimetry provides a direct test of the constituent grains of asteroid surfaces.
1 Introduction
Polarimetric observations offer us a unique way of probing the physical properties of the regolith of asteroids in our Solar system. These observations complement results obtained via spectroscopy and photometric modeling, providing an independent constraint on the albedo, particle size, and index of refraction of the surface materials. Asteroid polarimetric properties are generally closely linked with the taxonomic classification from spectral measurements, allowing for a common interpretation of the measured properties. Recent reviews of asteroid polarimetry by Belskaya et al. (2015), Cellino et al. (2015), and Bagnulo et al. (2017) highlight the current state of knowledge and the outstanding questions in the field.
The measured percent polarization for an asteroid is a function of the observational phase angle (the angle between the Sun and the telescope as seen by the asteroid). The percent polarization is defined with respect to the Sun-asteroid-Earth scattering plane, with positive values being assigned to polarization perpendicular to the plane and negative values to polarization in the scattering plane. Scattered light follows a general trend of being unpolarized at , reaching negative values between and (depending upon the surface albedo) at phase angles below , recovering to at the inversion angle and increasing to a maximum polarization at . This maximum polarization value, however, is not observable for asteroids that are distant from the Sun, such as those in the Main Belt, due to the restrictions of orbital geometry; Main Belt asteroids typically can only be observed out to phases of .
One of the most intriguing results to come out of surveys of asteroid polarization at visible wavelengths was the discovery of objects with very large inversion angles. The first was identified by Cellino et al. (2006), with other members of the Ld-class spectroscopic taxonomy soon after being found to have similar behavior (e.g. Gil-Hutton et al., 2008; Masiero & Cellino, 2009a; Gil-Hutton & Cañada-Assandri, 2011, etc). As only a subset of the Ld near-infrared spectroscopic class shows this unusual behavior, these objects are referred to as Barbarians after the first-discovered and namesake object (234) Barbara. Devogèle et al. (2018) present a detailed analysis of the combined polarimetric and spectroscopic properties of these objects and show evidence for a connection between the Barbarians and an enrichment of spinel-bearing inclusions. They also found for (234) Barbara that the inversion angle is dependent on the wavelength of observation, with inversion angle ranging from 26∘ to 30∘ from the I (0.79 m) to the B (0.44 m) band respectively. They interpret this change as a result of the refractive index of spinel which varies from 1.81 to 1.78 in those bands, respectively (cf. Hosseini, 2008).
The unusual polarimetric properties of the Barbarians, with the implication of a surface rich in spinels, suggests that the composition of these objects is dominated by some of the most early-forming material in the Solar system. One possible interpretation of this is that the Barbarians are relics of the earliest stages of protoplanet growth. Here, we probe the composition of the Barbarians using newly obtained near-infrared polarimetry in comparison with visible-light polarimetry to test possible surface compositions for these unusual objects.
2 Observations and Data Reduction
To conduct our study, we obtained polarization phase curves for six different Barbarian asteroids at and bands (m and m, respectively) using the Wide-field InfraRed Camera+Polarimeter (WIRC+Pol) on the Palomar 200-inch telescope (Tinyanont et al., 2019a). WIRC+Pol employs a polarizing grating to split the incoming light into its four linear polarization components, as well as dispersing it into a low-resolution spectrum. In addition, WIRC+Pol has a half-wave plate (HWP) that can be rotated up-stream of the other optics to swap the beams of each polarization state. This beam-swapping allows for a dramatic reduction is systematics, enabling polarimetric accuracies of order (Tinyanont et al., 2019b).
Our survey follows the same procedure as described in Masiero et al. (2022) and builds upon the initial results presented there. In short, measurements are obtained at each of four HWP rotation positions, and with the source at two different positions on the chip to allow for A-B background subtraction. Exposure times are scaled to source brightness, with the longest individual exposure time of 30-seconds limited by the background flux. For most objects we obtain 4 HWP cycles at each chip position for each filter, and this exposure sequence takes 20-45 mins depending on the exposure time. For the faintest sources we obtain 6 or 8 HWP cycles, to improve our measurement uncertainties.
Data reduction is carried out using the standard WIRC+Pol data reduction pipeline software111https://github.com/WIRC-Pol/wircdrp. Dark images were obtained for each exposure time at the start and end of each night, and flats were taken for both filters at the start and end as well for calibration purposes. The data reduction pipeline produces Q/I and U/I polarization measurements across the observed spectrum of the object, along with the total polarization (P) spectrum and the polarization angle () spectrum. To obtain the single-band polarization values (and improve measurement uncertainty for faint sources) we perform an error-weighted co-add of the Q/I and U/I spectra and derive the total P and for each object, along with associated uncertainties, shown in Table LABEL:tab.astdata. This process of co-addition typically suppresses the statistical uncertainty on polarization to values well below the accuracy that external validation has demonstrated is achieved by the system. To account for this we add in quadrature with the derived statistical uncertainty to give us the final uncertainty quoted in the table. Analysis of the polarization spectral slope across each band (as was done by Kwon et al., 2022) will be subject of future investigation, but no obvious significant trends have been seen to date for our asteroid observations.
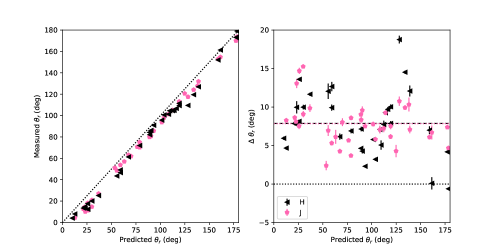
We then rotate the angle of polarization such that is defined as perpendicular to the scattering plane, resulting in a value that is positive when perpendicular to the plane and negative when parallel to the plane, as is convention in asteroid polarimetry. As discussed in Millar-Blanchaer et al. (2021) the calculated angle of polarization is slightly offset from the expected value for both and bands. Following Masiero et al. (2022), we take all our measured values where and compare the expected angle of polarization to the value reported by the data reduction pipeline. We choose these high polarization epochs to ensure that low level systematic issues don’t affect this correction. We show the results of this comparison in Figure 1, and find a mean offset of for both the and bands; we apply this correction to obtain the values presented in Table LABEL:tab.astdata.
| Asteroid | Observation Date | UT | Total texp (sec) | Phase (deg) | Filter | (E-of-N) | ||
|---|---|---|---|---|---|---|---|---|
| 234 | 2022-04-02 | 07:57 | 1920 | 9.3 | H | |||
| 234 | 2022-04-02 | 07:57 | 1920 | 9.3 | J | |||
| 234 | 2022-05-30 | 05:42 | 1920 | 20.8 | H | |||
| 234 | 2022-05-30 | 05:42 | 1920 | 20.8 | J | |||
| 387 | 2021-02-03 | 07:49 | 4800 | 5.7 | H | |||
| 387 | 2021-02-03 | 07:49 | 3000 | 5.7 | J | |||
| 387 | 2021-05-30 | 04:48 | 2640 | 19.7 | H | |||
| 387 | 2021-05-30 | 04:48 | 2640 | 19.7 | J | |||
| 387 | 2022-04-02 | 11:38 | 160 | 26.5 | H | |||
| 387 | 2022-04-02 | 11:38 | 160 | 26.5 | J | |||
| 387 | 2022-05-30 | 10:11 | 160 | 16.5 | H | |||
| 387 | 2022-05-30 | 10:11 | 160 | 16.5 | J | |||
| 387 | 2022-07-11 | 07:51 | 320 | 11.8 | H | |||
| 387 | 2022-07-11 | 07:51 | 320 | 11.8 | J | |||
| 387 | 2022-10-15 | 02:10 | 320 | 27.5 | H | |||
| 387 | 2022-10-15 | 02:10 | 320 | 27.5 | J | |||
| 980 | 2021-09-04 | 09:07 | 2880 | 17.1 | H | |||
| 980 | 2021-09-04 | 09:07 | 2880 | 17.1 | J | |||
| 980 | 2021-11-08 | 04:53 | 960 | 19.7 | H | |||
| 980 | 2021-11-08 | 04:53 | 960 | 19.7 | J | |||
| 980 | 2022-10-15 | 11:15 | 1920 | 19.6 | H | |||
| 980 | 2022-10-15 | 11:15 | 1440 | 19.6 | J | |||
| 980 | 2022-12-01 | 11:31 | 1920 | 17.8 | H | |||
| 980 | 2022-12-01 | 11:31 | 1920 | 17.8 | J | |||
| 980 | 2023-01-07 | 08:51 | 960 | 8.2 | H | |||
| 980 | 2023-01-07 | 08:51 | 960 | 8.2 | J | |||
| 236 | 2021-05-30 | 09:25 | 1920 | 19.7 | H | |||
| 236 | 2021-05-30 | 09:25 | 1920 | 19.7 | J | |||
| 236 | 2021-06-26 | 09:06 | 2880 | 12.7 | H | |||
| 236 | 2021-06-26 | 09:06 | 2880 | 12.7 | J | |||
| 236 | 2021-09-04 | 06:19 | 960 | 18.3 | H | |||
| 236 | 2021-09-04 | 06:19 | 960 | 18.3 | J | |||
| 236 | 2021-11-08 | 02:24 | 1440 | 25.1 | H | |||
| 236 | 2021-11-08 | 02:24 | 1440 | 25.1 | J | |||
| 236 | 2022-10-15 | 09:40 | 1920 | 21.9 | H | |||
| 236 | 2022-10-15 | 09:40 | 1920 | 21.9 | J | |||
| 236 | 2022-12-01 | 09:32 | 960 | 9.3 | H | |||
| 236 | 2022-12-01 | 09:32 | 960 | 9.3 | J | |||
| 236 | 2023-01-07 | 07:44 | 360 | 8.9 | H | |||
| 236 | 2023-01-14 | 05:48 | 960 | 11.2 | H | |||
| 236 | 2023-01-14 | 05:48 | 960 | 11.2 | J | |||
| 172 | 2022-07-11 | 11:05 | 1920 | 25.2 | H | |||
| 172 | 2022-07-11 | 11:05 | 1920 | 25.2 | J | |||
| 172 | 2022-10-15 | 07:10 | 1920 | 18.1 | H | |||
| 172 | 2022-10-15 | 07:10 | 1920 | 18.1 | J | |||
| 172 | 2022-12-01 | 08:33 | 160 | 9.0 | H | |||
| 172 | 2022-12-01 | 08:33 | 160 | 9.0 | J | |||
| 172 | 2023-01-07 | 06:17 | 960 | 20.1 | H | |||
| 172 | 2023-01-07 | 06:17 | 960 | 20.1 | J | |||
| 172 | 2023-01-14 | 04:01 | 960 | 21.5 | H | |||
| 172 | 2023-01-14 | 04:01 | 960 | 21.5 | J | |||
| 402 | 2022-04-02 | 08:53 | 160 | 8.8 | H | |||
| 402 | 2022-04-02 | 08:53 | 160 | 8.8 | J | |||
| 402 | 2022-05-30 | 07:05 | 1440 | 20.4 | H | |||
| 402 | 2022-05-30 | 07:05 | 1440 | 20.4 | J | |||
| 402 | 2022-07-11 | 05:18 | 1920 | 24.2 | H | |||
| 402 | 2022-07-11 | 05:18 | 1920 | 24.2 | J |
Polarization measurement has been rotated such that positive values represent polarization perpendicular to the Sun-Asteroid-Telescope scattering plane () and negative values represent polarization in this plane. is the angle of polarization after correcting for the observed systematic offset.
3 Results
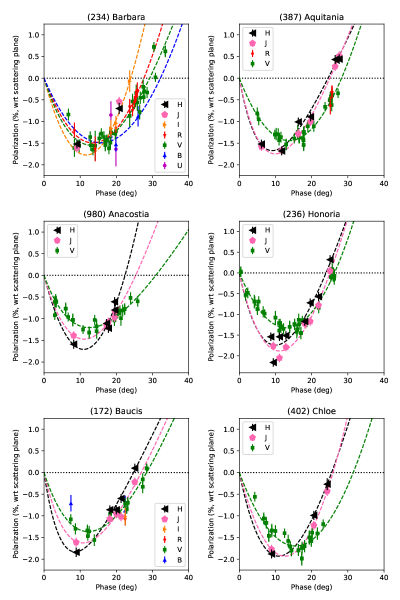
We show in Figure 2 the polarization phase curves for the six Barbarian asteroids that we have observed with WIRC+Pol. We also include all literature measurements at other wavelengths that are available in three archives: the Asteroid Polarimetric Database (Lupishko, 2022), the Calern Asteroid Polarimetric Survey (CAPS), and the CASLEO Survey (Bendjoya et al., 2022). Following Masiero et al. (2022), we fit the analytical polarization phase function defined in Muinonen et al. (2009) to each wavelength independently if that dataset had at least three data points that spanned at least of phase. These are shown in the figure as dashed lines, with colors to indicate wavelength following the color of the points in the legend. All six objects show a consistent change from the band observations (which dominate the literature measurements) to the and band data presented here.
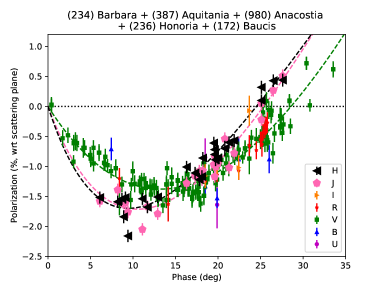
In Figure 3 we over-plot all data from five of our Barbarian targets to produce a fit that is less subject to individual measurement noise, and the best parameters of the best-fit phase curves are presented in Table 2. We do not include (402) Chloe in this plot as its band phase curve shows a different behavior from the other Barbarians we looked at. As shown in Devogèle et al. (2018) Chloe has a deeper minimum polarization, a larger Pmin angle, and larger inversion angle than the other five objects. Bendjoya et al. (2022) suggested that Barbarian objects with deeper values may represent a distinct subclass of the Barbarian population, something that is also suggested by the spectroscopic classification and would result from compositional differences between individual objects.
Even after the removal of Chloe, the V band data show a dispersion in the polarimetric phase behavior, most noticeable in the range of phase angles where the inversion angle is seen. This change is also apparent in the curve fits to the V band data shown in Figure 2. In contrast to this difference at band, at and bands the polarization phase curves of all the Barbarians we observed, including (402) Chloe, are consistent with one another. This suggests that the difference between these potential subclasses may derive from compositional differences in the high index of refraction material that dominates the visible light polarization, but that the background matrix material that the near infrared is probing is compositionally indistinguishable across these objects; further investigation into the possible origin of this change is warranted.
| Band | () | (deg) | (deg) | |
|---|---|---|---|---|
| V | -1.38 | 13.3 | 0.17 | 28.6 |
| J | -1.71 | 10.5 | 0.19 | 25.4 |
| H | -1.70 | 9.5 | 0.18 | 24.5 |
Parameters of the best-fit polarization phase curve: - the negative extrema of the curve; - the phase angle where the curve reaches ; - the slope of the curve at the inversion angle; - the inversion angle of the curve (where the curve crosses ).
4 Discussion
The variations we observe in the polarization phase curves for the Barbarians point towards an interpretation that the surface elements that dominate the polarization properties at near-infrared wavelengths are different from the surface elements that dictate the visible-light properties. While the majority of polarization measurements made for the Barbarians in the past have been at V band wavelengths, recent data from Bendjoya et al. (2022) include CASLEO I band data for (234) Barbara that is consistent with our and band measurements and in contrast with the trend followed by the V band data. This points to the transition in polarization-wavelength behavior beginning at a wavelength around nm.
To interpret our observations, we can compare our findings to recent models of dust in planetary disks. Tazaki & Dominik (2022) present results showing that the size of the monomers that make up the aggregate dust grains have a significant impact on the polarization behavior when the wavelength is comparable to or smaller than the monomer size parameter. In particular, dramatic changes occur in the polarization behavior when where is the monomer radius and is the wavelength. Conversely when polarization is insensitive to monomer radius and shows only small changes with wavelength. Dramatic changes in observed polarization, like we see here with the Barbarians, thus may be indicative of a situation where , revealing the sizes of the consituant monomers that aggregated into the surface dust. The minimal change seen in other asteroids at these wavelengths (e.g. Belskaya et al., 2009; Bendjoya et al., 2022; Masiero et al., 2022), would then imply that these objects are composed of dust aggregates made of either much smaller or much larger monomers than the Barbarians. This could be due to a formation effect or subsequent evolution of the body (e.g. dust grain compaction and reduction in porosity) that was experienced by some populations and not others.
Tazaki & Dominik (2022) also show that realistic dust monomers will have a difference in index of refraction depending on if the included carbon is amorphous vs organic, with amorphous carbon having a higher index of refraction. Additionally, while organic carbon shows nearly no change in the real component of the index of refraction from V to H bands, amorphous carbon’s index of refraction increases with longer wavelength. Masiero et al. (2009b) investigated the effects of various surface physical properties on the theoretical polarization phase curve and found that while changes to the index of refraction in the surface material produce the most dramatic effects in the location of , changes in the size of the scattering elements produce phase curve changes comparable to the changes we are seeing for the Barbarians (see their Fig 2b).
The shape and size distribution of the dust particles are also expected to have a large effect on the scattering properties of the surface. The way that light is scattered by irregularly-shaped dust grains is a complex combination of monomer composition and the way that they are assembled (Kolokolova et al., 2018). Wavelength has also been shown to have a significant effect on the polarization phase curve both in theoretical modeling Min et al. (2003) and for cosmic dust analogs such as clays (Muñoz et al., 2011). Masiero et al. (2009b) considered a single wavelength of light (600 nm) and used a simplified model of the scattering elements that consisted of a distribution of various sizes of spherical grains. They found that when the scattering elements were much larger than the wavelength the polarization curve would have a less deep minimum, while if the minimum scattering size was comparable to the wavelength then the depth of the and slope at the inversion angle would be similar to what we observe for the Barbarians in the near-infrared, as well as what we see across wavelengths for the C-complex objects Masiero et al. (2022). While the observed behavior of the polarization phase curve depends on the interplay of many different physical properties of the dust, the scattering element size approaching the observation wavelength would thus be expected to have a large effect as the physics of the scattering of light changes in this regime.
Given the results of these studies, we interpret our observations as being the result of Barbarians having a two-phase surface composition:
-
•
find-grained inclusions of a high albedo, high index of refraction material that results in visible light measurements showing a less deep minimum polarization and a large inversion angle, and
-
•
a low albedo matrix material with a range of grain scales similar to what is observed for C-complex asteroids.
This two-phase composition would mean that the polarized photons we receive at visible wavelengths are dominated (in terms of number) by the fine-grained inclusions. These inclusions become too small to efficiently polarize light in the near-infrared, and so the polarized photons received at those wavelengths are dominated by the matrix.
This interpretation is consistent with both the findings of Sunshine et al. (2008) and Devogèle et al. (2018), who identify fluffy type-A CAIs mixed with carbonaceous chondrite matrix materials as the best fit to both the polarimetric properties and the spectra of the Barbarians, as well as those of DeMeo et al. (2022) who find a good spectral match between the Barbarian (387) Aquitania and the CV3 meteorite NWA3118 (Milliken, 2020). Frattin et al. (2022) recently have shown that the minerals that comprise CAIs can produce Barbarian-like visible-light phase curves in laboratory testing, further supporting this interpretation.
Notably, as Masiero et al. (2009b) found, the optical size parameter that controls the polarization is the spacing between scattering elements, not necessarily the physical size of the individual surface grain. Macroscopic grains with a fluffy, fractal-like composition could result in scattering distances smaller than m which would be consistent with the observations presented here. This also would match previous findings on the composition of the Barbarians, as well the connection between CV3 meteorites like NWA3118 and Allende (Sunshine et al., 2008).
A similar magnitude of change in the polarization-phase curve was produced by Sultana et al. (2023) for laboratory samples by changing the ratio of olivine to FeS hyperfine grains in the sample being observed. These observations were obtained at visible wavelengths, and olivine was acting as a scattering element while FeS was acting as an absorptive element in the optical mixture. Changing from FeS-domianted to olivine-dominated mixtures shifted the curve in a way that is qualitatively similar to the changes we observe (i.e. deepening Pmin, lower ). This further supports a two-phase mixture to explain the Barbarians, though shows that the interaction between mixture, grain size, and wavelength is complex and deserves further laboratory experimentation.
An alternate possibility for the behavior we observe could simply be that the ratio of grain sizes of the scattering elements to wavelength are significantly smaller in the near-infrared than in the visible. This would be consistent with the findings of Muñoz et al. (2021) and specifically Frattin et al. (2022) who show that decreasing this ratio results in more extreme polarization minima and maxima. An analogous scenario was observed by Hadamcik et al. (2023) who measured the polarization phase curves for materials similar to C-complex asteroids and found that the size of the constituent grains making up the individual scattering elements had a strong effect on the shape and maximum of the curves. In these cases, the observed wavelength was constant and the grain size changed, while for our observations the grains size distribution is constant and the wavelength is being varied. But in both situations, a change in the ratio between grain size and wavelength results in a change in polarimetric properties. However, the polarization changes produced by grain size-to-wavelength ratio changes do not produce the shift in inversion angle we observe, leading us to instead favor a two phase model that we describe above. Further laboratory testing would help disciminate between these two potential causes.
5 Conclusions
We present new observations of the Barbarian asteroids at near-infrared and band wavelengths (m and m respectively). We show that the polarization-phase curves for these objects show a dramatic change in the near-infrared compared to the visible-light behavior, well beyond what has been seen before. The polariztion-phase behavior at and bands appears to be most similar to what is observed for C-complex asteroids at these wavelengths, despite these objects having Ld-type spectral taxonomy most often associated with the S-complex. Our observations support an interpretation of the surface composition as a two-phase mixture of CAI inclusions in a carbonaceous chondrite-like matrix.
Previous investigations have suggested that the Barbarians are a population of very primitive survivors of an early generation of planetesimals, based on the large fraction of CAIs on their surfaces implied by spectra and polarimetry. Our near-infrared data, which reveal a dark C-complex-like matrix surrounding the CAIs, further supports the interpretation that these are primitive objects. While primitive objects are often thought to have formed out beyond the ice line in the early Solar system, where water and carbon species were prevalent, the large compositional fraction of CAIs in the Barbarians would instead imply formation near the hottest parts of the protosolar disk where CAI formation occurred. The rarity of the Barbarians may be interpreted then as indicating they formed in a cold region of hot inner protosolar disk, or that a transport mechanism in the forming disk moved a large amount of CAIs from their formation zone to a narrow region where primitive bodies were forming. Searches for Barbarians in populations beyond the Main Belt, as well as further analysis of the known members of this class, will help discriminate among these potential formation scenarios.
Although the Barbarians have shown the most dramatic changes to their polarization at and band to date, it is likely that other compositional classes will have unusual near-infrared polarimetric properties. A comprehensive survey of the variety of taxonomic types at near-infrared wavelengths has the potential to reveal other changing behaviors that directly probe asteroid surface mineralogy. Polarization surveys therefore provide an important complement to photometry and spectroscopy for understanding the composition of the small bodies of our Solar system.
Acknowledgments
We thank the two anonymous referees for their helpful comments that improved this work. JRM thanks Katherine de Kleer for helpful discussions. Based on observations obtained at the Hale Telescope, Palomar Observatory as part of a continuing collaboration between the California Institute of Technology, NASA/JPL, Yale University, and the National Astronomical Observatories of China. This research made use of Photutils, an Astropy package for detection and photometry of astronomical sources (Bradley et al. 2019).
References
- Bagnulo et al. (2017) Bagnulo, S., Belskaya, I., Cellino, A., et al., 2017, European Physical Journal Plus, 132, 405.
- Belskaya et al. (2009) Belskaya, I.N., Levasseur-Regourd, A.-C., Cellino, A., et al., 2009, Icarus, 199, 97.
- Belskaya et al. (2015) Belskaya, I., Cellino, A., Gil-Hutton, R., et al., 2015, Asteroids IV, ed. Michel, DeMeo, & Bottke (Univ of Arizona Press), 151.
- Bendjoya et al. (2022) Bendjoya, P., Cellino, A., Rivet, J.-P., et al., 2022, A&A, 665, A66
- Bradley et al. (2019) Bradley, L. et al., 2019, astropy/photutils 0.7.2, Zenodo, doi:10.5281/zenodo.3568287
- Cellino et al. (2006) Cellino, A., Belskaya, I.N., Bendjoya, Ph., et al., 2006, Icarus, 180, 565.
- Cellino et al. (2015) Cellino, A., Gil-Hutton, R., & Belskaya, I. N., 2015, Polarimetry of Stars and Planetary Systems, 360.
- DeMeo et al. (2022) DeMeo, F. E., Burt, B. J., Marsset, M., et al., 2022, Icarus, 380, 114971.
- Devogèle et al. (2018) Devogèle, M., Tanga, P., Cellino, A., et al., 2018, Icarus, 304, 31.
- Frattin et al. (2022) Frattin, E., Martikainen, J., Muñoz, O., et al.2022, MNRAS, 517, 5463.
- Gil-Hutton et al. (2008) Gil-Hutton, R., Mesa, V., Cellino, A., et al., 2008, A&A, 482, 309.
- Gil-Hutton & Cañada-Assandri (2011) Gil-Hutton, R. & Cañada-Assandri, M., 2011, A&A, 529, 86.
- Hadamcik et al. (2023) Hadamcik, E., Renard, J.-B., Lasue, J., et al.2023, MNRAS, 520, 1963.
- Hosseini (2008) Hosseini, S., 2008, Physica Status Solidi B Basic Research, 245, 2800.
- Kolokolova et al. (2018) Kolokolova, L., Nagdimunov, L., & Mackowski, D. 2018, JQSRT, 204, 138.
- Kwon et al. (2022) Kwon, Y. G., Masiero, J. R., & Markkanen, J., 2022, A&A, 668, A97
- Lupishko (2022) Lupishko, D., Ed. (2022). Asteroid Polarimetric Database V2.0. urn:nasa:pds:asteroid_polarimetric_database::2.0. NASA Planetary Data System
- Masiero & Cellino (2009a) Masiero, J. & Cellino, A., 2009a, Icarus, 199, 333.
- Masiero et al. (2009b) Masiero, J., Hartzell, C., Scheeres, D., 2009b, AJ, 138, 1557.
- Masiero et al. (2022) Masiero, J., Tinyanont, S., & Millar-Blanchaer, M.A., 2022, PSJ, 3, 90.
- Milliken (2020) Milliken, R., 2020, RELAB Spectral Library Bundle V2.0. urn:nasa:pds:relab::2.0, NASA Planetary Data System; doi:10.17189/1519032
- Millar-Blanchaer et al. (2021) Millar-Blanchaer, M., Tinyanont, S., Jovanovic, N., et al., 2021, SPIE, 11447, 114475Y.
- Min et al. (2003) Min, M., Hovenier, J. W., & de Koter, A., 2003, JQSRT, 79-80, 939.
- Muinonen et al. (2009) Muinonen, K., Penttilä, A., Cellino, A., et al., 2009, M&PS, 44, 1937.
- Muñoz et al. (2011) Muñoz, O., Moreno, F., Guirado, D., et al., 2011, Icarus, 211, 894.
- Muñoz et al. (2021) Muñoz, O., Frattin, E., Jardiel, T., et al., 2021, ApJS, 256, 17.
- Sunshine et al. (2008) Sunshine, J. M., Connolly, H. C., McCoy, T. J., et al., 2008, Science, 320, 514.
- Sultana et al. (2023) Sultana, R., Poch, O., Beck, P., et al., 2023, Icarus, in press.
- Tazaki & Dominik (2022) Tazaki, R. & Dominik, C., 2022, A&A, 663, 57.
- Tinyanont et al. (2019a) Tinyanont, S., Millar-Blanchaer, M.A., Nilsson, R., et al.2019a, PASP, 131, 25001.
- Tinyanont et al. (2019b) Tinyanont, S., Millar-Blanchaer, M.A., Jovanovic, N. et al.2019b, Proc. SPIE, 11132, 1113209.