DEnsity: Open-domain Dialogue Evaluation Metric
using Density Estimation
Abstract
Despite the recent advances in open-domain dialogue systems, building a reliable evaluation metric is still a challenging problem. Recent studies proposed learnable metrics based on classification models trained to distinguish the correct response. However, neural classifiers are known to make overly confident predictions for examples from unseen distributions. We propose DEnsity, which evaluates a response by utilizing density estimation on the feature space derived from a neural classifier. Our metric measures how likely a response would appear in the distribution of human conversations. Moreover, to improve the performance of DEnsity, we utilize contrastive learning to further compress the feature space. Experiments on multiple response evaluation datasets show that DEnsity correlates better with human evaluations than the existing metrics.111Our code is available at https://github.com/ddehun/DEnsity.
1 Introduction
Automatic evaluation is essential in developing various natural language generation systems, such as machine translation (Sutskever et al., 2014) and summarization (See et al., 2017). A common practice for evaluating the generation quality is to compute the similarity of the generated outputs against ground-truth references (Papineni et al., 2002; Lin, 2004; Banerjee and Lavie, 2005; Zhang et al., 2019). In open-domain dialogue areas, however, the set of potential responses for a single dialogue history is extremely large, as a conversation can evolve in many ways. Due to this very nature of dialogues, reference-based metrics show a poor correlation with human evaluations (Liu et al., 2016).
To remedy this, recent studies proposed various reference-free and model-based metrics for dialogue evaluation. Many of them focus on estimating the relevance of a response to a dialogue history. For instance, Tao et al. (2018) propose a classification model that is trained to distinguish a correct response for a dialogue history from irrelevant responses. After training, the model is used to evaluate responses by predicting how likely the response would follow the dialogue history. These classifier-based metrics have shown a higher correlation with the human evaluations than the reference-based metrics Ghazarian et al. (2019); Mehri and Eskenazi (2020b); Sinha et al. (2020); Zhang et al. (2021).
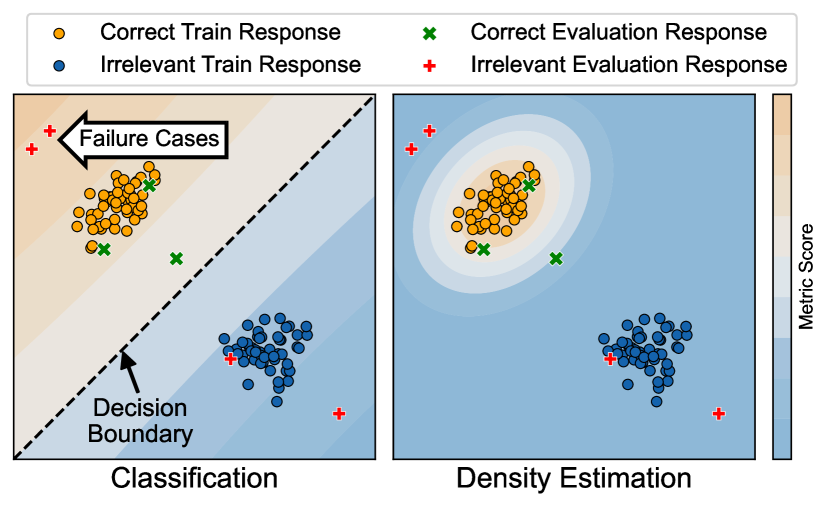
However, the goal of training such metrics is to find the decision boundary of classifying the training examples. As shown in Fig. 1, if an irrelevant example from an unseen distribution is far from the decision boundary, but is on the same side as the correct train responses, a neural classifier will incorrectly give a high score (Hendrycks and Gimpel, 2016; Liang et al., 2018). Therefore, a metric that assumes that a generated response comes from a distribution similar to the training data is not reliable. Due to this misalignment of goals, classifier-based metrics may not be suitable for evaluating open-domain dialogue systems.
A similar misalignment is found in different tasks that utilize neural classifiers, such as out-of-distribution (OOD) detection. Instead of using a prediction score from classifiers, studies utilized an alternative approach, in which the goal is to detect abnormal examples by estimating their densities on the feature space of a classifier (Lee et al., 2018; Winkens et al., 2020; Zhou et al., 2021), and showed impressive results in OOD detection.
Inspired by the benefits of the density estimation approaches in OOD detection, we propose DEnsity, a new Dialogue Evaluation metric using Density Estimation. DEnsity measures the density of the response on the feature distribution of human conversations. Specifically, a response selection model is utilized as a feature extractor to obtain representations of both the human responses in the dialogue corpus and the system generated response. Human response features are fitted on a multivariate Gaussian distribution, and the density of the generated response on the human distribution is estimated using the Mahalanobis distance. Moreover, we adopt contrastive learning to further compress the features of appropriate human responses. Looking at the right figure on Fig. 1, unlike the classifier-based metric, density estimation properly assess the evaluation examples, and assign correct scores to relevant and irrelevant responses. Preliminary studies suggest that our density estimation based metric can be more robust to various failures of dialogue systems than the classifier-based metrics. Experiments on four turn-level response evaluation datasets show that DEnsity correlates better with the human evaluation than other metrics. We summarize our contributions as follows:
-
1.
We introduce a new reference-free learnable metric for open-domain dialogue systems, which estimates the density of responses on the distribution of human conversations.
-
2.
Extensive experiments on multiple datasets demonstrate that, compared to other baseline metrics, DEnsity correlates better with human evaluations, confirming its superiority.
2 Related Work
 |
Building a reliable automatic metric for open-domain dialogue systems is a difficult task. Traditional reference-based metrics, such as BLEU (Papineni et al., 2002), ROUGE (Lin, 2004), or METEOR (Banerjee and Lavie, 2005), show a low correlation with human evaluations (Liu et al., 2016). Due to the lack of a reliable automatic metric, many studies rely on human annotators to manually evaluate their systems, which can be expensive and time-consuming. To resolve this, Lowe et al. (2017) propose a supervised regression model to estimate the quality of dialogue response directly. Despite its superior performance, the supervised regression model requires human-annotated quality scores for training, which reduces the overall generalizability of such models. Therefore, recent studies propose unsupervised learning-based metrics to evaluate the relevance of a response to a given dialogue history. For instance, Tao et al. (2018) train an classification model that learns to discriminate the original response from randomly sampled negative responses. Furthermore, researchers have extended these classifier-based metrics with various techniques. Ghazarian et al. (2019) leverage pre-trained language models (LMs) to improve the evaluation performance. Several works aim to make hard negative samples used in training through various strategies (Bak and Oh, 2020; Sinha et al., 2020; Gupta et al., 2021; Park et al., 2021; Lee et al., 2022). Sai et al. (2020) suggest a pre-training strategy for dialogue evaluation along with a public release of an human-annotated adversarial dataset. Huang et al. (2020) leverage an external knowledge source Speer et al. (2017) to augment an evaluation model. Zhang et al. (2021) propose a new graph-based model to focus on the interactive and multi-turn natures of a dialogue. Another line of research evaluates a response by measuring the likelihood of words in a response (Mehri and Eskenazi, 2020b; Pang et al., 2020). This approach usually employs pre-trained LMs (Devlin et al., 2019; Radford et al., 2019) to estimate the likelihood. Our work is distinct from previous studies in that we evaluate a response by measuring its similarity to human responses by exploiting the rich information presented in the feature space of a neural network.
Numerous studies propose to understand and evaluate artificial responses from neural generation models. For instance, Holtzman et al. (2019) report that neural language models often create incoherent and repetitive sequences. Pillutla et al. (2021) compare the distribution of a generated text against the ones written by humans in a quantized embedding space. In the dialogue domain, Xiang et al. (2021) measure the distance between the distributions of generated conversations and real-world conversations to compare at the system-level. Unlike the previous studies, we focus on measuring the extent to which a generated conversation is similar to real human conversations. Our work is inspired by previous studies that leverage the representation space of neural networks to detect out-of-distribution (OOD) or adversarially curated examples (Lee et al., 2018; Winkens et al., 2020; Xu et al., 2020; Zhou et al., 2021). Instead of detecting such abnormal instances, however, we aim to judge the quality of generated responses by considering their representations.
3 DEnsity: Open-domain Dialogue Evaluation using Density Estimation
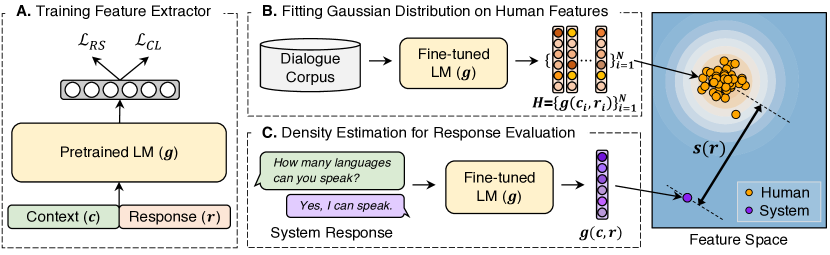
We present DEnsity, which evaluates a response by measuring its density on a distribution of human responses. We first train a response selection model that learns to distinguish a correct response from random responses (section 3.1). The selection model is employed as a feature extractor to obtain features of both human responses in a dialogue corpus and a generated response (section 3.2). We then evaluate the generated response on the distribution of human features with Gaussian discriminant analysis and Mahalanobis distance (section 3.3). We also introduce our contrastive loss to obtain better features in section 3.4. Fig. 2 illustrates the overall pipeline of DEnsity.
3.1 Training Response Selection Model for Feature Extraction
The response selection model learns to find the next utterance for a given dialogue history among the response candidates. The response candidates contain multiple negative responses that are incorrect and not suitable as the next utterance for the given dialogue history. Formally, represents a dialogue context that consists of multiple utterances between two speakers. The response candidate contains one answer response and negative responses that are randomly sampled from a dialogue corpus. The selection model is trained to distinguish a positive pair from the negative pairs as follows:
| (1) |
where denotes the prediction score of the selection model to a context-response pair. We implement the selection model with transformer (Vaswani et al., 2017)-based cross-encoder architecture, where the concatenation of a dialogue history and a response , along with the [SEP] token, is fed into a pre-trained transformer encoder . The -dimensional output representation from the transformer encoder is then transformed into a single scalar value with a linear layer . In this work, we use the [CLS] vector from the transformer encoder as the output representation.
3.2 Fitting Gaussian Distribution on Features
After training the selection model, we encode all positive training pairs in a dialogue corpus with the encoder to obtain their output representations , where denotes the total number of positive pairs. We then train a single-class generative classifier by fitting the multivariate Gaussian distributions as follows:
| (2) |
where and denote the empirical mean and covariance matrix of features, respectively. Note that both and can be calculated only once, and be used at any time for response evaluation.
3.3 Response Evaluation with Density Estimation
To evaluate a response generated by a dialogue system for a dialogue context , we first obtain its feature with encoder . We then estimate its density on the Gaussian distribution using a Mahalanobis distance as follows222We omit from for simplicity.:
| (3) |
where denotes a pseudo-inverse matrix of . The distance value of a response is used as the score assigned by our metric. In other words, we regard the distance between the response and the distribution of human responses as an indicator of its quality. Therefore, a high-quality response will receive a high score from our metric, while a low quality response will receive a low score.
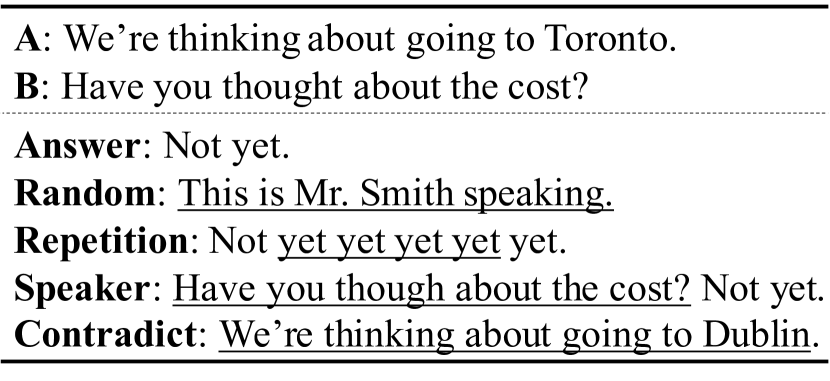
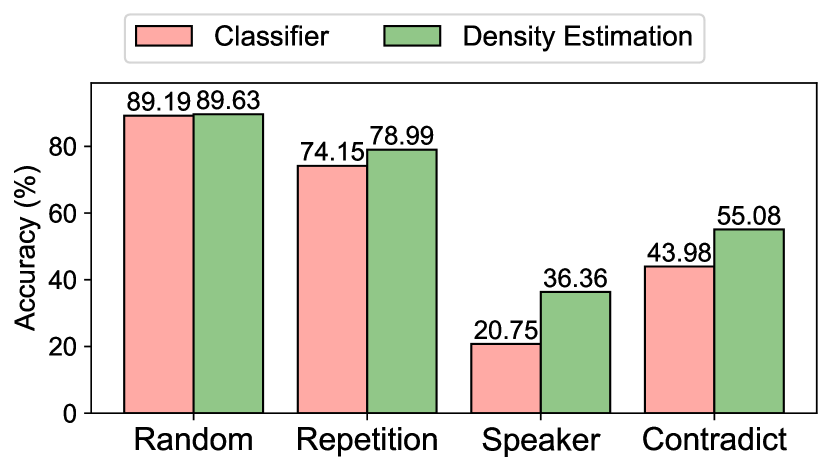
Does a density estimation based metric actually work? Note that many previous studies leverage the prediction of a classifier that is trained to distinguish a correct response from others (Tao et al., 2018; Mehri and Eskenazi, 2020b; Sinha et al., 2020), which is similar to our selection model’s prediction score . In contrast, our metric only uses the intermediate output of the model to estimate the density of a generated response. In our preliminary study, we compare the classifier-based approaches with density estimation by observing their behaviors on adversarially manipulated responses. Specifically, we use a dataset released by Khalid and Lee (2022) that is designed to probe the robustness of dialogue evaluation metrics. The dataset consists of three components: (1) dialogue history, (2) answer response, and (3) adversarial response. The adversarial response is created by manipulating the original answer response with various strategies. An evaluation metric should assign a higher score to the answer response than the adversarial response. We use the following three adversarial types, which reflect errors that frequently occur in dialogue systems: (1) Repetition: repeats words in the answer, (2) Speaker-Sensitiveness: concatenates the last utterance from the dialogue history to the answer, (3) Contradiction: corrupts the contextual information in the answer. We also compute the accuracy on a random negative example to check whether the density estimation based metric can perform well in the original training task. Fig. 3(a) presents sample responses of different attack types.
From the results in Fig. 3(b), we first observe that our density estimation based metric can distinguish random responses on par with a classifier-based metric. In terms of accuracy on the adversarial responses, the density estimation based metric performs better than the classifier-based metric. Previous literature on OOD detection task (Lee et al., 2018; Xu et al., 2020) reports similar trends to our observation, where the softmax-based neural classifiers are prone to make overly confident predictions Hendrycks and Gimpel (2016); Liang et al. (2018) on abnormal instances. These results imply that the feature space derived by contains sufficient information to perform the original task, and the density estimation based metric can be more effective than the classifier-based metric in detecting various failures made by dialogue systems.
3.4 Enhanced Feature Space with Contrastive Learning
Our feature extractor is trained to make features that can discriminate the correct response from the incorrect ones for the same dialogue history. Therefore, features of a positive pair from a different dialogue history may not be easily distinguished from features of negative responses, which can reduce the performance of our metric. To resolve this, we adopt a supervised contrastive loss (Khosla et al., 2020; Gunel et al., 2020; Zhou et al., 2021), which regards all positive pairs in the training set as the same class. The loss function encourages the representations of positive pairs to be closer, while increasing the discrepancy from the representations of negative pairs. Formally, given a batch of dialogue history, the training objective for contrastive learning is:
| (4) |
where denotes a L2-normalized [CLS] vector of a context-response pair from the transformer encoder , and denotes the th positive pair in the batch. denotes all positive context-response pairs in the batch except for , and denotes all context-response pairs in the batch except for .333 and are and . is a temperature scaling hyperparameter. The final training objective of selection model is
| (5) |
where is a hyperparameter.
4 Experiments
4.1 Dataset
We conduct experiments on two representative open-domain dialogue datasets.
DailyDialog (Li et al., 2017) is a multi-turn dialogue dataset written by human annotators. The dataset is designed to cover various topics and relationships in our daily life. The dataset consists of 13,118 multi-turn conversations. ConvAI2 (Dinan et al., 2020) is a crowd-sourced dataset, where two speakers continue a conversation with their assigned personal information. The dataset consists of 17,878 multi-turn conversations.
We use four turn-level dialogue evaluation datasets to compare the performance of different evaluation metrics. In the dataset, each example consists of a dialogue history, an answer response, a generated response by a dialogue system, and a quality score judged by human annotators. The details of evaluation datasets are as follows:
DailyDialog-Zhao (Zhao et al., 2020) contains 900 evaluation examples from six different dialogue systems. The dataset is derived from the DailyDialog dataset, which is used as a training corpus of dialogue systems and a source of dialogue histories. The “overall” score is used in our experiments. ConvAI2-USR (Mehri and Eskenazi, 2020b) is derived from the ConvAI2 dataset and contains 240 evaluation examples from three dialogue systems. The “Overall Quality” score is used in our experiments. DailyDialog-GRADE and ConvAI2-GRADE are datasets released by Huang et al. (2020), each of which is based on the DailyDialog and ConvAI2 datasets. DailyDialog-GRADE and ConvAI2-GRADE contain 300 examples from two systems and 600 examples from four systems, respectively.
DailyDialog Zhao ConvAI2 USR DailyDialog GRADE ConvAI2 GRADE Model Reference-based BLEU 8.02∗ 2.77∗ 11.22∗ 12.43∗ 14.15∗ 10.70∗ 10.69∗ 12.36 ROUGE 14.96 9.79∗ 10.96∗ 9.64∗ 10.98∗ 3.12∗ 11.82 11.56 METEOR 8.99∗ 5.36∗ 17.99∗ 18.80 11.94∗ 7.54∗ 22.48 22.50 EmbAvg. 7.32∗ 7.93∗ 11.82∗ 14.51∗ 2.44∗ 4.08∗ 19.52 21.47 EmbExt. 18.83 17.81 15.70∗ 14.27∗ 13.56∗ 9.77∗ 15.94 16.82 EmbGrd. 15.47 15.35 9.16∗ 6.51∗ 11.06∗ 8.29∗ 21.54 22.14 BERTScore 15.32 15.36 15.16∗ 12.27∗ 12.88∗ 9.94∗ 22.48 22.50 SimCSE 24.07 22.00 28.83 29.31 21.68 18.22 23.69 24.28 BLEURT 14.42 12.88 16.09∗ 15.25∗ 17.45 12.24∗ 10.16∗ 10.68∗ Perplexity-based USR-MLM 38.39 39.84 7.01∗ 13.32∗ 18.32 20.60 14.38 9.48 GPT2-Coh. 44.19 45.46 20.52 19.77 23.40 25.83 43.34 43.99 FED -7.30 ∗ -6.58∗ -2.03∗ 0.58∗ 2.56∗ 0.13∗ -14.29 -14.55 Classifier-based BERT-RUBER 36.07 35.52 14.61∗ 17.05∗ 28.29 25.99 5.73∗ 2.65∗ USR-Retrieval 48.77 51.61 49.96 59.65 27.47 23.84 40.30 39.98 USL-H 37.19 38.62 52.36 53.36 10.90∗ 9.72∗ 44.89 45.47 FlowScore 11.97 12.64 -9.06∗ -7.49∗ 13.00∗ 14.78∗ 5.92∗ 6.81∗ DynaEval 27.21 27.16 10.08∗ 10.67∗ 14.96∗ 15.89∗ 23.89 22.83 Density Estimation based (Ours) DEnsity 56.81 57.03 57.03 62.97 30.33 29.45 48.01 48.62
4.2 Baselines
We compare our method against the following baseline metrics. Note that the training dataset of reference-free metrics is the same as the original dialogue dataset from which the evaluation dataset is derived. Further implementation details of the baseline metrics are available in Appendix A.
BLEU, ROUGE, and METEOR measure word overlap of hypothesis against references.
Embedding Average/Greedy/Extrema (Liu et al., 2016) compute the similarity between an answer and generated responses with a distributed word representation.
BERTScore (Zhang et al., 2019) use a pre-trained LM to obtain the contextualized embedding of responses for similarity comparison.
SimCSE (Gao et al., 2021) adopts a self-supervised contrastive learning for better sentence embeddings. We calculate the cosine similarity between the embeddings of an answer and generated responses.
BLEURT (Sellam et al., 2020) is a reference-based metric pretrained on a synthetic dataset for an evaluation of machine translation systems.
USR-MLM (Mehri and Eskenazi, 2020b) replaces each token in a response to [MASK], and aggregates the likelihood of each token when they are conditioned on the context by using masked language modeling by BERT (Devlin et al., 2019).
GPT2-Coherency (Pang et al., 2020) measures the perplexity of a response conditioned on its dialogue history by using GPT-2 (Radford et al., 2019).
FED (Mehri and Eskenazi, 2020a) evaluates a response by measuring the perplexity of follow-up utterances designed by the authors.
BERT-RUBER (Ghazarian et al., 2019) replaces the word embedding layer in the original RUBER (Tao et al., 2018) with BERT.
USR-Retrieval (Mehri and Eskenazi, 2020b) learns to distinguish the next utterance of a given dialog history from a random response. After training, the score for which the response is predicted to be the next utterance is used for evaluation.
USL-H (Phy et al., 2020) combines the predictions from multiple models trained on different tasks for configurable response evaluation.
FlowScore (Li et al., 2021) compares a response’s semantic influences and those expected by a response generation model.
DynaEval (Zhang et al., 2021) adopts a graph-based architecture to reflect the interaction between speakers in a dialogue, and is trained to distinguish the original dialogue from the corrupted ones.
4.3 Implementation Details
We use BERT (Devlin et al., 2019) released by Wolf et al. (2020) to initialize our response selection model.444bert-base-uncased is used. We set and in Eq. 4 and Eq. 5 to 0.1 and 1.0, respectively. The selection model is trained for 10 epochs, and the initial learning rate is set to 5e-5. AdamW (Loshchilov and Hutter, 2018) optimizer is used for optimization, and the linear learning rate scheduler is used with 1000 warm up steps. The maximum number of tokens in the input sequence is set to 256, and the batch size is set to 16. The number of negative responses for a dialogue history is set to 15 for DailyDialog dataset, and 19 for ConvAI2 dataset. We use the square root value of the distance in Eq. 3, since it empirically shows a better performance. Further implementation details are in Appendix B.
 |
5 Results
5.1 Main Results
Table 1 shows the results of the response evaluation task on each dataset. Pearson correlation coefficient () and Spearman’s rank correlation coefficient () are used to compare the model predictions with human scores. We first observe that DEnsity achieves the highest correlation with human scores in all evaluation datasets. In terms of baseline metrics, n-gram overlap-based metrics like BLEU usually show a low correlation with human scores. These observations are consistent with previous studies (Liu et al., 2016), where the metrics relying on a comparison with the answer response are not appropriate in the dialogue domain. Reference-based metrics like SimCSE and BLEURT, which do not rely on the n-gram overlap, show an improved performance, but their correlations are still relatively lower than the reference-free metrics. The reference-free metrics that either measure the likelihood of words in a response (e.g., USR-MLM and GPT2-Coherency) or use the classification model (e.g., BERT-RUBER, USR-Retrieval) usually show a better performance than the reference-based metrics. Notably, classifier-based metrics like BERT-RUBER, USR-Retrieval, and USL-H often show competitive performance with DEnsity. DynaEval, a well-known metric for dialogue-level evaluation, usually performs worse than other reference-free metrics, which can be attributed to the different characteristics of turn-level and dialogue-level evaluations. Based on these results, we can confirm the validity and the effectiveness of DEnsity.
5.2 Correlation Visualization
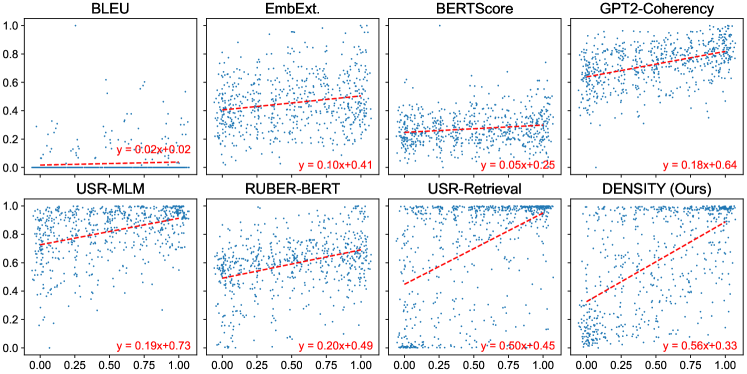
Scatter plots in Fig. 4 present human scores and the prediction scores of each metric. Each point indicates an evaluated response, and the x-axis and y-axis values indicate the human score and metric score, respectively. BLEU, a metric that relies on word overlap similarity, usually gives low scores close to zero, which makes it hard to be adopted as a reliable metric. Embedding-based metrics like Embedding Extrema and BERTScore tend to give similar scores to responses of different human scores, which fails to discriminate between high-quality responses. Several reference-free metrics like RUBER-BERT and GPT2-Coherency make predictions that positively correlate with human scores. USR-Retrieval successfully gives high scores to responses with high human scores, but it also frequently makes overly confident predictions to responses with low human scores. This false-positive problem is relatively alleviated in DEnsity, as the number of high predictions for low human scores is decreased. One possible limitation of our metric is that it makes confident predictions when responses receive a score higher than 0.8 from human annotators, which implies that our model might not be calibrated well. This behavior would be undesirable to ones that hope to find the best response among reasonably well-written responses. Building a well-calibrated metric for general purposes is left as future work.
DailyDialog Zhao DailyDialog GRADE Scoring Maha. ✓ 56.81 57.03 30.33 29.45 Euclidean ✓ 54.57 56.84 28.97 31.92 Classifier ✓ 53.36 55.14 28.25 29.10 Maha. 46.79 51.97 24.52 27.40 Euclidean 52.88 52.15 30.22 32.04 Classifier 53.17 53.66 22.58 22.12
5.3 Ablation Study
We conduct an ablation study to investigate the impact of each component in our metric. Results are shown in Table 2. We first observe that the correlations of distance-based scoring functions are largely increased with contrastive learning. Such gain is considerably larger for Mahalanobis distance, while there are cases in which the correlation dropped with Euclidean distance. Regarding the comparison between different approaches for response evaluation (classifier vs density estimation), the classifier-based metric performs better than density estimation based metrics when the contrastive loss is not applied. These results imply that contrastive learning is indeed helpful in improving the performance of our metric, by enhancing the quality of the feature space from the selection model. In terms of the two different distance functions, the Mahalanobis distance with usually shows a higher correlation than the Euclidean distance.
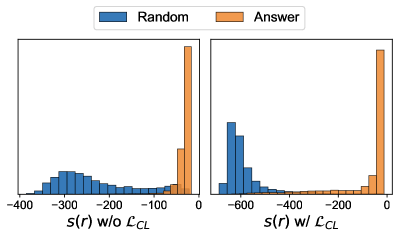
To further investigate the impact of contrastive learning on a feature space from the selection model, we compute DEnsity score of answer responses and random negative responses on the validation set of the original DailyDialog corpus. The score distributions of the selection models trained with or without objective are compared. The score distributions in Fig. 5 confirm that contrastive learning encourages the model to make a more discriminative feature space.
|
||||||||||
|---|---|---|---|---|---|---|---|---|---|---|
| \cdashline0-3 BLEU | 1.00 (1.00) | USL-H | 0.60 (0.49) | |||||||
| USR-R | 0.96 (0.61) | GPT2-Coh. | 0.70 (0.37) | |||||||
| Human | 0.25 (0.26) | DEnsity | 0.39 (0.32) | |||||||
|
||||||||||
| \cdashline0-3 BLEU | 0.00 (0.00) | USL-H | 0.47 (0.34) | |||||||
| USR-R | 0.97 (0.63) | GPT2-Coh. | 0.86 (0.83) | |||||||
| Human | 0.08 (0.14) | DEnsity | 0.11 (0.12) | |||||||
|
||||||||||
| \cdashline0-3 BLEU | 0.00 (0.59) | USL-H | 0.63 (0.59) | |||||||
| USR-R | 0.27 (0.21) | GPT2-Coh. | 0.68 (0.35) | |||||||
| Human | 1.00 (0.86) | DEnsity | 0.95 (0.73) | |||||||
|
||||||||||
| \cdashline0-3 BLEU | 0.00 (0.72) | USL-H | 0.65 (0.72) | |||||||
| USR-R | 0.65 (0.32) | GPT2-Coh. | 0.80 (0.66) | |||||||
| Human | 1.00 (0.86) | DEnsity | 0.98 (0.82) | |||||||
5.4 Case Study
We present sample evaluation results of few selected metrics on the DailyDialogue-Zhao dataset in Table 5.3. While the system responses in the first and second examples look okay, taking a closer look at the dialog history, they are both incoherent. In the first example, the question asked gave two options, but the system responded with an option that was not in the original question. In the second example, the system asks if he (or she) should take the bus, even though he is already waiting for the bus. The low scores from human annotators highlight this incoherency. Baseline metrics like USR-Retrieval and GPT2-Coherency often give high scores to such responses. In contrast, DEnsity outputs low scores, similar to human scores. In the third and fourth example, the system responses receive high scores from the human annotators. BLEU gives low scores to both responses, as there are little word overlap between the answers and system responses. In both examples, DEnsity gives relatively similar scores to human scores.
Model Turn-level Metrics USR-Retrieval 39.4 GPT2-Coherency 30.4 DEnsity 43.3 Dialogue-level Metrics FED 40.1+ DynaEval 49.2+ Human Performance Human (Zhang et al., 2021) 83.0+
5.5 Experiments on Dialogue-level Evaluation
While our experiments generally focus on turn-level response evaluation, we also conduct experiments on dialogue-level evaluation to probe the extensibility of DEnsity on such tasks. To this end, we use the FED dialogue-level evaluation dataset (Mehri and Eskenazi, 2020a), and the “Overall” score is used to calculate the Spearman correlation. We compare DEnsity against some turn-level metrics that were competitive with DEnsity in our turn-level evaluation (USR-Rtv. and GPT2-Coh.). To extend the turn-level evaluation metrics to a dialogue-level evaluation, we simply evaluate every turn in a dialogue, and average their scores. We also include the results of the FED (Mehri and Eskenazi, 2020a) and DynaEval (Zhang et al., 2021) models from the original papers.555We use the results of FED model with 345M parameters, which has a comparable size with other models. The results are shown in Table 4.
The results show that DEnsity shows a higher correlation than other turn-level metrics. This result shows that although our current metric is not explicitly designed to handle dialogue-level evaluations, there is potential for utilizing a density estimation-based evaluation for dialogue-level evaluations. We leave this as our future work.
6 Conclusion
In this paper, we present DEnsity, a new learnable metric for open-domain dialogue systems. DEnsity evaluates a response by estimating its density on the distribution of human conversations. Empirical results on multiple datasets demonstrate that our metric has a higher correlation with human evaluations than other metrics. We hope that DEnsity, a reliable and robust metric for evaluating dialogue systems, contributes to improving evaluation of natural language generation tasks.
Limitations
Our proposed metric is mainly designed for a turn-level evaluation of dialogue systems. We recognize that our metric may not generalize to other evaluation scenarios directly, such as dialogue-level evaluation or human-chatbot interactive setups. As shown in Section 5.5, the easiest way to extend our metric to a multi-turn dialogue evaluation is by evaluating every turn in a dialogue individually, and then aggregating their scores. However, as the dialogue-level evaluation is not considered during the development process of our metric, it is not clear whether such a simple extension would be applicable without a decrease in performance. Nevertheless, as turn-level evaluation is a fundamental component to build a holistic evaluation framework for a dialogue, we believe that it is an important task to investigate better evaluation metrics for individual responses.
Ethics Statement
All experiments are conducted on English datasets only, so the generalizability toward other languages is not verified. Besides, as the current automatic evaluation metrics, including ours, are imperfect, they may introduce unintended favor toward a certain type of responses. Future research should focus on detecting and mitigating such undesirable biases of learnable metrics.
Acknowledgements
This work was supported by Institute for Information & communications Technology Planning & Evaluation(IITP) grant funded by the Korea government(MSIT) (No. 2020-0-00368, A Neural-Symbolic Model for Knowledge Acquisition and Inference Techniques) and the Challengeable Future Defense Technology Research and Development Program through the Agency For Defense Development(ADD) funded by the Defense Acquisition Program Administration(DAPA) in 2022(No. N04220080).
References
- Bak and Oh (2020) JinYeong Bak and Alice Oh. 2020. Speaker sensitive response evaluation model. In Proceedings of the 58th Annual Meeting of the Association for Computational Linguistics, pages 6376–6385, Online. Association for Computational Linguistics.
- Banerjee and Lavie (2005) Satanjeev Banerjee and Alon Lavie. 2005. METEOR: An automatic metric for MT evaluation with improved correlation with human judgments. In Proceedings of the ACL Workshop on Intrinsic and Extrinsic Evaluation Measures for Machine Translation and/or Summarization, pages 65–72, Ann Arbor, Michigan. Association for Computational Linguistics.
- Devlin et al. (2019) Jacob Devlin, Ming-Wei Chang, Kenton Lee, and Kristina Toutanova. 2019. BERT: Pre-training of deep bidirectional transformers for language understanding. In Proceedings of the 2019 Conference of the North American Chapter of the Association for Computational Linguistics: Human Language Technologies, Volume 1 (Long and Short Papers), pages 4171–4186, Minneapolis, Minnesota. Association for Computational Linguistics.
- Dinan et al. (2020) Emily Dinan, Varvara Logacheva, Valentin Malykh, Alexander Miller, Kurt Shuster, Jack Urbanek, Douwe Kiela, Arthur Szlam, Iulian Serban, Ryan Lowe, et al. 2020. The second conversational intelligence challenge (convai2). In The NeurIPS’18 Competition, pages 187–208. Springer.
- Gao et al. (2021) Tianyu Gao, Xingcheng Yao, and Danqi Chen. 2021. SimCSE: Simple contrastive learning of sentence embeddings. In Proceedings of the 2021 Conference on Empirical Methods in Natural Language Processing, pages 6894–6910, Online and Punta Cana, Dominican Republic. Association for Computational Linguistics.
- Ghazarian et al. (2019) Sarik Ghazarian, Johnny Wei, Aram Galstyan, and Nanyun Peng. 2019. Better automatic evaluation of open-domain dialogue systems with contextualized embeddings. In Proceedings of the Workshop on Methods for Optimizing and Evaluating Neural Language Generation, pages 82–89, Minneapolis, Minnesota. Association for Computational Linguistics.
- Gunel et al. (2020) Beliz Gunel, Jingfei Du, Alexis Conneau, and Veselin Stoyanov. 2020. Supervised contrastive learning for pre-trained language model fine-tuning. In International Conference on Learning Representations.
- Gupta et al. (2021) Prakhar Gupta, Yulia Tsvetkov, and Jeffrey Bigham. 2021. Synthesizing adversarial negative responses for robust response ranking and evaluation. In Findings of the Association for Computational Linguistics: ACL-IJCNLP 2021, pages 3867–3883, Online. Association for Computational Linguistics.
- Hendrycks and Gimpel (2016) Dan Hendrycks and Kevin Gimpel. 2016. A baseline for detecting misclassified and out-of-distribution examples in neural networks. arXiv preprint arXiv:1610.02136.
- Holtzman et al. (2019) Ari Holtzman, Jan Buys, Li Du, Maxwell Forbes, and Yejin Choi. 2019. The curious case of neural text degeneration. In International Conference on Learning Representations.
- Huang et al. (2020) Lishan Huang, Zheng Ye, Jinghui Qin, Liang Lin, and Xiaodan Liang. 2020. GRADE: Automatic graph-enhanced coherence metric for evaluating open-domain dialogue systems. In Proceedings of the 2020 Conference on Empirical Methods in Natural Language Processing (EMNLP), pages 9230–9240, Online. Association for Computational Linguistics.
- Khalid and Lee (2022) Baber Khalid and Sungjin Lee. 2022. Explaining dialogue evaluation metrics using adversarial behavioral analysis. In Proceedings of the 2022 Conference of the North American Chapter of the Association for Computational Linguistics: Human Language Technologies, pages 5871–5883, Seattle, United States. Association for Computational Linguistics.
- Khosla et al. (2020) Prannay Khosla, Piotr Teterwak, Chen Wang, Aaron Sarna, Yonglong Tian, Phillip Isola, Aaron Maschinot, Ce Liu, and Dilip Krishnan. 2020. Supervised contrastive learning. Advances in Neural Information Processing Systems, 33:18661–18673.
- Lee et al. (2018) Kimin Lee, Kibok Lee, Honglak Lee, and Jinwoo Shin. 2018. A simple unified framework for detecting out-of-distribution samples and adversarial attacks. Advances in neural information processing systems, 31.
- Lee et al. (2022) Nyoungwoo Lee, ChaeHun Park, Ho-Jin Choi, and Jaegul Choo. 2022. Pneg: Prompt-based negative response generation for dialogue response selection task. In Proceedings of the 2022 Conference on Empirical Methods in Natural Language Processing, pages 10692–10703, Abu Dhabi, United Arab Emirates. Association for Computational Linguistics.
- Li et al. (2017) Yanran Li, Hui Su, Xiaoyu Shen, Wenjie Li, Ziqiang Cao, and Shuzi Niu. 2017. DailyDialog: A manually labelled multi-turn dialogue dataset. In Proceedings of the Eighth International Joint Conference on Natural Language Processing (Volume 1: Long Papers), pages 986–995, Taipei, Taiwan. Asian Federation of Natural Language Processing.
- Li et al. (2021) Zekang Li, Jinchao Zhang, Zhengcong Fei, Yang Feng, and Jie Zhou. 2021. Conversations are not flat: Modeling the dynamic information flow across dialogue utterances. In Proceedings of the 59th Annual Meeting of the Association for Computational Linguistics and the 11th International Joint Conference on Natural Language Processing (Volume 1: Long Papers), pages 128–138, Online. Association for Computational Linguistics.
- Liang et al. (2018) Shiyu Liang, Yixuan Li, and R Srikant. 2018. Enhancing the reliability of out-of-distribution image detection in neural networks. In International Conference on Learning Representations.
- Lin (2004) Chin-Yew Lin. 2004. ROUGE: A package for automatic evaluation of summaries. In Text Summarization Branches Out, pages 74–81, Barcelona, Spain. Association for Computational Linguistics.
- Liu et al. (2016) Chia-Wei Liu, Ryan Lowe, Iulian Serban, Mike Noseworthy, Laurent Charlin, and Joelle Pineau. 2016. How NOT to evaluate your dialogue system: An empirical study of unsupervised evaluation metrics for dialogue response generation. In Proceedings of the 2016 Conference on Empirical Methods in Natural Language Processing, pages 2122–2132, Austin, Texas. Association for Computational Linguistics.
- Loshchilov and Hutter (2018) Ilya Loshchilov and Frank Hutter. 2018. Decoupled weight decay regularization. In International Conference on Learning Representations.
- Lowe et al. (2017) Ryan Lowe, Michael Noseworthy, Iulian Vlad Serban, Nicolas Angelard-Gontier, Yoshua Bengio, and Joelle Pineau. 2017. Towards an automatic Turing test: Learning to evaluate dialogue responses. In Proceedings of the 55th Annual Meeting of the Association for Computational Linguistics (Volume 1: Long Papers), pages 1116–1126, Vancouver, Canada. Association for Computational Linguistics.
- Mehri and Eskenazi (2020a) Shikib Mehri and Maxine Eskenazi. 2020a. Unsupervised evaluation of interactive dialog with dialogpt. In Proceedings of the 21th Annual Meeting of the Special Interest Group on Discourse and Dialogue, pages 225–235.
- Mehri and Eskenazi (2020b) Shikib Mehri and Maxine Eskenazi. 2020b. USR: An unsupervised and reference free evaluation metric for dialog generation. In Proceedings of the 58th Annual Meeting of the Association for Computational Linguistics, pages 681–707, Online. Association for Computational Linguistics.
- Pang et al. (2020) Bo Pang, Erik Nijkamp, Wenjuan Han, Linqi Zhou, Yixian Liu, and Kewei Tu. 2020. Towards holistic and automatic evaluation of open-domain dialogue generation. In Proceedings of the 58th Annual Meeting of the Association for Computational Linguistics, pages 3619–3629, Online. Association for Computational Linguistics.
- Papineni et al. (2002) Kishore Papineni, Salim Roukos, Todd Ward, and Wei-Jing Zhu. 2002. Bleu: a method for automatic evaluation of machine translation. In Proceedings of the 40th Annual Meeting of the Association for Computational Linguistics, pages 311–318, Philadelphia, Pennsylvania, USA. Association for Computational Linguistics.
- Park et al. (2021) ChaeHun Park, Eugene Jang, Wonsuk Yang, and Jong Park. 2021. Generating negative samples by manipulating golden responses for unsupervised learning of a response evaluation model. In Proceedings of the 2021 Conference of the North American Chapter of the Association for Computational Linguistics: Human Language Technologies, pages 1525–1534, Online. Association for Computational Linguistics.
- Paszke et al. (2019) Adam Paszke, Sam Gross, Francisco Massa, Adam Lerer, James Bradbury, Gregory Chanan, Trevor Killeen, Zeming Lin, Natalia Gimelshein, Luca Antiga, et al. 2019. Pytorch: An imperative style, high-performance deep learning library. Advances in neural information processing systems, 32.
- Pennington et al. (2014) Jeffrey Pennington, Richard Socher, and Christopher Manning. 2014. GloVe: Global vectors for word representation. In Proceedings of the 2014 Conference on Empirical Methods in Natural Language Processing (EMNLP), pages 1532–1543, Doha, Qatar. Association for Computational Linguistics.
- Phy et al. (2020) Vitou Phy, Yang Zhao, and Akiko Aizawa. 2020. Deconstruct to reconstruct a configurable evaluation metric for open-domain dialogue systems. In Proceedings of the 28th International Conference on Computational Linguistics, pages 4164–4178.
- Pillutla et al. (2021) Krishna Pillutla, Swabha Swayamdipta, Rowan Zellers, John Thickstun, Sean Welleck, Yejin Choi, and Zaid Harchaoui. 2021. Mauve: Measuring the gap between neural text and human text using divergence frontiers. Advances in Neural Information Processing Systems, 34:4816–4828.
- Radford et al. (2019) Alec Radford, Jeffrey Wu, Rewon Child, David Luan, Dario Amodei, and Ilya Sutskever. 2019. Language models are unsupervised multitask learners. OpenAI Blog, 1(8):9.
- Sai et al. (2020) Ananya B. Sai, Akash Kumar Mohankumar, Siddhartha Arora, and Mitesh M. Khapra. 2020. Improving dialog evaluation with a multi-reference adversarial dataset and large scale pretraining. Transactions of the Association for Computational Linguistics, 8:810–827.
- See et al. (2017) Abigail See, Peter J. Liu, and Christopher D. Manning. 2017. Get to the point: Summarization with pointer-generator networks. In Proceedings of the 55th Annual Meeting of the Association for Computational Linguistics (Volume 1: Long Papers), pages 1073–1083, Vancouver, Canada. Association for Computational Linguistics.
- Sellam et al. (2020) Thibault Sellam, Dipanjan Das, and Ankur Parikh. 2020. BLEURT: Learning robust metrics for text generation. In Proceedings of the 58th Annual Meeting of the Association for Computational Linguistics, pages 7881–7892, Online. Association for Computational Linguistics.
- Sharma et al. (2017) Shikhar Sharma, Layla El Asri, Hannes Schulz, and Jeremie Zumer. 2017. Relevance of unsupervised metrics in task-oriented dialogue for evaluating natural language generation. CoRR, abs/1706.09799.
- Sinha et al. (2020) Koustuv Sinha, Prasanna Parthasarathi, Jasmine Wang, Ryan Lowe, William L. Hamilton, and Joelle Pineau. 2020. Learning an unreferenced metric for online dialogue evaluation. In Proceedings of the 58th Annual Meeting of the Association for Computational Linguistics, pages 2430–2441, Online. Association for Computational Linguistics.
- Speer et al. (2017) Robyn Speer, Joshua Chin, and Catherine Havasi. 2017. Conceptnet 5.5: An open multilingual graph of general knowledge. In Thirty-first AAAI conference on artificial intelligence.
- Sutskever et al. (2014) Ilya Sutskever, Oriol Vinyals, and Quoc V Le. 2014. Sequence to sequence learning with neural networks. Advances in neural information processing systems, 27.
- Tao et al. (2018) Chongyang Tao, Lili Mou, Dongyan Zhao, and Rui Yan. 2018. Ruber: An unsupervised method for automatic evaluation of open-domain dialog systems. In Thirty-Second AAAI Conference on Artificial Intelligence.
- Vaswani et al. (2017) Ashish Vaswani, Noam Shazeer, Niki Parmar, Jakob Uszkoreit, Llion Jones, Aidan N Gomez, Łukasz Kaiser, and Illia Polosukhin. 2017. Attention is all you need. Advances in neural information processing systems, 30.
- Winkens et al. (2020) Jim Winkens, Rudy Bunel, Abhijit Guha Roy, Robert Stanforth, Vivek Natarajan, Joseph R Ledsam, Patricia MacWilliams, Pushmeet Kohli, Alan Karthikesalingam, Simon Kohl, et al. 2020. Contrastive training for improved out-of-distribution detection. arXiv preprint arXiv:2007.05566.
- Wolf et al. (2020) Thomas Wolf, Lysandre Debut, Victor Sanh, Julien Chaumond, Clement Delangue, Anthony Moi, Pierric Cistac, Tim Rault, Rémi Louf, Morgan Funtowicz, Joe Davison, Sam Shleifer, Patrick von Platen, Clara Ma, Yacine Jernite, Julien Plu, Canwen Xu, Teven Le Scao, Sylvain Gugger, Mariama Drame, Quentin Lhoest, and Alexander M. Rush. 2020. Transformers: State-of-the-art natural language processing. In Proceedings of the 2020 Conference on Empirical Methods in Natural Language Processing: System Demonstrations, pages 38–45, Online. Association for Computational Linguistics.
- Xiang et al. (2021) Jiannan Xiang, Yahui Liu, Deng Cai, Huayang Li, Defu Lian, and Lemao Liu. 2021. Assessing dialogue systems with distribution distances. In Findings of the Association for Computational Linguistics: ACL-IJCNLP 2021, pages 2192–2198, Online. Association for Computational Linguistics.
- Xu et al. (2020) Hong Xu, Keqing He, Yuanmeng Yan, Sihong Liu, Zijun Liu, and Weiran Xu. 2020. A deep generative distance-based classifier for out-of-domain detection with mahalanobis space. In Proceedings of the 28th International Conference on Computational Linguistics, pages 1452–1460, Barcelona, Spain (Online). International Committee on Computational Linguistics.
- Zhang et al. (2021) Chen Zhang, Yiming Chen, Luis Fernando D’Haro, Yan Zhang, Thomas Friedrichs, Grandee Lee, and Haizhou Li. 2021. DynaEval: Unifying turn and dialogue level evaluation. In Proceedings of the 59th Annual Meeting of the Association for Computational Linguistics and the 11th International Joint Conference on Natural Language Processing (Volume 1: Long Papers), pages 5676–5689, Online. Association for Computational Linguistics.
- Zhang et al. (2019) Tianyi Zhang, Varsha Kishore, Felix Wu, Kilian Q Weinberger, and Yoav Artzi. 2019. Bertscore: Evaluating text generation with bert. In International Conference on Learning Representations.
- Zhao et al. (2020) Tianyu Zhao, Divesh Lala, and Tatsuya Kawahara. 2020. Designing precise and robust dialogue response evaluators. In Proceedings of the 58th Annual Meeting of the Association for Computational Linguistics, pages 26–33, Online. Association for Computational Linguistics.
- Zhou et al. (2021) Wenxuan Zhou, Fangyu Liu, and Muhao Chen. 2021. Contrastive out-of-distribution detection for pretrained transformers. In Proceedings of the 2021 Conference on Empirical Methods in Natural Language Processing, pages 1100–1111, Online and Punta Cana, Dominican Republic. Association for Computational Linguistics.
Appendix
Appendix A Baseline Details
We present further implementation details in baseline metrics. For BLEU, we use BLEU-2 score with NLTK library666https://www.nltk.org/. For ROUGE, we use F-score of ROUGE-L. For METEOR, we use NLTK library777https://www.nltk.org/. For Embedding Average/Greedy/Extrema, we use an evaluation toolkit released by Sharma et al. (2017) with GloVe (Pennington et al., 2014) embedding. For BERTScore, we use the default roberta-large model in the official implementation888https://github.com/Tiiiger/bert_score, and use F1 score between answer and generated responses for evaluation. For SimCSE, we use princeton-nlp/sup-simcse-bert-base-uncased model in the Huggingface Hub999https://huggingface.co/princeton-nlp/sup-simcse-bert-base-uncased, and compute the cosine similarity between answer and generated responses for evaluation. For BLEURT, we use Elron/bleurt-tiny-512 model in the Huggingface Hub101010https://huggingface.co/Elron/bleurt-tiny-512. For USR-MLM, we train bert- base-uncased model with learning rate, train epochs, and batch size as 5e-5 and 1, and 16, respectively. For GPT2-Coherency, we train 12-layer gpt2 model with learning rate, maximum train epochs, and batch size as 5e-5, 10, and 16, respectively. For BERT-RUBER, we use bert-base-uncased as an contextualized word embedding, and train the model with learning rate, maximum train epoch, and batch size as 1e-4, 10, and 16, respectively. For USR-Retrieval, we train bert-base-uncased model with learning rate, train epochs, and batch size as 5e-5, 10, and 16, respectively. For USL-H, we use an official implementation111111https://github.com/vitouphy/usl_dialogue_metric to train and evaluate models. For FlowScore and DynaEval, we use official models121212https://github.com/ictnlp/DialoFlow131313https://github.com/e0397123/DynaEval for evaluation. All baseline models trained in our experiments utilize the same training environments with our metric (e.g., optimizer, max sequence length) unless specified otherwise. When evaluating reference-free models, the dialogue corpus for the training of models and the original dialogue corpus that derives an evaluation dataset are matched. For instance, we use DynaEval model trained on DailyDialog dataset for the evaluations on DailyDialog-Zhao and DailyDialog-GRADE datasets.
Appendix B Further Implementation Details
We evaluate our selection model after every train epoch, and select the best model based on its recall@1 score on the validation set of the original dialogue corpus. All the learnable metrics are implemented with PyTorch (Paszke et al., 2019). We use Transformers framework (Wolf et al., 2020) from Huggingface141414https://huggingface.co/ to implement transformer (Vaswani et al., 2017)-based models. In overall experiments, two 3090 RTX GPU with 24GB of memory are used.
Appendix C Additional Results
DailyDialog ConvAI2 Model R@1 MRR R@1 MRR 88.8 93.38 85.16 90.97 90.62 93.96 85.99 91.48
C.1 Impacts of Contrastive Learning on Response Selection Task
To more comprehensively understand the effect of contrastive learning on our feature extractor (), we report the impacts of our contrastive learning objective on the performance of the response selection task. Specifically, we compare the selection model trained with both the response selection task and contrastive learning () against the model trained solely with response selection task (). Recall@1 and mean reciprocal rank (MRR) metrics are used to measure the selection accuracy. We evaluate both models on the test splits of DailyDialog and ConvAI2 datasets. As shown in Table 5, we observe that contrastive learning improves the performance on the original task on which the selection models are trained.