Updated Orbital Ephemeris and Detection of Superhump Modulation in X-ray Band for the Ultra-Compact Low Mass X-ray Binary 4U 1820-30
Abstract
The 4U 1820-30 is a ultra-compact low mass X-ray binary (LMXB) near the center of the globular cluster NGC 6624. Its negative orbital period derivative, observed from the phase evolution of its sinusoidal-like orbital variation, contradicts the positive value obtained from the theoretical prediction. In this paper, we present the analysis of the 4U 1820-30 orbital modulation from light curves obtained from the Neutron star Interior Composition ExploreR (NICER) observations from 2017 to mid 2022. Combined with historical records, the orbital derivative is measured from the orbital phase evolution between 1976 and 2002 is yr-1. No significant second order orbital period derivative is detected with a 2 upper limit of s s-2. We discuss the possible intrinsic orbital period derivative of 4U 1820-30 and suggest that this binary system may have a significant mass outflow similar to some other LMXBs. In addition, a periodic modulation with a period of s, which is consistent with the superhump period discovered in the far ultraviolet band of the Hubble Space Telescope, was also detected in in the X-ray light curves collected by NICER. We conclude that such modulation is probably caused by a period of day apsidal precession of accretion disk similar to the SU UMa type dwarf novae and some LMXBs. However we cannot exclude the possibility that it is induced by a hierarchical third star orbiting around the binary system.
1 Introduction
The ultra-compact low mass X-ray binary (LMXB) 4U 1820-30, located near the center of the globular cluster NGC 6624, was discovered by Giacconi et al. (1974). The detection of its Type I X-ray burst (Grindlay et al., 1976) indicated that the accretor of this accreting system is a neutron star. Stella et al. (1987) first reported its sinusoidal-like orbital modulation in X-ray band with a period of 685.0118 s. This orbital period is the shortest among all known LMXBs making 4U 1820-30 the most compact X-ray binary whose mass-losing companion is a Roche-lobe filling helium white dwarf with a mass of 0.06-0.08 (Rappaport et al., 1987). Priedhorsky & Terrell (1984) discovered a long-term variation in 4U 1820-30 luminosity by a factor of 3 with a period of of 176 days detected from the observations of the Vela 5B spacecraft. In addition to revising the period to be 171.0030.326 days, Chou & Grindlay (2001) found that this period is stable for over 30 years with a period change rate and proposed that 4U 1820-30 could be a hierarchical triple with a third star orbiting the binary system with a period of 1.1 days, inducing binary orbital eccentricity modulations with a period of 171 days (Mazeh & Shaham, 1979; Grindlay, 1988). This long-term periodicity was further confirmed by Šimon (2003).
In addition to the orbital modulation observed in the X-ray band, Anderson et al. (1997) discovered a modulation with a period of 6872.4 s in the ultraviolet (UV) band from the Hubble Space Telescope (HST). Although this period is slightly longer than the orbital period detected in the X-ray band, the difference is not sufficiently significant to distinguish between them. On the other hand, from the far-ultraviolet (FUV) light curve collected by HST, Wang & Chakrabarty (2010) reported the discovery of a period of 693.51.3 s modulation, whose period is only 1% longer but significantly different from the orbital period detected in the X-ray band. They suggested that this period is superhump period although it might be consistent with the hierarchical triple system model.
Since the discovery of orbital modulation by Stella et al. (1987), several studies were conduct to refine the orbital period and constrain the orbital period derivative from historical and newly observed data, such as Smale et al. (1987), Morgan et al. (1988) and Sansom et al. (1989). The first significant orbital derivative of 4U 1820-30 was detected by Tan et al. (1991) with a value of . This value was further refined by van der Klis et al. (1993a, b) and Chou & Grindlay (2001). After combining all the observations in the X-ray band, Peuten et al. (2014) reported the latest value of orbital period derivative as using the orbital modulation phase observed from 1976 to 2010. All the aforementioned detected values indicate that the orbital period derivative is negative, which contradicts to the theoretical predicted lower limit ( ) proposed by Rappaport et al. (1987), who considered 4U 1820-30 to be an accreting system that consists of a neutron star and a mass-losing helium white dwarf. Even when considering other effects, such as tidal dissipation in the white dwarf driven by the eccentricity of the binary system, the intrinsic orbital derivative may be lower but should still be positive (Prodan & Murray, 2012).
To explain the contradiction between the observed (negative) and theoretically predicted (positive) values of the orbital derivative of 4U 1820-30, several scenarios have been proposed. Tan et al. (1991) first suggested that this deviation might be caused by the binary system accelerating in the gravitational potential of globular cluster, which was supported by Chou & Grindlay (2001). However, with consideration of the projected location of 4U 1820-30 in the globular cluster, distance of NGC 6624 and mass distribution evaluated by the mass-to-light ratio across the cluster, the maximum acceleration from the gravitational potential of the globular cluster () is approximately an order of magnitude smaller than the one that is required to explain the disparity between theoretical and observed orbital period derivative values () (Prodan & Murray, 2012; Peuten et al., 2014). Peuten et al. (2014) discussed some other possibilities got further accelerating the binary system, including stellar mass dark remnant, intermediate-mass black hole and central concentration of dark remnants. To preserve the stability of the triple system, which is considered the cause of 171 days of long-term modulation (Chou & Grindlay, 2001), as well as the abnormal period derivative of three pulsars (J1823-3021A, B, C) in NGC 6624, the central concentration of dark remnants is the most likely scenario to explain the discrepancy. On the other hand, Jiang et al. (2017) suggested that the negative orbital period derivative observed in 4U 1820-30 is possibly produced by the temporary circumbinary disk which can effectively extracted the orbital angular momentum from the binary system through resonant interaction.
In this paper, we present our analysis results for the orbital modulation of 4U 1820-30 using the Neutron star Interior Composition ExploreR (NICER) observations from 2017 to 2022. Combined with historical records, the orbital phase evolution of 46 years enable us not only to further refine the orbital period but also measure or constrain the second order orbital derivative ()in order to verify the possible scenarios for the negative orbital derivative observed in 4U 1820-30. In section 2, we describe the NICER observations of 4U 1820-30, as well as data screening and grouping. The data analysis results are demonstrated in section 3, including the update of the orbital period derivative (), constraint on the second order orbital derivative (), and detection of a period of s superhump modulation in X-ray light curve. In section 4.1, we discuss the possible intrinsic orbital period derivative and suggest that the observed orbital period derivative of 4U 1820-30 is improper for inferring the gravitational acceleration in NGC 6624. Finally, the superhump and hierarchical triple interpretations for the period of s modulation are also demonstrated in Section 4.2.
2 Observations and Data Reduction
NICER (Gendreau & Arzoumanian, 2017), aboard the International Space Station, is a soft X-ray telescope designed to investigate neutron stars through X-ray timing. Its X-ray Timing Instrument (XIT) is composed 56 X-ray concentrators (XRCs) and associated Focal Plane Modules (FPMs). The 56 FPMs are further divided into seven groups, each group consisting of eight FPMs, controlled by a Management and Power Unit (MPU). There are four FPMs, including detector ID 11, 20, 22 and 60, which have been inactive since launched as indicated in the NICER Mission Guide111.
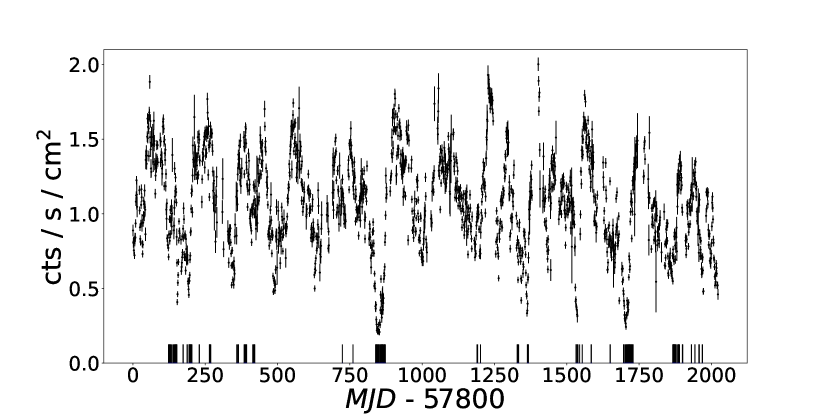
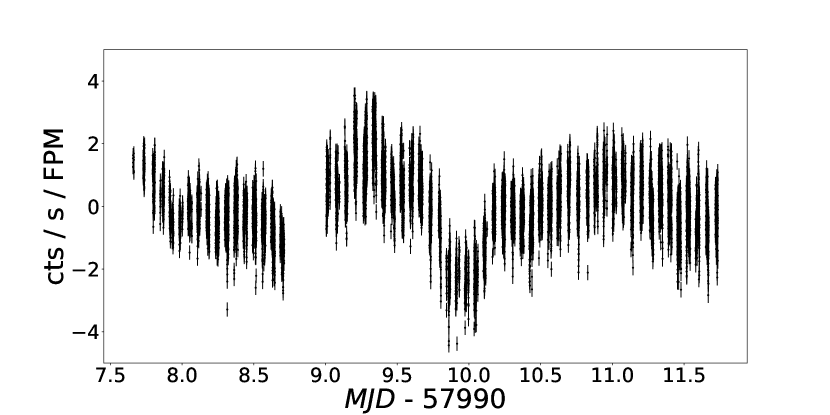
NICER made 173 observations of 4U 1820-30 between June 26 2017 and July 9 2022 (Figure 1). All data files analyzed in this study were reduced using NICERDAS version 9, as a part of HEASOFT v6.30. The events were filtered using the standard screening criteria described in the NICER Mission Guide. Their photon arrival times were corrected to the barycenter of the solar system using the tool barycorr by applying the JPL solar planetary ephemeris DE430. However, the barycenter correction could not be processed for observations with ObsID 0050300118, 1050300103, 2050300119, 5604010304 and 5604010305 because the orbital files did not match the corresponding data222See , therefore these observations were removed from the analysis. To reduce the noise and background, only the events with both slow and fast chains triggered and an energy range between 1 and 10 keV (i.e. PI values between 100 and 1000) were selected for further analysis.
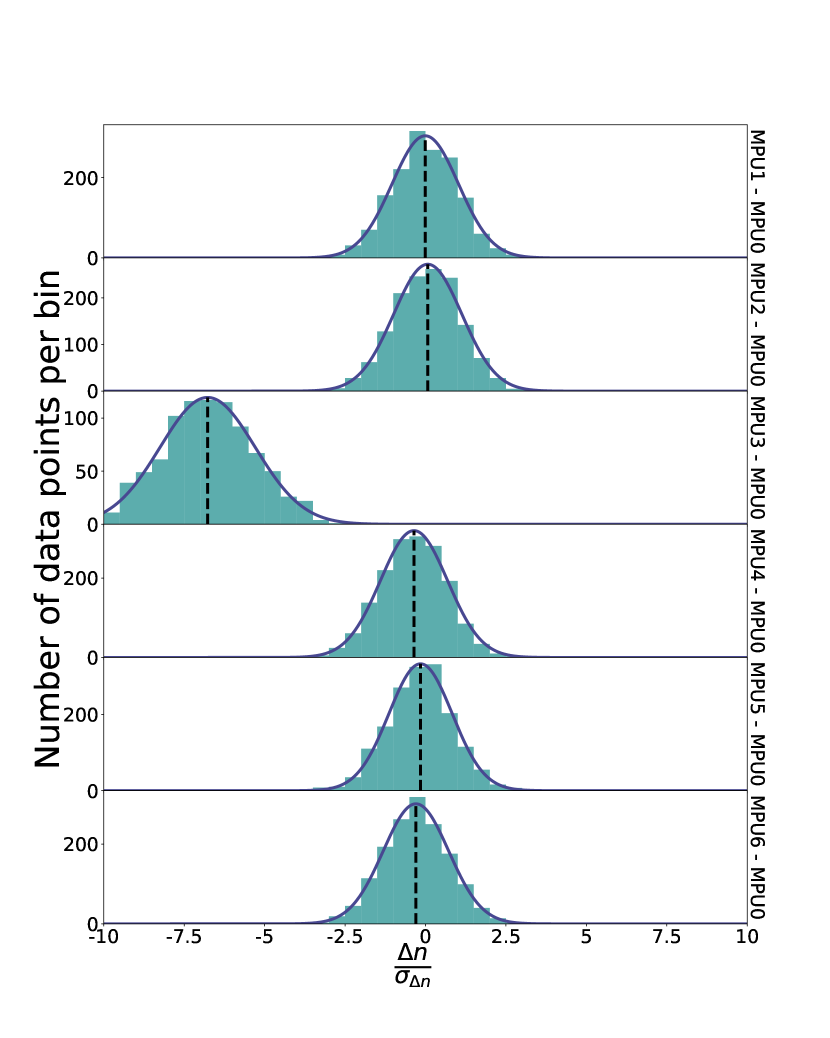
However, we found that the number of active FPMs was less than 52 after data screening in certain observations, for example, only 47 active FPMs for the observation with ObsID 4680010126. Therefore, for the light curves, we normalized the count rate to the number of active FPMs, i.e., cts/s/FPM, in this work. Furthermore, some observations showed significantly lower exposure times in an MPU (mostly in MPU3) than in others. Hence, we performed the following process to identify low-exposure MPU. First, all events in an observation were binned into 1 s bin where is the number of the events of the ith MPU in this bin. is defined as the being normalized by the number of active FPMs in this MPU, i.e., where is the number of active FPMs in the ith MPU and the uncertainty of can be written as . Taking MPU0 as a reference because the low exposure has never been observed in this MPU, we defined deviation as thus, the corresponding uncertainty is . We expected that if the exposure time of the ith MPU was the same as that for MPU0. Figure 2 shows the distributions of for an observation in which the centroid of is significantly lower than the others. Therefore, we considered the mean deviation larger than 1 as the low exposure time and the events in this MPU were removed from the analysis. Finally, several Type-I X-ray bursts were detected in all observations. Burst events, detected 100 s after the beginning of the bursts, were also excluded from analysis.
Because the orbital variation of 4U 1820-30 in the X-ray band is rather weak ( 3% peak-to-peak), to significantly detect the modulation profile, a light curve with sufficient long exposure time is essential. However, the exposure times of many observations were too short to detect the orbital modulation. Therefore we attempted to combine consecutive observations with short exposure times to create a group to make the light curve. The total exposure time of each group was at least 2000 s with the total time span of less than six days to minimize the trend due to long-term (171 days) variation. All other sporadic observations with short exposure times were excluded from the analysis. Table 1 shows the grouping of observations for the analysis described in the following section.
3 Data Analysis
3.1 Orbital Period Derivative
The events selected for each group were binned to a light curve with a bin size of 1 s. Because there were 171 days of long-term modulation, to correctly obtain the orbital modulation profile, we removed the trend by fitting a polynomial up to 4th order for each the light curve. The de-trended light curves were folded using the revised linear ephemeris proposed by Peuten et al. (2014).
| (1) |
where is the time of the maximum intensity of the Nth cycle and is the cycle count. However, a small number of the folded light curves showed insignificant orbital modulation. We applied analysis of variance (AoV) (Schwarzenberg-Czerny, 1989) to filter them out. In AoV, the variable is defined as
| (2) |
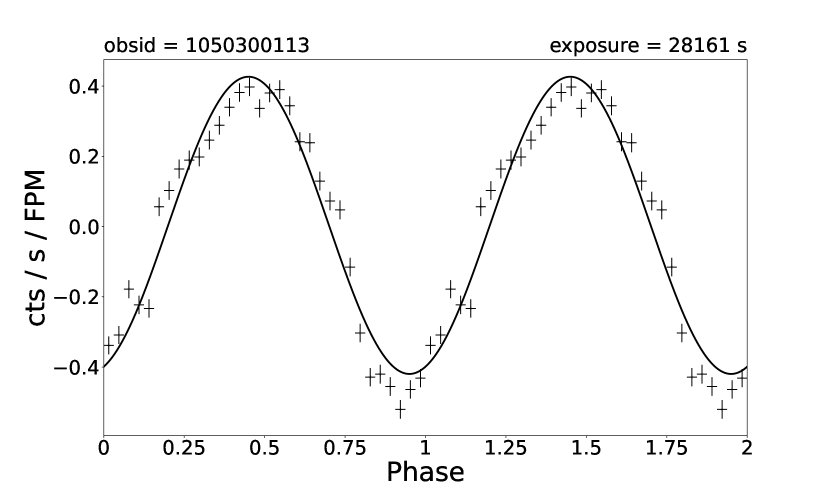
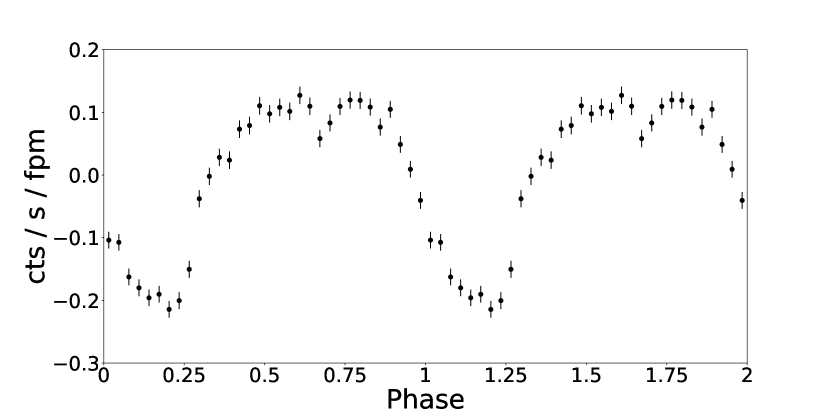
where is the total number of the data points in the light curve, is the average count rate of the light curve, is the number of bins in the folded light curve, is the number of data points in the ith bin of the folded light curve, is the average count rate in the ith bin of the folded light curve and is the jth count rate of the light curve in the ith bin of the folded light curve. If the light curve is pure Gaussian white noise, follows the F-distribution with and degrees of freedom. We selected for the testing process. Only the folded light curves with false alert probability less than 0.0053 (approximately more than 3 significance) were accepted for further analysis. Each folded light curves with significant orbital modulation detection was then fitted by a single sinusoidal function and the maximum value of the fitted curve was taken as fiducial point for the orbital phase. A typical orbital modulation profile is shown in Figure 3. In a manner similar to that done by Chou & Grindlay (2001) and Peuten et al. (2014), we combined the orbital phases of each year using weighted averaging. The phase jitter, as seen in Rossi X-ray Timing Explorer (RXTE) data Chou & Grindlay (2001), can be observed in the phases of each year. Therefore, we estimated the phase jitter value for each year based on the standard deviation of the phases of the year. The final error for the phase of each year was evaluated by quadratically adding the phase jitter and average phase error from the fitting of the folded light curve. The mean arrival time of the average phase for each year was calculated using the Equation 2 in Chou & Grindlay (2001). The average orbital phases measured from 2017 to 2022 NICER observations are listed in Table 2.
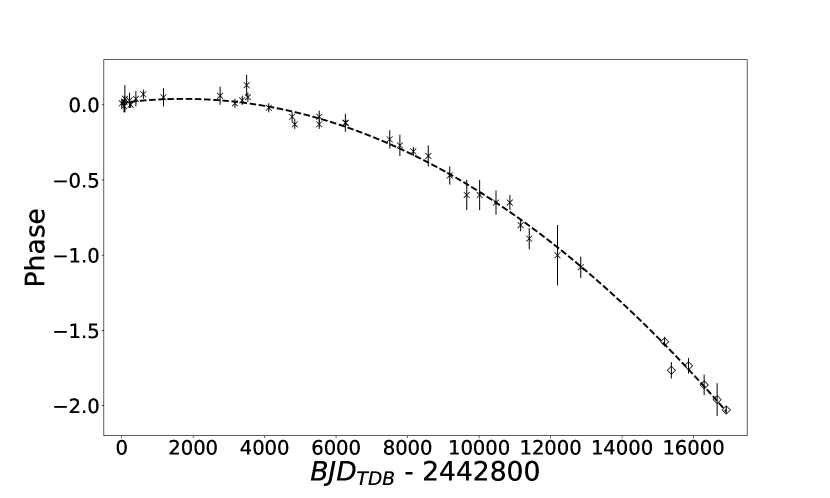
In combination with the historical records of the orbital phases listed in Table 1 of Peuten et al. (2014), the evolution of the orbital phases of 4U 1820-30 measured between 1976 and 2022 are shown in Figure 4. Given that a significant orbital period derivative has been detected (, Peuten et al., 2014), we directly fitted the orbital phase evolution with the quadratic function shown in Eq 3 assuming that the orbital period derivative () was a constant over the entire time span of years
| (3) |
where is the orbital period at the expected phase zero epoch , , s and where is mean arrival time of the average phase of each year. We obtained a reasonable fitting with . This fitting results give an orbital period derivative of s s-1, or yr-1, which is almost identical to those found by van der Klis et al. (1993b) and Peuten et al. (2014) but with smaller uncertainty. The quadratic ephemeris can be updated as follows:
| (4) |
We also attempted to probe the second order orbital period derivative () suggested by Peuten et al. (2014). We fitted the phase evolution with a cubic function and obtained a second order orbital period derivative of s s-2 with . In comparison with quadratic model, the F-test gave an F-value of 0.13 and a p-value of 0.72, which implied that the cubic model improved the fitting with confidence level only 28%. We therefore conclude that there is no significant second order orbital period that can be detected with a upper limit of s s-2
3.2 Search for Superhump Modulation in X-ray Light Curves
Wang & Chakrabarty (2010) discovered a periodic modulation in the FUV light curves of 4U 1820-30 with a period of 693.5 s, using data collected by the HST. They suggested that this modulation, which has a period about 1.2% longer than the orbital period, is the superhump period, based on similarities between 4U 1820-30 and the dipping LMXB X 1916-053. In X 1916-053, the superhump period is not only seen in the optical band but also in X-ray light curves (Chou et al., 2001). For 4U 1820-30, the sinusoidal-like orbital modulation in the X-ray band is believed to be caused by absorption of structures in the disk rim, similar to X-ray dipping sources (Stella et al., 1987). Therefore, it is likely that the superhump modulation is detectable in the X-ray light curves of 4U 1820-30.
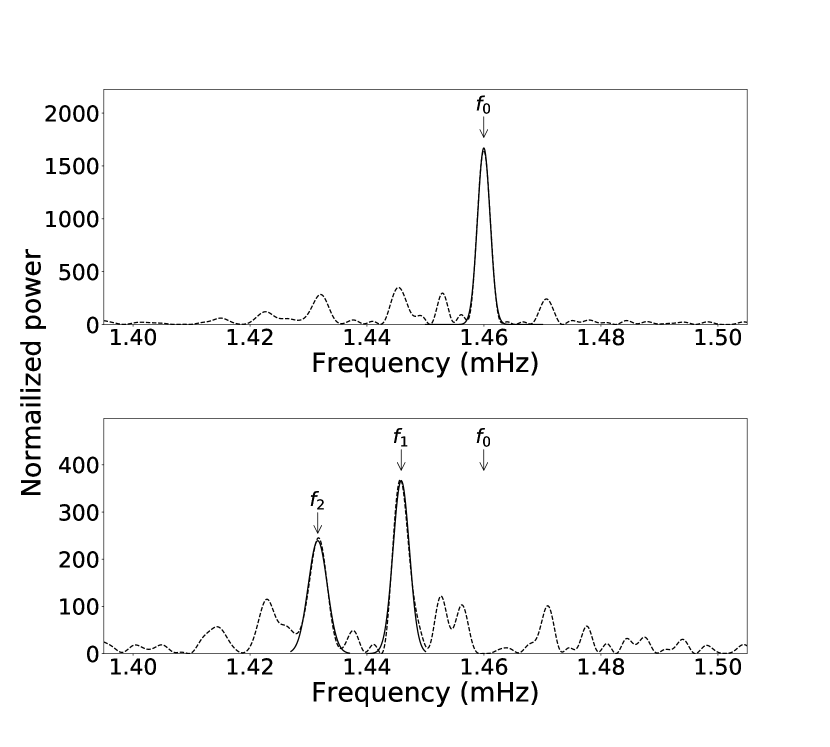
To resolve the superhump modulation signal (693 s) from the orbital variation (685 s) in the power spectrum, as well as to avoid too much alias induced by the observation gaps, a continuous observation with a time span much more than 0.8 day was preferred. We found that the NICER observations made between September 1 to 5 2017 with ObsId from 1050300111 to 1050300115 were suitable for searching for superhump modulation. The trend-removed light curve, with a total exposure time of 104 ks and time span of 4 days is shown in Figure 5. To search for the periodicity of this 1 s binned light curve, we adopted the Lomb-Scargle (LS) periodogram (Scargle, 1982) to obtain the power spectrum as shown in Figure 6. The most significant peak is located at 1.46 mHz, which is caused by the orbital modulation. Similar to the analysis performed by Wang & Chakrabarty (2010), we fitted a Gaussian function to the main peak and obtained the peak frequency mHz, corresponding to a period of s. In addition to the main peak, several smaller peaks were observable. To identify whether these peaks were true signal or alias induced by observation gaps and orbital modulation, we fitted the light curve by a constant plus a sinusoidal function with a frequency fixed at 1.46 mHz to model the sinusoidal-like orbital modulation, and then subtracted the model from it. The residual light curve was analyzed again using the LS periodogram. The main peak from the orbital modulation was completely eliminated, but two significant peaks, which were evidently not the alias caused by the main peak and observation gaps, could be clearly observed in the power spectrum of residual (shown in Figure 6). The Gaussian fitting to these two peaks resulted in a frequency of mHz, corresponding to a period of s, which was close to the s superhump period proposed by Wang & Chakrabarty (2010)333Actually, in Wang & Chakrabarty (2010), the superhump frequency was found to be mHz, whose corresponding period should be s instead of s. This revised period is consistent to what we found in this work. for the most significant peak and mHz, whose corresponding period is s, for the other peak. We noticed that the relation between the frequency of the main peak and the frequencies of the two peaks from the residual light curve could be written as mHz where n=1 or 2. This indicates that the two peaks detected in the residual light curve power spectrum are the beat sidebands of a period of days modulation. We concluded that 4U 1820-30 is a superhump LMXB with accretion processing in a period of 0.8 days and the period of the most significant peak (i.e. s) is the superhump period, as the one detected in the FUV band (Wang & Chakrabarty, 2010). Figure 7 shows the residual light curve folded by the superhump period where the peak-to-peak amplitude is approximately 1%. Further discussions about the superhump in 4U 1820-30 are presented in section 4.2.
4 Discussion
4.1 Orbital Period Change Rate
Using the phases obtained by the orbital modulations detected by the NICER 2017-2022 observations, we updated the orbital ephemeris of 4U 1820-30 by combining all historical records listed in Table 1 of Peuten et al. (2014). The orbital period derivative evaluated from 46 years’ baseline observations is , which is almost identical but more precise to the values reported by van der Klis et al. (1993b) and Peuten et al. (2014), and similar to the one proposed by Chou & Grindlay (2001) whose deviation may be caused by phase jitter effect. No significant second order orbital derivative was detected with s (2 upper limit). This indicates that the observed orbital period derivative of 4U 1820-30 was very stable, at least from 1976 to 2022. The observed negative is incompatible to positive orbital period derivative ( ) predicted by the standard scenario proposed by Rappaport et al. (1987). Although the orbital period derivative may be lower if other effects (e.g. tidal dissipation in the white dwarf driven by the eccentricity of binary system (Prodan & Murray, 2012)) are considered, it should be still positive (Peuten et al., 2014).
The most popular scenario for explaining the discrepancy between the theoretical and observed values of the orbital period derivative is the acceleration of the binary system by the gravitation potential in the globular cluster NGC 6624 (Tan et al., 1991; Chou & Grindlay, 2001; Peuten et al., 2014). In this scenario, the observed orbital period derivative can be express as
| (5) |
(Phinney, 1992; Perera et al., 2017) where is the observed orbital period derivative, is the intrinsic orbital period derivative in the rest frame from the binary orbital evolution and is the line-of-sight acceleration from the cluster potential where means that the acceleration is towards the observer. Here, we ignore some other effects, such as the differential Galactic acceleration, acceleration towards the Galactic plane, and Shklovskii effect (Shklovskii, 1970), whose contributions to the observed orbital period derivative are only approximately to (Peuten et al., 2014; Perera et al., 2017), i.e. much smaller than the observed orbital derivative ( ). Our observation results show that the observed orbital period derivative is stable over 46 years, which implies that it is highly possible that both the intrinsic orbital period derivative and the external effect (e.g. acceleration in the globular cluster) are stable because it is very unlikely that the higher order terms of these two effects (i.e. and ) have almost identical values but different signs to be canceled out to each other.
However, based on the cluster profile evaluated from the surface brightness and project radius of 4U 1820-30 to the center of NGC 6624, Peuten et al. (2014) found that the maximum acceleration of 4U 1820-30 was only , i.e. insufficient for explaining the observed orbital period derivative. Peuten et al. (2014) discussed several possibilities for further accelerate of this binary system in the globular cluster NGC 6624. The first is that the binary system is accelerated by a flyby stellar size dark remnant, which can be a white dwarf, neutron star, or stellar size black hole. To preserve 4U 1820-30 as a triple system, which is currently the only way to explain the 171 days’ periodic modulation, the mass of the dark remnant cannot exceed 6 , otherwise the triple system will be destroyed due to the tidal force. Thus, a low mass dark remnant is preferred. On the other hand, the time span to maintain sufficient large acceleration to explain the binary’s orbital period derivative would be shorter for lower mass dark remnant (20-160 years for 1-5.5 , respectively), which makes it a short-lived phenomenon. From the 2 upper limit of the second order orbital derivative, the variation time scale of , , would be longer than 65 years. However, if we consider the intrinsic orbital derivative, which is at least yr-1, from Eq 5, the variation time scale of would be larger than 177 years under the assumption that is a constant. Although this possibility cannot be completely excluded, the flyby dark remnant scenario appears unlikely to explain these observational results. In addition, it is scenario is very difficult to explain the spin period derivatives detected in the other three pulsars (PSR J1823-3021A,B,C) (see Peuten et al., 2014, Table 2) in NGC 6624 because the probability of the these four sources experiencing similar flyby remnants simultaneously is very low (Peuten et al., 2014).
Another scenario discussed by Peuten et al. (2014) is that the binary system may be accelerated by an intermediate-mass black hole (IMBH) located at the center of the globular cluster. A mass of 7,500 IMBH is sufficient to explain the observed negative orbital period derivative with yr-1 (see Peuten et al., 2014, Figure 7). Together with the other three pulsars, it needs a mass of 19,000 IMBH to explain their observed spin period derivatives. However, similar to the stellar dark remnant, such a large IMBH mass would destroy the triple system very quickly to make what we observed is a short-lived event. In addition, Peuten et al. (2014) proposed that a central concentration of dark remnants, such as white dwarfs, neutron stars and stellar size black holes, that sank into the center of NGC 6624 may be responsible for the negative orbital period derivative of 4U 1820-30, as well as the other three pulsars. They concluded that this scenario was preferable for explaining the observed period derivatives for the four sources. However, from the precise timing analysis of PSR J1823-3021A, Perera et al. (2017) found that this millisecond pulsar was very likely orbiting around an IMBH of at least 7500 mass located at the center of NGC 6624 with high eccentricity and they argued that it is not necessary to favor central dark remnant over an IMBH at center, but Gieles et al. (2018) constructed mass models without IMBH at the center that were able to explain the spin period derivatives of three millisecond pulsars.
However, for any of the scenario used to interpret the negative orbital period derivative or negative orbital phase drift, the internal orbital period derivative must be considered. Because the orbital modulation of 4U 1820-30 is likely a result of periodic occultation by the accretion stream of the vertical structure at the edge of the accretion disk (Stella et al., 1987; Morgan et al., 1988; Sansom et al., 1989; van der Klis et al., 1993b), van der Klis et al. (1993b) suggested that the negative orbital phase drift of a -0.2 cycle detected from data collected between 1976 and 1991 may be due to accretion disk size change that causes the azimuth point of impact shift. Nevertheless, if the minimum intrinsic orbital period derivative, i.e. yr-1 (Rappaport et al., 1987), taken into account, the azimuth point of impact has to shift 0.95 cycle, which makes this scenario unlikely (Chou & Grindlay, 2001). A similar argument can also be applied to scenarios in which the observed negative orbital period derivative is caused by acceleration of the binary in the globular cluster. Considering the minimum intrinsic orbital period derivative, the acceleration along the line-of-sight of 4U 1820-30 should be at least yr-1.
Furthermore, large deviations of orbital period derivatives between the measured value and theoretical prediction, which considers orbital angular loss mechanisms only by gravitational radiation and magnetic braking, are often seen in LMXBs. Burderi et al. (2010) found that the observed orbital period derivative of the LMXB pulsar X 1822-371 was three order of magnitudes larger than the predicted value. The orbital period derivative of AX J1745.6-2901, which was first detected by Ponti et al. (2017), was at least one order of magnitude larger than the theoretical value. For the transient neutron star LMXB MXB 1659-298, the orbital period derivative was likely almost two order of magnitudes larger than the predicted value (Iaria et al., 2018). Similar large deviations have also been observed in accreting millisecond X-ray pulsars (AMXPs), such as SAX J1808.4-3658 (di Salvo et al., 2008; Burderi et al., 2009; Sanna et al., 2017), IGR J17062-6143 (Bult et al., 2021), and SWIFT J1749.4-2807 (Sanna et al., 2022). The most interesting source is X 1916-053, an ultra-compact LMXB composed of a neutron star and a white dwarf, similar to 4U 1820-30, with an orbital period of 3000 s. An orbital period derivative of yr-1, i.e. 200 times larger than the one induced by gravitational radiation, was reported by Hu et al. (2008). The most popular explanation for this large discrepancy is non-conservative mass transfer, i.e. a significant amount of mass transferred from the donor is ejected from the binary system instead of accreting onto the accretor. The outflow can carry away more orbital angular momentum to make the orbital period change faster than expected. For X 1916-053, Hu et al. (2008) found that approximately 60% - 90% of the mass was transferred from the white dwarf companion outflowing from the binary system. Chou et al. (2016) estimated that more than 60% of the mass lost from the companion was ejected from X 1822-371. Moreover, the mass outflow ratios can be as high as more than 90% for some LMXBs, such as IGR J17062-6143 (90%, Bult et al., 2021), MXB 1659-298 (98%, Iaria et al., 2018), and SAX J1808.4-3658 (99%, Burderi et al., 2009). Tavani (1991) proposed a radiation-driven model in which the non-conservative mass transfer may be caused by the irradiation of the secondary and accretion disk by large a flux from the primary. It can induce a strong evaporative wind from the secondary and accretion disk that makes the orbital evolution time scale 100 times shorter than expected, such as X1916-053 (Hu et al., 2008) and X 1822-371 (Chou et al., 2016). Alternatively, for AMXPs, di Salvo et al. (2008) suggested that, similar to the mechanism of black widow pulsars, the mass outflow can be driven by the pulsar wind, even in a quiescence state.
We suggest that the radiation-driven mass transfer mechanism, which induces non-conservative mass transfer, can also be applied to 4U 1820-30 that makes its intrinsic orbital period derivative much larger than the one that considers the orbital angular momentum lost only by gravitational radiation. Therefore, considering the orbital angular momentum lost by the outflow, the orbital period derivative, from Equation 3 in di Salvo et al. (2008), can be expressed as
| (6) |
where is the orbital angular momentum loss driven by gravitational radiation, and are the masses of the neutron star and the companion, respectively, is the mass ratio (), is the ratio of the mass accreting onto the neutron star, , and is the specific angular momentum lost by the outflow expressed in units of the specific orbital angular momentum of the companion. For the Roche lobe filling companion, its radius is approximately equal to the Roche lobe radius (Paczyński, 1971). Combined with the Kepler’s 3rd law and the mass-radius relation of the companion, , from Eq 6, we can have
| (7) |
and
| (8) |
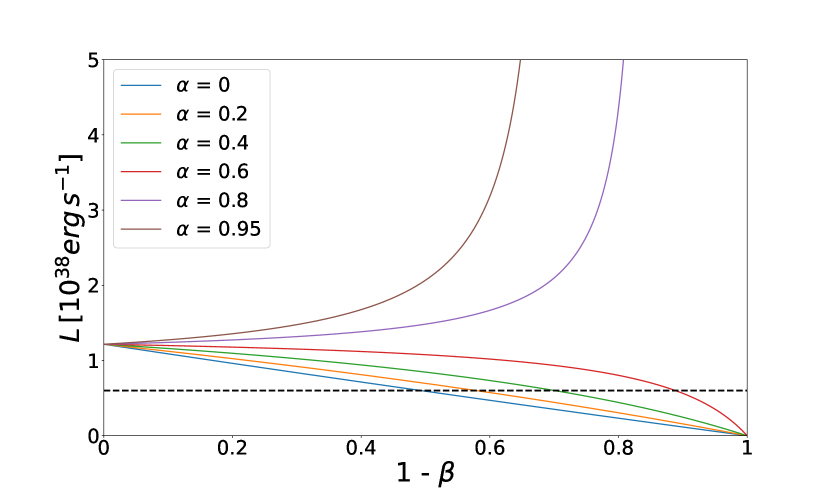
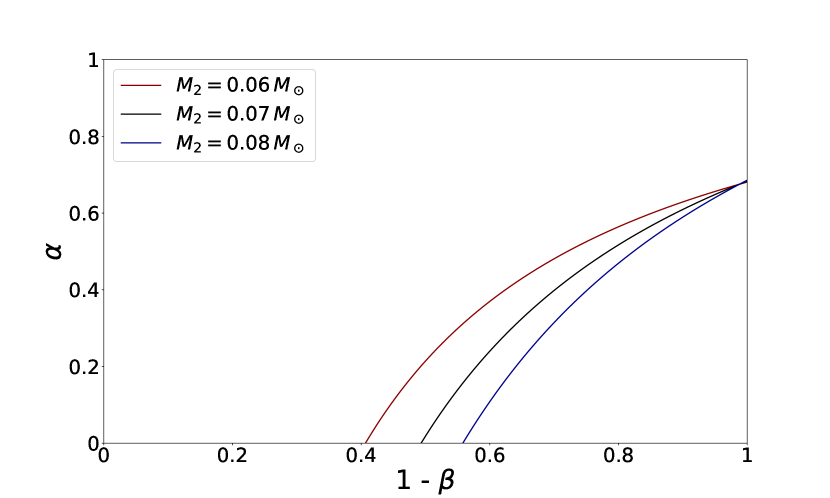
For 4U 1820-30, taking , , and for the fully degenerate secondary, we obtained yr-1 for the mass conserved case (). Thus we may evaluate the luminosity as erg s-1 where cm is the neutron star radius that is larger than the mean observed value of erg s-1 (Zdziarski et al., 2007b). If we assume that the deviation is caused by the non-conservative mass transfer, the luminosity can be evaluated as
| (9) |
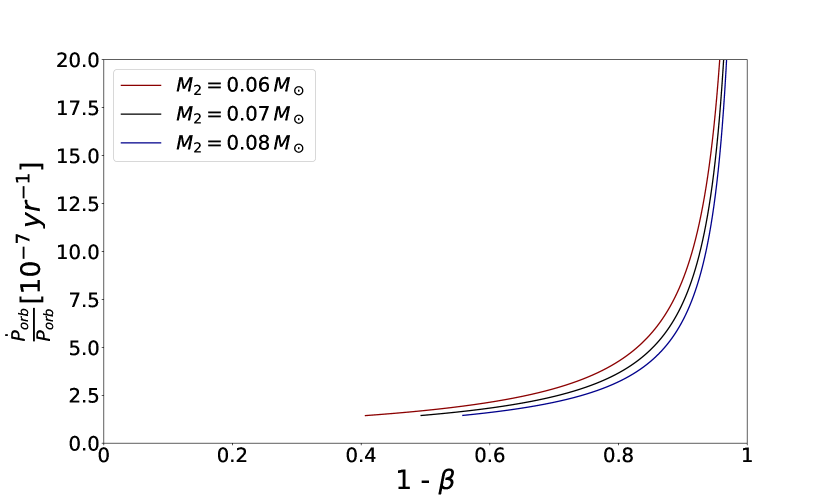
which enables us to constrain and values. Figure 8 shows the relation between the luminosity evaluated from Eq 9 and mass outflow ratio (1-). This indicates that the mass outflow ratio has a lower limit whereas has an upper limit. From Eq 9, can be written as a function of , where is shown in Figure 9 for the companion’s mass between 0.06 and 0.08. Evidently, at least (for ) of the mass lost from the companion has to be ejected from the binary system. By applying the function to Eq 8, orbital period derivative can be written as a function of mass loss ratio shown in Figure 10. This implies that the intrinsic orbital period derivative is no less than yr-1 and can be very large for intense mass outflow.
According to the radiation-driven model proposed by Tavani (1991), the outflow can be ejected from the companion and accretion disk. If we assume the mass outflow is only ejected from the Roche-lobe filling companion, the minimum specific orbital angular momentum of the secondary star is at the inner Lagrangian point, which can be calculated using the formula (di Salvo et al., 2008). For 4U 1820-30, when and . This means that if the mass outflow is ejected from the companion only, we expect that . However, as shown in Figure 9, we found that , which implies that a part of the mass outflow is ejected from the accretion disk.
Although the observed negative orbital period derivative, yr-1, for 4U 1820-30 is very likely due to the acceleration of the binary system by the gravitational potential in the globular cluster NGC 6624 (Tan et al., 1991; Chou & Grindlay, 2001; Peuten et al., 2014), when considering the acceleration value, the intrinsic orbital period derivative (i.e. in Eq 5) cannot be neglected. From the above discussion, it is highly possible that 4U 1820-30 has significant mass outflow ratio () and the intrinsic orbital period derivative is at least yr-1 for and , which makes the minimum line-of-sight acceleration equal to yr-1. This value can be larger for a more intense mass outflow, as shown in Figure 10. Therefore, we suggest that it is inappropriate to infer the acceleration of 4U 1820-30 in NGC 6624 using its observed orbital period derivative because there is too much uncertainty in it. In contrast to 4U 1820-30, the millisecond pulsars in NGC 6624 are likely better suited for inferring the accelleration in NGC 6624, as their intrinsic spin period derivatives are relatively small ( yr-1).
4.2 Superhump Modulation in 4U 1820-30
Superhumps are periodic modulations that are commonly observed in SU UMa type dwarf novae during their superoutburst states with periods 1%-7% longer than the corresponding orbital periods (see Warner, 1995, for extensive review). The superhump period is believed to be the beat period of the orbital period and accretion disk prograde precession period. If the mass ratio of a cataclysmic variable (CV) is less than 0.33, the accretion disk radius may extends to more than the 3:1 resonance radius. Under the influence of a tidal force from the companion, the accretion disk becomes asymmetric and starts precessing in the inertial frame (Whitehurst, 1988; Whitehurst & King, 1991). In addition to the SU UMa systems, superhumps are also observed permanently (called permanent superhumps) in some CVs with no extreme brightness changes (Patterson, 1999). Negative superhumps (or infrahumps) have also been detected in permanent superhump systems, with periods a few percent shorter than the corresponding orbital periods due to disk nodal precession (e.g. AM CVn, Harvey et al., 1998).
In addition to the CVs, superhump modulations were observed in some LMXBs. Haswell et al. (2001) indicated that the the 3:1 resonance condition () could be more easily achieved in LMXBs than in CVs because of their larger accretors’ masses. They proposed that superhumps might be detectable for LMXBs with orbital period less than 4.2 hours. For the black hole LMXBs, superhumps have been found in Nova Mus 1991, GRO JU0422+32 (O’Donoghue & Charles, 1996), XTE J1118+480 (Zurita et al., 2002), and probably in GS 2000+25 (O’Donoghue & Charles, 1996) and GRS 1915+105 (Neil et al., 2007). On the other hand, to explain the discrepancy between the periods observed in the X-ray band (3000 s) and optical band (3027 s) of dipping-bursting LMXB X1916-053, White (1989) suggested that the optical modulation is similar to the superhumps seen in SU UMa type dwarf novae due to disk precession in a period of 3.9 day whereas the X-ray dip period is the orbital period. Chou et al. (2001) detected a series of 3.9 day beat sidebands, including the optical period (3027 s), beside the X-ray dip period in the X-ray light curves collected by RXTE 1996 observations. This 3.9 day periodicity is likely due to the dip shape change caused by the slow disk precession in the inertial frame. Furthermore, Retter et al. (2002) discovered a negative superhump with a period of 2979 s in an X-ray light curve and Hu et al. (2008) found a 4.87 day periodic variation in the dip width from RXTE 1998 observations caused by the nodal precession of the accretion disk. These findings imply that X 1916-053 is similar to a permanent superhump system in the CVs (Retter et al., 2002; Hu et al., 2008).
The 693.5 s periodic modulation discovered in the FUV band is interpreted as a superhump in the 4U 1820-30 system (Wang & Chakrabarty, 2010), that indicates that the accretion disk radius exceeds the 3:1 resonance radius and precesses with a period of 0.8 day. Although the superhumps in LMXBs are usually observed in longer wavelength bands, such as optical band for black hole LMXBs and X 1916-053, and FUV band for 4U 1820-30, the disk precesion effects are also observable in X-ray light curves. For instance, the X-ray dip shape changes with a 3.9 days disk apsidal precession (Chou et al., 2001) or 4.8 days disk nodal precession (Hu et al., 2008) in X 1916-053. Although 4U 1820-30 is not a dipping LMXBs, orbital modulation in the X-ray band is believed to be the result of absorption by the structure in the disk rim (Stella et al., 1987). Therefore, as the disk undergoes processing, the beat sidebands beside the orbital peak, as detected by X 1916-053 (see Chou et al., 2001, Figure 5) with the period satisfied
| (10) |
where is the orbital period, is the disk precession period, and in the power spectrum. In this work, we have detected two significant sidebands with periods of =691.6 0.7 s (n=1 in Eq 10), which was consistent with the proposed superhump period of 693.51.3 s (Wang & Chakrabarty, 2010), and =698.3 0.8 s (n=2). Combined with the orbital period detected in the power spectrum ( s), we estimated that the accretion disk is precessing in a period of 0.80.1 day.
The mass ratio can be inferred from the orbital and superhump periods. From the periods we obtained in this work, the superhump excess is defined as , where is the superhump period, i.e. =0.0100.001. According to the empirical equation proposed by Patterson et al. (2005), the mass ratio is estimated as =0.05. On the other hand, for the low mass ratio, Goodchild & Ogilvie (2006) derived a linear relation of the superhump excess and mass ratio, i.e. . From this relation, the mass ratio is for 4U 1820-30. Both results indicate that the mass ratio is . If the mass of the neutron star in 4U 1820-30 equals to its canonical value, i.e. 1.4, the mass of the companion is 0.07, which is consistent with the companion’s mass range, i.e. 0.06-0.08, suggested by Rappaport et al. (1987).
Although no negative superhump signal is detected in the 4U 1820-30 NICER observations, based on the similarity between 4U 1820-30 and X 1916-053, we expect that 4U 1820-30 is also probably a permanent superhump system. If so, from the equation derived by Iaria et al. (2021), the nodal precession frequency can be expressed as
| (11) |
where is the nodal precession frequency, is the orbital frequency, and is the tilt angle of the accretion disk. For a small tilt angle and =0.05 from the superhump period, the nodal precession period is evaluated as 1.07 days and the negative superhump period should be 679.9 s. The detection of negative superhump could further identify that 4U 1820-30 is a permanent superhump system as X 1916-053. However, the detection may be hampered by the 1 day observation gaps because it is close to the nodal precession period. Probably an uninterrupted 2-3 days observation is necessary to identify the existence of a negative superhump.
Conversely, even though our detection of orbital period sidebands with periods of =691.60.7 s and =698.5 0.8 s is possibly due to disk precession as the superhump detected in FUV band (Wang & Chakrabarty, 2010), we cannot exclude the possibility that the sidebands are induced by a distant third star orbiting around the binary system. To explain the 171 days long-term modulation of the 4U 1820-30 system, Grindlay (1986, 1988) proposed that in the high-density star cluster core as NGC 6624, a star may be captured by the binary system and form a hierarchical triple system. As the third star orbiting the binary system, the eccentricity of the binary modulates with a period where is the third star orbital period, is the binary orbital period, and is a constant of order unity, depending on the mass ratios and relative inclination of the third star orbit and binary (Mazeh & Shaham, 1979). The eccentricity variation changes the binary separation and thus the Roche lobe radius leads to mass loss rate modulation with a period of 171 days. This model was further confirmed by Zdziarski et al. (2007a). For 4U 1820-30, the triple model implies that the orbital period of third star is 1.1 days for . Chou & Grindlay (2001) attempted to search for possible beat sidebands from the light curves collected by RXTE but failed, which was likely due to either the 1.1 day observation gaps or the variation being too small. Conversely, by applying the triple model, our detection of the beat sidebands indicates that the orbital period of third companion is 0.80.1 day, a little smaller than the expected 1.1 days. However, this value could be a factor of two larger or smaller owing to the different relative inclination angles (Chou & Grindlay, 2001). The third companion may have various effects on the binary modulation with the third companion orbital period. As the binary system rotates, the beat sidebands from the power spectrum near the orbital signal may be observed. For instance, as the third companion star moving around the binary system in a prograde orbit, the small tidal force from it may slightly alter the binary separation. Because the Roche lobe radius is proportional to the binary separation and the mass loss rate is sensitive to the Roche lobe radius, it may cause a small variation of accretion stream from the point and change the vertical structure of the disk rim with a period of s, i.e. the beat period of binary and third star orbital period, thus the beat sidebands are observable in the X-ray light curves. However, to identify if the s periodicity is induced by the third companion, further evidence is required. For example, Chou & Grindlay (2001) considered the third companion with a maximum mass of 0.5 and the motion of the binary radius relative to the mass center of the triple system was only lt-s where is the inclination of the third companion. Although this small motion only induces an orbital phase variation of less than 0.005, it is probably detectable by long-term continuous observations with a highly sensitive X-ray telescope.
5 Summary
4U 1820-30 is the most compact LMXB located near the center of globular cluster NGC 6624. In this work, we analyzed its orbital modulation from the X-ray light curves collected by NICER between 2017 to mid of 2022. In combination with the records since 1976, the orbital phase evolution in this 46 years can be well described by a quadratic curve with a detected orbital period derivative of yr-1. In addition to updating the orbital ephemeris, we found that no significant second order period derivative can be observed with a 2 upper limit of s s-2.
The discrepancy between the detected (negative) and theoretically predicted (positive) orbital period derivative may be owing to the binary system accelerating in the gravitational potential in the globular cluster. However, as discussing the intrinsic orbital period derivative, we concluded that the 4U 1820-30 may have significant amount of mass outflow, which makes the intrinsic orbital derivative much larger than the one evaluated from the orbital angular momentum loss driven by gravitational radiation only. Therefore, it is difficult to infer the acceleration of the binary system by using the observed orbital period derivative because there is too much uncertainty in the intrinsic orbital period derivative.
On the other hand, from the X-ray light curves collected by NICER between September 1 and 5 2017, a significant periodic modulation with a period of s, consistent with the superhump period discovered in the FUV band of the Hubble Space Telescope, was detected. This modulation is likely caused by the change of the absorption structure of the disk rim with a disk precession period of day coupling with the binary orbital motion. From the superhump period, the mass ratio is evaluated as . If the mass of neutron star is , the companion’s mass is 0.07, which is consistent with the mass range 0.06 to 0.08, suggested by Rappaport et al. (1987). While the s periodicity in X-ray band is likely the superhump period, it is still possible that the modulation is induced by a hierarchical third star orbiting around the binary system with an orbital period of day, such as the tidal force from the third companion changing the accretion stream, as well as the vertical structure of disk rim. Long-term observations with higher sensitivity X-ray telescope may be helpful for the identification.
References
- Anderson et al. (1997) Anderson, S. F., Margon, B., Deutsch, E. W., et al. 1997, ApJ, 482, L69. doi:10.1086/310672
- Burderi et al. (2009) Burderi, L., Riggio, A., di Salvo, T., et al. 2009, A&A, 496, L17. doi:10.1051/0004-6361/200811542
- Burderi et al. (2010) Burderi, L., Di Salvo, T., Riggio, A., et al. 2010, A&A, 515, A44. doi:10.1051/0004-6361/200912881
- Bult et al. (2021) Bult, P., Strohmayer, T. E., Malacaria, C., et al. 2021, ApJ, 912, 120. doi:10.3847/1538-4357/abf13f
- Chou et al. (2001) Chou, Y., Grindlay, J. E., & Bloser, P. F. 2001, ApJ, 549, 1135. doi:10.1086/319443
- Chou & Grindlay (2001) Chou, Y. & Grindlay, J. E. 2001, ApJ, 563, 934. doi:10.1086/324038
- Chou et al. (2016) Chou, Y., Hsieh, H.-E., Hu, C.-P., et al. 2016, ApJ, 831, 29. doi:10.3847/0004-637X/831/1/29
- di Salvo et al. (2008) di Salvo, T., Burderi, L., Riggio, A., et al. 2008, MNRAS, 389, 1851. doi:10.1111/j.1365-2966.2008.13709.x
- Gendreau & Arzoumanian (2017) Gendreau, K. & Arzoumanian, Z. 2017, Nature Astronomy, 1, 895. doi:10.1038/s41550-017-0301-3
- Giacconi et al. (1974) Giacconi, R., Murray, S., Gursky, H., et al. 1974, ApJS, 27, 37. doi:10.1086/190288
- Gieles et al. (2018) Gieles, M., Balbinot, E., Yaaqib, R. I. S. M., et al. 2018, MNRAS, 473, 4832. doi:10.1093/mnras/stx2694
- Goodchild & Ogilvie (2006) Goodchild, S. & Ogilvie, G. 2006, MNRAS, 368, 1123. doi:10.1111/j.1365-2966.2006.10197.x
- Grindlay et al. (1976) Grindlay, J., Gursky, H., Schnopper, H., et al. 1976, ApJ, 205, L127. doi:10.1086/182105
- Grindlay (1986) Grindlay, J. E. 1986, The Evolution of Galactic X-Ray Binaries, 167, 25
- Grindlay (1988) Grindlay, J. E. 1988, The Harlow-Shapley Symposium on Globular Cluster Systems in Galaxies, 126, 347
- Harvey et al. (1998) Harvey, D. A., Skillman, D. R., Kemp, J., et al. 1998, ApJ, 493, L105. doi:10.1086/311143
- Haswell et al. (2001) Haswell, C. A., King, A. R., Murray, J. R., et al. 2001, MNRAS, 321, 475. doi:10.1046/j.1365-8711.2001.04034.x
- Hu et al. (2008) Hu, C.-P., Chou, Y., & Chung, Y.-Y. 2008, ApJ, 680, 1405. doi:10.1086/527549
- Iaria et al. (2018) Iaria, R., Gambino, A. F., Di Salvo, T., et al. 2018, MNRAS, 473, 3490. doi:10.1093/mnras/stx2529
- Iaria et al. (2021) Iaria, R., Sanna, A., Di Salvo, T., et al. 2021, A&A, 646, A120. doi:10.1051/0004-6361/202039225
- Jiang et al. (2017) Jiang, L., Chen, W.-C., & Li, X.-D. 2017, ApJ, 837, 64. doi:10.3847/1538-4357/aa6033
- Mazeh & Shaham (1979) Mazeh, T. & Shaham, J. 1979, A&A, 77, 145
- Morgan et al. (1988) Morgan, E. H., Remillard, R. A., & Garcia, M. R. 1988, ApJ, 324, 851. doi:10.1086/165943
- Neil et al. (2007) Neil, E. T., Bailyn, C. D., & Cobb, B. E. 2007, ApJ, 657, 409. doi:10.1086/510287
- O’Donoghue & Charles (1996) O’Donoghue, D. & Charles, P. A. 1996, MNRAS, 282, 191. doi:10.1093/mnras/282.1.191
- Paczyński (1971) Paczyński, B. 1971, ARA&A, 9, 183. doi:10.1146/annurev.aa.09.090171.001151
- Rappaport et al. (1987) Rappaport, S., Nelson, L. A., Ma, C. P., et al. 1987, ApJ, 322, 842. doi:10.1086/165778
- Patterson (1999) Patterson, J. 1999, Disk Instabilities in Close Binary Systems, 61
- Patterson et al. (2005) Patterson, J., Kemp, J., Harvey, D. A., et al. 2005, PASP, 117, 1204. doi:10.1086/447771
- Ponti et al. (2017) Ponti, G., De, K., Muñoz-Darias, T., et al. 2017, MNRAS, 464, 840. doi:10.1093/mnras/stw2317
- Perera et al. (2017) Perera, B. B. P., Stappers, B. W., Lyne, A. G., et al. 2017, MNRAS, 468, 2114. doi:10.1093/mnras/stx501
- Peuten et al. (2014) Peuten, M., Brockamp, M., Küpper, A. H. W., et al. 2014, ApJ, 795, 116. doi:10.1088/0004-637X/795/2/116
- Phinney (1992) Phinney, E. S. 1992, Philosophical Transactions of the Royal Society of London Series A, 341, 39. doi:10.1098/rsta.1992.0084
- Priedhorsky & Terrell (1984) Priedhorsky, W. & Terrell, J. 1984, ApJ, 284, L17. doi:10.1086/184343
- Prodan & Murray (2012) Prodan, S. & Murray, N. 2012, ApJ, 747, 4. doi:10.1088/0004-637X/747/1/4
- Retter et al. (2002) Retter, A., Chou, Y., Bedding, T. R., et al. 2002, MNRAS, 330, L37. doi:10.1046/j.1365-8711.2002.05280.x
- Sanna et al. (2017) Sanna, A., Di Salvo, T., Burderi, L., et al. 2017, MNRAS, 471, 463. doi:10.1093/mnras/stx1588
- Sanna et al. (2022) Sanna, A., Burderi, L., Di Salvo, T., et al. 2022, MNRAS, 514, 4385. doi:10.1093/mnras/stac1611
- Sansom et al. (1989) Sansom, A. E., Watson, M. G., Makishima, K., et al. 1989, PASJ, 41, 591
- Scargle (1982) Scargle, J. D. 1982, ApJ, 263, 835. doi:10.1086/160554
- Schwarzenberg-Czerny (1989) Schwarzenberg-Czerny, A. 1989, MNRAS, 241, 153. doi:10.1093/mnras/241.2.153
- Shklovskii (1970) Shklovskii, I. S. 1970, Soviet Ast., 13, 562
- Šimon (2003) Šimon, V. 2003, A&A, 405, 199. doi:10.1051/0004-6361:20030514
- Smale et al. (1987) Smale, A. P., Mason, K. O., & Mukai, K. 1987, MNRAS, 225, 7P. doi:10.1093/mnras/225.1.7P
- Stella et al. (1987) Stella, L., Priedhorsky, W., & White, N. E. 1987, ApJ, 312, L17. doi:10.1086/184811
- Tan et al. (1991) Tan, J., Morgan, E., Lewin, W. H. G., et al. 1991, ApJ, 374, 291. doi:10.1086/170118
- Tavani (1991) Tavani, M. 1991, Nature, 351, 39. doi:10.1038/351039a0
- Wang & Chakrabarty (2010) Wang, Z. & Chakrabarty, D. 2010, ApJ, 712, 653. doi:10.1088/0004-637X/712/1/653
- van der Klis et al. (1993a) van der Klis, M., Hasinger, G., Dotani, T., et al. 1993, MNRAS, 260, 686. doi:10.1093/mnras/260.3.686
- van der Klis et al. (1993b) van der Klis, M., Hasinger, G., Verbunt, F., et al. 1993, A&A, 279, L21
- Warner (1995) Warner, B. 1995, Camb. Astrophys. Ser., Vol. 28,
- White (1989) White, N. E. 1989, A&A Rev., 1, 85. doi:10.1007/BF00872485
- Whitehurst (1988) Whitehurst, R. 1988, MNRAS, 232, 35. doi:10.1093/mnras/232.1.35
- Whitehurst & King (1991) Whitehurst, R. & King, A. 1991, MNRAS, 249, 25. doi:10.1093/mnras/249.1.25
- Zdziarski et al. (2007a) Zdziarski, A. A., Wen, L., & Gierliński, M. 2007a, MNRAS, 377, 1006. doi:10.1111/j.1365-2966.2007.11686.x
- Zdziarski et al. (2007b) Zdziarski, A. A., Gierliński, M., Wen, L., et al. 2007b, MNRAS, 377, 1017. doi:10.1111/j.1365-2966.2007.11688.x
- Zurita et al. (2002) Zurita, C., Casares, J., Shahbaz, T., et al. 2002, MNRAS, 333, 791. doi:10.1046/j.1365-8711.2002.05450.x
| ObsId | Start Time | End Time | Exposure Time |
| (yy-mm-dd) | (yy-mm-dd) | (s) | |
| 0050300108-109 | 17-06-26 | 17-06-27 | 6143 |
| 0050300113-117 | 17-07-09 | 17-07-13 | 5289 |
| 0050300119-120, 1050300101-102 | 17-07-14 | 17-07-18 | 3664 |
| 1050300105 | 17-08-22 | 17-08-22 | 4146 |
| 1050300107-108 | 17-08-28 | 17-08-29 | 33234 |
| 1050300109-110 | 17-08-30 | 17-08-31 | 28501 |
| 1050300111-112 | 17-09-01 | 17-09-02 | 26775 |
| 1050300113 | 17-09-03 | 17-09-03 | 28161 |
| 1050300114 | 17-09-04 | 17-09-04 | 26849 |
| 1050300115 | 17-09-04 | 17-09-05 | 22491 |
| 1050300116-118 | 17-09-06 | 17-09-08 | 22161 |
| 1050300121-126 | 17-11-07 | 17-11-12 | 10635 |
| 1050300128-130 | 18-02-13 | 18-02-16 | 3231 |
| 1050300134-138 | 18-03-12 | 18-03-16 | 3416 |
| 2050300102-103 | 19-06-05 | 19-06-06 | 6677 |
| 2050300106-107 | 19-06-09 | 19-06-10 | 13820 |
| 2050300108-109 | 19-06-12 | 19-06-13 | 18960 |
| 2050300110-111 | 19-06-13 | 19-06-15 | 9868 |
| 2050300112 | 19-06-15 | 19-06-16 | 12539 |
| 2050300114-115 | 19-06-19 | 19-06-21 | 16008 |
| 2050300116-118 | 19-06-23 | 19-06-25 | 13903 |
| 2050300120-124 | 19-06-27 | 19-07-01 | 11050 |
| 2050300125-127 | 19-07-03 | 19-07-05 | 13085 |
| 2050300128-129 | 19-07-06 | 19-07-07 | 11671 |
| 3050300101-102 | 20-05-20 | 20-05-22 | 2630 |
| 3050300105-108 | 20-10-07 | 20-10-11 | 9975 |
| 3586010101-105 | 20-11-10 | 20-11-14 | 10185 |
| 4050300101 | 21-04-27 | 21-04-27 | 2928 |
| 4680010101-103 | 21-05-02 | 21-05-04 | 5583 |
| 4050300104 | 21-05-19 | 21-05-19 | 4620 |
| 4663010101-102 | 21-06-19 | 21-06-20 | 19185 |
| 4050300105-106 | 21-08-23 | 21-08-24 | 11590 |
| 4663020101-102 | 21-10-08 | 21-10-09 | 8270 |
| 4680010105-106 | 21-10-13 | 21-10-14 | 2788 |
| 4680010107-109 | 21-10-17 | 21-10-20 | 3824 |
| 4680010112-115 | 21-10-24 | 21-10-27 | 12627 |
| 4680010116 | 21-10-28 | 21-10-28 | 11937 |
| 4680010117-119 | 21-10-29 | 21-10-31 | 11012 |
| 4680010120-123 | 21-11-01 | 21-11-05 | 11783 |
| 4680010124-128 | 21-11-06 | 21-11-11 | 5615 |
| 5050300101-102 | 22-03-30 | 22-03-31 | 4465 |
| 5050300107-111 | 22-04-04 | 22-04-09 | 8663 |
| 5604010103,5050300112-116 | 22-04-16 | 22-04-20 | 8595 |
| 5604010301-303 | 22-04-30 | 22-05-02 | 9453 |
| 5604010401-402 | 22-06-12 | 22-06-13 | 10535 |
| 5604010501-503 | 22-06-26 | 22-06-28 | 5993 |
| 5604010601-602 | 22-07-08 | 22-07-09 | 610349 |
| Mean Arrival Time | Phase | Error |
|---|---|---|
| () | ||
| 2457999.65 | -1.58 | 0.03 |
| 2458178.08 | -1.76 | 0.05 |
| 2458656.07 | -1.74 | 0.05 |
| 2459078.61 | -1.86 | 0.07 |
| 2459429.82 | -1.96 | 0.11 |
| 2459719.61 | -2.03 | 0.03 |