20XX Vol. X No. XX, 000–000
22institutetext: School of Astronomy and Space Science, University of Science and Technology of China, Hefei 230026, PR China
33institutetext: National Astronomical Observatories, Chinese Academy of Sciences, 20A Datun Road, Chaoyang District, Beijing 100101, PR China
\vs\noReceived 20XX Month Day; accepted 20XX Month Day
Unveiling the initial conditions of open star cluster formation
Abstract
Open clusters (OCs) are infrequent survivors of embedded clusters gestated in molecular clouds. Up to now, little is known about the initial conditions for the formation of OCs. Here, we studied this issue using high-precision astrometric parameters provided by Gaia data release 3. The statistics show that the peculiar motion velocities of OCs vary little from infancy to old age, providing a remarkable opportunity to use OCs to trace their progenitors. Adopting a dynamical method, we derived the masses of the progenitor clumps where OCs were born, which have statistical characteristics comparable to previously known results for clumps observed in the Galaxy. Moreover, the masses of the progenitor clumps of OCs indicate they should be capable of gestating massive O-type stars. In fact, after inspecting the observed OCs and O-type stars, we found that there are many O-type stars in OCs. The destructive stellar feedback from O-type stars may disintegrate the vast majority of embedded clusters, and only those sufficiently dense ones can survive as OCs.
keywords:
Galaxy: stellar content – open clusters and associations: general – stars: formation – stars: kinematics and dynamics1 Introduction
The vast majority of stars in the Milky Way is believed to form in clusters of dozens to thousands of members in molecular clouds (e.g., Lada & Lada 2003; Bressert et al. 2010; Megeath et al. 2016). The observations of young star-forming regions (e.g., Feigelson et al. 2013), theory (e.g., McKee & Ostriker 2007; Heyer & Dame 2015), and simulations (e.g., Offner et al. 2009) all have pictured star formation as a turbulent, clumpy, and stochastic process. To some extent, star formation in crowded environment can determine the properties of stars themselves, such as the initial mass function (IMF), and stellar multiplicity distributions (Sills et al. 2018). However, understanding of the formation and evolution of stellar clusters is still poor as these objects are deeply embedded in molecular clouds in their early evolutionary stages, and hence not optically observable, and new puzzling observations continuously challenge theoretical models, so they remain a fascinating topic today (e.g., Krause et al. 2020).
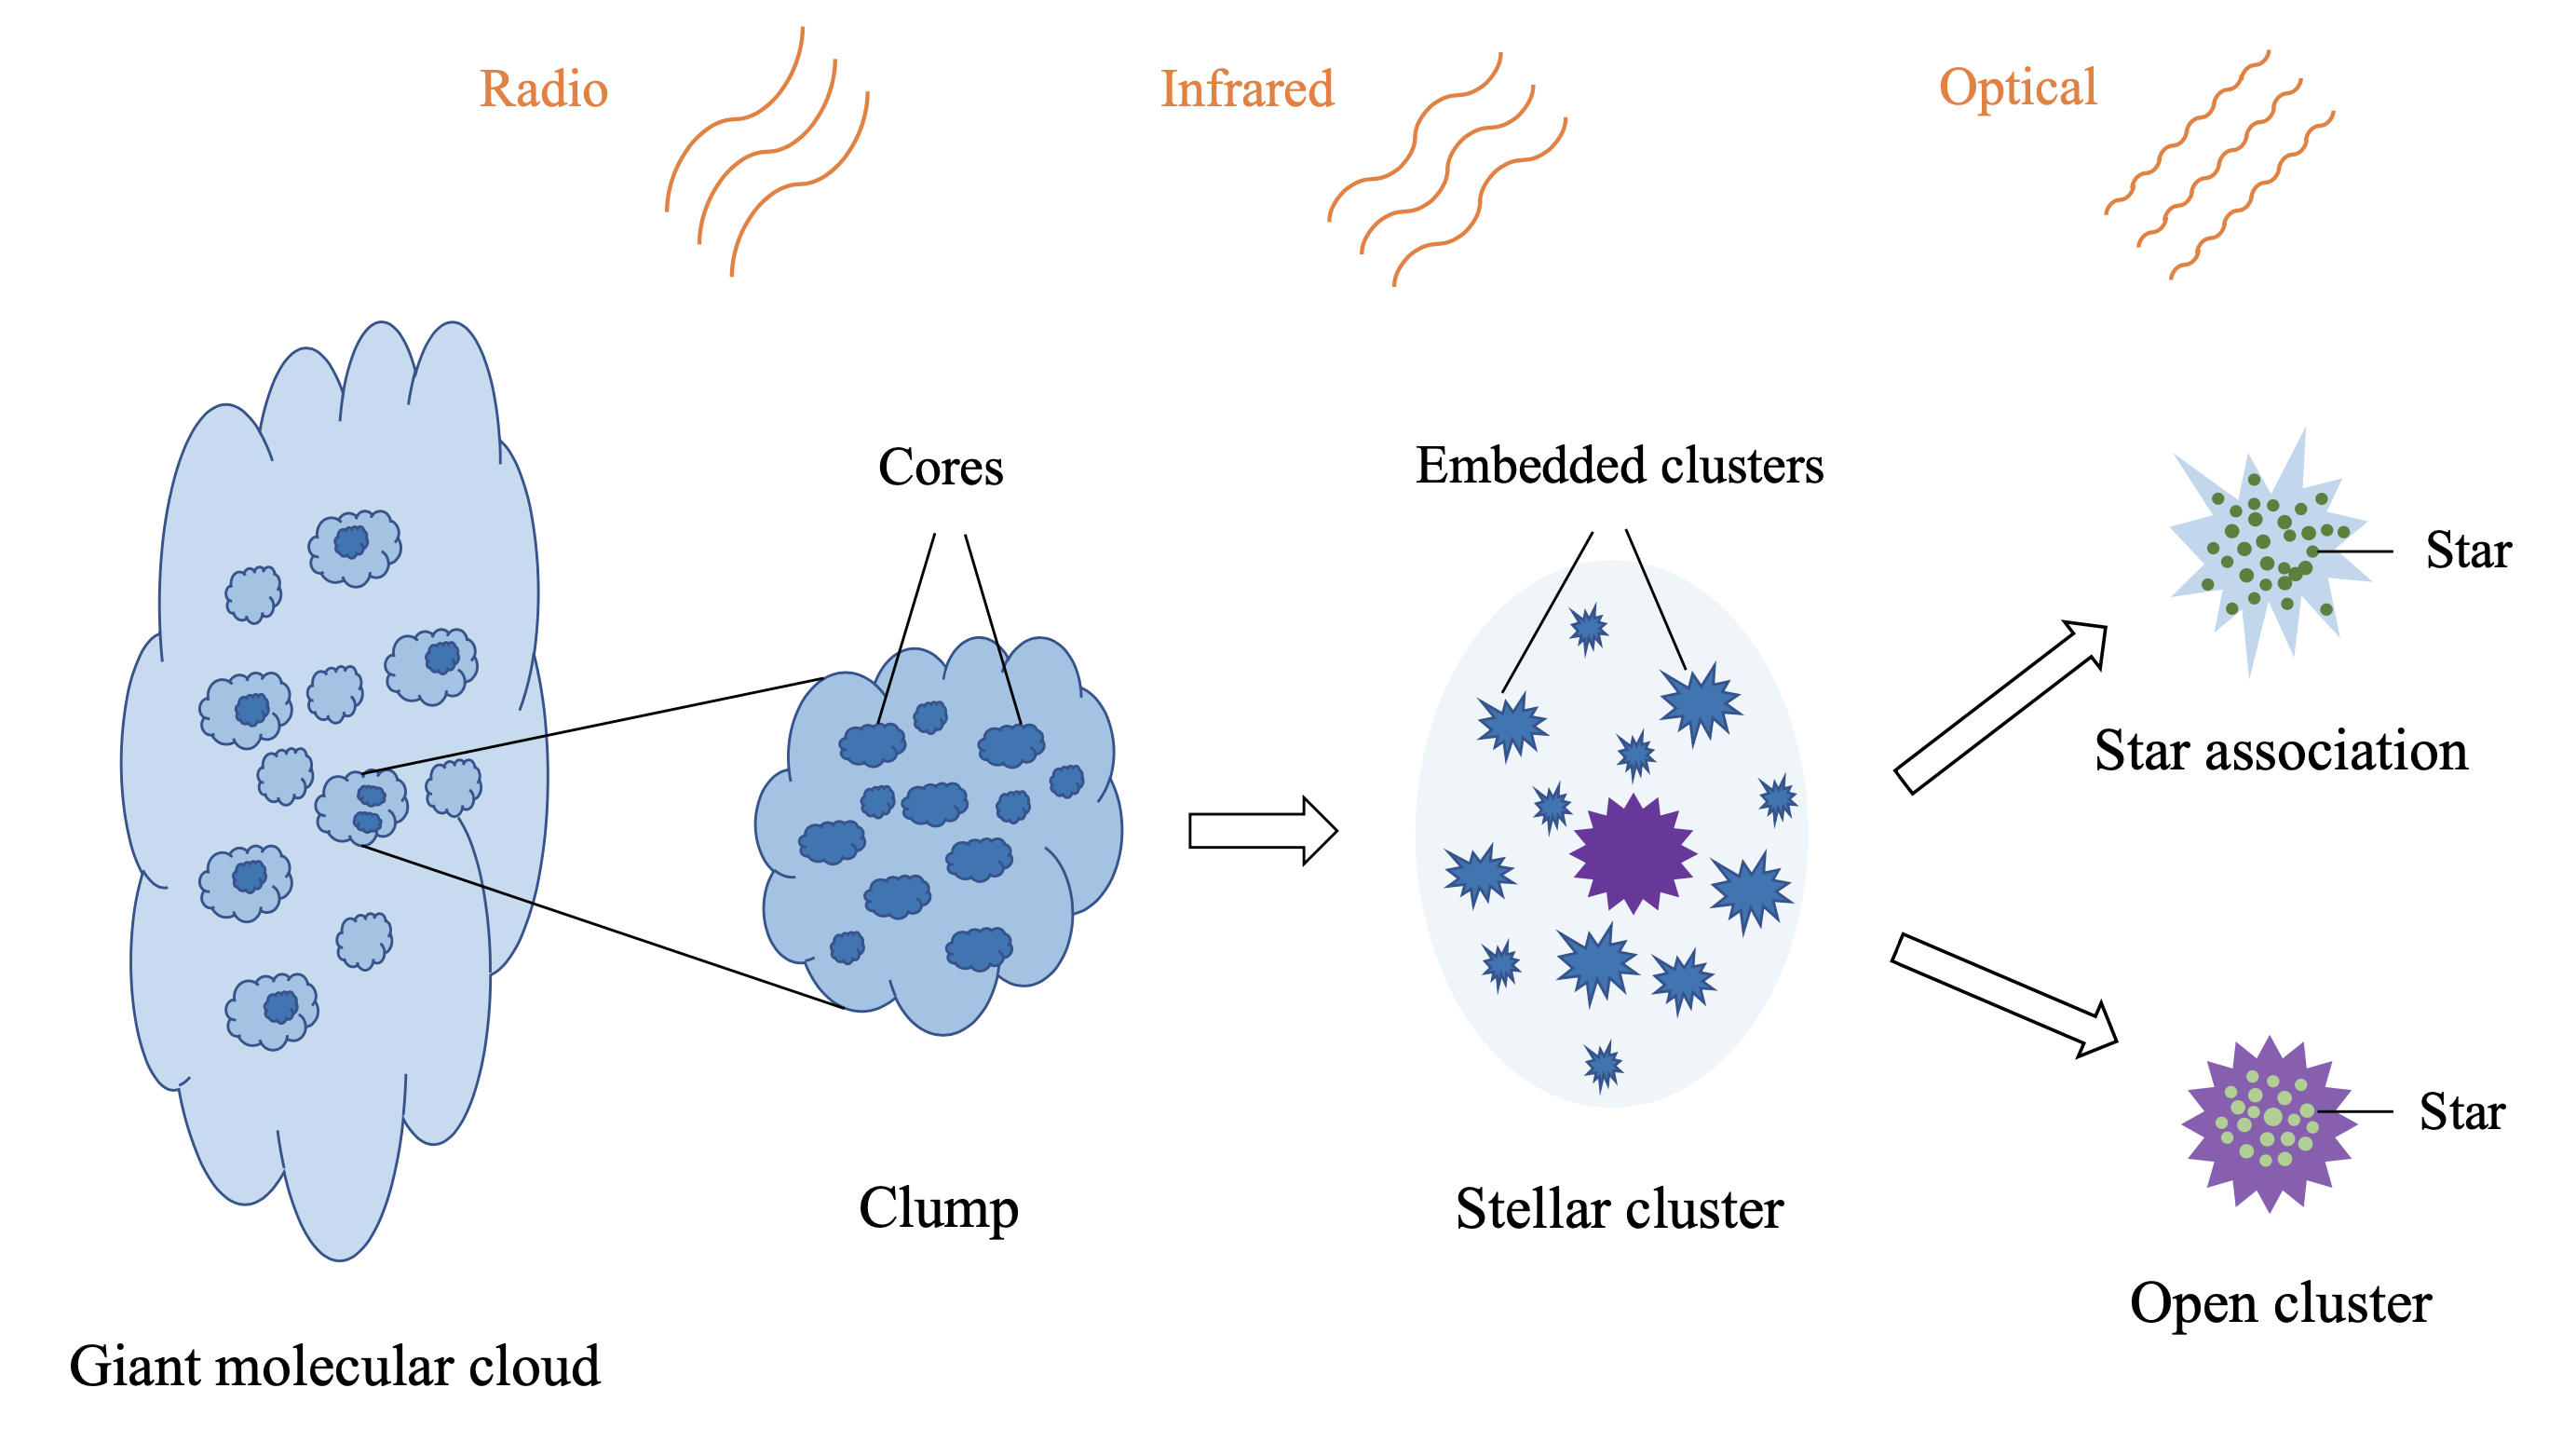
Figure 1 presents the pathway from radio observed molecular clouds and/or clumps, to proto stellar clusters consisting of embedded clusters that are often only visible at infrared wavelength, and ultimately to the optically identified star associations and/or OCs. Giant molecular clouds (GMCs), as the vast assemblies of molecular gas, possess masses from to (e.g., Elmegreen & Falgarone 1996; Murray 2011). Galactic clumps, as the dense parts of GMCs, gestate many denser cores, which are the nurseries of embedded clusters (e.g., Lada & Lada 2003; Rathborne et al. 2006; McMillan et al. 2007). It has become very clear that not all stars form in relaxed, centrally concentrated structure, and can often form in complex hierarchical or substructured distributions that follow the gas (e.g., Whitmore et al. 1999; Schmeja et al. 2008; Wright et al. 2014; Krumholz et al. 2019). For example, the best studied embedded cluster, , is within the more extended Orion Nebula Cluster (Kuhn et al. 2019). However, it has been suggested that the vast majority of embedded clusters will evolve into unbound star associations, and only a few percent (4–7%) will survive as bound OCs (e.g., Lada & Lada 2003; Bastian & Goodwin 2006), as illustrated in the sketch map shown in Figure 1. On average, each GMC or GMC complex probably produce one bound open star cluster (Elmegreen & Clemens 1985), and stars in such systems account for about 10% of all stars in our Galaxy (Roberts 1957; Adams & Myers 2001). Although efforts in both observations (e.g., Lada & Lada 2003, and references within) and numerical simulations (e.g, Proszkow et al. 2009; Proszkow & Adams 2009; Girichidis et al. 2012; Dale et al. 2015; Farias et al. 2018) have been devoted to study the star formation and early evolution of embedded clusters, little is known about the initial conditions of OC formation. The reason for the low survival rate of OCs arising from embedded clusters is still a mystery.
During the formation of stellar clusters, newborn stars could have profound effects on other stars and their natal molecular material, and many stellar feedback mechanisms would inject momentum into the star-forming environment (Krumholz et al. 2014), e.g., protostellar outflows (McKee 1989; Bally 2016; Li et al. 2020), stellar radiation pressure (Murray & Rahman 2010), stellar winds from hot stars (van Kempen et al. 2010), etc. Such stellar-feedback mechanisms are in principle enough to move all the surrounding material (Krumholz et al. 2014). Indeed, the stellar system that forms in a clump may expand (e.g., Orion Nebula cluster, Kuhn et al. 2019) as it emerges from the molecular gas. In this process, unlike other objects (e.g., binary or triple stellar systems and individual stars) whose kinetics can be changed easily, gravitationally bound OCs contain a large number of stars, making them potentially good kinematic fossils for investigating their progenitors.
The Gaia mission has published its data release 3 (Gaia DR3, Gaia Collaboration et al. 2016, 2022), which includes astrometric and photometric measurements of about 1.8 billion stars of different types, ages and evolutionary stages, and the determinations of the radial velocities (RVs) of more than 33 million objects. Meanwhile, the data quality of Gaia has been further improved. On the other hand, at present, thousands of OCs have been discovered in the Milky Way (e.g., Hao et al. 2022; Castro-Ginard et al. 2022), particularly with precise astrometric parameters (e.g., Cantat-Gaudin et al. 2020; Hao et al. 2021; Tarricq et al. 2021), which provide a good opportunity to investigate the characteristics of their progenitors.
The remaining paper is organized as follows. Section 2 describes the sample of OCs used in this work. The kinematic properties of OCs are studied in Sect. 3.1, which mainly concentrates on the peculiar motions of OCs in the Galaxy. Then, adopting a dynamical method, we derived the masses of progenitor clumps where OCs were born in Sect. 3.2, and the statistical characteristics of derived clumps were also compared with the previously known results of Galactic clumps. Next, we made an investigation in Sect. 3.3 to realize whether the present-day OCs house massive O-type stars, ultimately confirming the indication of derived progenitor clumps of OCs. In Sect. 4, we discussed the reason for the low survival rate of gravitationally bound OCs and explored which embedded clusters can evolve into long-lived OCs. Finally, we summarized this work in Sect. 5.
2 Sample
Up to now, thousands of OCs have been identified in Gaia data, and their ages cover a wide range, from a few million years (Myr) to billions of years. Based on previous works (i.e., Koposov et al. 2017; Cantat-Gaudin et al. 2018, 2019; Castro-Ginard et al. 2018, 2019, 2020; Liu & Pang 2019; Ferreira et al. 2019; Sim et al. 2019), Cantat-Gaudin et al. (2020) determined the parameters of 2 017 OCs found in Gaia data release 2 (Gaia DR2, Gaia Collaboration et al. 2018). Similarly, based on previous studies (i.e., Dias et al. 2002; Kharchenko et al. 2013; Dias et al. 2014; Schmeja et al. 2014; Scholz et al. 2015; Castro-Ginard et al. 2018; Cantat-Gaudin et al. 2018, 2019; Castro-Ginard et al. 2019, 2020; Liu & Pang 2019; Hao et al. 2020; Ferreira et al. 2020; He et al. 2021), Hao et al. (2021) synthesized a sample of more than 3 700 OCs, whose parameters have been determined according to Gaia early data release 3 (Gaia EDR3, Gaia Collaboration et al. 2021).
We compiled a large number of Galactic OCs with three-dimensional kinematic parameters through the following steps. For the OCs synthesized by Hao et al. (2021), after removing 134 potentially false positive or non-existing clusters reported in Dias et al. (2002) and Cantat-Gaudin & Anders (2020), we cross-matched the remaining OCs with the 2 017 OCs listed in the work of Cantat-Gaudin et al. (2020), where 1 821 non-repetitive OCs were found. Then, we cross-matched the members stars of 2 017 OCs compiled by Cantat-Gaudin et al. (2020) with the Gaia DR3 data set and updated their astrometric parameters. Among these objects, there are 1 772 OCs that have member stars with RV measurements provided by Gaia DR3. For the 1 821 OCs listed in Hao et al. (2021), we have also updated their astrometric parameters by using Gaia DR3, and 1 456 OCs have member stars with RV measurements. Thus, 3 228 OCs with Gaia RV measurements were obtained. For each of these OCs, we used a weighted procedure to determine its mean RV and RV uncertainty based on the errors of individual measurements, following Soubiran et al. (2018). In the end, after filtering 375 objects with RV uncertainties larger than 10 km s-1, we gathered a sample of 2 853 OCs with reliable mean RV parameters. Age parameters of the selected OCs come from Cantat-Gaudin et al. (2020) and Hao et al. (2021).
The Gaia DR3 data set is a large increase of the OC members that with RV measurements available. Taking advantage of RV measurements from both Gaia DR2 and ground-based spectroscopic surveys and catalogues, Tarricq et al. (2021) computed the weighted RVs and RV uncertainties of 1 382 OCs in Cantat-Gaudin et al. (2020). Selecting the most reliable OCs that have an RV uncertainty lower than 3 km s-1 based on at least 3 member stars, Tarricq et al. (2021) obtained 513 clusters in their sample. Under this criterion, there are 1 317 OCs in our sample that can be considered to possess the most reliable mean RVs, which have a median RV uncertainty of 1.01 km s-1 and a median number of 14 member stars with RV measurements, benefiting from Gaia DR3.
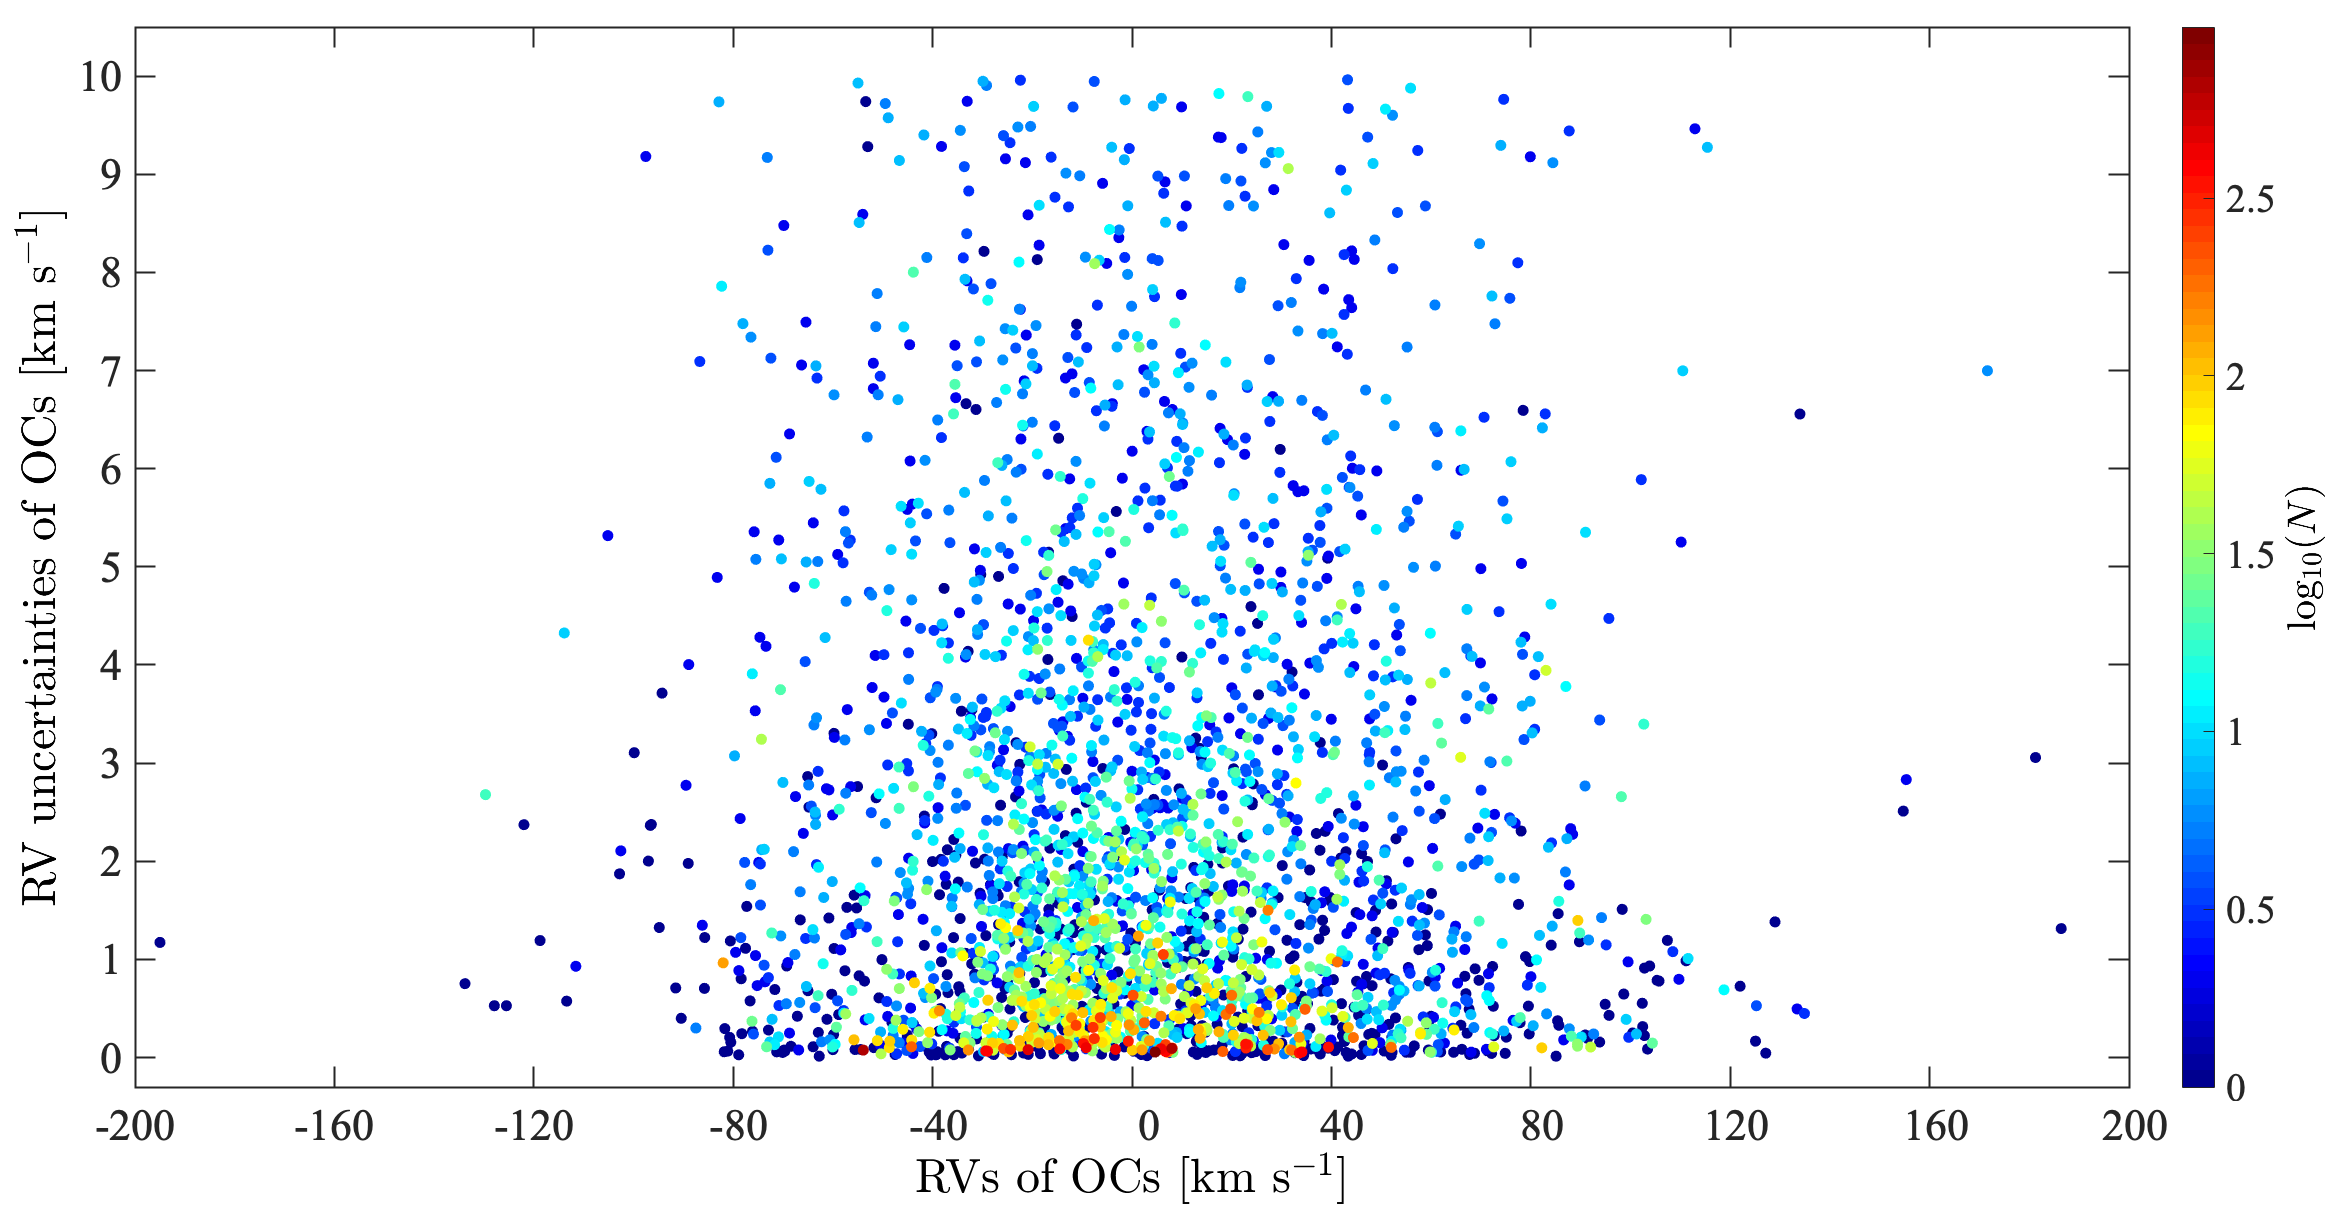
In Figure 2, we presented the RVs, RV uncertainties, and the numbers of member stars with RV measurements of 2 853 OCs in the sample. For about 35% (997 OCs) of the sample, the mean RV is based on more than 10 member stars, and for about 71% (2 015 OCs) it is based on at least 3 member stars. The RVs of 525 OCs are based on only one member star, which represent 18% OCs of our sample. 2 415 OCs (85%) have RV uncertainties lower than 5 km s-1, and the RV uncertainties of 1 970 OCs (70%) are lower than 3 km s-1. The median uncertainty of the weighted mean RV is 1.64 km s-1 when the full sample is considered. The sample of 2 853 OCs was used for analysis in the next sections.
3 Results
3.1 Peculiar motions of OCs
The large number of member stars of OCs makes them potentially good kinematic fossils for investigating their progenitors. The peculiar motions (PMs) are non-circular motions with respect to the rotating Galactic disc and are significant kinematic attributes of OCs, the study of which enables to use OCs to trace their progenitors. For the OCs obtained in Sect. 2, we have calculated their PM velocities (), which were derived from their measured distances, proper motions, and radial velocities following Reid et al. (2009) and Xu et al. (2013). In the Galactocentric reference frame, the three-dimensional motions of OCs were straightforwardly calculated using the linear speeds projected onto the celestial sphere. Then, the PMs of OCs were estimated by subtracting Galactic rotation and the solar motions. Here, a Galactic rotation speed near the solar circle of 236 7 km s-1, a distance of the Sun to the Galactic centre of 8.15 0.15 kpc and solar motions of U⊙ = 10.6 1.2 km s-1, V⊙ = 10.7 6.0 km s-1 and W⊙ = 7.6 0.7 km s-1 were adopted (Reid et al. 2019), where U, V and W are the velocity components towards the Galactic centre, in the direction of Galactic rotation and towards the North Galactic Pole, respectively. The PM velocities of OCs were defined as = .
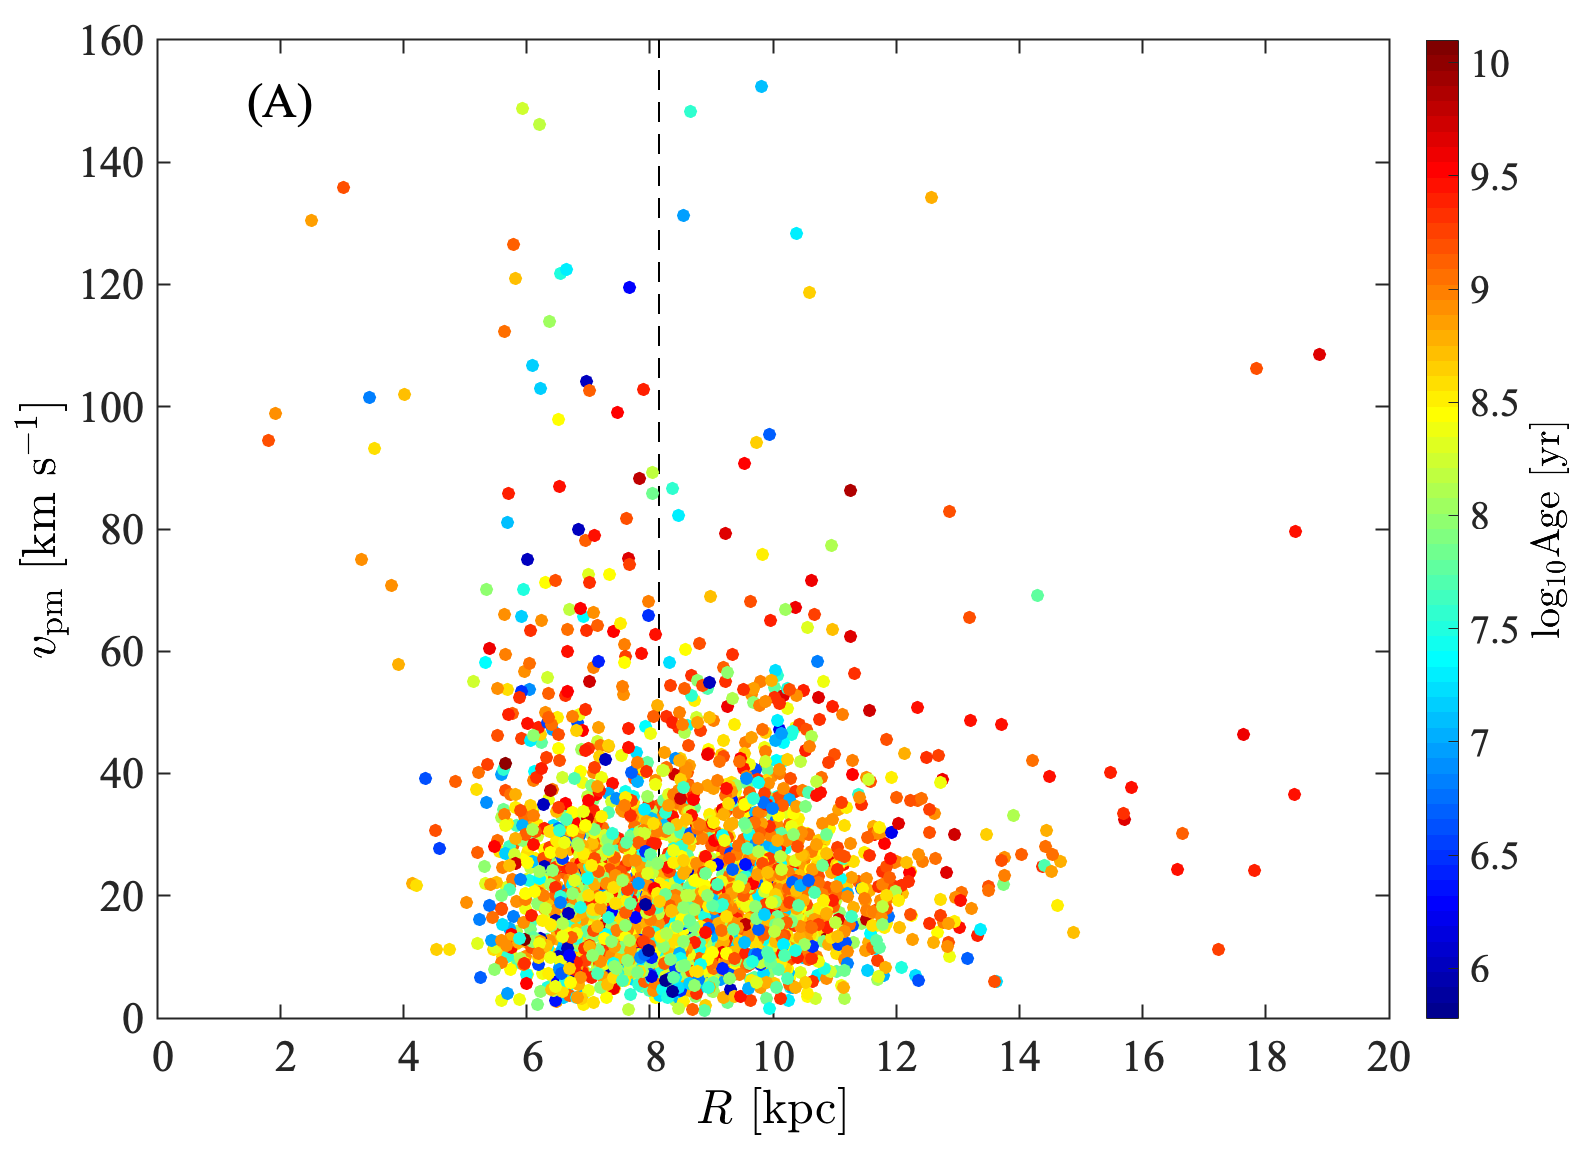
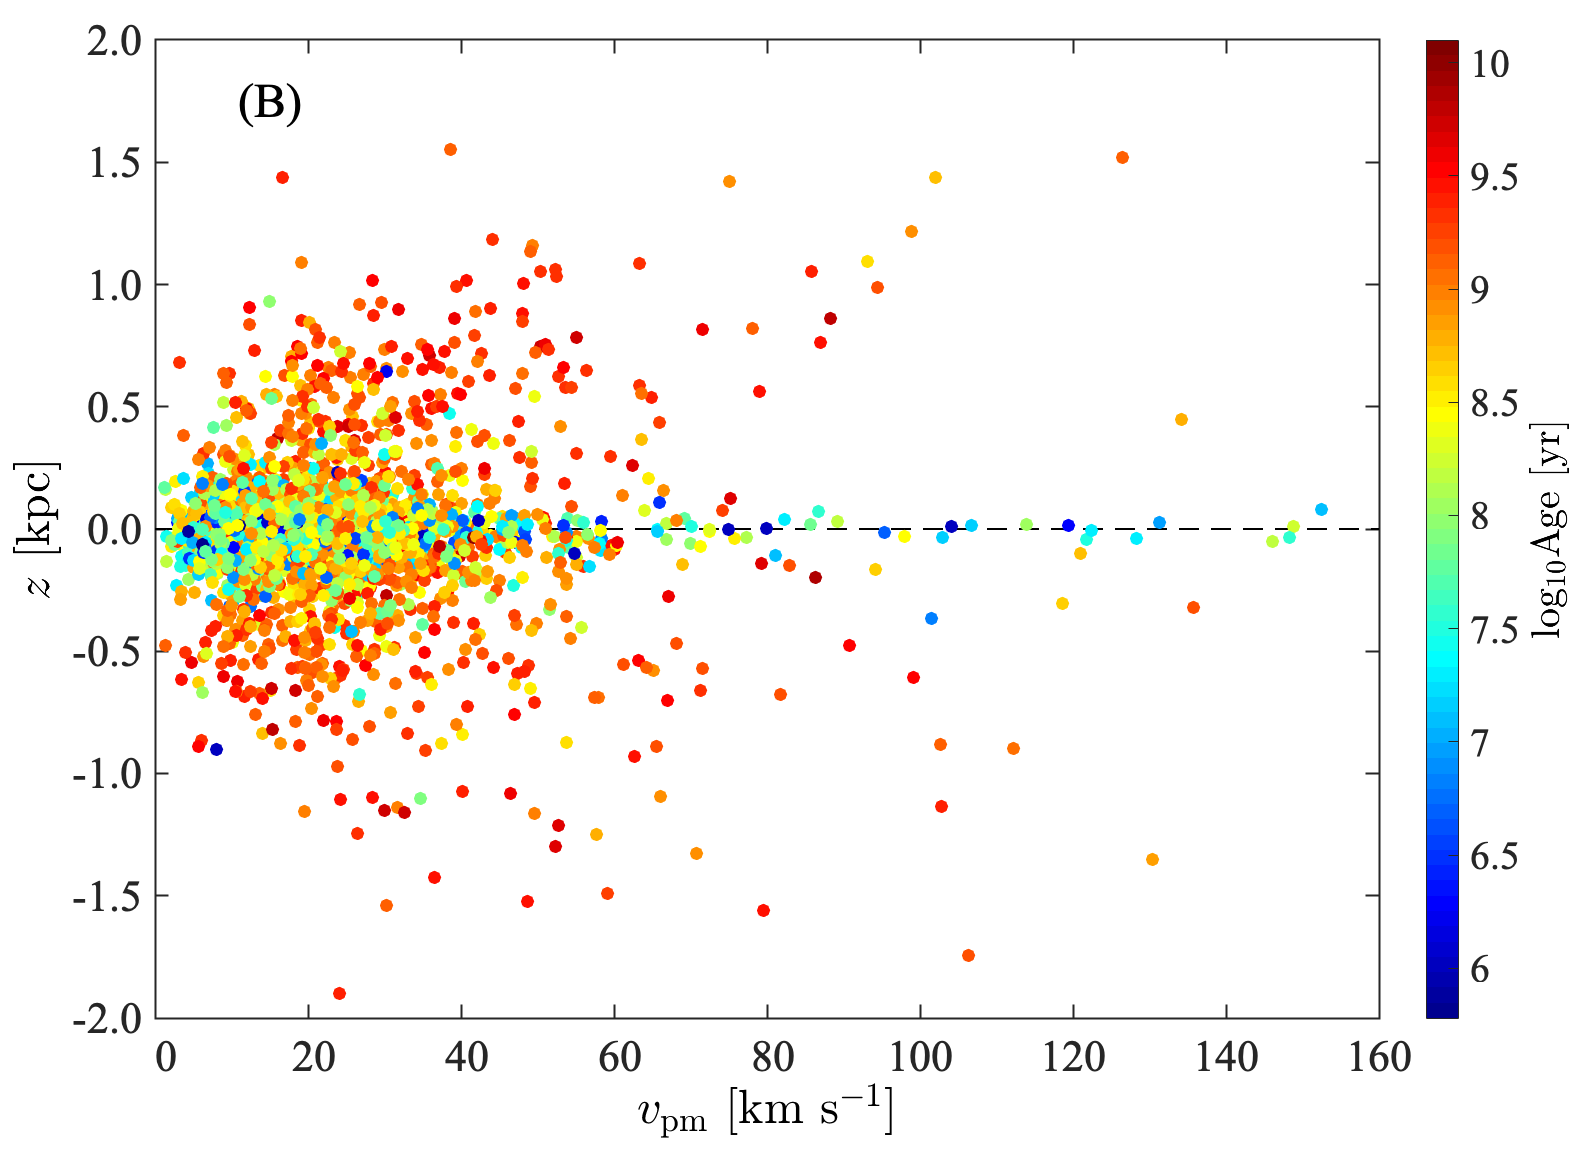
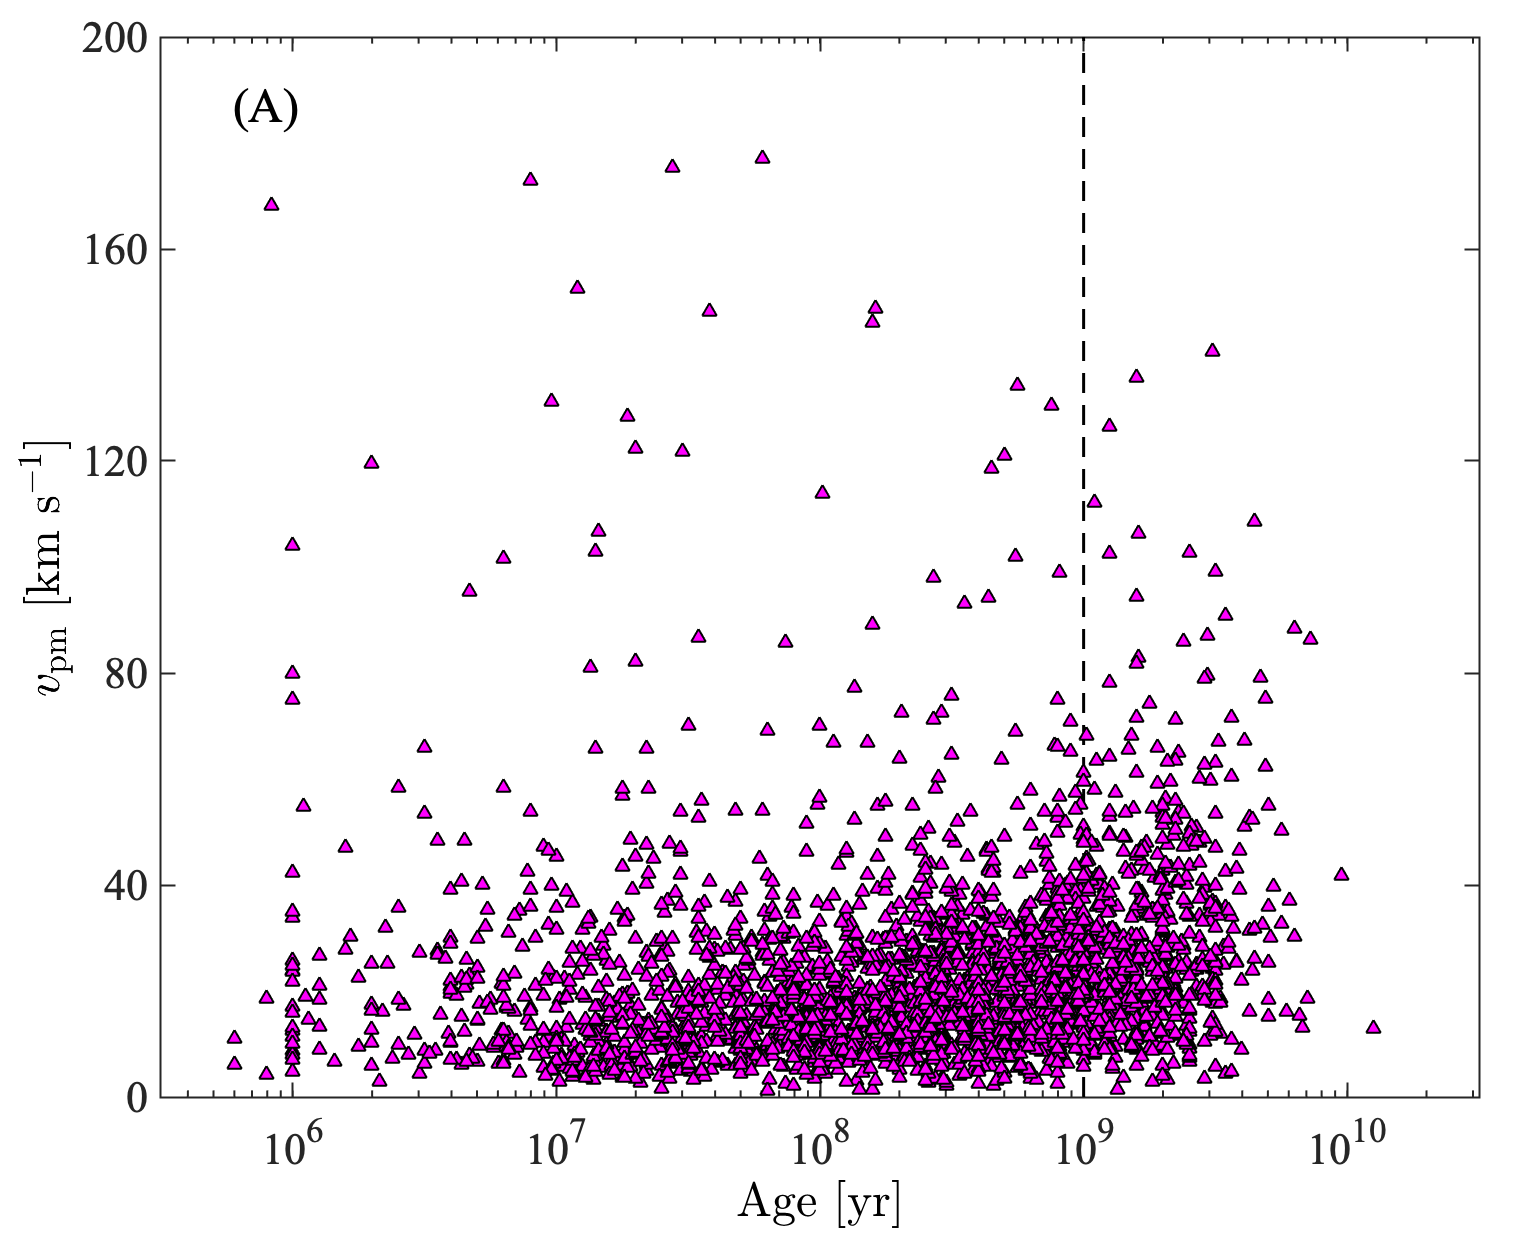
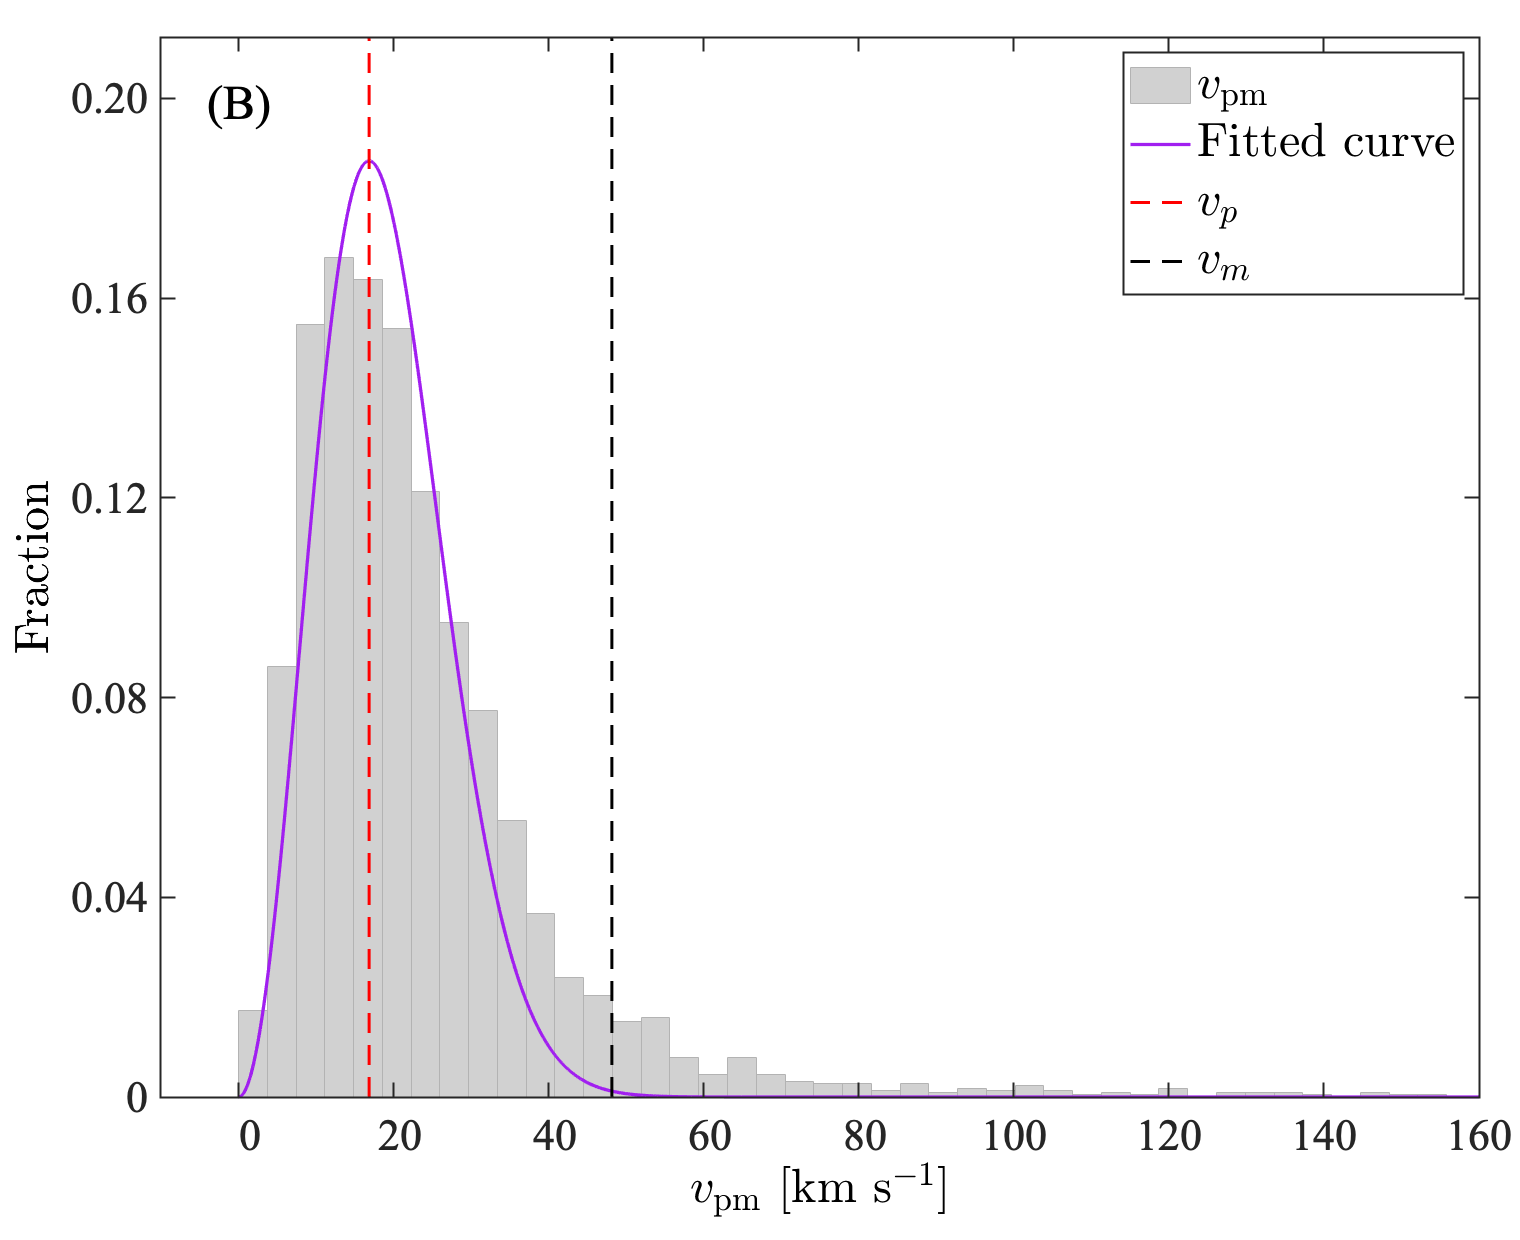
Figure 3(A) displays the distribution of the PM velocities of OCs in different ages with respect to their Galactocentric distance, which demonstrates that the PM velocities of OCs at different distances from the Galactic centre are comparable. Besides, almost all of OCs (99.2) are located between a Galactocentric distance range of [4, 16] kpc; hence, the influence of the Galactic “bar” on the PM velocities of OCs in the sample should be negligible. Figure 3(B) shows the distribution of PM velocities of the OCs in different ages versus their -heights from the Galactic middle plane, which indicates that there is no significant distinction of the PM velocities of OCs with different -heights. Most OCs cross the Galactic plane several times in one orbital period and they gradually migrate from the Galactic disk as they age (Wu et al. 2009; Hao et al. 2021). The above results imply that there may be no difference in the PM velocities of OCs when they travel in the Galaxy.
We made an investigation to address whether the PM velocities of OCs are variable as they age. As shown in Figure 4(A), we present the PM velocities of OCs as a function of cluster age. For OCs younger than one thousand million years, there is no visible variation of the PM velocities with the increasing OC age. The Pearson correlation coefficient (PCC), , was used to evaluate the correlation between the PM velocities of the OCs and the cluster ages:
| (1) |
where () denotes the covariance between the two variables, and is the mean of each variable. The Pearson correlation coefficient (PCC) between the PM velocities and ages is about 0.19 for all OCs in the sample, and only 0.17 for OCs younger than 1 Gyr (Figure 4(A)). Hence, the variation of PM velocities is small for OCs from infancy to the old age of one thousand million years.
We also investigated the distribution characteristics of the PM velocities of OCs, as shown in Figure 4(B). The distribution of the PM velocities of OCs can be fitted with a Maxwellian velocity distribution function:
| (2) |
The best-fitting parameters of A and B are 4.06 and 0.0035, with 95 confidence intervals of [3.69, 4.44] and [0.0033, 0.0038], respectively. According to the Maxwellian velocity distribution, the most probable velocity is:
| (3) |
Besides, the probability that the velocity is within the finite interval is:
| (4) |
Hence, it is shown that the probability of in the range [0, 48] km s-1 is 99.9% (see Figure 4(B)), and the most probable velocity of an OC, , is 17 km s-1 (see Figure 4(B)).
Since the variation of the PM velocities is very small for OCs from infancy to the age of one thousand million years, it is likely to make a connection between the present-day OCs and their progenitors. Then, the initial conditions for producing OCs can be revealed.
3.2 The progenitor clumps of OCs
The present-day PM velocity of an OC has two possible origins: the separation velocity of the OC from the system where it born, or the inherited velocity from its natal system. The former scenario can be conceived that most embedded clusters evolve to be unbound star associations after separating from their natal systems, and ultimately become Galactic field stars, while only a few percent survive as bound OCs (see Figure 1), showing a very low fraction of bound OCs as announced in previous studies (e.g., Lada & Lada 2003; Krumholz et al. 2019). We found that there are several arguments can favor the former scenario, e.g., not all stars form in centrally concentrated but complex substructured distributions that follow the gas (e.g., Wright et al. 2014); stellar clusters formed in clumps are expanding when they emerging from the gas (e.g., Kuhn et al. 2019); the spatial distributions of gas and stars can determine whether the cluster remains bound or not (e.g., Smith et al. 2011, 2013), and the substructured distribution of a stellar cluster can help it survive (e.g., Allison et al. 2009); etc.
Section 3.1 shows that the PM velocities of OCs vary little from infancy to the old stage. Thus, if we suppose that the PM velocities of OCs are nearly the separation velocities from their natal systems, the masses of progenitors that gave birth to OCs can be estimated, which provides us a chance to study the initial properties of the OCs’ progenitors.
Observations show that the dense clumps that are gravitationally bound have many denser cores (e.g., Urquhart et al. 2014). It has become clear that the stellar clusters formed in clumps are substructured, containing many embedded clusters born in denser cores, as illustrated in Figure 1. Here, similar to the definition given by Kennicutt & Evans (2012), the scales (diameter) of clumps to which we refer are 1–10 pc and the denser cores are 0.1–1.0 pc.
The mass of a clump () can be estimated as the total mass of stars () and gas (), where = SFE. SFE, star formation efficiency, is a fundamental parameter of the star formation in a region, which is defined as:
| (5) |
Here, and are the total stellar and gaseous masses contained in the region, respectively.
The total potential energy of the stars before gas expulsion, , can be approximated by:
| (6) |
where is the mass of stars, is the radius that contains half of the total mass in stars and is the gravitational constant. When gas is expelled, the potential energy of the system, , arises only from the stellar component, i.e.,
| (7) |
The same as Farias et al. (2015, 2018), we assumed that the gas is expelled instantaneously. Then, the stars have not had time to change their kinetic energy after gas expulsion, so we can assume . Combining with Eq. (5), the separation velocity () of an OC from its natal proto-OC system can be approximated by the escape velocity as:
| (8) |
In the following text, the term “proto-OC system” will refer to those proto stellar clusters formed in clumps, consisting of many substructures called embedded clusters. Then, the mass of a clump can be estimated as:
| (9) |
If we want to derive the masses of progenitor clumps of OCs, there are three parameters need to be determined, i.e., the separation velocity , the SFE, and the radius .
Separation velocity . The variation of the PM velocities of the OCs younger than one billion years is very small. For those OCs with ages of nearly one billion years, their PM velocity variations are estimated to be only about a few km s-1. In the following, we only selected the OCs younger than one billion years to do further statistical analyses and supposed their PM velocities are almost the separation velocities from their natal proto-OC systems, i.e., .
SFE. Estimates of SFE are indirect and uncertain, e.g., the value of SFE globally observed for GMCs is 1–5 (Duerr et al. 1982; Grudić et al. 2018), and in star-forming regions of embedded clusters, SFEs range from approximately 10–30 (Lada & Lada 2003), while a bound OC would emerge only if SFE is greater than 50 (Wilking & Lada 1983). Considering not all embedded clusters in a proto-OC system can survive as bound OCs, we adopt SFE = 40 for the systems that can produce OCs.
Radius . As mentioned above, stars form in the proto-OC system are substructured that follow the gas. While considering the stars are more concentrated than the gas (e.g., Krumholz et al. 2019), the of proto-OC systems that we adopted are slightly smaller than the radii of clumps. Referring to the clumps found in the submillimetre survey ATLASGAL (Atacama Pathfinder Experiment Telescope Large Area Survey of the Galaxy, Urquhart et al. 2014), the radii, , were set to the range [0.3, 3.0] pc. It can be expected that larger PM velocities of OCs implies richer and more massive progenitor clumps, because there are more significant momentum injection. There is a mass–radius relation for the Galactic clumps (Krumholz et al. 2019), i.e., . Combining this relation with Eq.( 8), we can obtain . Index () of the mass–radius relation for the clumps are in the range of 0.3–0.6 (Wong et al. 2008; Roman-Duval et al. 2010; Urquhart et al. 2018). Here, the adopted value of is 0.5. Besides, we have chosen different values of and the following results are not significantly different.
We first extracted OCs with ages younger than 1 Gyr. Then, since the fitted Maxwellian velocity distribution in Sect. 3.1 shows that the probability of the PM velocities of OCs in the range [0, 48] km s-1 is 99.9%, we rejected OCs with PM velocities larger than 48 km s-1, and the sources with PM velocity uncertainties larger than 10 km s-1 were also eliminated, eventually obtaining a subsample of 1 571 OCs. For these OCs, the masses of their natal clumps () are deduced with the above dynamical method, which produces a range from to . Actually, a vast majority of progenitor clumps have masses of to , and only 1% of them are smaller than . The mass of the clump corresponding to the most probable velocity, , is 2.6 , consistent with that about 48% derived clumps have the order of mass magnitude of . The derived masses of clumps are mainly (82) in the range from to , which are comparable to the expectations of clump candidates where young massive stellar clusters are expected to be found (e.g., Urquhart et al. 2018), and actually, such systems are anticipated to yield OCs (e.g., Lada & Lada 2003).
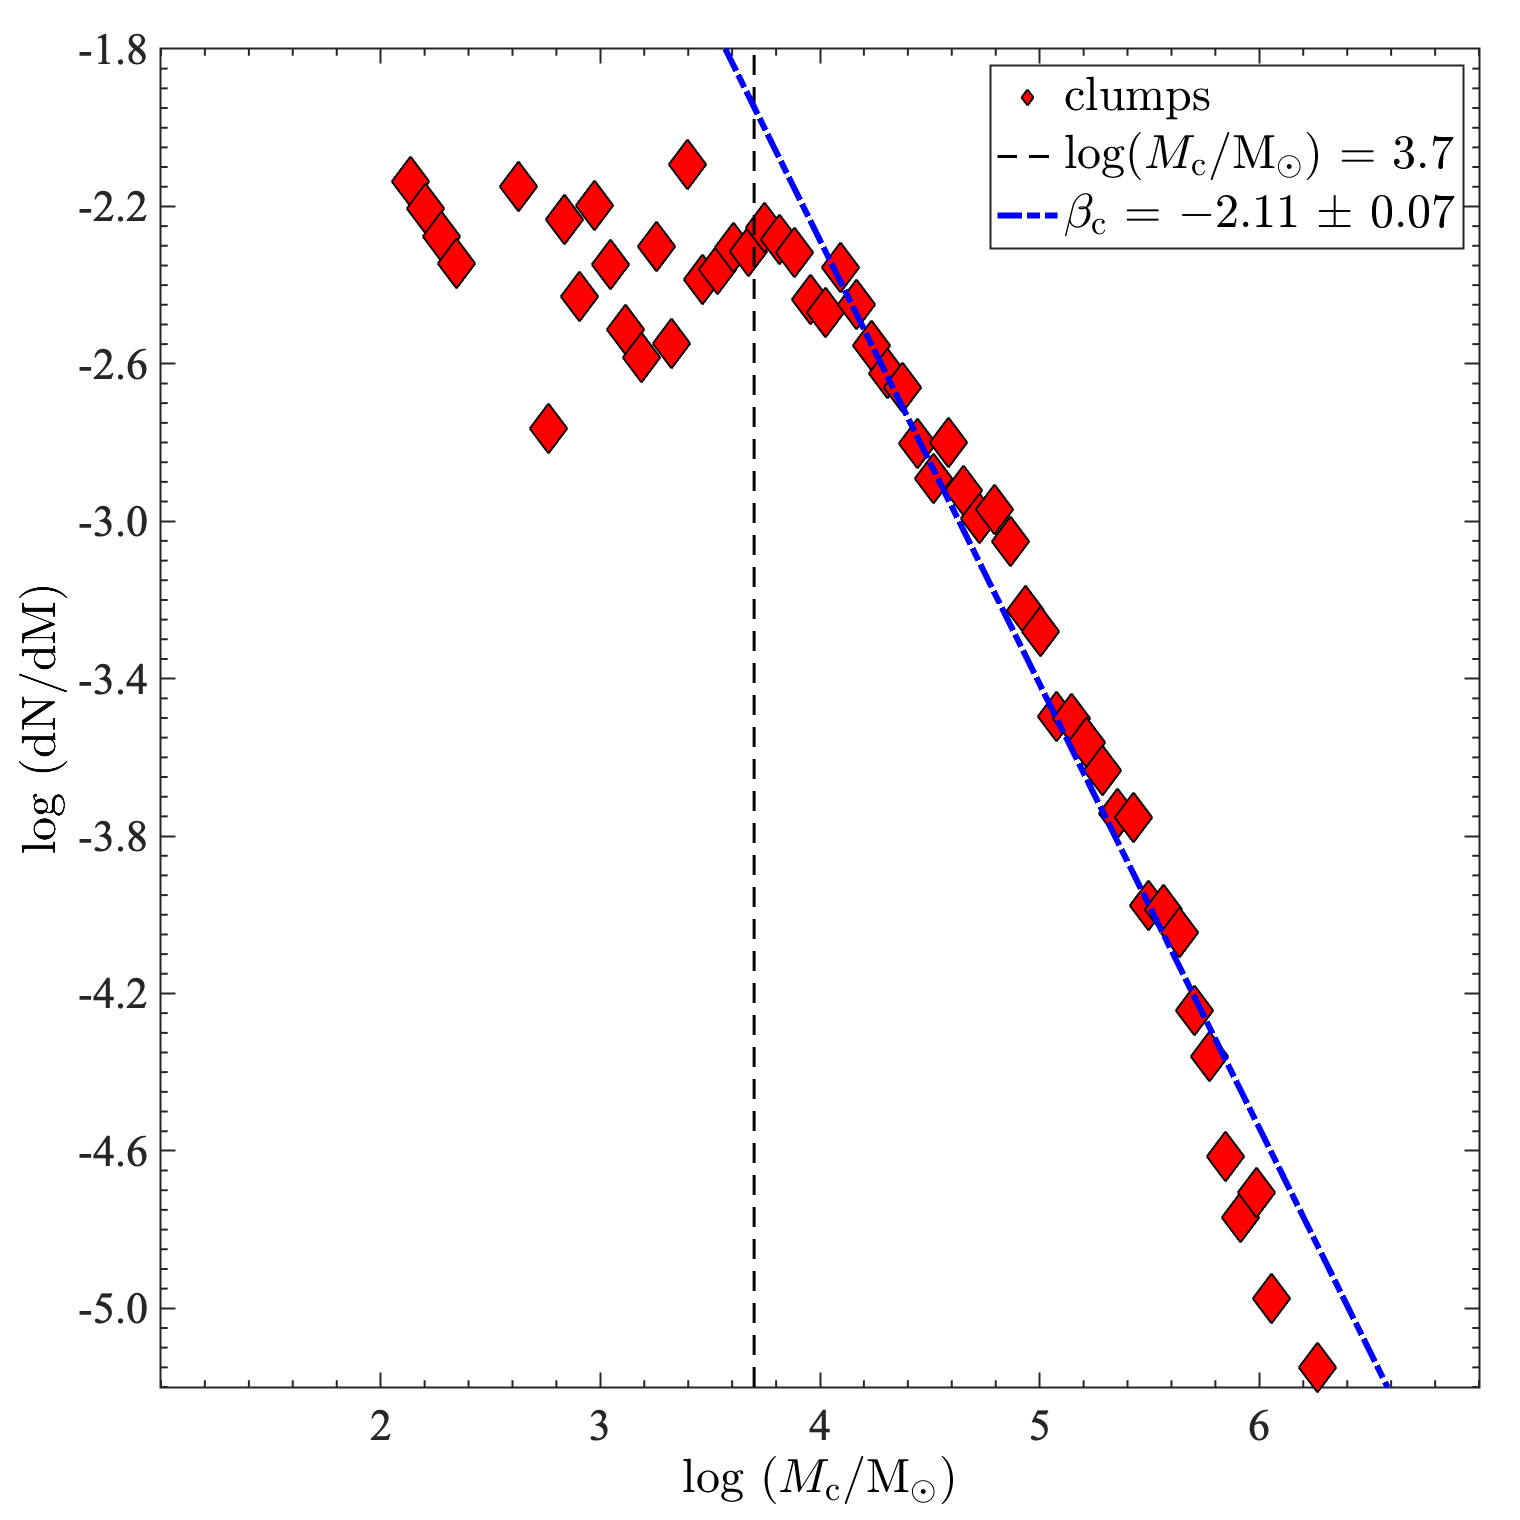
The mass function of the derived progenitor clumps (clump mass function, CMF) of OCs was also determined and compared with those of previously reported results. As shown in Figure 5, the mass function for these progenitor clumps, dd , was obtained, where the best-fitting power-law exponent was found to be = 2.11 0.07. Our adopted lower-mass limit is at log () = 3.7, because below this limit, the mass functions begin to fall significantly deviate from the extrapolated power law. Next, we derived the best-fitting value of and its error from a least-squares estimation of clump mass above the mass-fitting limit. In order to obtain the parameter index of the clump mass function, we fixed the bin widths (mass) and counted the number of clumps per bin. Besides, we adopted different values of in the range [0.3, 0.6], and the resulting indices of were within the uncertainty of above result. The derived is in good agreement with the value of 2.12 0.15 reported in the InfraRed Galactic Plane Survey (Olmi et al. 2018), commensurate with the result of 2.10 deduced from numerical simulations (Guszejnov & Hopkins 2015), and slightly flatter than ’s value (2.35, Salpeter 1955). This value also indicates that the power-law exponent of clumps harbouring predecessor OCs does not present a significant difference from the overall sample of Galactic clumps.
Both the masses and mass function of the derived progenitor clumps of OCs are almost concordant with the previously reported results of Galactic clumps, suggesting that the dynamic method adopted here should be reasonable, which also indicates a potential connection between the PM velocities of OCs and their natal clumps.
3.3 OCs and O-type stars
Massive O-type stars are believed to play a significant role in the formation and evolution of stellar clusters, and also have profound effects on open star cluster formation (e.g., Lada & Lada 2003). It is therefore of great interest to investigate whether there are O-type stars presenting in OCs.
Stellar clusters with masses of a few hundreds to are expected to contain more than one O-type star (Weidner et al. 2013). Consequently, as described in Sect. 3.2, since the masses of progenitor clumps that can produce OCs are in the range of – , they are massive enough to give birth to O-type stars. The low-mass embedded clusters in the progenitor clumps generally are difficult to evolve into OCs (e.g., Lada & Lada 2003), while for the high-mass embedded clusters, some of them probably have survived as OCs and still harbor O-type stars. Therefore, we investigated the OCs in the sample to address whether they contain O-type stars or not.
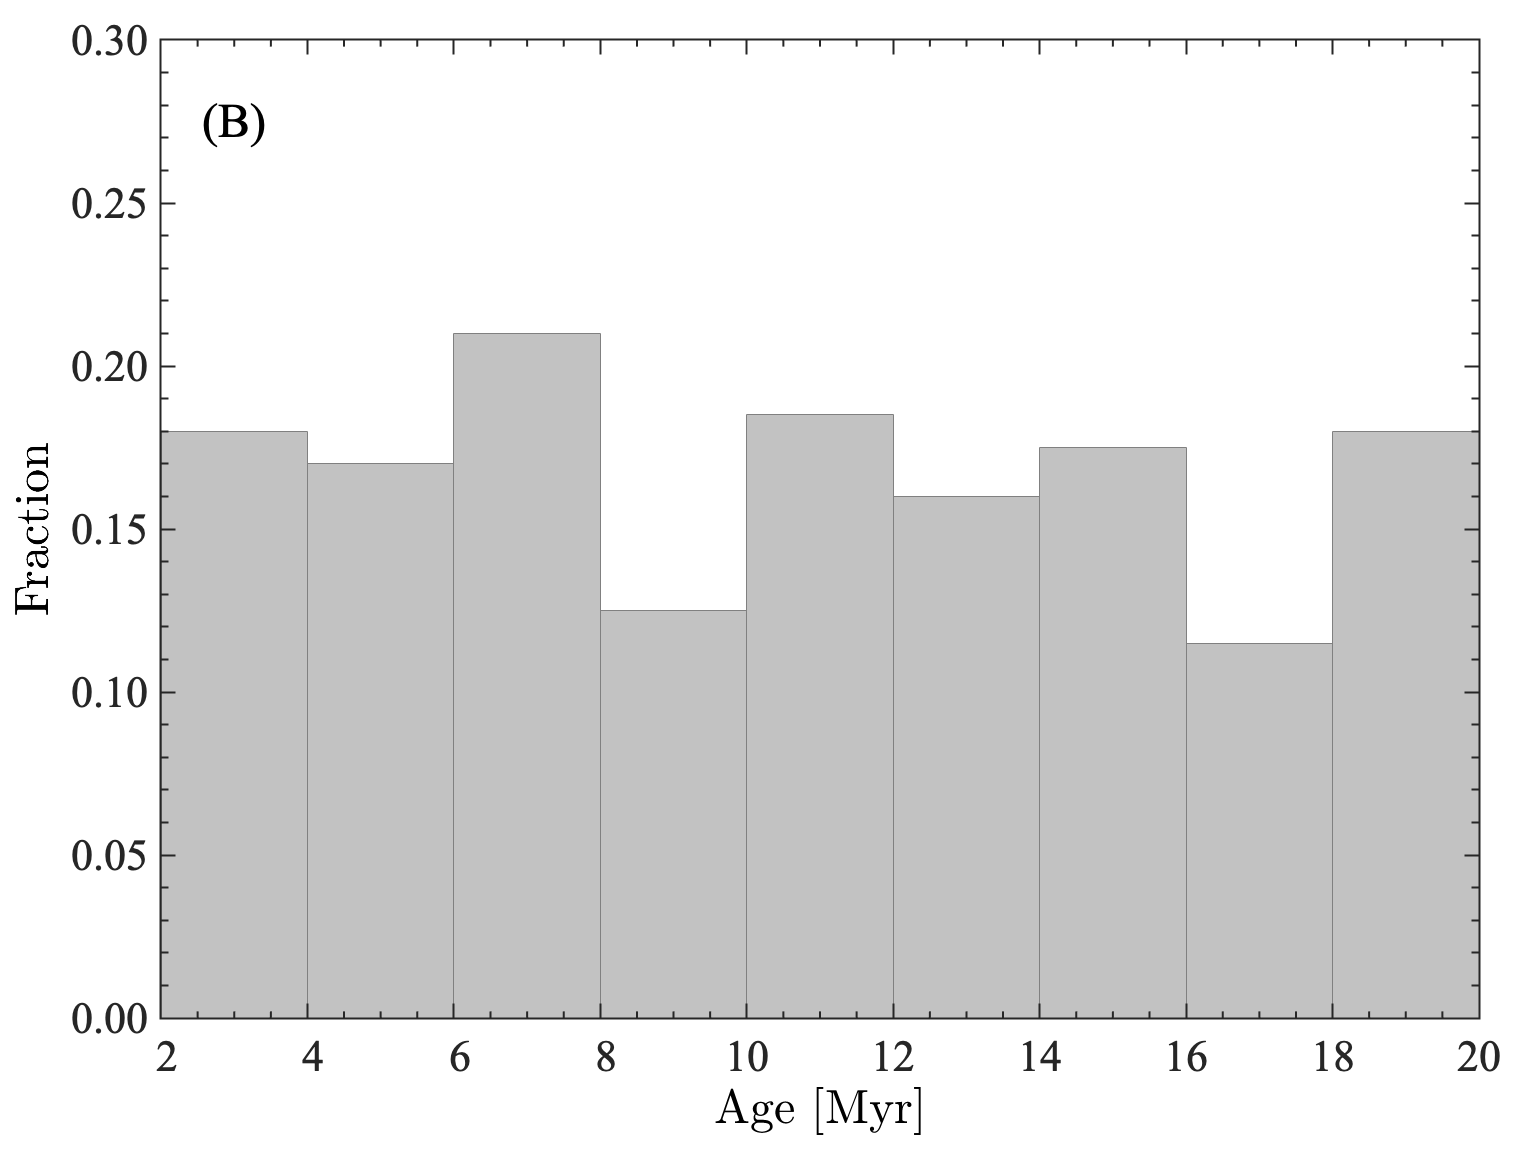
After inspecting OCs and the observed O-type stars, we found that there are many O-type stars present in present-day OCs. The O-type star catalogue used in this work, containing 1 089 O-type stars, was taken from Xu et al. (2021), who cross-matched the spectroscopically confirmed O-type stars collected by Skiff (2014) in Gaia EDR3. After cross-matching the Gaia source_id of 1 089 O-type stars with the 284 889 OC members in our sample, a total of 112 O-type stars were found in 56 OCs. Table 1 in the Appendix A presents these OCs, including their name, number and spectral types of O-type stars. The fraction of young OCs ( 10 Myr) harbouring massive O-type stars is 18. Especially, as shown in Figure 6(A), for OCs with ages of 2 to 4 Myr, the fraction of OCs harbouring O-type stars is as high as 22, which decreases to about 15 for OCs of 8 to 10 Myr.
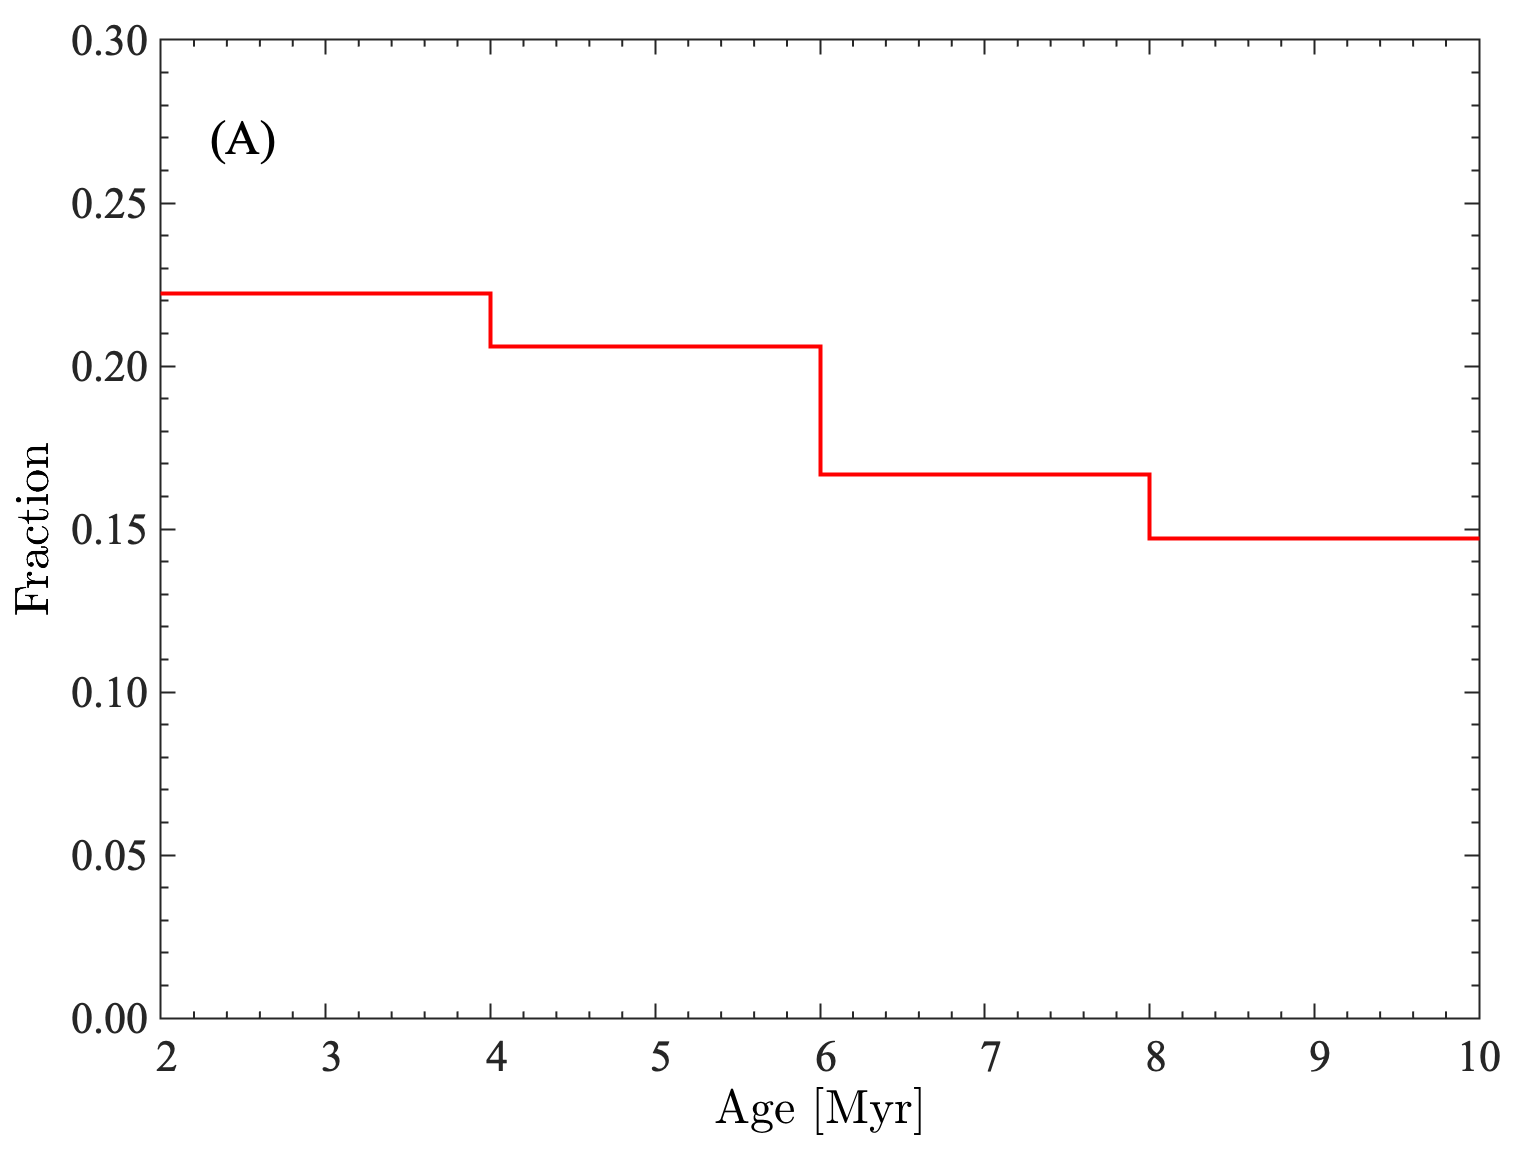
O-type stars are the most massive stars on the main sequence, and even the least massive O-type star has an initial mass of 16 (Meynet & Maeder 2003). The most massive O-type stars spend less than one Myr on the main sequence and explode as a supernova after 3 or 4 Myr, while the least massive ones can remain on the main sequence for about 10 Myr, but cool slowly during this time and become early B-type stars (Weidner & Vink 2010). Thus, if an OC contained any O-type star, there is an upper limit on the age of the cluster, i.e., at least younger than 10 Myr. As shown in Figure 6(B), the number of observed OCs does not obviously decrease at 3–4 Myr (i.e., the supernovae explosion timescale) and 10 Myr (i.e., the maximum lifetime of O-type stars), which suggests that the evolution of O-type stars probably not destroy their resident OCs.
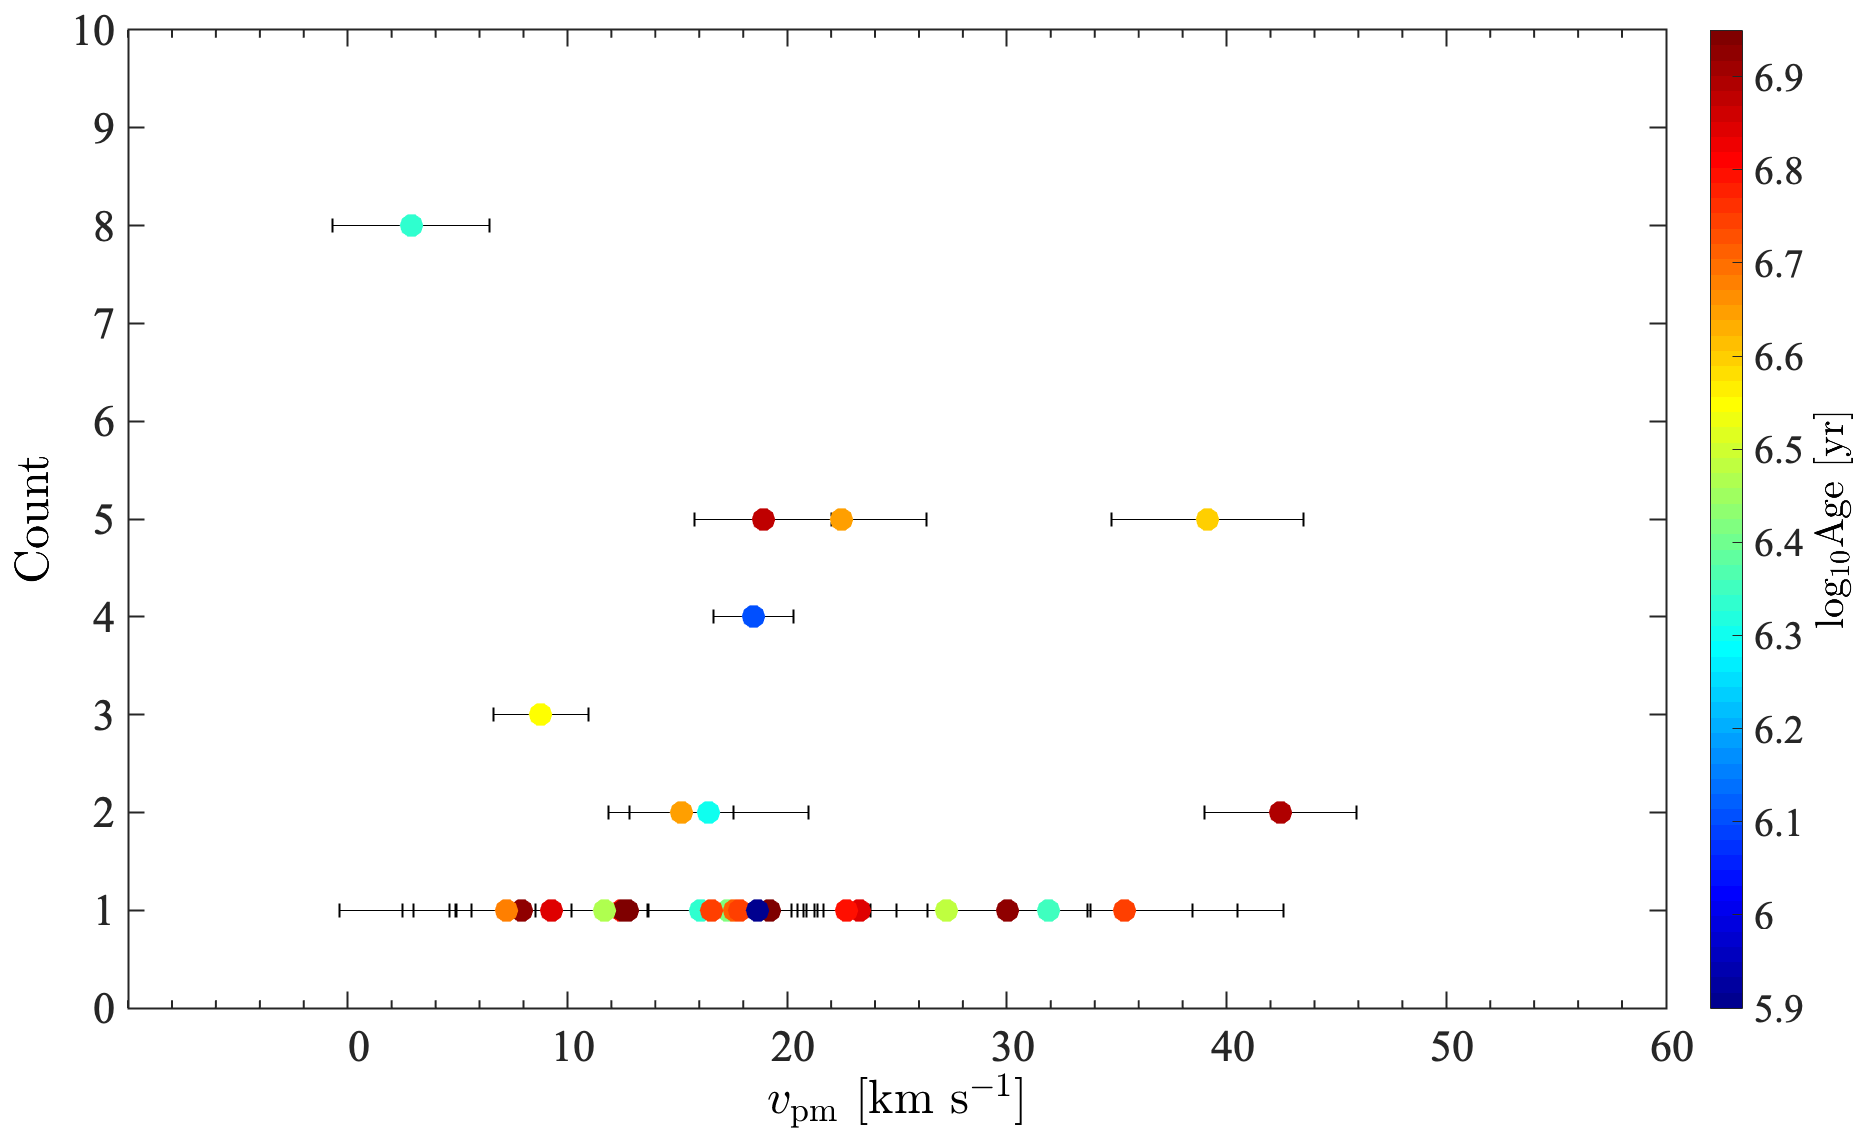
We also studied the characteristics of the PM velocities of the OCs harbouring O-type stars. The median value of for young OCs (ages 10 Myr) harbouring O-type stars is 18 3 km s-1, which is similar to that of young OCs without O-type stars, i.e., 17 5 km s-1. The mean of the young OCs containing O-type stars is 19 km s-1, while the corresponding values of OCs without O-type stars is 23 km s-1. Figure 7 shows the PM velocities of OCs containing O-type stars as a function of the number of O-type stars in the cluster. For some (e.g., distant) OCs, the astrometric uncertainties translate into large PM velocity uncertainties. The NGC 3603 and FSR 0696 OCs have significantly large PM velocity uncertainties of 183 km s-1 and 78 km s-1, respectively, as their relatively parallax errors are as high as 30%. Hence, the two clusters are not presented in Figure 7. We found that the of OCs containing 1–2 O-type stars are comparable to those with 5–8 O-type stars, indicating that there may be no relationship between the number of the harboured O-type stars and the PM velocities of OCs. Besides, about 61 of young OCs harbouring O-type stars are located in the inner Galaxy, probably due to the presence of more numerous massive GMCs (Heyer & Dame 2015).
4 Discussion
The low fraction of gravitationally bound open star clusters is still a mystery. Previous studies have shown that various stellar feedback mechanisms play important roles in the formation and evolution of stellar clusters (e.g., McKee 1989; Kroupa & Boily 2002; Murray & Rahman 2010; van Kempen et al. 2010; Krumholz et al. 2014; Bally 2016; Li et al. 2020). As the most massive stars, the formation and evolution of O-type stars are accompanied by violent feedback to their surroundings in the form of copious amounts of ultraviolet radiation, powerful stellar winds and supernova explosions (e.g., Dale et al. 2013; Dale & Bonnell 2008; Dekel & Krumholz 2013). Such destructive mechanisms can disperse the dense molecular material, and impede the birth of new stars, making it very difficult to satisfy the star formation efficiency (i.e., SFE 50, Wilking & Lada 1983) needed for the formation of bound OCs from embedded clusters (Lada & Lada 2003). The results in Sect. 3.2 and Sect. 3.3 have indicated that the progenitor clumps of OCs are capable of gestating O-type stars, and particularly, many O-type stars are even present in present-day OCs. The considerable influence caused by O-type stars in the progenitor clumps of OCs probably results in a vast majority of embedded clusters can not survive and evolve into OCs. Besides, the observed low SFEs ( 50) for most embedded clusters (Lada & Lada 2003) are probably also partially attributed to the existence of O-type stars. However, this then raises a new specific question on which embedded clusters can survive in the conditions caused by violent feedback from O-type stars.
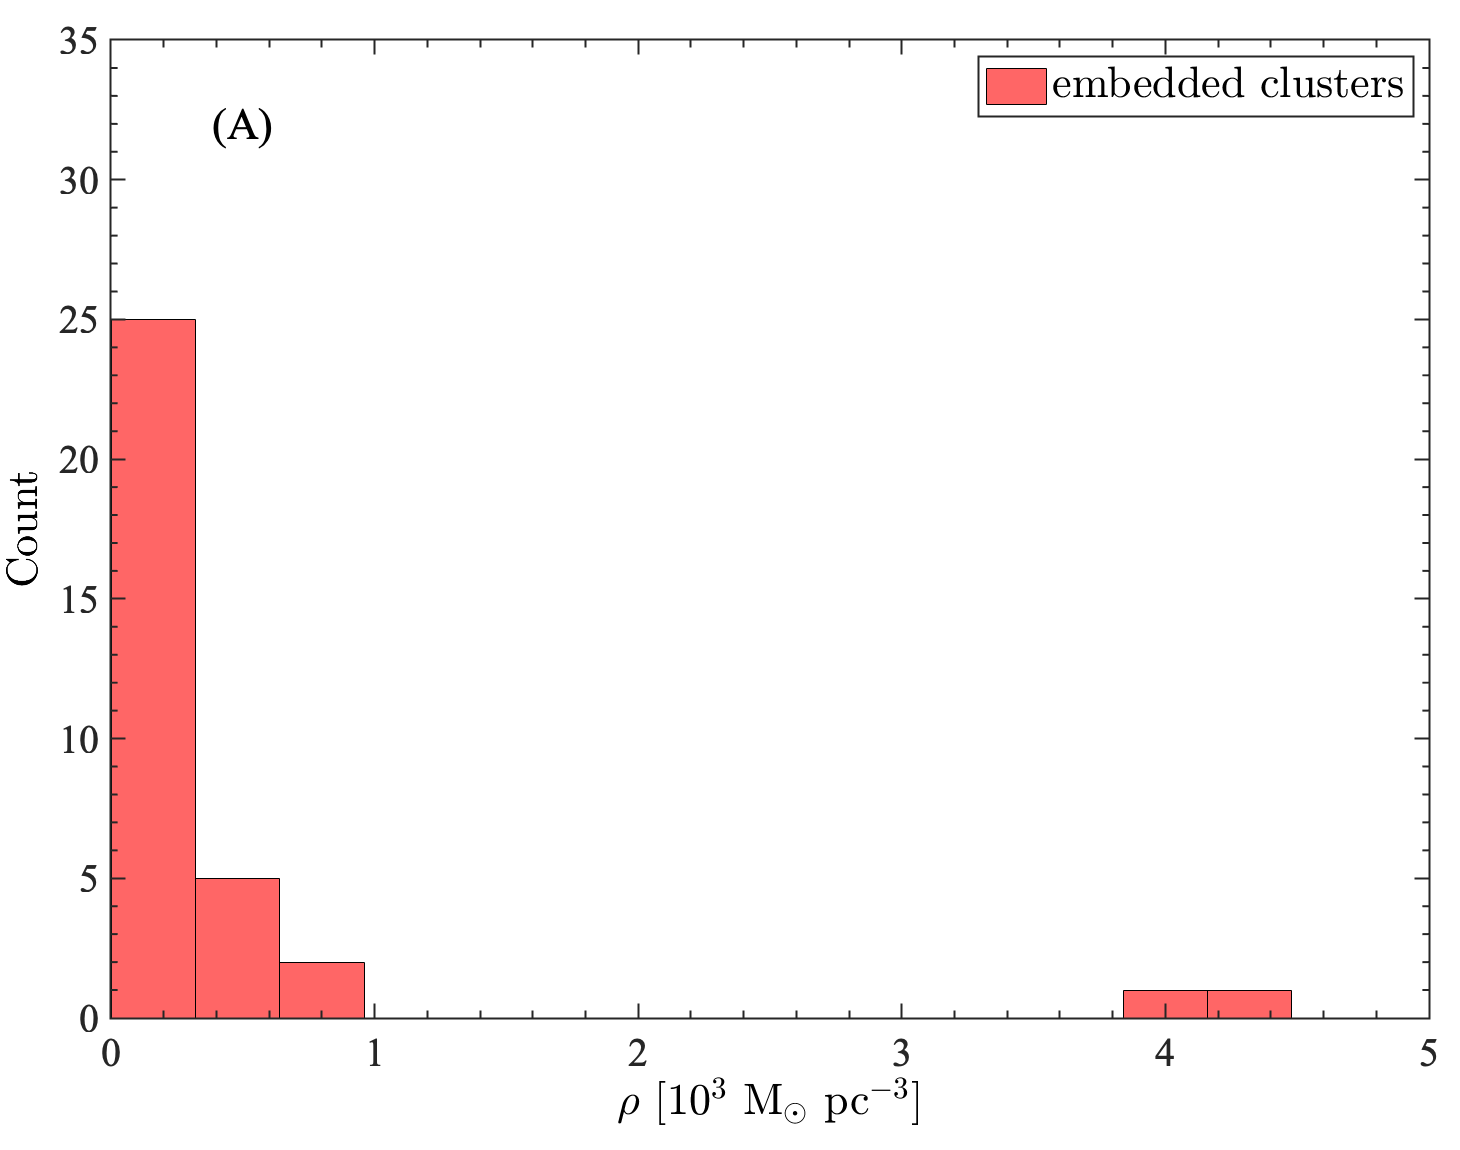
To study which embedded clusters can survive as bound OCs, we have conducted an investigation on the density properties of observed embedded clusters. The stellar mass density, , of 34 known embedded clusters was calculated based on their sizes and mass provided by Lada & Lada (2003). The result was presented in Figure 8(A). What is striking is that 6 embedded clusters have a high stellar mass density of 4.0 ; in contrast, the others are all below 1.0 . , as one of the 6 of known embedded clusters with a sufficient stellar mass density, contains O-type stars, and has been identified as a possible predecessor of an OC (Kroupa et al. 2001). Besides, it is interesting that the percentage of 6 is consistent with that of only 4–7% of embedded clusters surviving as a bound OC (Lada & Lada 2003).
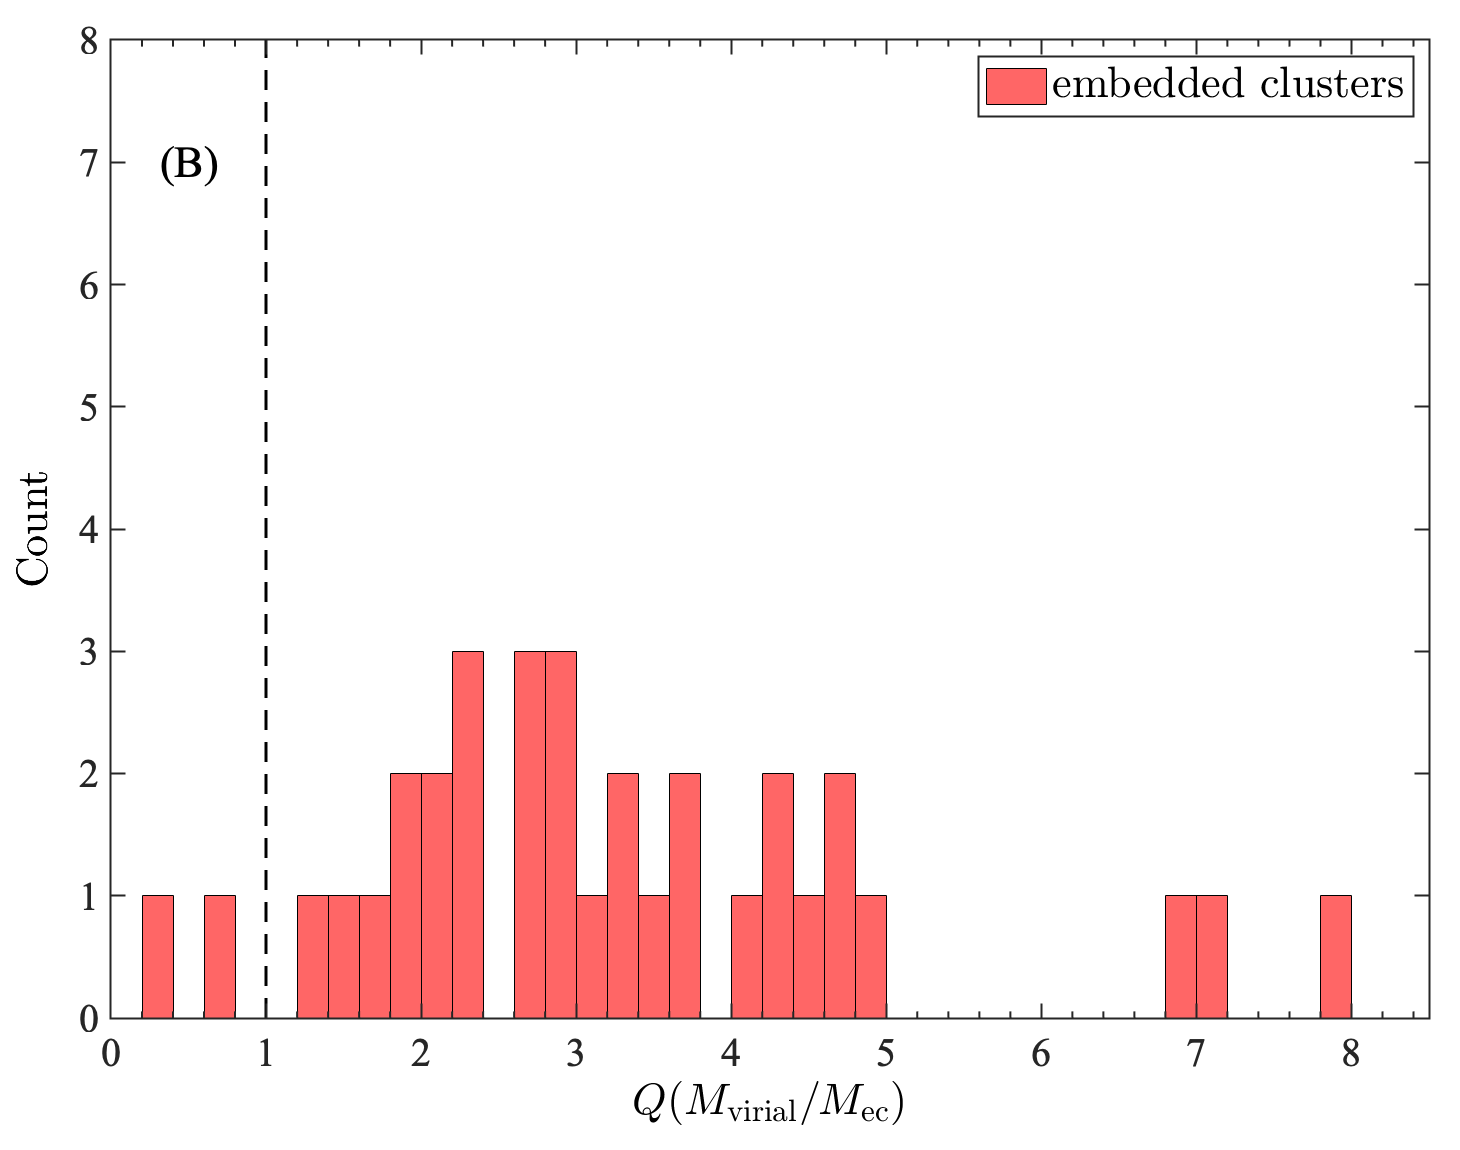
A further step has also been made to judge wether the observed embedded clusters would survive as OCs by estimating their virial parameter, (), as shown in Figure 8(B). The same as Krumholz et al. (2019), was determined as , where is the radius and is the mass of the cluster. Here, we adopted a one-dimensional velocity dispersion, , of 0.7 km s-1, which is the typical limit value of observed young bound OCs (Cantat-Gaudin & Anders 2020). Statistically, we found that only those 6 of dense embedded clusters have virial parameters of 1, which supports that they will likely evolve into bound stellar systems.
Conservatively, we speculated that the embedded clusters can survive as bound OCs as long as their stellar mass densities are sufficiently high. However, it should be noted that the mass density here is a roughly mass density threshold for embedded clusters that can evolve to the phase of bound OCs. The precise threshold of the mass density is expected to be determined using a further larger sample of embedded clusters.
5 Summary
We conducted a pilot study on the formation of OCs in the Milky Way. From infancy to the old stage, the variation of the PM velocities of OCs may be slight. Based on that, the masses of progenitor clumps capable of producing OCs were obtained through a dynamical approach, whose statistics are concordant with the known results of Galactic clumps, such as the CMF. In addition, as indicated by the masses of progenitor clumps, the investigation confirms that many massive O-type stars exist in present-day OCs, whose destructive stellar feedback can lead to a large number of embedded clusters being destroyed, even those with sufficient densities can survive, and evolve to the phase of bound OCs. These results could provide helpful indications of the OC formation and are expected to blaze a new trail for studying star formation in our Galaxy.
Acknowledgements.
We appreciate the anonymous referee for the comments which help us to improve the paper. This work was funded by the NSFC grant No. 11933011 and by the Key Laboratory for Radio Astronomy. YJL thanks support from the Natural Science Foundation of Jiangsu Province (grant number BK20210999), the Entrepreneurship and Innovation Program of Jiangsu Province, and NSFC grant No. 12203104. The authors acknowledge the open cluster catalogue compiled by Cantat-Gaudin et al. (2020). We used data from the European Space Agency mission Gaia (http://www.cosmos.esa.int/gaia), processed by the Gaia Data Processing and Analysis Consortium (DPAC; see http://www.cosmos.esa.int/web/gaia/dpac/consortium). Funding for DPAC has been provided by national institutions, in particular the institutions participating in the Gaia Multilateral Agreement.References
- Adams & Myers (2001) Adams, F. C., & Myers, P. C. 2001, ApJ, 553, 744
- Allison et al. (2009) Allison, R. J., Goodwin, S. P., Parker, R. J., et al. 2009, ApJ, 700, L99
- Bally (2016) Bally, J. 2016, ARA&A, 54, 491
- Bastian & Goodwin (2006) Bastian, N., & Goodwin, S. P. 2006, MNRAS, 369, L9
- Bressert et al. (2010) Bressert, E., Bastian, N., Gutermuth, R., et al. 2010, MNRAS, 409, L54
- Cantat-Gaudin & Anders (2020) Cantat-Gaudin, T., & Anders, F. 2020, A&A, 633, A99
- Cantat-Gaudin et al. (2018) Cantat-Gaudin, T., Jordi, C., Vallenari, A., et al. 2018, A&A, 618, A93
- Cantat-Gaudin et al. (2019) Cantat-Gaudin, T., Krone-Martins, A., Sedaghat, N., et al. 2019, A&A, 624, A126
- Cantat-Gaudin et al. (2020) Cantat-Gaudin, T., Anders, F., Castro-Ginard, A., et al. 2020, A&A, 640, A1
- Castro-Ginard et al. (2019) Castro-Ginard, A., Jordi, C., Luri, X., Cantat-Gaudin, T., & Balaguer-Núñez, L. 2019, A&A, 627, A35
- Castro-Ginard et al. (2018) Castro-Ginard, A., Jordi, C., Luri, X., et al. 2018, A&A, 618, A59
- Castro-Ginard et al. (2020) Castro-Ginard, A., Jordi, C., Luri, X., et al. 2020, A&A, 635, A45
- Castro-Ginard et al. (2022) Castro-Ginard, A., Jordi, C., Luri, X., et al. 2022, A&A, 661, A118
- Dale & Bonnell (2008) Dale, J. E., & Bonnell, I. A. 2008, MNRAS, 391, 2
- Dale et al. (2013) Dale, J. E., Ercolano, B., & Bonnell, I. A. 2013, MNRAS, 430, 234
- Dale et al. (2015) Dale, J. E., Ercolano, B., & Bonnell, I. A. 2015, MNRAS, 451, 987
- Dekel & Krumholz (2013) Dekel, A., & Krumholz, M. R. 2013, MNRAS, 432, 455
- Dias et al. (2002) Dias, W. S., Alessi, B. S., Moitinho, A., & Lépine, J. R. D. 2002, A&A, 389, 871
- Dias et al. (2014) Dias, W. S., Monteiro, H., Caetano, T. C., et al. 2014, A&A, 564, A79
- Duerr et al. (1982) Duerr, R., Imhoff, C. L., & Lada, C. J. 1982, ApJ, 261, 135
- Elmegreen & Clemens (1985) Elmegreen, B. G., & Clemens, C. 1985, ApJ, 294, 523
- Elmegreen & Falgarone (1996) Elmegreen, B. G., & Falgarone, E. 1996, ApJ, 471, 816
- Farias et al. (2018) Farias, J. P., Fellhauer, M., Smith, R., Domínguez, R., & Dabringhausen, J. 2018, MNRAS, 476, 5341
- Farias et al. (2015) Farias, J. P., Smith, R., Fellhauer, M., et al. 2015, MNRAS, 450, 2451
- Feigelson et al. (2013) Feigelson, E. D., Townsley, L. K., Broos, P. S., et al. 2013, ApJS, 209, 26
- Ferreira et al. (2020) Ferreira, F. A., Corradi, W. J. B., Maia, F. F. S., Angelo, M. S., & Santos, J. F. C., J. 2020, MNRAS, 496, 2021
- Ferreira et al. (2019) Ferreira, F. A., Santos, J. F. C., Corradi, W. J. B., Maia, F. F. S., & Angelo, M. S. 2019, MNRAS, 483, 5508
- Gaia Collaboration et al. (2016) Gaia Collaboration, Prusti, T., de Bruijne, J. H. J., et al. 2016, A&A, 595, A1
- Gaia Collaboration et al. (2018) Gaia Collaboration, Brown, A. G. A., Vallenari, A., et al. 2018, A&A, 616, A1
- Gaia Collaboration et al. (2021) Gaia Collaboration, Brown, A. G. A., Vallenari, A., et al. 2021, A&A, 649, A1
- Gaia Collaboration et al. (2022) Gaia Collaboration, Vallenari, A., Brown, A. G. A., et al. 2022, arXiv e-prints, arXiv:2208.00211
- Girichidis et al. (2012) Girichidis, P., Federrath, C., Allison, R., Banerjee, R., & Klessen, R. S. 2012, MNRAS, 420, 3264
- Grudić et al. (2018) Grudić, M. Y., Hopkins, P. F., Faucher-Giguère, C.-A., et al. 2018, MNRAS, 475, 3511
- Guszejnov & Hopkins (2015) Guszejnov, D., & Hopkins, P. F. 2015, MNRAS, 450, 4137
- Hao et al. (2022) Hao, C. J., Xu, Y., Wu, Z. Y., et al. 2022, A&A, 660, A4
- Hao et al. (2021) Hao, C. J., Xu, Y., Hou, L. G., et al. 2021, A&A, 652, A102
- Hao et al. (2020) Hao, C., Xu, Y., Wu, Z., He, Z., & Bian, S. 2020, PASP, 132, 034502
- He et al. (2021) He, Z.-H., Xu, Y., Hao, C.-J., Wu, Z.-Y., & Li, J.-J. 2021, Res. Astron. Astrophys., 21, 093
- Heyer & Dame (2015) Heyer, M., & Dame, T. M. 2015, ARA&A, 53, 583
- Kennicutt & Evans (2012) Kennicutt, R. C., & Evans, N. J. 2012, ARA&A, 50, 531
- Kharchenko et al. (2013) Kharchenko, N. V., Piskunov, A. E., Schilbach, E., Röser, S., & Scholz, R. D. 2013, A&A, 558, A53
- Koposov et al. (2017) Koposov, S. E., Belokurov, V., & Torrealba, G. 2017, MNRAS, 470, 2702
- Krause et al. (2020) Krause, M. G. H., Offner, S. S. R., Charbonnel, C., et al. 2020, Space Sci. Rev., 216, 64
- Kroupa et al. (2001) Kroupa, P., Aarseth, S., & Hurley, J. 2001, MNRAS, 321, 699
- Kroupa & Boily (2002) Kroupa, P., & Boily, C. M. 2002, MNRAS, 336, 1188
- Krumholz et al. (2019) Krumholz, M. R., McKee, C. F., & Bland-Hawthorn, J. 2019, ARA&A, 57, 227
- Krumholz et al. (2014) Krumholz, M. R., Bate, M. R., Arce, H. G., et al. 2014, in Protostars and Planets VI, ed. H. Beuther, R. S. Klessen, C. P. Dullemond, & T. Henning, 243
- Kuhn et al. (2019) Kuhn, M. A., Hillenbrand, L. A., Sills, A., Feigelson, E. D., & Getman, K. V. 2019, ApJ, 870, 32
- Lada & Lada (2003) Lada, C. J., & Lada, E. A. 2003, ARA&A, 41, 57
- Li et al. (2020) Li, Y., Xu, Y., Sun, Y., & Yang, J. 2020, ApJS, 251, 26
- Liu & Pang (2019) Liu, L., & Pang, X. 2019, ApJS, 245, 32
- McKee (1989) McKee, C. F. 1989, ApJ, 345, 782
- McKee & Ostriker (2007) McKee, C. F., & Ostriker, E. C. 2007, ARA&A, 45, 565
- McMillan et al. (2007) McMillan, S. L. W., Vesperini, E., & Portegies Zwart, S. F. 2007, ApJ, 655, L45
- Megeath et al. (2016) Megeath, S. T., Gutermuth, R., Muzerolle, J., et al. 2016, AJ, 151, 5
- Meynet & Maeder (2003) Meynet, G., & Maeder, A. 2003, A&A, 404, 975
- Murray (2011) Murray, N. 2011, ApJ, 729, 133
- Murray & Rahman (2010) Murray, N., & Rahman, M. 2010, ApJ, 709, 424
- Offner et al. (2009) Offner, S. S. R., Hansen, C. E., & Krumholz, M. R. 2009, ApJ, 704, L124
- Olmi et al. (2018) Olmi, L., Elia, D., Schisano, E., & Molinari, S. 2018, MNRAS, 480, 1831
- Proszkow & Adams (2009) Proszkow, E.-M., & Adams, F. C. 2009, ApJS, 185, 486
- Proszkow et al. (2009) Proszkow, E.-M., Adams, F. C., Hartmann, L. W., & Tobin, J. J. 2009, ApJ, 697, 1020
- Rathborne et al. (2006) Rathborne, J. M., Jackson, J. M., & Simon, R. 2006, ApJ, 641, 389
- Reid et al. (2009) Reid, M. J., Menten, K. M., Zheng, X. W., et al. 2009, ApJ, 700, 137
- Reid et al. (2019) Reid, M. J., Menten, K. M., Brunthaler, A., et al. 2019, ApJ, 885, 131
- Roberts (1957) Roberts, M. S. 1957, PASP, 69, 59
- Roman-Duval et al. (2010) Roman-Duval, J., Jackson, J. M., Heyer, M., Rathborne, J., & Simon, R. 2010, ApJ, 723, 492
- Salpeter (1955) Salpeter, E. E. 1955, ApJ, 121, 161
- Schmeja et al. (2014) Schmeja, S., Kharchenko, N. V., Piskunov, A. E., et al. 2014, A&A, 568, A51
- Schmeja et al. (2008) Schmeja, S., Kumar, M. S. N., & Ferreira, B. 2008, MNRAS, 389, 1209
- Scholz et al. (2015) Scholz, R. D., Kharchenko, N. V., Piskunov, A. E., Röser, S., & Schilbach, E. 2015, A&A, 581, A39
- Sills et al. (2018) Sills, A., Rieder, S., Scora, J., McCloskey, J., & Jaffa, S. 2018, MNRAS, 477, 1903
- Sim et al. (2019) Sim, G., Lee, S. H., Ann, H. B., & Kim, S. 2019, J. Korean Astron. Soc., 52, 145
- Skiff (2014) Skiff, B. A. 2014, VizieR Online Data Catalog, B/mk
- Smith et al. (2011) Smith, R., Fellhauer, M., Goodwin, S., & Assmann, P. 2011, MNRAS, 414, 3036
- Smith et al. (2013) Smith, R., Goodwin, S., Fellhauer, M., & Assmann, P. 2013, MNRAS, 428, 1303
- Soubiran et al. (2018) Soubiran, C., Cantat-Gaudin, T., Romero-Gómez, M., et al. 2018, A&A, 619, A155
- Tarricq et al. (2021) Tarricq, Y., Soubiran, C., Casamiquela, L., et al. 2021, A&A, 647, A19
- Urquhart et al. (2014) Urquhart, J. S., Moore, T. J. T., Csengeri, T., et al. 2014, MNRAS, 443, 1555
- Urquhart et al. (2018) Urquhart, J. S., König, C., Giannetti, A., et al. 2018, MNRAS, 473, 1059
- van Kempen et al. (2010) van Kempen, T. A., Kristensen, L. E., Herczeg, G. J., et al. 2010, A&A, 518, L121
- Weidner et al. (2013) Weidner, C., Kroupa, P., & Pflamm-Altenburg, J. 2013, MNRAS, 434, 84
- Weidner & Vink (2010) Weidner, C., & Vink, J. S. 2010, A&A, 524, A98
- Whitmore et al. (1999) Whitmore, B. C., Zhang, Q., Leitherer, C., et al. 1999, AJ, 118, 1551
- Wilking & Lada (1983) Wilking, B. A., & Lada, C. J. 1983, ApJ, 274, 698
- Wong et al. (2008) Wong, T., Ladd, E. F., Brisbin, D., et al. 2008, MNRAS, 386, 1069
- Wright et al. (2014) Wright, N. J., Parker, R. J., Goodwin, S. P., & Drake, J. J. 2014, MNRAS, 438, 639
- Wu et al. (2009) Wu, Z.-Y., Zhou, X., Ma, J., & Du, C.-H. 2009, MNRAS, 399, 2146
- Xu et al. (2021) Xu, Y., Hou, L. G., Bian, S. B., et al. 2021, A&A, 645, L8
- Xu et al. (2013) Xu, Y., Li, J. J., Reid, M. J., et al. 2013, ApJ, 769, 15
Appendix A Additional Tables
Table 1 presents the OCs harbouring O-type stars.
| OC name () | O name (Spectral type) | OC name () | O name (Spectral type) | ||
|---|---|---|---|---|---|
| Alessi 43 (7.06) | 1 | HD 75759 (O9V+B0V) | Berkeley 87 (6.92) | 1 | NGC 6913+37 513 (O9) |
| Hogg 15 (6.34) | 1 | HD 311884 (O5?V?) | LP_2179 (5.80) | 1 | HD 194094 (O8.5III) |
| IC 1396 (7.08) | 1 | HD 239729 (O9V) | NGC 457 (7.32) | 1 | Cl* NGC 457 Hoag 5 (O9.5IV) |
| Stock 8 (7.16) | 1 | LS V+34 21 (O8) | NGC 6871 (6.74) | 1 | HD 190864 (O6.5III(f)) |
| BH 121 (6.42) | 1 | HD 101298 (O6.5IV((f))) | NGC 6193 (6.71) | 1 | HD 150135 (O6.5V((f))z) |
| UBC 545 (7.55) | 1 | LS 3656 (O9:) | Trumpler 15 (6.95) | 1 | Cl Trumpler 15 20 (O:) |
| UBC 609 (6.75) | 1 | Sh 2-208 1 (O9.5V) | UPK 169 (7.14) | 1 | HD 207538 (O9.7IV) |
| IRAS02232+6138 (6.85) | 1 | BD+61 411 (O6.5V((f))z) | FSR 0647 (6.46) | 1 | LS I +57 138 (O8Vz) |
| FSR 0696 (6.82) | 1 | Sh 2-217 2 (O9.5V) | Wit 1 (6.35) | 1 | HD 52266 (O9.5IIIn) |
| NGC 6847 (8.70) | 1 | Sh 2- 97 7 (O9/B0V) | UBC 404 (6.74) | 1 | BD+60 2635 (O6V((f))) |
| Collinder 316 (6.68) | 1 | HD 152590 (O7.5Vz) | Teutsch 127 (6.74) | 1 | BD+55 2722 B (O9.5V) |
| IC 1590 (6.79) | 1 | HD 5005 D (O9.2V) | He2020_60 (8.30) | 1 | TYC 0170-1152-1 (O7) |
| UBC 266 (7.11) | 1 | HD 96622 (O9.2IV) | UBC 267 (7.11) | 1 | HD 97848 (O8V) |
| UBC 633 (7.13) | 1 | LS 489 (O9V) | Collinder 223 (8.20) | 1 | LS 1614 (O9.5Ib) |
| Loden 153 (6.30) | 1 | HD 91824 (O7V((f))z) | Feinstein 1 (7.20) | 1 | HD 96670 (O8.5f(n)p) |
| Hogg 22 (6.80) | 1 | CPD-46 8221 (O9.7II-III) | Havlen-Moffat 1 (6.95) | 1 | Cl HM 1 8 (O5III(f)) |
| IRAS20286+4105 (7.95) | 1 | V1827 Cyg (O6Iaf+O9:Ia:) | Collinder 240 (6.95) | 1 | [J80] 1-123 (O8) |
| SAI 113 (6.95) | 1 | 2MASS J10224096-5930305 | Majaess 133 (6.48) | 1 | 2MASS J10583238-6110565 |
| (O7V((f))n) | (O5V((f))+O7V((f))) | ||||
| SAI 24 (6.84) | 1 | HD 18326 | FSR 0236 (8.20) | 2 | [MT91] 227 (O9V) |
| (O6.5V((f))z+O9/B0V:) | Cyg OB2 6 (O8.5V(n)) | ||||
| Muzzio 1 (6.89) | 2 | CPD-47 2962 (O7V((f))) | NGC 1893(6.64) | 2 | LS V+33 15 (O7V(n)z) |
| MO 2-56 (O9.5V) | BD+33 1025 A (O7.5V(n)z) | ||||
| Collinder 232 (6.30) | 2 | HD 303311 (O7V) | Pismis 20 (7.50) | 2 | [OM80] 40 (O9.5Ib) |
| HD 93250 AB (O4IV(fc)) | Cl* Pismis 20 MV 2 (O8.5I) | ||||
| UBC 344 (6.54) | 3 | BD-12 4964 (O7V:) | NGC 2244 (7.10) | 3 | HD 46056 A (O8Vn) |
| LS 4880 (O6V((f))) | HD 46223 (O4V((f))) | ||||
| LS IV -11 8 (O8V) | HD 46485 (O7V((f))n) | ||||
| Trumpler 16 (7.13) | 3 | HD 93204 (O6/7V) | Berkeley 59 (6.10) | 4 | BD+66 1673 (O5.5((f))(n)) |
| Cl Trumpler 16 3 | BD+66 1674 (O9.7IV:) | ||||
| (O9.5/B0.5V) | BD+66 1675 (O7.5Vz) | ||||
| Cl Trumpler 16 112 (O7V) | TYC 4026-0424-1 (O7V((f))z) | ||||
| Trumpler 14 (7.80) | 5 | HD 303312 (O9.5/B0V) | NGC 3603 (6.00) | 4 | Cl* NGC 3603 Sher 57 (O3III(f)) |
| Cl Trumpler 14 20 (ON8V) | Cl* NGC 3603 MDS 48 (O3.5If*) | ||||
| Cl Trumpler 14 5 (O9:V) | Cl* NGC 3603 MDS 24 (O4IV(f)) | ||||
| HD 93128 (O3.5V((f))) | Cl* NGC 3603 Sher 23 (OC9.7Ia) | ||||
| HD 93161 B (O6.5IV((f))) | Trumpler 24 (6.92) | 1 | HD 152559 (O9.5V) | ||
| Havlen Moffat 1 (6.60) | 5 | Cl HM 1 12 (O6If) | Westerlund 2 (–) | 4 | Westerlund 2 MSP 182 |
| Cl HM 1 20 (O9.5V) | (O4III/V((f))) | ||||
| Cl HM 1 18 (O7V((f))) | WR 20a (O3If*/WN6ha) | ||||
| Cl HM 1 19 (O9V) | Westerlund 2 MSP 188 (O4III/V) | ||||
| Cl HM 1 9 (O9.7V) | Westerlund 2 MSP 171 (O4/5V) | ||||
| IC 1805 (6.88) | 5 | BD+60 499 (O9.5V) | vdBergh-Hagen 121 | 5 | HD 308813 (O9.7IV(n)) |
| BD+60 501 (O7V((f))(n)z) | HD 101190 (O6IV((f))) | ||||
| HD 15570 (O4If) | HD 101191 (O8V) | ||||
| HD 15629 (O4.5V((fc))) | HD 101223 (O8V) | ||||
| BD+60 513 (O7Vn) | HD 101298 (O6.5IV((f))) | ||||
| NGC 6357 (–) | 7 | [N78] 46 (O7.5Vz) | NGC 6611 (6.33) | 8 | Cl* NGC 6611 ESL 029 (O8.5V) |
| Cl Pismis 24 10 (O9V) | Cl* NGC 6611 ESL 017 (O9V) | ||||
| Cl Pismis 24 3 (O7.5:V) | HD 168075 (O6.5V((f))) | ||||
| Cl Pismis 24 2 (O5V((f))) | NGC 6611 222 (O7V((f))z) | ||||
| Cl Pismis 24 16 (O7.5V) | BD-13 4928 (O9.5V) | ||||
| Cl Pismis 24 17 (O3.5III(f*)) | BD-13 4930 (O8.5V) | ||||
| Cl Pismis 24 13 (O6V((f))z) | HD 168137 (O8Vz) | ||||
| HD 168183 (O9.5III + B3/5III/V) | |||||
| NGC 6231 (7.14) | 8 | HD 326331 (O8IV((f))n) | NGC 6231 (7.14) | 8 | HD 152199 (O9.7V) |
| HD 152147 (O9.7Ib) | HD 152247 (O9.2III) | ||||
| HD 326329 (O9.7V) | HD 152249 (OC9Iab) | ||||
| HD 152314 (O9IV) | HD 152248 AaAb (O7Iabf+O7Ib(f)) |
is the number of O-type stars in OCs.