The Importance of the Signal/Noise Distinction for Eye Movement Biometric Performance
Abstract
Prior research states that sine-wave frequencies below 100 Hz carry the eye movement signal, and frequencies above 100 Hz can be considered noise. Here, we explore the biometric implications of this signal/noise distinction. We expect that there are important individual differences in the way subjects move their eyes, and this should lead to reliable biometric performance in the signal part. Although there is minimal eye-movement information in the noise part of the recordings, there may be important individual differences in the noise. The results suggest that the signal part contains the most important amount of identity-specific information, as anticipated. Nevertheless, the noise part performs substantially better than chance, and therefore must contain individual-specific information that distinguishes between individuals. This pattern holds for both short- ( 20 min) and long-term ( 1 year) biometric evaluations.
Keywords Eye Tracking Biometric Signal Noise
1 Introduction
A person’s identity is reflected in both their biological and behavioral characteristics. In ordinary life, we recognize our friends and colleagues by such characteristics. It is well established that anatomical characteristics such as face, fingerprint, and iris can be used to authenticate individuals in biometric systemsJain et al. (2007); Council et al. (2010). Similarly, behavioral characteristics such as handwriting, voice, and signature can be used in the same way. Currently, there is substantial interest in the use of eye movements for biometric analysis. The human oculomotor system is a highly complex amalgam of neurological, physiological and anatomical systems. Recent biometric authentication studies have based on oculomotor recordings Lohr et al. (2020a); Lohr and Komogortsev (2022); Lohr et al. (2020b, 2022); Jäger et al. (2020); Makowski et al. (2021). Eye movements have also been shown to be spoof-resistant Rigas and Komogortsev (2015); Raju et al. (2022); Komogortsev et al. (2015).
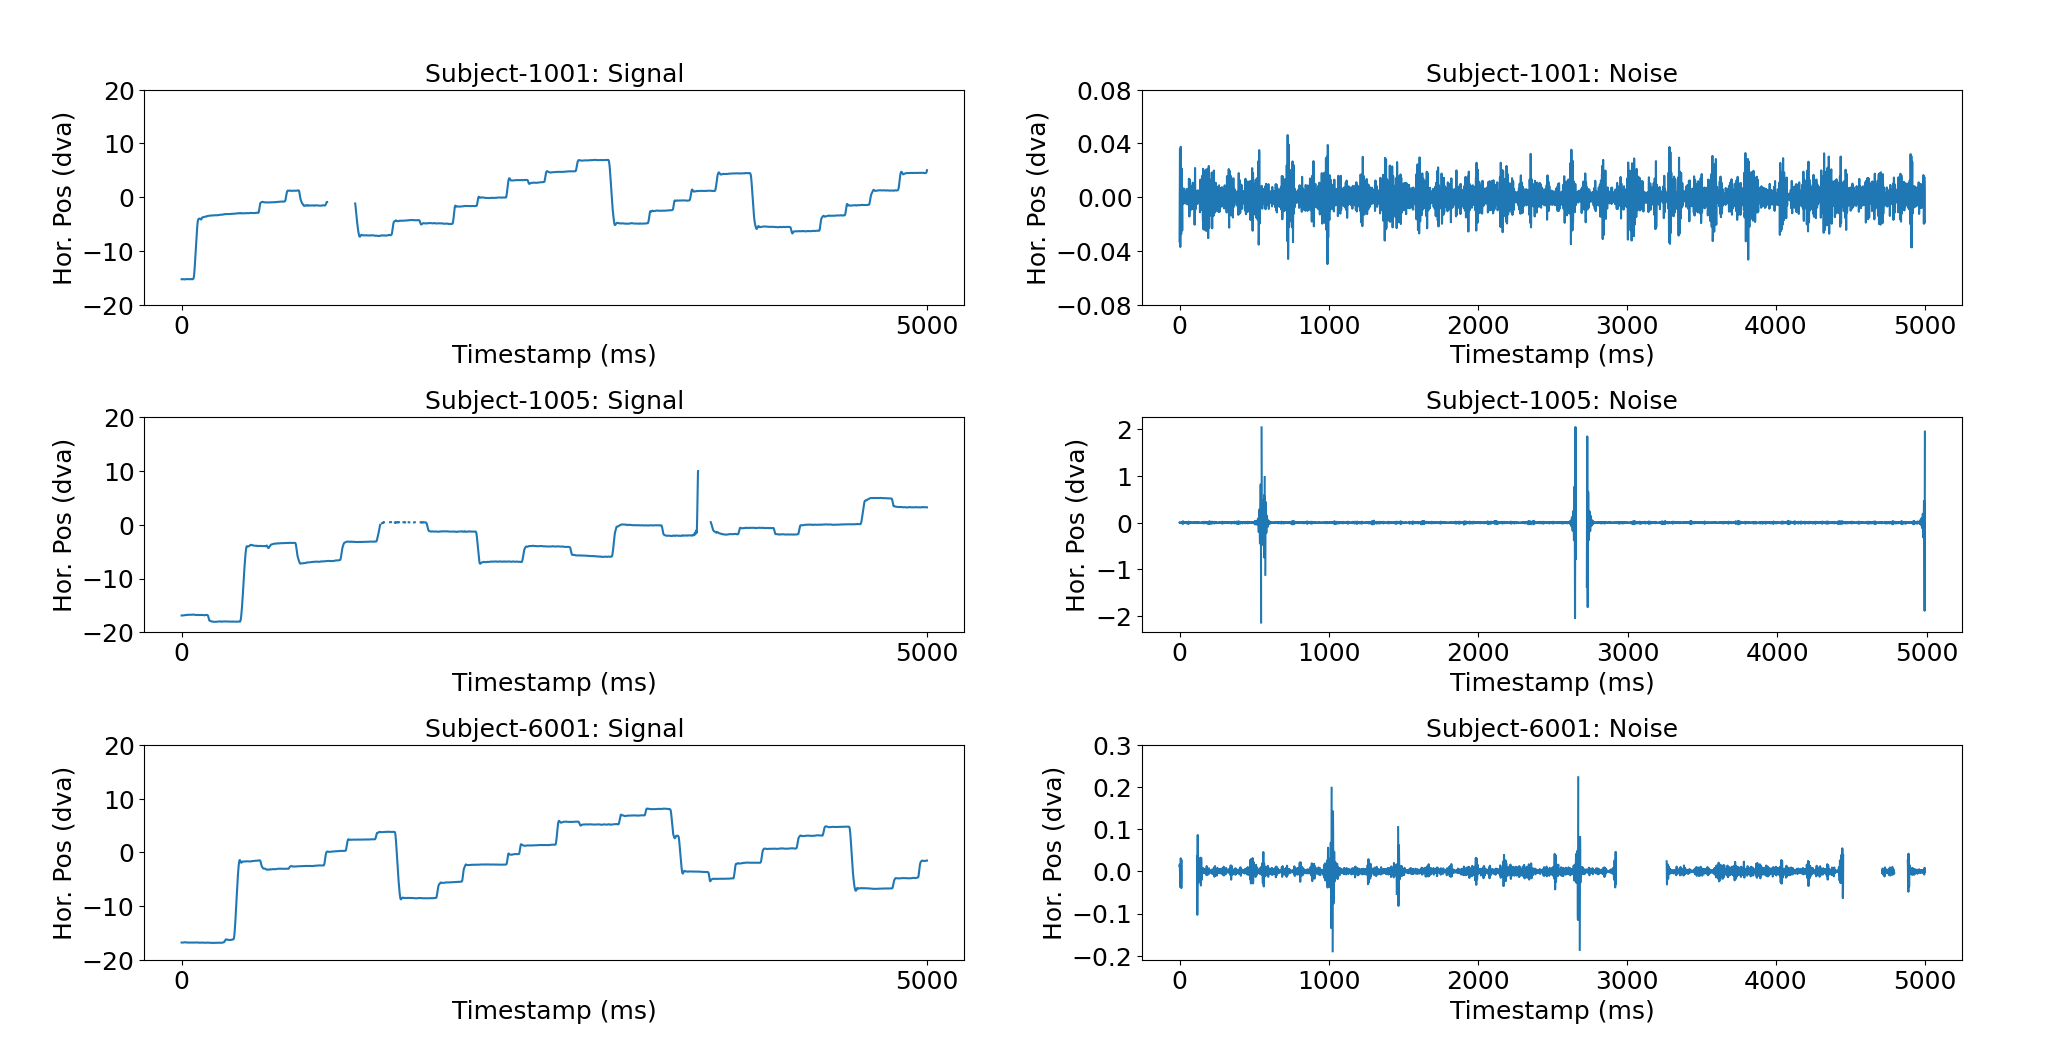
Several research teams are currently working on eye movement-based biometrics (EMB) to create an advanced machine-learning approach that can be applied in practical situations. Typically, EMB studies employ either filtered or unfiltered signal types. We are not aware of any prior EMB research that has tried to split eye-movement data into its “signal” and “noise” portions using digital filters. See Fig. 1 for several exemplars of signal and noise.
The main objectives of this study are:
-
•
To distinguish between the signal and noise parts of the eye movement data using the filtering approach suggested by Raju et al. (2023a).
-
•
To compare the biometric performance on the “signal" and “noise" parts of the eye movement data. We hypothesize that the “signal” portions of the recordings will perform better than the “noise” portion but we do not know if the noise part will perform better than chance.
-
•
To compare biometric performance on “signal” and “noise” from a short-term dataset (recordings 20 min apart) to a long-term (recordings 1 year apart) dataset.
2 Prior Work
2.1 Prior work on EMB
Kasprowski Kasprowski and Ober (2004) introduced eye movement as a biometric modality that can be used in human identification. Since then, there has been much research related to eye movement biometrics. The main objective was to come up with a state-of-the-art approach for user authentication. We categorize the approaches into two types: statistical feature-based approach and end-to-end machine learning-based approach.
The statistical feature-based approach involves a common processing pipeline, where recordings are divided into specific eye movement events using a classification algorithm, and then a biometric template is formed as a vector of discrete features from each event Rigas and Komogortsev . However, event classification can be challenging And (2017) and impact biometric performance, depending on the event classification algorithm used. A number of eye-movement event classification algorithms have been proposed Nyström and Holmqvist (2010); Pekkanen and Lappi (2017); Dar et al. (2021); Friedman et al. (2018). Prior research such as Lohr et al. (2020b); Friedman et al. (2017); Li et al. (2018) employed this type of approach.
On the other hand, recently end-to-end deep learning workflows have become very popular. There are a number of studies of this type already published (Lohr et al. (2020a); Lohr and Komogortsev (2022); Lohr et al. (2022); Jäger et al. (2020); Makowski et al. (2021); Jia et al. (2018); Abdelwahab and Landwehr (2019); Makowski et al. (2020)).
2.2 Prior work on filtering Eye Movement Data
Stampe Stampe (1993) proposed two heuristic filters for video-oculography data. These filters have been widely adopted and modified by various manufacturers, including SR-Research, Tobii T60 XL, and SMI. SR Research (EyeLink 1000 manufacturer) uses a modified version of the original heuristic filters proposed by Stampe. Within the EyeLink family of eye trackers, these two filters are known as the standard (STD) and extra (EXTRA) filters.
Various digital filter types Raju et al. (2023a); Mack et al. (2017) have been applied to eye-movement recordings. In most cases, low-pass filters were applied to eliminate the “noise” portion of the recording. According to Raju et al. (2023b), lower-frequency components ( Hz) comprise the “signal” portion of the recordings, and higher frequency components (Hz) comprise the “noise” portion of the data. These prior works motivated us to determine how the biometric performance of “signal” compares to “noise”.
3 Methodology
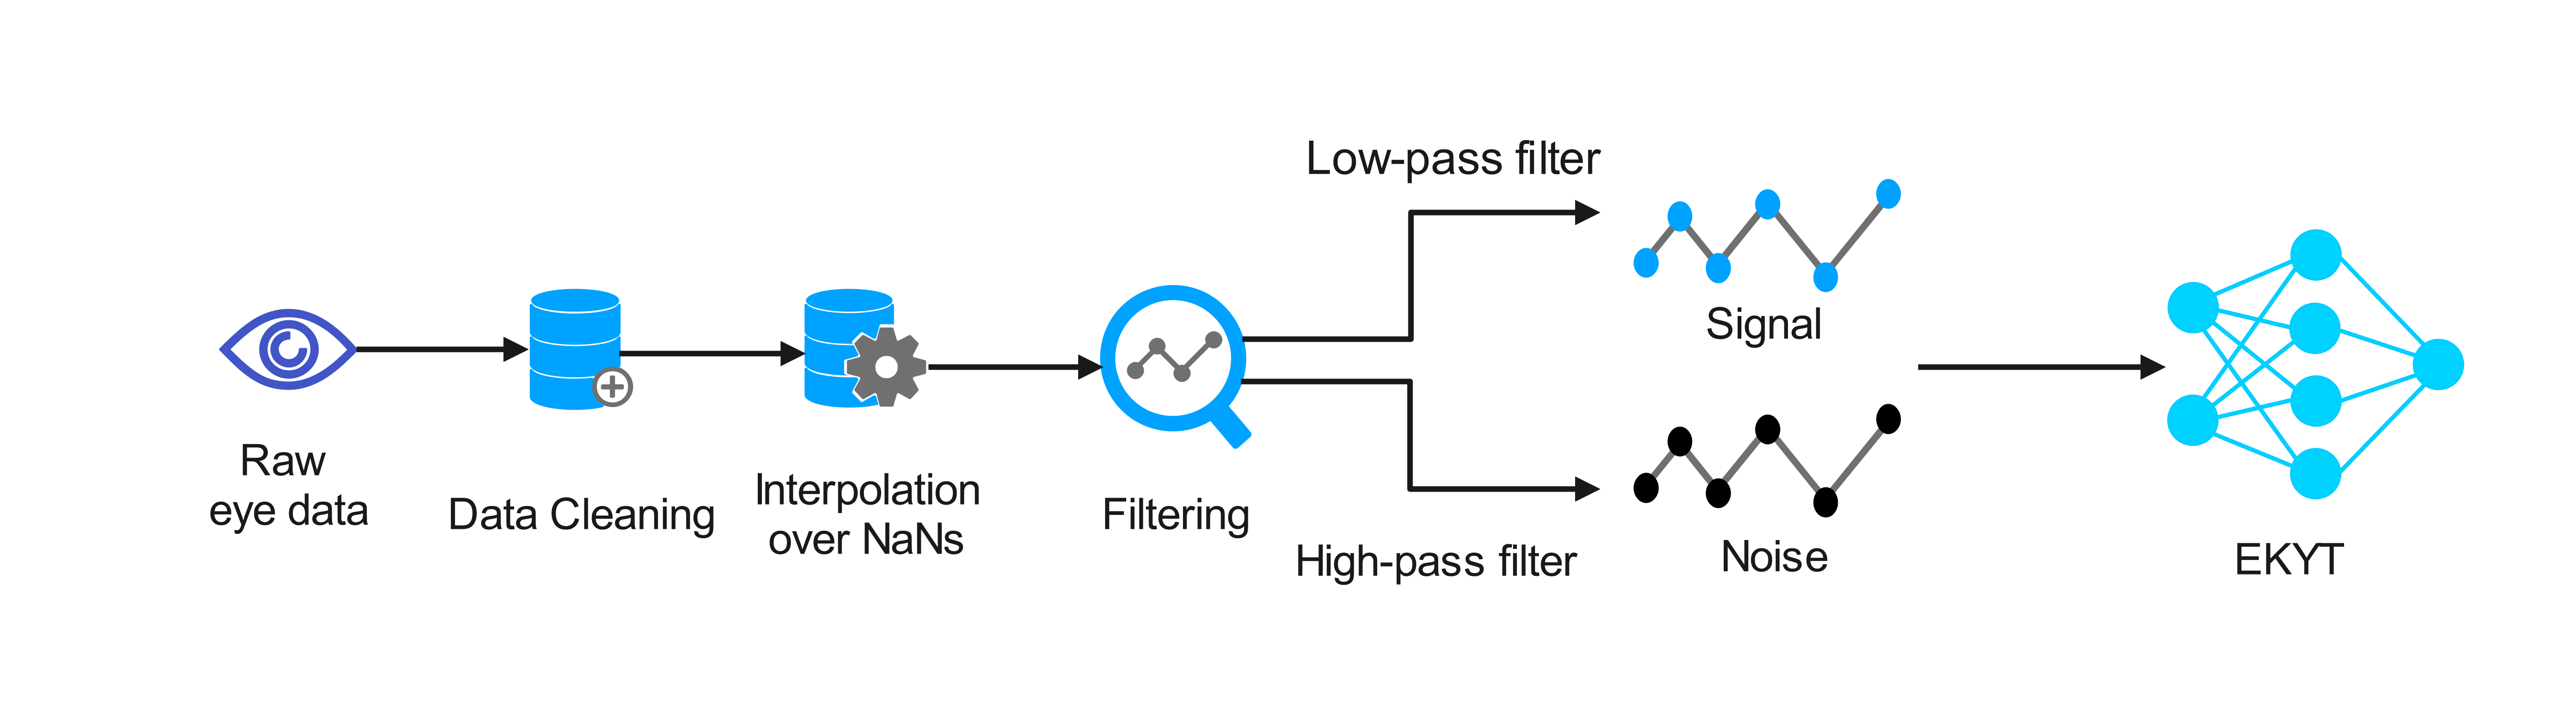
A basic block diagram of the methodology is presented in Fig.2.
We will be using Eye Know You Too (EKYT) network architecture, training, and evaluation methodology. We refer the readers to Lohr and Komogortsev (2022) for more methodological details.
3.1 Dataset
The eye-movement recordings we used in this study are from the GazeBase Griffith et al. (2021) dataset, which is publicly available. The GazeBase dataset contains very high signal-quality eye-movement recordings as it is recorded with an EyeLink 1000 eye tracker at 1000 Hz sampling rate. GazeBase dataset consists of 12,334 monocular (left eye only) eye-movement recordings captured from 322 college-aged subjects. There are 9 rounds (Round 1 - Round 9) of recordings collected over three years. Each recording contains the horizontal and vertical components of the left eye’s gaze position in degrees of the visual angle. Every subject went through a series of 7 eye movement tasks: a horizontal saccades task (HSS), a fixation task (FXS), a random saccades task (RAN), a reading task (TEX), two video viewing tasks (VD1 and VD2) and one video-gaming task (Balura game, BLG). Each round consists of two recording sessions of similar tasks per subject with approximately 20-minute intervals. We present biometric analysis from two different time frames. The first analysis is based solely on Round 1 and compares the first session of Round 1 to the second session of Round 1. The second analysis compares the first session of Round 1 to the second session of Round 6. Although many more subjects were available for Round 1, we wanted both analyses to be based on the same number of subjects and the second analysis contained 59 subjects. More details about the dataset can be found in Griffith et al. (2021).
Throughout the paper, the term “short-term" refers to the data collected in Round-1 with approximately 20-minute intervals between sessions. The term “long-term" refers to the data collected in Round-6, which was obtained with approximately a year interval from Round-1.
It is important to mention that the GazeBase dataset is already filtered to the “EXTRA” level. Although this filter does suppress high-frequency noise, the frequency response of this filter is very poor compared to a standard digital filter. High-frequency data are still present in the signal after the application of this filter.
3.2 Data Preprocessing
Prior to being fed into the network architecture, all recordings from the dataset underwent a series of pre-processing steps.
It the EyeLink 1000 cannot record an eye movement, as during a blink, the device returns a Not a Number (NaN) code for the relevant samples. The range for the possible horizontal component of the gaze positional value is from -23.3 to +23.3 whereas the vertical component is from -18.5 to 11.7 degrees of visual angle (dva). We excluded (set to NaN) any individual gaze samples where the subjects were viewing beyond the screen dimensions. Our filter method required that NaNs be removed, so missing data portions were replaced via linear interpolation. Our analysis required two types of filtering: low-pass to obtain “signal” and high-pass to contain “noise”. Both low-pass and high-pass filtering were performed with an FIR-type filter each with 79 taps. The cutoff frequency (-3db point, where the signal is reduced by 49.9%) was 100 Hz for both filter types Raju et al. (2023a).
After filtering, all the NaNs were reinserted into the signal recordings. Next, we created two velocity channels (horizontal and vertical) from the raw signal using Savitzky-Golay Savitzky and Golay (1964) with window size=7 and order=2 Friedman et al. (2017). Then using a rolling window method, we split recordings into non-overlapping windows of 5 seconds (5000 samples). It is to be noted that 12 of these 5-second sections are combined into a single 60-second data for further evaluation. Velocities are clamped between ±1000◦/s as a means of reducing the impact of noise on the data. Afterward, velocity channels were z-score transformed. Finally, replace all NaN with 0. It is part of the data handling process inspired by Lohr et al. (2022). More data preprocessing details can be found in Lohr and Komogortsev (2022)
3.3 Eye Know You Too Network architecture
We used the state-of-the-art network architecture for eye-movement-based biometric authentication named Eye Know You Too (EKYT) Lohr and Komogortsev (2022). It is a denseNet-based Huang et al. (2017) architecture that achieves state-of-the-art EMB performance in the authentication situation on high-quality data (data collected at 1000 Hz). When enrolling and authenticating while performing a reading activity, it achieves 0.58% EER with just 60 seconds of eye movements. The network architecture has 8 convolutional layers. Consequently, before being input into the following convolution layer, the feature maps created by each convolution layer are concatenated with all preceding feature maps. A 128-dimensional embedding of the input sequence is then created using the final set of concatenated feature maps after they have been flattened and sent through a global average pooling layer and fed into a fully-connected layer. For more details about the network architecture, we refer the reader to Lohr and Komogortsev (2022).
3.4 Training and testing splits
The model was trained on all data from Rounds 1-5 except for BLG task. There were 322 subjects in Round 1 and 59 in Round 6. The 59 subjects in Round 6 are a subset of all subjects in Round 1. The data from these 59 subjects from both rounds were treated as a held-out dataset and not used for training and validation.
Next, we divided the remaining participants into four non-overlapping folds for the purpose of cross-validation. The training set is divided into 4 folds, each containing distinct classes, with an aim to distribute the number of participants and recordings as evenly as possible. The employed fold assignment algorithm is discussed in Lohr et al. (2022).
3.5 Training
We trained 4 different models, each one using a different held-out fold as the validation set and the remaining 3 folds as the training set for both sets of filtered data (“signal” and “noise” parts). We employed the AdamKingma and Ba (2014) optimizer, and PyTorch’s OneCycleLR with cosine annealing Smith and Topin (2019) for learning rate scheduling in our training. We used multi-similarity loss (MS) loss Wang et al. (2019). PyTorch Metric Learning (PML) library Musgrave et al. (2020) is used to implement it. Hyperparameters for MS loss and all other optimizer hyperparameters were left at their default values following Lohr and Komogortsev (2022).
Each input sample is comprised of two channels: horizontal and vertical velocity and contains a window of 5000-time steps. The model was trained for 100 epochs. During the first 30 epochs, the learning rate is set to and gradually increases up to . Subsequently, over the next 70 epochs, the learning rate gradually decreases down to a minimum of . Each batch consists of 64 samples (classes per batch = 8 samples per class per batch = 8).
3.6 Hardware & software
All models were trained on Dell Precision 3660. The workstation was equipped with NVIDIA GeForce RTX 3080, an Intel i5-12600K CPU @ 3.7 GHz (10 cores), and 32 GB RAM. The compatible Anaconda environment was set up with Python 3.7.11, PyTorch 1.10.0 (Torchvision 0.11.0, Torchaudio 0.10.0), Cudatoolkit 11.3.1, and Pytorch Metric Learning(PML) Musgrave et al. (2020) version 0.9.99.
3.7 Evaluation & Metrics
Biometric performance was assessed at two-time intervals, short term (Round 1, session 1 vs session 2, 20 min) and long-term (Round 1 session 1 versus Round 6 session 2, 1 year). For both time intervals, each raw recording was filtered to produce a “signal” portion and a “noise” portion. The final biometric assessment was based solely on the reading task (TEX) recordings. To generate embeddings for each window in both the enrollment and authentication sets, we use the four models that were trained using a 4-fold cross-validation approach. We computed 128-dimensional embedding for each model and concatenate them to create a single 512-dimensional embedding for each window. This effectively treats the four models as a single ensemble model.
We used three metrics to measure and compare our performance of the model. These are equal error rate (EER), decidability index d’ (d-prime value), and false rejection rate (FRR) at a fixed false acceptance rate (FAR) of . The EER is the location on a receiver operating characteristic (ROC) curve where the FRR and FAR are equal. The lower the EER value, the better the performance of the biometric system is. It is an indicator of biometric performance, usually when performed for authentication/verification tasks. To calculate the EER, we need two disjoint subsets of data: one for enrollment and another for authentication (or verification). In our approach, we formed the enrollment dataset by using the first 60 seconds of the session-1 TEX task from Round-1 for each subject in the test set. For the authentication dataset, we used the first 60 seconds of the session-2 TEX task from Round-1 for each subject in the test set. For the longitudinal study we used the first 60 seconds of the session-2 TEX task from Round-6 as the authentication dataset.
It is to be noted that we did not use 60 seconds at once, we split 60 seconds into 5-second subsequences, getting embeddings for each subsequence, and then computed the centroid of those embeddings.
We computed the decidability index d’ (d-prime) Daugman (2000), which is a measure of the separation of genuine/impostor similarity distributions. It depends on the means of the distributions and their standard deviations. In general, a larger d’ (d-prime value) should be connected with a lower EER because it shows a greater separation between the genuine and imposter distributions i.e. the higher the d’ value, the better the biometric system is. Complementary to these, we also used FRR. FRR is one of the three metrics used in biometric accuracy Conrad et al. (2015). When the biometric system rejects an authorized subject as an unauthorized one, it is called false rejection. According to FIDO biometric requirements Schuckers et al. , FRR is used to measure the biometric performance and FRR should be no more than 5% @ FAR where FAR is the percentage of identification instances in which unauthorized persons are incorrectly accepted.
4 Results
Table 1 presents our results. It provides biometric performance of signal and noise portions of the eye movement time-series for short-term ( min) and long-term ( 1 year) evaluations. The performance metrics used were EER, d’, and FRR @ FAR . It is clear that the biometric performance of the “signal” part of the eye-movement time-series is superior to the performance of the “noise” part of the eye-movement time-series for both time intervals. However, it should be noted that the noise portions performed much better than chance (for EER, chance is 50%).
| Metrics | Short term | Long term | ||
|---|---|---|---|---|
| Signal | Noise | Signal | Noise | |
| EER (%) | 0.32 | 11.86 | 3.39 | 28.81 |
| d-prime | 4.71 | 2.52 | 3.68 | 1.32 |
| FRR @ FAR (STD) (%) | 5.08 (0.15) | 53.53 (2.64) | 30.01 (1.8) | 91.52 (0.20) |
5 Discussion
The main finding of the present report is that the “signal” portion of the eye-movement time-series dramatically outperforms the “noise” portion but that the noise portion performs substantially better than chance. This finding is consistent across all three performance metrics used in the study (EER, d’ and FRR @ FAR ). The lower EER for the signal part indicates that it is more reliable for biometric authentication. Similarly, the higher d’ for the signal part indicates that it has a better distinctive ability between genuine and impostor subjects. Finally, the lower FRR for the signal part indicates that it has better accuracy in verifying genuine subjects. The signal portion contains eye-movement information. As mentioned above, eye movements during reading include fixation, saccades, and post-saccadic oscillations. The biometric algorithm was apparently able to extract substantial individual-specific information from this portion.
It is unclear at this time what qualities of the “noise” portion are most important for biometric performance. Holmqvist et al Holmqvist (2017) have reported on a large number of factors that affect either the spatial accuracy or spatial precision of eye-movement recordings. For example, according to these authors, subjects with larger pupil sizes have lower signal quality. Subjects who wear glasses have lower eye-tracking quality. Subjects with blue eyes have lower signal quality. Young-aged subjects have better spatial precision in the eye-movement recordings. Subjects with make-up (eyeliner, eye shadow, mascara) have lower spatial accuracy. Numerous other factors are mentioned in that article.
In future studies, it might be of interest to see if our filtering steps might improve recording quality in the presence of these and similar factors. These factors might contribute to individual differences in the “noise” portion. What is really needed is a taxonomy of noise. We know the different types of eye movements in the signal portion, but the types of noise have not been classified. This could be a future research project.
We also studied the longitudinal effect by comparing the performance of the model on short-term and long-term data. It is not surprising that when biometric performance is assessed over a very short time interval ( 20 min), performance is going to be much better than over a much longer time interval( 1 year).
Our conclusion is that eye-movement signal contained in frequencies from 0 to 100 Hz has implications for the proper sampling rate for future studies. Most researchers use the Nyquist theorem and conclude that for the analysis of F Hz signals, the sampling rate needs to be 2F Hz Shannon (1949). But this is true only for the frequency domain. Eye-movement time series are observed in the time domain. There is a common rule of thumb that, to observe a frequency of F Hz in time domain, the sampling rate needs to be 10F Hz. Please follow the links in the footnote for a defense of this position1111. https://community.sw.siemens.com/s/article/digital-signal-processing-sampling-rates-bandwidth-spectral-lines-and-more, 2. https://en.wikibooks.org/wiki/Analog_and_Digital_Conversion/Nyquist_Sampling_Rate and 3. https://www.dataq.com/data-acquisition/general-education-tutorials/what-you-really-need-to-know-about-sample-rate.html. Since we consider sine-waves of 100 Hz as part of the “signal”, the minimum sampling rate required for full eye-movement preservation is 1000 Hz. Our results have implications for future studies of eye-movement biometrics. Obviously, the signal portion provides better performance. In our case, with data collected at 1000 Hz, the signal portion of the data can be isolated using a low-pass filterRaju et al. (2023a). It is unlikely to be useful to make the “signal”/“noise” distinction for eye-tracking time series collected at very much lower sampling rates.
6 Conclusion
We conducted a study where we compared the biometric performance of the “signal" and “noise" components of high-quality eye movement signals originally recorded at 1000 Hz. Our research was validated using recordings from the publicly available GazeBase dataset Griffith et al. (2021). To obtain biometric results, we used the state-of-the-art EKYT architecture Lohr and Komogortsev (2022). Our findings indicated that the “signal” portion of the data performed well in both short-term and long-term data authentication, with relatively low EER, FRR @ FAR and high d’. On the other hand, the “noise” part performs substantially better than chance when authenticating on short-term data but its performance was not as effective as the “signal” part.
We want to conclude by saying that the “noise” part carries individual-specific information that distinguishes between individuals. Thus, both the “signal” and “noise” parts of the recordings may have important biometric implications. A taxonomy of noise would be an important contribution to the eye-tracking field. It would describe different parts of the noise, and how these parts form patterns that can be classified. This will be a significant undertaking.
Acknowledgments
This material is supported by the National Science Foundation under Grant No. CNS-1714623 bestowed on Dr. Oleg V Komogortsev and by the National Science Foundation Graduate Research Fellowship under Grant No. DGE-1144466 bestowed on Mr. Dillon J Lohr. Any opinions, findings, and conclusions or recommendations expressed in this material are those of the author(s) and do not necessarily reflect the views of the National Science Foundation.
Conflict of interest
The authors declare no conflict of interest.
References
- Jain et al. [2007] Anil K Jain, Patrick Flynn, and Arun A Ross. Handbook of biometrics. Springer Science & Business Media, 2007.
- Council et al. [2010] National Research Council, Whither Biometrics Committee, et al. Biometric recognition: Challenges and opportunities. 2010.
- Lohr et al. [2020a] Dillon Lohr, Henry Griffith, Samantha Aziz, and Oleg Komogortsev. A metric learning approach to eye movement biometrics. In 2020 IEEE International Joint Conference on Biometrics (IJCB), pages 1–7. IEEE, 2020a.
- Lohr and Komogortsev [2022] Dillon Lohr and Oleg V Komogortsev. Eye know you too: Toward viable end-to-end eye movement biometrics for user authentication. IEEE Transactions on Information Forensics and Security, 17:3151–3164, 2022.
- Lohr et al. [2020b] Dillon J Lohr, Samantha Aziz, and Oleg Komogortsev. Eye movement biometrics using a new dataset collected in virtual reality. In ACM Symposium on Eye Tracking Research and Applications, ETRA ’20 Adjunct, New York, NY, USA, 2020b. Association for Computing Machinery. ISBN 9781450371353. doi:10.1145/3379157.3391420. URL https://doi.org/10.1145/3379157.3391420.
- Lohr et al. [2022] Dillon Lohr, Henry Griffith, and Oleg V Komogortsev. Eye know you: Metric learning for end-to-end biometric authentication using eye movements from a longitudinal dataset. IEEE Transactions on Biometrics, Behavior, and Identity Science, 2022.
- Jäger et al. [2020] Lena A Jäger, Silvia Makowski, Paul Prasse, Sascha Liehr, Maximilian Seidler, and Tobias Scheffer. Deep eyedentification: Biometric identification using micro-movements of the eye. In Machine Learning and Knowledge Discovery in Databases: European Conference, ECML PKDD 2019, Würzburg, Germany, September 16–20, 2019, Proceedings, Part II, pages 299–314. Springer, 2020.
- Makowski et al. [2021] Silvia Makowski, Paul Prasse, David R Reich, Daniel Krakowczyk, Lena A Jäger, and Tobias Scheffer. Deepeyedentificationlive: Oculomotoric biometric identification and presentation-attack detection using deep neural networks. IEEE Transactions on Biometrics, Behavior, and Identity Science, 3(4):506–518, 2021.
- Rigas and Komogortsev [2015] Ioannis Rigas and Oleg V. Komogortsev. Eye Movement-Driven Defense against Iris Print-Attacks. Pattern Recogn. Lett., 68(P2):316–326, dec 2015. ISSN 0167-8655.
- Raju et al. [2022] Mehedi Hasan Raju, Dillon J Lohr, and Oleg Komogortsev. Iris print attack detection using eye movement signals. In 2022 Symposium on Eye Tracking Research and Applications, ETRA ’22, New York, NY, USA, 2022. Association for Computing Machinery. ISBN 9781450392525. doi:10.1145/3517031.3532521. URL https://doi.org/10.1145/3517031.3532521.
- Komogortsev et al. [2015] O. V. Komogortsev, A. Karpov, and C. D. Holland. Attack of mechanical replicas: Liveness detection with eye movements. IEEE Transactions on Information Forensics and Security, 10(4):716–725, 2015. doi:10.1109/TIFS.2015.2405345.
- Raju et al. [2023a] Mehedi H Raju, Lee Friedman, Troy M Bouman, and Oleg V Komogortsev. Filtering eye-tracking data from an eyelink 1000: Comparing heuristic, savitzky-golay, iir and fir digital filters. arXiv preprint arXiv:2303.02134, 2023a.
- Kasprowski and Ober [2004] Pawel Kasprowski and Jozef Ober. Eye movements in biometrics. In ECCV workshop BioAW, pages 248–258. Springer, 2004.
- [14] Ioannis Rigas and Oleg V. Komogortsev. Current research in eye movement biometrics: An analysis based on BioEye 2015 competition. 58:129–141.
- And [2017] One algorithm to rule them all? An evaluation and discussion of ten eye movement event-detection algorithms. Behavior Research Methods, 49(2):616–637, 2017. ISSN 1554-3528. doi:10.3758/s13428-016-0738-9. URL https://doi.org/10.3758/s13428-016-0738-9.
- Nyström and Holmqvist [2010] Marcus Nyström and Kenneth Holmqvist. An adaptive algorithm for fixation, saccade, and glissade detection in eyetracking data. Behavior research methods, 42(1):188–204, 2010.
- Pekkanen and Lappi [2017] Jami Pekkanen and Otto Lappi. A new and general approach to signal denoising and eye movement classification based on segmented linear regression. Scientific reports, 7(1):17726, 2017.
- Dar et al. [2021] Asim H Dar, Adina S Wagner, and Michael Hanke. Remodnav: robust eye-movement classification for dynamic stimulation. Behavior research methods, 53(1):399–414, 2021.
- Friedman et al. [2018] Lee Friedman, Ioannis Rigas, Evgeny Abdulin, and Oleg V. Komogortsev. A novel evaluation of two related and two independent algorithms for eye movement classification during reading. Behavior Research Methods, 50(4):1374–1397, 08 2018. doi:10.3758/s13428-018-1050-7. URL https://doi.org/10.3758/s13428-018-1050-7.
- Friedman et al. [2017] Lee Friedman, Mark S Nixon, and Oleg V Komogortsev. Method to assess the temporal persistence of potential biometric features: Application to oculomotor, gait, face and brain structure databases. PloS one, 12(6):e0178501, 2017.
- Li et al. [2018] Chunyong Li, Jiguo Xue, Cheng Quan, Jingwei Yue, and Chenggang Zhang. Biometric recognition via texture features of eye movement trajectories in a visual searching task. PLoS ONE, 13(4):e0194475, apr 2018. ISSN 19326203. doi:10.1371/journal.pone.0194475. URL https://dx.plos.org/10.1371/journal.pone.0194475.
- Jia et al. [2018] Shaohua Jia, Do Hyong Koh, Amanda Seccia, Pasha Antonenko, Richard Lamb, Andreas Keil, Matthew Schneps, and Marc Pomplun. Biometric recognition through eye movements using a recurrent neural network. In Proceedings - 9th IEEE International Conference on Big Knowledge, ICBK 2018, pages 57–64. Institute of Electrical and Electronics Engineers Inc., dec 2018. ISBN 9781538691243. doi:10.1109/ICBK.2018.00016.
- Abdelwahab and Landwehr [2019] Ahmed Abdelwahab and Niels Landwehr. Deep Distributional Sequence Embeddings Based on a Wasserstein Loss. arXiv:1912.01933 [cs, stat], December 2019. URL http://arxiv.org/abs/1912.01933. arXiv: 1912.01933.
- Makowski et al. [2020] Silvia Makowski, Lena A Jäger, Paul Prasse, and Tobias Scheffer. Biometric identification and presentation-attack detection using micro-and macro-movements of the eyes. In 2020 IEEE International Joint Conference on Biometrics (IJCB), pages 1–10. IEEE, 2020.
- Stampe [1993] Dave M Stampe. Heuristic filtering and reliable calibration methods for video-based pupil-tracking systems. Behavior Research Methods, Instruments, & Computers, 25(2):137–142, 1993.
- Mack et al. [2017] David J Mack, Sandro Belfanti, and Urs Schwarz. The effect of sampling rate and lowpass filters on saccades–a modeling approach. Behavior Research Methods, 49(6):2146–2162, 2017.
- Raju et al. [2023b] Mehedi H Raju, Lee Friedman, Troy M Bouman, and Oleg V Komogortsev. Determining which sine wave frequencies correspond to signal and which correspond to noise in eye-tracking time-series. arXiv preprint arXiv:2302.00029, 2023b.
- Griffith et al. [2021] Henry Griffith, Dillon Lohr, Evgeny Abdulin, and Oleg Komogortsev. Gazebase, a large-scale, multi-stimulus, longitudinal eye movement dataset. Scientific Data, 8(1):184, 2021.
- Savitzky and Golay [1964] Abraham Savitzky and Marcel JE Golay. Smoothing and differentiation of data by simplified least squares procedures. Analytical chemistry, 36(8):1627–1639, 1964.
- Huang et al. [2017] Gao Huang, Zhuang Liu, Laurens Van Der Maaten, and Kilian Q Weinberger. Densely connected convolutional networks. In Proceedings of the IEEE conference on computer vision and pattern recognition, pages 4700–4708, 2017.
- Kingma and Ba [2014] Diederik P Kingma and Jimmy Ba. Adam: A method for stochastic optimization. arXiv preprint arXiv:1412.6980, 2014.
- Smith and Topin [2019] Leslie N Smith and Nicholay Topin. Super-convergence: Very fast training of neural networks using large learning rates. In Artificial intelligence and machine learning for multi-domain operations applications, volume 11006, pages 369–386. SPIE, 2019.
- Wang et al. [2019] X. Wang, X. Han, W. Huang, D. Dong, and M. R. Scott. Multi-similarity loss with general pair weighting for deep metric learning. In 2019 IEEE/CVF Conference on Computer Vision and Pattern Recognition (CVPR), pages 5017–5025, 2019. doi:10.1109/CVPR.2019.00516.
- Musgrave et al. [2020] Kevin Musgrave, Serge Belongie, and Ser-Nam Lim. Pytorch metric learning, 2020.
- Daugman [2000] John Daugman. Biometric decision landscapes. Technical report, University of Cambridge, Computer Laboratory, 2000.
- Conrad et al. [2015] Eric Conrad, Seth Misenar, and Joshua Feldman. CISSP study guide. Syngress, 2015.
- [37] Stephanie Schuckers, Greg Cannon, and Nils Tekampe. FIDO biometrics requirements. https://fidoalliance.org/specs/biometric/requirements/. Accessed: 2023-05-03.
- Holmqvist [2017] Kenneth Holmqvist. Common predictors of accuracy, precision and data loss in 12 eye-trackers. In The 7th Scandinavian Workshop on Eye Tracking, pages 1–25, 2017.
- Shannon [1949] C.E. Shannon. Communication in the presence of noise. Proceedings of the IRE, 37(1):10–21, jan 1949. doi:10.1109/jrproc.1949.232969. URL https://doi.org/10.1109/jrproc.1949.232969.