Revisiting the Performance of Serverless Computing: An Analysis of Variance
Abstract.
Serverless computing is an emerging cloud computing paradigm, which allows software engineers to develop applications at the granularity of function (called serverless functions). However, multiple identical runs of the same serverless functions can show different performance (i.e., response latencies) due to the highly dynamic underlying environment where these functions are executed. We conduct the first work to study serverless function performance to raise awareness of this variance among researchers. We investigate 59 related research papers published in top-tier conferences, and observe that only 40.68% of them use multiple runs to quantify the variance of serverless function performance. Then we extract 65 serverless functions used in these papers and find that the performance of these serverless functions can differ by up to 338.76% (44.15% on average), indicating a large magnitude of the variance. Furthermore, we find that 61.54% of these functions can have unreliable performance results at the low number of repetitions that are widely adopted in the serverless computing literature.
1. Introduction
Serverless computing is an emerging cloud computing paradigm that frees software engineers from tedious and error-prone infrastructure management. It is predicted that serverless computing can be used in 50% of the global enterprises by 2025 (pre, 2022). Moreover, its market size will increase from 3 billion in 2017 to nearly 22 billion by 2025 (mar, 2019). To date, serverless computing has been adopted in a wide range of software applications (Fouladi et al., 2017; Jiang et al., 2021; Shankar et al., 2020; Müller et al., 2020). It allows software engineers to focus on the application logic and implement it as a series of event-driven and stateless functions (called serverless functions). To support the execution of serverless functions, major cloud providers have rolled out serverless platforms, such as AWS Lambda (aws, 2022b) and Google Cloud Functions (goo, 2022).
The emergence of serverless computing poses new challenges to the development and deployment of software applications, and thus attracts increasing attention from various research communities, such as Software Engineering (Wen et al., 2023; Liu et al., 2023), Operating Systems (Mahgoub et al., 2022; Wang et al., 2021), Services Computing (Li et al., 2022a), and Computer Networks (Fouladi et al., 2017). For example, the SE research community has studied a broad range of topics about serverless computing, including its development characteristics (Eismann et al., 2021b), programming frameworks (Bermbach et al., 2022), application migration (Ristov et al., 2020), economic impact (Adzic and Chatley, 2017), testing/debugging (Lenarduzzi and Panichella, 2020), and performance optimization (Liu et al., 2023). Among these topics, performance is demonstrated to be the most widely studied (Wen et al., 2023; Li et al., 2022a; Scheuner and Leitner, 2020).
However, it is challenging to obtain accurate and reliable performance results of serverless computing. Specifically, multiple identical runs of the same serverless functions can show different performance results (i.e., response latencies) due to the following reasons: (1) The underlying infrastructure of serverless platforms is highly dynamic. Serverless functions need to be executed on serverless platforms. As a kind of cloud environment, serverless platforms are susceptible to multi-tenancy, resource management, and networking (Papadopoulos et al., 2019; Mahgoub et al., 2022). In addition, they are black-box to the software developers and offer obscure instance scheduling strategies and unpredictable invocation patterns. These characteristics make the execution environment of serverless functions highly variable and dynamic (Patterson et al., 2022; Fuerst and Sharma, 2022; Perron et al., 2020). (2) Serverless functions are deployed at high density due to the lightweight feature. Serverless functions generally require a small memory size (Shahrad et al., 2020; Singhvi et al., 2021). They are thus deployed and hosted in small function instances, causing a high-density deployment environment to increase the risk of disruption (Zhao et al., 2021; Patterson et al., 2022). (3) Serverless functions are often executed concurrently. Concurrency increases the probability of resource contention and cold starts of serverless functions, introducing additional uncertainty (Shahrad et al., 2019; Mahgoub et al., 2022; Wang et al., 2018). The three factors result in the potential variance of serverless function performance. Nevertheless, to the best of our knowledge, this variance has not been systematically studied in the literature.
To fill this knowledge gap, we conduct the first empirical study to investigate the awareness of the variance of serverless function performance among researchers and characterize the magnitude of this variance. To this end, we first collect and analyze 59 related research papers from top-tier conferences (RQ1). We find that only 40.68% of the papers use multiple runs to quantify the variance of serverless function performance. Moreover, none of the papers justify the reason for the number of repetitions that they choose.
Motivated by this observation, we select 65 serverless functions used in these papers and analyze their response latencies in multiple runs to reveal the magnitude of the performance variance (RQ2). We find that serverless function performance can differ by up to 338.76% (44.15% on average) across different runs. Furthermore, we use the coefficient of variance (Maricq et al., 2018; Guizzo et al., 2020; Zhao et al., 2021; Uta et al., 2020), which is a widely-adopted metric to measure the degree of variability, to evaluate the performance results of multiple runs for each serverless function that we study. The results show that the coefficient of variance can be up to 42.81%, indicating a large extent of the variance (Maricq et al., 2018; Zhao et al., 2021; Uta et al., 2020).
Given such a significant variance, we further explore the distribution characteristics of serverless function performance (RQ3). We find that the performance of more than 90% of the serverless functions follows a non-normal distribution. The results suggest the use of non-parametric statistical analysis, which does not assume data normality, to analyze the performance results of serverless functions in future research.
Finally, we evaluate the reliability of the serverless function performance obtained at the different numbers of repetitions commonly used in the serverless computing literature (RQ4). We find that 61.54% of the serverless functions that we study show unreliable performance in this case. Moreover, 98.46% of the functions require being executed at least 50 times to achieve reliable performance, but only 37.50% of the collected papers that report experiment repetitions execute serverless functions more than 50 times.
Based on our findings, we have identified several valuable implications and actionable suggestions for software practices and future research on serverless computing. Additionally, we have included suggestions for future work in this area. To enable others to replicate and extend our study, we have publicly released the data and scripts used in our research (our, 2023). In addition, we have curated and made publicly available a benchmark dataset for future performance testing and optimization of serverless computing.
2. Background
This section introduces the background knowledge of serverless computing and the performance of serverless functions.
2.1. Serverless computing
Serverless computing is a popular cloud computing paradigm, which allows software developers to focus on their application logic without having to manage complex and error-prone underlying tasks. Function-as-a-Service (FaaS) is its most prominent implementation (Akkus et al., 2018; Taibi et al., 2020; Wen et al., 2021a; Copik et al., 2021; Jonas et al., 2019). In the FaaS fashion, software engineers develop applications as a series of event-driven and stateless dedicated functions, called serverless functions. Then they deploy and execute serverless functions on serverless platforms, such as AWS Lambda (aws, 2022b) and Google Cloud Functions (goo, 2022).
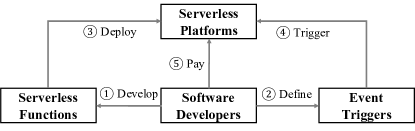
Fig. 1 illustrates the process of developing, deploying, and executing serverless functions. ① First, software developers implement serverless functions using programming interfaces as event-driven functions (Wen et al., 2023). These functions are generally written in high-level programming languages, e.g., Python and JavaScript (ser, 2022a, b; Eskandani and Salvaneschi, 2021). ② Meanwhile, developers define the rules to bind their serverless functions and the related events, such as HTTP requests and data changes of cloud storage. ③ Then, serverless functions and required dependent libraries are packaged together and deployed to serverless platforms. In this stage, developers can specify the required configurations, including language runtime, memory size, and function timeout (Wen et al., 2023). ④ When the serverless functions are triggered by pre-defined events, the serverless platforms automatically launch or reuse the required function instances (e.g., VMs or containers) with restricted resources (e.g., CPU and memory) to process these requests. This frees developers from complex server management and makes them enjoy seamless resource elasticity. ⑤ After the requests are completed, developers pay for the number of requests and the actually allocated or consumed resources (Lin and Khazaei, 2020; Wen et al., 2023).
2.2. Performance of serverless functions
The serverless computing literature has widely studied the prediction and optimization of serverless function performance (Wen et al., 2023; Li et al., 2022a; Scheuner and Leitner, 2020; Eismann et al., 2021a; Lin and Khazaei, 2020; Akkus et al., 2018; Wang et al., 2021; Jia and Witchel, 2021). More details are described in Section 9. In our study, the serverless function performance that we focus on is the end-to-end response latency (abbreviated as e2eTime), defined as the time period from request sending to request completion (Scheuner and Leitner, 2020; Lin and Khazaei, 2020; Liu et al., 2023; Wen et al., 2021b). It is the most widely-adopted metric for serverless function performance, and the serverless computing community primarily proposes new techniques to optimize this metric (Wang et al., 2021; Mahgoub et al., 2022; Zhao et al., 2021; Fuerst and Sharma, 2022). In addition, it is a common metric used by practitioners as the reflection of user experience satisfaction (Eismann et al., 2021b; Wen et al., 2021b, a).
Serverless function performance includes cold-start performance and warm-start performance. Specifically, when the serverless platform launches new function instances to serve requests, the serverless function experience cold-start invocations, which produce the end-to-end response latency containing the instance preparation process. This latency represents the cold-start performance. Subsequent invocations of the same function can reuse the launched function instances within a short keep-alive time (e.g., 7 minutes for AWS Lambda (aws, 2021)). This way makes the serverless function experience warm-start invocations. If there are no requests, the platform turns the launched instances into an idle state and automatically releases resources. Generally, due to no instance preparation process in warm starts, the warm-start performance is smaller than the cold-start performance for the same serverless function.
3. Methodology
Fig. 2 shows an overview of our methodology. To understand the variance of serverless function performance, we first identify relevant research papers and collect serverless functions from them. Based on them, we answer four research questions (RQs) related to the variance of serverless function performance.
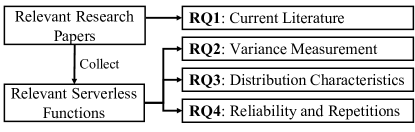
RQ1: To what extent the current literature has tackled the variance of serverless function performance? This RQ investigates whether and how researchers take the variance of serverless function performance into account when studying serverless computing.
RQ2: How variable is the performance of serverless functions? This RQ aims to unveil the magnitude of the variance of serverless function performance.
RQ3: What are the distribution characteristics of serverless function performance? We further analyze the distribution characteristics of the performance results. The characteristics can help researchers and engineers to select suitable statistical techniques to report a reliable overall result based on the variable serverless function performance of multiple runs.
RQ4: How reliable is the serverless function performance at different repetitions? This RQ aims to explore the reliability of serverless function performance obtained at different repetitions. Moreover, we aim to provide implications on how to determine the appropriate number of repetitions, so as to obtain a more reliable performance.
To address RQ1, we collect research papers related to serverless computing. Because studies on serverless computing have been published in academic venues across various research communities (Wen et al., 2023; Liu et al., 2023; Mahgoub et al., 2022; Wang et al., 2021; Li et al., 2022a; Fouladi et al., 2017), we gather papers published in top-tier conferences from different communities recommended by Computer Science Rankings (CSRankings) (csr, 2022). We focus on top-tier conference papers because we believe that they are representative of the current state of research in our field and offer a broad view of the most recent findings. However, we acknowledge that including papers from other venues (i.e., journals or other conferences) in our study would provide a more comprehensive view of the research landscape. In future work, we plan to expand our study to include more papers to further enhance the scope of our research.
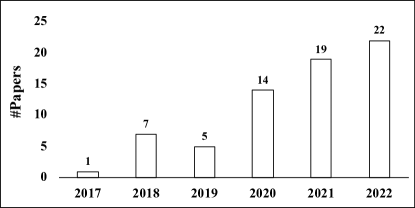
The process for collecting research papers is as follows. First, we collect all the papers published in these conferences between 2014 (the year serverless computing was popularized (Wen et al., 2021a, 2023; Jonas et al., 2019)) and the date we collect the papers (October 12, 2022). Then, the first two authors select the research papers related to serverless computing by independently reading the title and abstract of these papers. If the authors disagree on the relevance of a paper, an arbitrator, who has ten years of cloud computing experience, is involved in discussing and helping reach an agreement. To measure the inter-rater agreement level of the first two authors during the independent labeling, we use Cohen’s Kappa () (Cohen, 1960), which is the most widely-used agreement evaluation metric (Uta et al., 2020; Wen et al., 2021a, 2023). The value of is 0.946, indicating an almost perfect agreement (Landis and Koch, 1977) and a reliable labeling procedure. Finally, we obtain a total of 68 research papers related to serverless computing. The number of papers per year is shown in Fig. 3. We observe an overall increasing trend. The number of relevant papers increased from 1 paper in 2017 to 22 papers in 2022. This implies that serverless computing is gaining increasing attention from the research community, demonstrating the timeliness and urgency of our study.
Furthermore, the first two authors jointly filter research papers that do not report the performance results of serverless functions. Finally, 59 out of the 68 research papers (86.76%) are retained for our final analysis. This is consistent with the findings reported by previous work (Wen et al., 2023; Li et al., 2022a; Scheuner and Leitner, 2020) that most serverless computing papers are related to serverless function performance.
3.1. Collection and analysis of serverless functions
To answer RQ2 to RQ4, we collect serverless functions used in the 59 research papers. We focus on serverless functions executed on AWS Lambda and Google Cloud Functions, which are the most widely-adopted public serverless platforms (ser, 2022b; Eismann et al., 2021b; Hassan et al., 2021). Moreover, we select serverless functions that are open-sourced and have documentation to assist with the execution. In addition, we focus on serverless functions written in Python and JavaScript, which are the two most widely-used programming languages for serverless functions (ser, 2022a, b; Eismann et al., 2021b; Eskandani and Salvaneschi, 2021; Scheuner and Leitner, 2020). According to these criteria, we collect 65 serverless functions covering a wide range of tasks, such as Web requests, video processing, scientific computing, machine learning, and natural language processing. Moreover, most serverless functions are included in different common benchmarks from the serverless computing community, such as FunctionBench (Kim and Lee, 2019), ServerlessBench (Yu et al., 2020), AWS Sample (AWS, 2022a), SeBS (Copik et al., 2021), and FaaSDom (Maissen et al., 2020). Table 1 shows the distributions of the executed serverless platforms and programming languages for the collected 65 serverless functions. 60 serverless functions are executed on AWS Lambda, while 5 functions are executed on Google Cloud Functions. It can be because the advent of AWS Lambda was the main reason for the popularity of serverless computing (Wen et al., 2023; Jonas et al., 2019; Wen et al., 2021a). Moreover, 53 serverless functions are written in Python, while 12 functions are written in JavaScript. Such a distribution can be attributed to the increasing number of tasks that use popular Python third-party libraries, e.g., Pandas and Scikit Learn.
|
AWS Lambda | Google Cloud Functions | |
|---|---|---|---|
| #Functions | 60 | 5 | |
| Languages | Python | JavaScript | |
| #Functions | 53 | 12 |
We then analyze the performance of the 65 serverless functions. We execute these functions with the configurations and the serverless platform used in their original papers. If no specific configurations are given, serverless functions are executed using the default configurations of platforms. At the time of our study, the default memory size of AWS Lambda is 128 MB (AWS, 2022b), and its function timeout time is 3 seconds (AWS, 2022c). For Google Cloud Functions, the default memory size and function timeout time are 256 MB (Goo, 2022a) and 60 seconds (Goo, 2022b), respectively. Once insufficient memory size or function timeout is detected during function executions, we keep executing the serverless functions by increasing the memory size or function timeout time until they can be executed successfully. We execute each serverless function for rounds. In each round, we execute the function twice using the same input and configurations to obtain the cold-start and warm-start performance, respectively. We set each round to half an hour, because we find that this duration allows the serverless function to be executed twice, and the resources used for execution will be released to ensure that the start of the next round is still a cold start. In addition, in each round, the second execution starts five seconds after the completion of the first execution, because we find that this duration can ensure the successful warm start of the serverless function. Finally, we obtain 65 ( + ) = 130 data points (65 for cold start and 65 for warm start) about the response latency of serverless functions.
We denote the 65 serverless functions as Func1, Func2, …, and Func65. The number mapping information about 65 serverless functions has been provided in our repository (our, 2023). We also provide raw performance data generated by each serverless function.
4. RQ1: Current Literature
In RQ1, we investigate how the variance of serverless function performance has been tackled in the serverless computing literature. To this end, we perform a literature review based on the selected 59 research papers. According to previous work about performance reproducibility (Uta et al., 2020), there are already standard reporting criteria being used for summarizing the paper’s experimental design. We apply these criteria to analyze our selected papers. Specifically, we unveil the following information:
-
•
1: The mean or median performance values;
-
•
2: Confidence (e.g., confidence intervals) or variability (e.g., standard deviation, coefficient of variance, or percentiles);
-
•
3: The number that an experiment was repeated.
Such information can assist us in further understanding the reliability of the provided evidence and the study’s conclusions. First, the first two authors separately read the full text of the paper to find out if the paper contains the aforementioned information. Note that a research paper may involve multiple pieces of information. In addition, if a paper uses the experiment repetition (i.e., information 3), the first two authors further provide the specific number of repetitions. Second, we calculate the inter-rater agreement during the independent labeling for each type of information. Values of Cohen’s Kappa () (Cohen, 1960) are 0.914, 0.897, and 0.865, respectively, meaning a perfect agreement and reliable labeling process (Landis and Koch, 1977). Finally, encountered conflicts are discussed to reach an agreement by the first two authors and the third arbitrator.
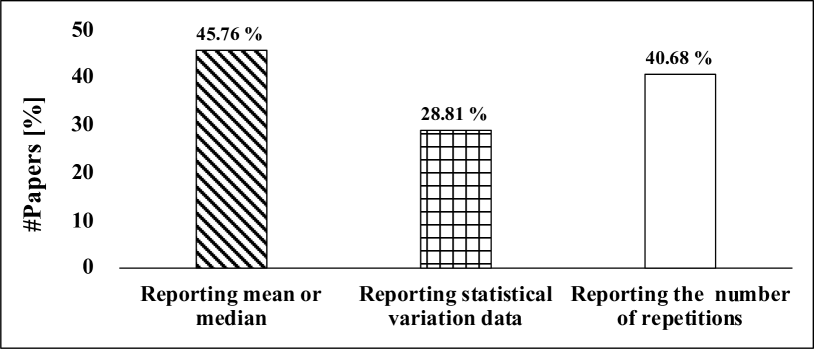
Results: We observe that researchers lack awareness of the variance of serverless function performance. Only 40.68% of the papers use multiple runs when conducting experiments or analyses. Specifically, Fig. 5 shows the results of our literature review. 45.76% (27 out of 59) of the papers report means or medians. Only 28.81% (17 out of 59) of the papers report statistical variation data (e.g., percentiles). In addition, 40.68% (24 out of 59) of the papers report the number of repetitions they used. In other words, nearly 60% of the papers do not report how many times they repeated the experiments, indicating that either no repetition is performed at all, or a specific number of repetitions is used but this information is omitted in the paper. These results indicate that research papers related to serverless computing lack an adequate description of results and awareness of the variance of serverless function performance.
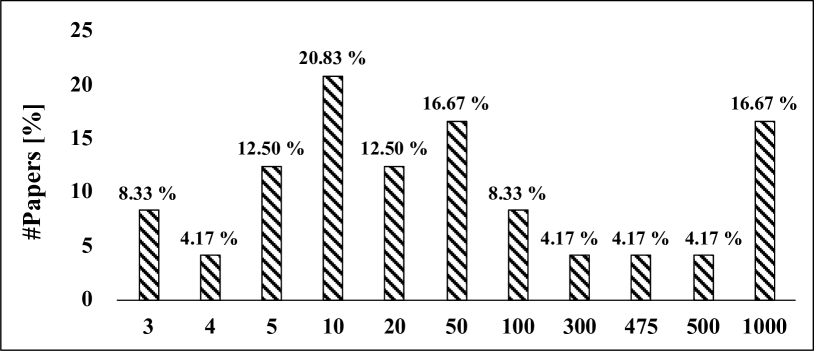
We further analyze these papers that do report experiment repetitions. For these papers, we find that only 16.67% (accounting for 6.78% of all surveyed papers) mention that the use of repeated experiments is to alleviate the randomness of results or the effect of measurement errors. Fig. 5 shows the number of repetitions used in these papers. Note that a paper may use multiple numbers of repetitions. The results show that there are 11 kinds of numbers of repetitions. However, none of these papers justify or explain the reason for the number of repetitions chosen. In addition, we observe that 75% of these papers use no more than 50 repetitions, while 37.50% of them use more than 50 repetitions. The top 3 frequently used repetitions are 10, 50, and 1,000, which account for 20.83%, 16.67%, and 16.67% of these papers, respectively. However, if the number of repetitions is too low (e.g., 10 repetitions), the reliability of the obtained performance of serverless functions may not be guaranteed (as explained in Section 7), and it could lead to wrong or ambiguous conclusions. If the number of repetitions is too large (e.g., 1,000 repetitions), it will cause a huge runtime overhead, e.g., long experimentation time and high costs. Researchers pay for the number of requests and the actually allocated/consumed resources of serverless functions (Lin and Khazaei, 2020; Wen et al., 2023). Thus, a too-small or too-large number of repetitions may be inappropriate in serverless-related experiments. These results imply that the awareness of the variance of serverless function performance is still in the infancy stage.
5. RQ2: Variance Measurement
To explore the magnitude of the variance of serverless function performance, we analyze the response latency of 65 serverless functions over 50 runs from two aspects: coefficient of variance (CV) and boxplot, which are commonly used in performance analysis or variance analysis (Maricq et al., 2018; Guizzo et al., 2020; Zhao et al., 2021; Uta et al., 2020; Pham et al., 2020). Specifically, CV is known as the dispersion coefficient, and it is a statistical indicator that measures the degree of data variability. CV represents the ratio of the standard deviation to the mean. A big value of CV means a large degree of performance variance. The boxplot can provide a visual representation of the dispersion degree for the performance results generated by each serverless function. Our study does not use the standard deviation because compared measurements have different scales and units. We use the performance results of each serverless function with 50 repetitions to explore the magnitude of the variance. This is due to the fact that 75% of the papers reporting on the number of repeated runs executed no more than 50 repetitions. We adopt this upper value to assume that most papers use better performance results than the original setup. We investigate whether the assumed better performance results suffer from a large magnitude of performance variance. Next, we discuss the results analyzed in terms of CV and boxplots.
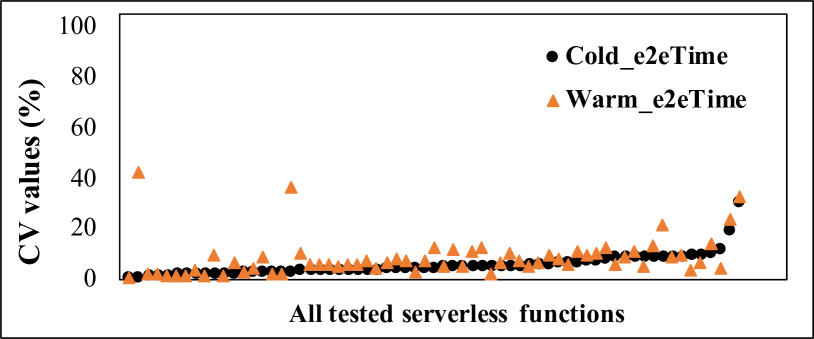
Results: (1) CV: We analyze CV values calculated from performance results generated by each serverless function under cold and warm starts. Fig. 7 shows these CV values, where cold-start CV values are ordered in ascending order.
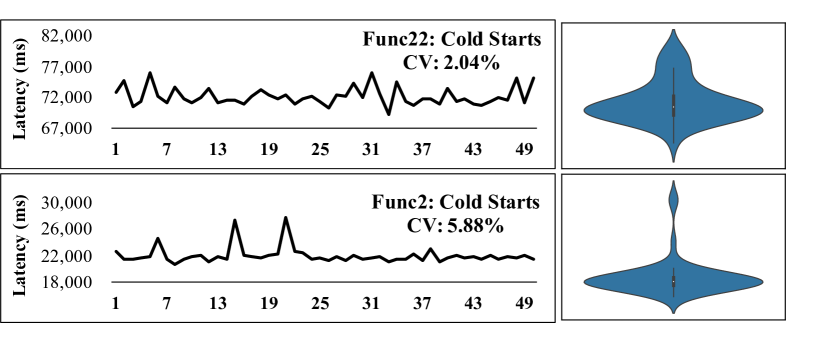
First, we observe that serverless function performance has different degrees of variance under cold and warm starts. Specifically, cold-start CV values range from 1.23% to 31.18%, while warm-start CV values range from 0.86% to 42.81%, differing by as much as 49 times and thus showing a wide range of variance. On average, the cold-start CV value is 6.21%, while the warm-start CV value is 8.73%. The median of cold-start CV values is 5.26%, while that of warm-start CV values is 6.70%. These results indicate that serverless functions executed in cold and warm starts produce different degrees of variance in performance. However, providing only these CV values is not a straightforward way to understand how the performance of serverless functions actually fluctuates. Thus, we give examples of the raw performance results of the serverless function. Fig. 7 shows 50 data points of performance obtained in cold starts for two serverless functions, which are numbered Func22 and Func2. We observe that multiple runs of the same serverless function produce different and fluctuating performance results. The CV values of Func22 and Func2 are 2.04% and 5.88%, respectively. The difference between the maximum and minimum values of Func22 achieves 6.76 seconds, and that of Func2 is 7.24 seconds. General, serverless functions execute short-lived and milliseconds-level tasks (Singhvi et al., 2021; Klimovic et al., 2018). Thus, second-level performance variance is severe for serverless functions. Moreover, from the right violin plot of Fig. 7, the distributions of data points of performance for different serverless functions are drastically different, being clustered in different positions. The data points of Func22 are distributed near the middle of its violin plot, while those of Func2 are distributed towards the bottom. Overall, we observe a significant variance in serverless function performance from two examples, where CV values are 2.04% and 5.88%, respectively. Therefore, we infer that other serverless functions with larger CV values than those shown in the examples will produce more significant fluctuations in performance.
We further check the serverless functions with high CV values, e.g., Func30 with warm-start CV value = 42.81%. The maximum and minimum values of performance results of Func30 differ by 338.76%, where the maximum value reaches 4.39 times its minimum value. The possible reason is that Func30 needs to transfer the file from the cloud storage (e.g., AWS S3 (aws, 2022a)) to the function instance through the network. However, the network may be unstable, and its fluctuation is unpredictable. We check all serverless functions, and the corresponding maximum and minimum values of the performance can differ by a mean of 44.15% and a median of 32.19%.
Second, we observe that the variance of serverless function performance is slightly more severe under warm starts than under cold starts. Specifically, the warm-start CV values for 67.69% (44/65) of the serverless functions are greater than those of the corresponding cold starts. We also calculate the number of the functions whose CV values are greater than 10%, which generally indicates a large degree of variance (Maricq et al., 2018; Zhao et al., 2021; Uta et al., 2020). In cold starts, there are 7.69% (5/65) functions, while warm starts have 32.31% (21/65). This implies that warm-start performance has a more severe variance than cold-start performance. The possible reason is that executing tasks in the reused instances (i.e., warm starts) may be more susceptible to resource contention and underlying policies in serverless platforms.
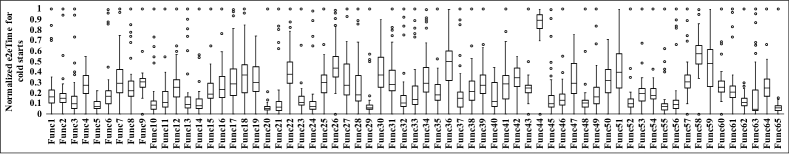
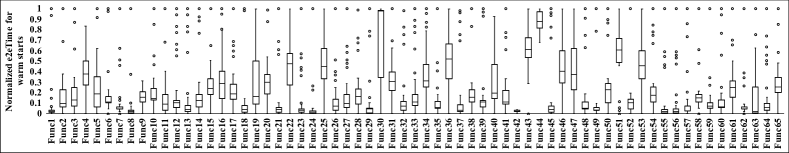
(2) Boxplot: We use boxplots to visually show the distributions of performance results of serverless functions. Since serverless functions have different levels of latency granularity, we apply the commonly used min-max normalization method (nor, 2022) to normalize each set of performance results generated by the serverless function to the 0 to 1 interval. Figs. 8 and 9 show the normalized boxplots about the performance of 65 serverless functions under cold starts and warm starts, respectively. The bottom of the box represents the value at the 25th percentile, while its top is the 75th percentile. The line in the box is the median, i.e., 50th percentile. Dots outside of the whiskers are outliers. We observe that most performance results (i.e., from the 25th percentile to the 75th percentile) of the serverless functions do not fall near the middle, i.e., 0.5 of 0 to 1 interval. This phenomenon occurs under both cold starts and warm starts. Moreover, the range sizes of most performance results of the serverless functions are inconsistent, indicating that there may not be a fixed distribution pattern for serverless function performance.
To further determine if the data distribution of serverless function performance is concentrated or skewed, we check whether the median of performance results falls within an error interval. This interval represents the 1% error above or below the middle value calculated from the maximum and minimum values. If the median is in this interval, the data distribution for serverless function performance is determined to be concentrated, and otherwise, it is skewed. The results show that distributions of the performance results of more than 92% of the serverless functions are skewed both under cold starts and warm starts. We also try to determine the direction in which most performance results of the serverless function are biased to the boxplot. We calculate the sum of distances of all performance results of each serverless function from its maximum and minimum values, respectively. The results show that most performance results of over 92% (cold starts: 63/65; warm starts: 60/65) of the serverless functions are skewed towards the corresponding minimum values, and another side of boxplots has a long tail. This can be observed visually in Figs. 8 and 9, where most boxplots are in the middle and lower part of the 0 to 1 interval.
6. RQ3: Distribution Characteristics
In RQ3, we investigate the distribution characteristics that serverless function performance actually has. These characteristics help researchers and software engineers select suitable statistical techniques to analyze variable serverless function performance of multiple runs. In our study, we focus on stationarity and normality of distributions, being explained as follows.
On one hand, most statistical methods (e.g., confidence intervals) are to assume data stationarity (Maricq et al., 2018). The stationarity means that characteristics (e.g., median and percentile) of the underlying distribution will not change over time, i.e., most uncertainty factors and potential impacts of platforms have been included and reflected in the performance results. A stationary distribution can facilitate the performance analysis and make experiments more reliable. If the generated performance results follow a non-stationary distribution, it means that conducted experiments would not allow for a fair and reliable comparison. In this section, we check the stationarity of serverless function performance using the Augmented Dickey-Fuller test (Dickey and Fuller, 1979) (abbreviated as ADF test), which is a common statistical test to check whether the given data is stationary or not (Maricq et al., 2018; ADF, 2022). The null hypothesis of the ADF test is that performance results follow a non-stationary distribution. When running the ADF test for a set of performance results, we can obtain a value. The value is greater than 0.05, allowing us to accept the null hypothesis, i.e., the performance generated by the serverless function is non-stationary. If the value is less than 0.05, we reject the null hypothesis to get the conclusion that the performance generated by the serverless function follows a stationary distribution.
On the flip side, the statistical methods commonly used for the performance analysis of computer systems tend to assume that performance results are normally distributed (Bukh, 1992; He et al., 2019). We investigate whether serverless function performance also follows a normal distribution. We use the Shapiro-Wilk test (Shapiro and Wilk, 1965) (abbreviated as W test), which is considered the most powerful normality test in most situations (Wpo, 2022). In the W test, its null hypothesis is that the performance results come from the population with the normal distribution. When running the W test, we also obtain a value. At a value greater than 0.05, we can accept the null hypothesis to indicate that serverless function performance follows a normal distribution; otherwise, we reject the null hypothesis and describe the serverless function performance as following a non-normal distribution.
We apply stationarity and normality checks to the performance results of 50 runs of each serverless function. These performance results are obtained in different instants of the day. The specific analysis results are as follows.
Results: We observe that performance results generated by most serverless functions are stationary. Moreover, they follow a non-normal distribution. Fig. 11 shows the CDF about all values, which are obtained by running the ADF tests on performance results of 50 runs of each serverless function for checking stationarity. We observe that most values are less than 0.05, i.e., rejecting the null hypothesis and presenting strong evidence for stationarity. Specifically, the performance results of 96.92% (63/65) and 90.77% (59/65) of the serverless functions are stationary in cold starts and warm starts, respectively. Thus, we conclude that, despite the significant variance that serverless function performance shows, the performance of most serverless functions follows a stationary distribution, which includes most uncertainty factors and potential impacts from the underlying environment of serverless platforms.
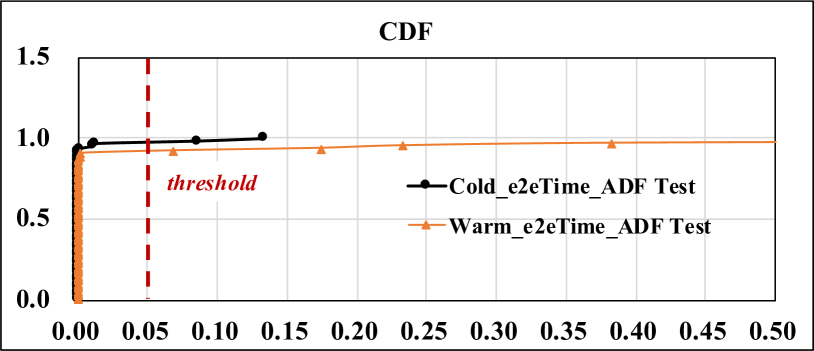
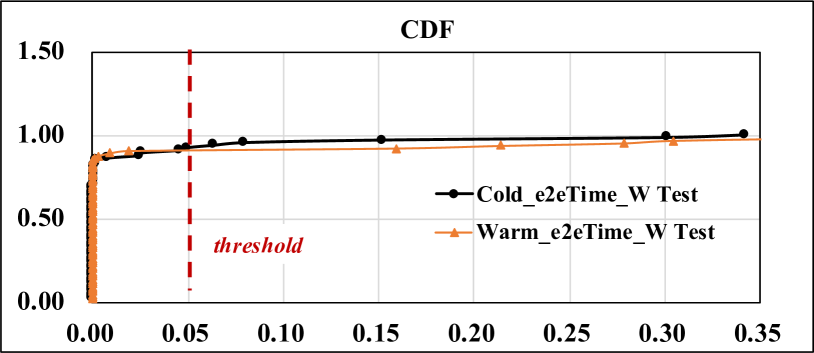
Fig. 11 shows the CDF about all values obtained from W tests, which are applied to the performance results of 50 runs of each serverless function for checking normality. We observe that most values are less than 0.05, i.e., rejecting the null hypothesis and presenting strong evidence for normality. Specifically, the performance results of 92.31% (60/65) and 90.77% (59/65) of the serverless functions follow a normal distribution in cold starts and warm starts, respectively. In this situation, non-parametric analysis methods, which do not assume normality, are more appropriate for the performance analysis of serverless functions. For example, using non-parametric confidence intervals for the median may be effective, and they can also work for the normality distribution (Maricq et al., 2018).
7. RQ4: Reliability and Repetitions
In RQ4, we investigate the reliability of serverless function performance obtained at different repetitions. First, we use the performance results of the serverless function at 50 repetitions as standard result of serverless function performance, since 75% of the surveyed papers that report repetitions use no more than 50 times. Then, we compare the serverless function performance obtained at low repetitions that are used in the surveyed papers, i.e., 3, 4, 5, 10, 15, and 20, shown in Fig. 5. From RQ3, we find that non-parametric methods are appropriate for the performance analysis of serverless functions. Thus, we use the most common metric of interest, e.g., median, tail percentile, and confidence intervals (Maricq et al., 2018; Uta et al., 2020), to compare performance. We calculate the median performance and tail performance (e.g., 90th percentile) of the serverless function at different low repetitions. Meanwhile, we calculate the corresponding 95% confidence interval for the median and confidence interval for the 90th percentile at 50 repetitions, as adopted by the work (Uta et al., 2020). The 95% confidence interval for the median or confidence interval for the 90th percentile represents the range in which we could find the true median or 90th percentile with 95% probability if we could perform infinite repetitions. Thus, when a median or 90th percentile obtained at the low repetition lies outside the 95% confidence interval for the median or confidence interval for the 90th percentile obtained at the high repetition, it indicates that there is a 95% probability that this median or 90th percentile is inaccurate. The calculations of the confidence interval for the median and confidence interval for the 90th percentile can refer to the work (Le Boudec, 2010; Maricq et al., 2018).
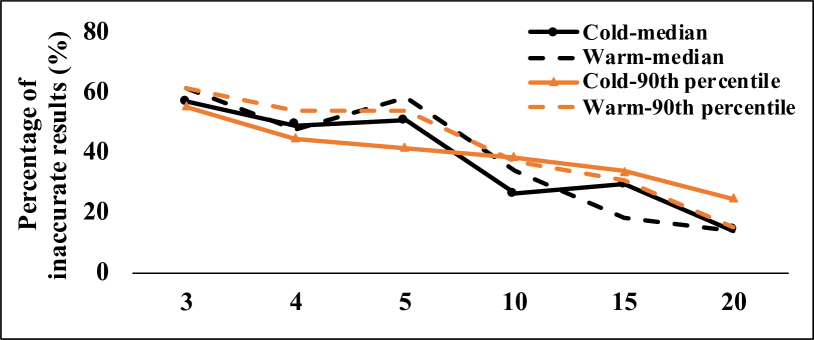
Result: We observe that the serverless functions produce inaccurate median and tail performance under low repetitions. Specifically, Fig. 13 shows the percentage of the serverless functions in the case where the obtained median or 90th percentile is inaccurate under different low repetitions. When the number of repetitions is 3, for 56.92% (37/65) of the serverless functions in cold starts, the obtained median falls outside of the confidence intervals obtained at 50 repetitions, i.e., the obtained median is inaccurate, while warm starts have 61.54% (40/65) of the functions. For the 90th percentile, 55.38% (36/65) of the functions have inaccurate tail performance at 3 repetitions (warm start: 61.54% (40/65)). This indicates that experiments with low repetitions have a high risk of reporting unreliable performance of serverless functions. We also observe that increasing the number of repetitions can make the percentage of inaccurate results decrease. However, at the 10-repetition most frequently used by the surveyed papers, 26.15% (17/65) of the functions still show inaccurate median performance, and 38.46% (25/65) of functions show inaccurate tail performance in cold starts. These results imply that serverless function performance is not reliable under low repetitions commonly used in most papers.
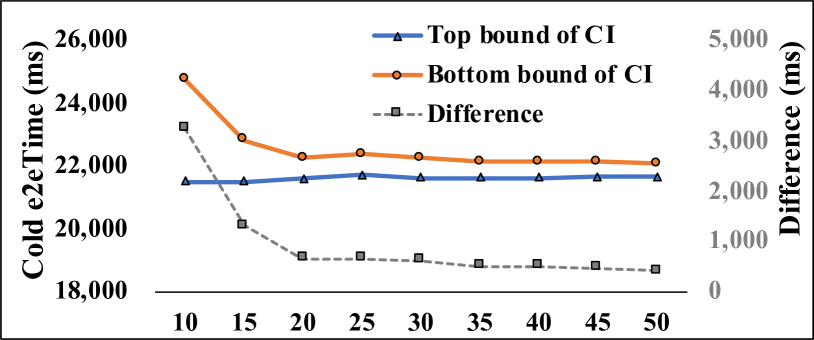
We try to find regularities in how to determine the appropriate repetitions for serverless functions to obtain reliable performance. We first observe the changes in top and bottom bounds for the confidence interval obtained at different repetitions. As an example, Fig. 13 shows the changes in the bounds of the confidence intervals for the median, with regard to Func2. We do not plot the bounds of confidence interval for the 90th percentile since repetitions of 50 and below are not enough to obtain them (Landis and Koch, 1977; Le Boudec, 2010). Moreover, we do not plot the confidence intervals for the median at smaller repetitions, e.g., 3, 4, and 5 in Fig. 13, because these repetitions are also insufficient to calculate them (Landis and Koch, 1977; Le Boudec, 2010). Instead, we compare the number of repetitions from 10 to 50 in 5-step increments. From Fig. 13, confidence intervals gradually become tight as the number of repetitions increases. The line representing the difference between the top bound and bottom bound also shows a gradual downward trend. However, when the number of repetitions is small, e.g., 20 to 25 repetitions, the bounds of the confidence interval may have slight fluctuations. It is reasonable that the distribution with a small number of results may not be stable. We also check changes in the bounds of confidence intervals from other serverless functions, showing a similar result to Fig. 13. Overall, performing more repetitions for serverless functions can achieve a tight confidence interval for the median, which increases confidence in claiming the obtained results are close to the population distribution.
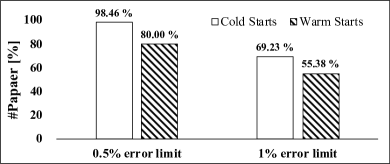
Leveraging the observation about tight confidence intervals for the median, we further explore how many repetitions may be required to achieve a sufficiently narrow confidence interval for serverless function performance. This interval is a desired interval representing satisfactory performance, where the empirical median differs from the observed true median by no more than the error margin at a given confidence level, e.g., 95%. In other words, when the confidence interval for the median obtained from results at a certain repetition drops within the error margin of the corresponding observed true median performance, the desired confidence interval is obtained to stop running the serverless function, and the current number of repetitions is regarded as the appropriate repetition for the serverless function. We show the results for = 0.5% and 1% in Fig. 14. When = 0.5%, in cold starts, 98.46% (64/65) of the serverless functions require being executed at least 50 times to get the desired confidence interval, while warm starts have 80.00% (52/65) of the functions. After we relax to 1%, there are still 69.23% (45/65) functions that need to be executed repeatedly at least 50 times in cold starts. There are 55.38% (36/65) functions in warm starts. However, according to the aforementioned Fig. 5, only 37.50% of the papers that report experiment repetitions execute serverless functions more than 50 times. Overall, these results indicate that serverless functions require far more repetitions than the ones commonly used in most surveyed papers.
8. Discussion
8.1. Implications, suggestions, and future work
Correct data analysis. Serverless function performance follows a stationary distribution and non-normal distribution, as shown in RQ3. This indicates some of the standard default assumptions of statistical analysis in the common performance analysis may be broken. In light of this finding, it is advisable to identify general and standard assumptions, such as testing for stationarity (Dickey and Fuller, 1979) and normality (Shapiro and Wilk, 1965), when analyzing the performance of serverless functions. If performance results are not stationary, performance acquisition for serverless functions can be restricted to the time period in which stationarity holds, or repeated over a longer time frame, etc. When performance results do not follow a normal distribution, non-parametric analysis techniques (Gibbons and Chakraborti, 2014) can be applied.
Research reliability and reproducibility. Variance of serverless function performance reduces the reliability of research conclusions and the reproducibility of serverless computing-related experiments. From the result of RQ1 we obserdved that most research papers related to serverless function performance lack an adequate description of performance results. We call on researchers to be aware of and pay more attention to the variance of serverless function performance. Meanwhile, they require to give detailed experimental designs. One practical strategy is to provide a specific and non-arbitrary number of repetitions. This number may be set to be greater than 50 if possible, but it is not recommended to be too large (e.g., 1,000) due to the high runtime overhead. Based on the obtained performance data, researchers can report comprehensive results (including mean, median, coefficient of variance, percentile, confidence intervals, and distribution) to compare solutions from multiple dimensions and provide strong evidence for conclusions. Moreover, making raw data of serverless function performance publicly available allows other researchers to calculate any metric of interest and facilitates researchers to derive valuable observations across different studies.
Serverless functions have two start types: cold starts and warm starts. Some studies have focused on optimizing cold-start performance (Wang et al., 2021; Jia and Witchel, 2021), while others have aimed to ensure efficient warm-start performance (Lin and Khazaei, 2020; Carreira et al., 2021). In RQ2, we find that the variance of serverless function performance is slightly more severe under warm starts than under cold starts. Generally, the higher the performance variance, the greater the risk that the experiment will report unreliable results. Thus, we advise paying more attention to the variance of serverless function performance in warm starts. One solution is to perform few and not simultaneous invocations of warm starts at a time to decrease the potential risk of resource contention from multiple function instances. Additionally, since serverless function performance has different degrees of variance under cold and warm starts, the conducted experimental designs regarding performance acquisition, e.g., setting of the number of repetitions, need to be considered separately in different start types, if possible.
The serverless computing-related researchers often presented new approaches to improve serverless function performance (Akkus et al., 2018; Wang et al., 2021; Jia and Witchel, 2021). These approaches were compared with other existing baselines to demonstrate the effectiveness in performance improvement. When comparing the improvement in serverless function performance produced by different approaches, we suggest using the Mann-Whitney U-test (Man, 2023). It is a statistical test that assesses the similarity of sample distributions, and it does not assume the normality of distributions. Moreover, studies from other topics, e.g., deep learning (Pham et al., 2020) and hardware system (Maricq et al., 2018), have used it to measure the performance difference. If there is a statistically significant difference, researchers can further compute the effect size to check if the difference has a meaningful effect. Cliff’s (Cli, 2023) can be applied to obtain the effect size because it does not also assume data normality. Generally, 0.428 is considered a large effect (Bennin et al., 2017; Kitchenham et al., 2017).
Network and storage optimization from the developers’ perspective. From the analysis of RQ2, we found that the serverless functions integrating external cloud services (such as AWS S3 (aws, 2022a)) exhibit a high coefficient of variance. This can be attributed to network requests associated with external storage services. From a developer perspective, one can choose the closest service availability region to the region where the storage service is located for serverless functions to reduce network latency and fluctuations. For stored data, developers can apply compression and serialization techniques (Com, 2023) to reduce the volume of data in the network transmission process.
New performance testing approaches. Performing more repetitions for serverless functions will obtain a tight confidence interval about performance, as shown in RQ4. This means that we can be more confident that the distribution of the obtained performance results is close to the population distribution. Therefore, the tight confidence interval can provide a powerful basis for the accuracy of serverless function performance. However, the serverless computing scenario may require a stricter confidence interval constraint as the stopping condition for repeated runs of the experiment because the serverless functions are short-lived, and the underlying infrastructure is highly dynamic. In future work, we will develop such a performance testing technique to help developers determine accurate serverless function performance to reduce manual effort.
Specialized performance bug detection. The design of the underlying environment of serverless platforms is agnostic to software developers. Other reasons for the significant performance variance may stem from the unique programming model characteristics of serverless computing, such as event-driven design and the separation pattern of compute and storage (Wen et al., 2023). A research opportunity could be to design specialized performance bug detection techniques to identify and fix specific bugs or issues that directly impact the performance of a serverless function.
Variance-aware serverless functions. The variance analysis of serverless function performance presented in our work opens up intriguing avenues for future research. For instance, serverless functions can be designed to be variance-aware in the future. New techniques or algorithms (such as efficient variance modeling) may be desirable. Additionally, there is a need to investigate strategies and mechanisms to make serverless functions more adaptive and responsive to variance. This will empower serverless functions to autonomously adjust their configurations or resource allocations based on the observed variance, ensuring optimal performance and stability.
8.2. Threats to validity
Construct validity. We calculate relevant metrics (e.g., coefficient of variance) and statistical tests (e.g., ADF test and W test) based on the realistic performance results generated by serverless functions. There is a threat that the collected results may not match the corresponding serverless function. To minimize this threat, we carefully collect results and double-check whether these results belong to the corresponding serverless function. Moreover, we carefully calculate metrics, apply statistical tests, and verify the required assumptions.
Internal validity. In our methodology, we rely on top-tier conferences to collect the related papers. We also label the reporting information of each paper in RQ1. We cannot guarantee that the collected papers are complete and the summarized information is correct. To mitigate these threats, the first two authors independently read the title and abstract parts of each paper and then select relevant ones. Moreover, they separately read the full text of the selected papers to determine specific information. We calculate the inter-rater agreement, and the values imply that our labeling procedures are reliable. Additionally, an experienced arbitrator resolves the conflicts to reach an agreement with the first two authors.
In RQ2, we do not further explore variance sources or behaviors of the underlying platform. However, this threat is unavoidable since cloud providers may change the platform’s policies, and policies are opaque and uncontrollable to external users. Moreover, the cloud-based underlying mechanism is complex due to large-scale server management, and thus it is difficult to distinguish variance sources. In addition, task types of serverless functions are diverse, and it is challenging to clearly summarize the behavior changes of the serverless platform. Our study mainly aims to reveal that the serverless function performance has significant variance when executed on serverless platforms. We also try to arouse awareness and attention about this problem and give actionable suggestions to alleviate it. In future work, we will design a lightweight performance testing approach to determine the number of repetitions with reliable serverless function performance to conduct valid experiments.
External validity. In RQ3, we explore the distribution characteristics of serverless function performance. Serverless functions with different functionalities may have inconsistent distribution characteristics. This may lead to the limited generalizability of the characteristics that we find. To alleviate this threat, we summarize the characteristics of the performance of the 65 serverless functions. These functions have a wide range of task types, including machine learning, scientific computing, and Web requests. Therefore, the distribution characteristics that we summarize belong to the characteristics exhibited by most serverless functions. Certainly, some serverless functions may follow a non-stationary distribution or normal distribution. In this situation, we refer the reader to the suggestions about correct data analysis discussed in Section 8.1.
9. Related Work
9.1. Serverless computing performance
Serverless computing is an emerging development paradigm for software developers, and it has been widely exploited in various software applications, e.g., video processing (Fouladi et al., 2017; Ao et al., 2018), machine learning (Jiang et al., 2021; Wu et al., 2022), scientific computing (Shankar et al., 2020; Li et al., 2022b), and big data analytics (Müller et al., 2020; Zhang et al., 2021). The SE community has also shown a growing interest in serverless computing (Liu et al., 2023; Eismann et al., 2021b; Wen et al., 2021a, 2023; Lenarduzzi and Panichella, 2020; Ristov et al., 2020; Adzic and Chatley, 2017; Eismann et al., 2022). For example, Eismann et al. (Eismann et al., 2021b) analyzed the usage characteristics of serverless-based applications and revealed the performance importance. Wen et al. (Wen et al., 2021a) explored specific development challenges containing performance issues when developing serverless-based applications. The stability of performance measurements (Eismann et al., 2022) on the serverless platform was investigated under varying configurations regarding the load or concurrency level. A general approach called FaaSLight (Liu et al., 2023) was presented to improve the cold-start performance of serverless functions. We conduct a timely analysis of the variance of serverless function performance and try to provide actionable suggestions to alleviate it.
In the serverless computing literature, the most widely studied topic is the performance of serverless computing (Wen et al., 2023; Li et al., 2022a; Scheuner and Leitner, 2020). These studies have focused on performance prediction (Eismann et al., 2021a; Lin and Khazaei, 2020) and performance optimization (Akkus et al., 2018; Wang et al., 2021; Jia and Witchel, 2021). For performance prediction, existing studies have leveraged the history data (e.g., memory size or resource consumption) to predict the serverless function performance (Eismann et al., 2021a; Lin and Khazaei, 2020). However, even though comprehensive history factors are considered, it is challenging to predict an accurate performance since the serverless function executed on the serverless platform shows different performance results each time. For performance optimization (Akkus et al., 2018; Wang et al., 2021; Jia and Witchel, 2021), existing studies have proposed new solutions (e.g., new systems or platforms) and then used serverless functions to evaluate them. The serverless function performance is the key to verifying the effectiveness of solutions. However, we find that serverless function performance has a significant variance. Moreover, existing related studies (even influential studies from top-tier conferences) often overlooked the variance of serverless function performance. To the best of our knowledge, this variance has not also been studied in the serverless computing literature.
9.2. Performance variance analysis
Existing studies have focused on analyzing performance variance for different domains. For example, Maricq et al. (Maricq et al., 2018) conducted a study on the performance variance of hardware, where they analyzed collected data to demystify the quantities of variance. Uta et al. (Uta et al., 2020) investigated the performance variance of networks when executing big data workloads, aiming to understand their impact on performance reproducibility. Additionally, Georges et al. (Georges et al., 2007) presented a survey of Java performance evaluation methodologies. Although the significance of performance variance has been acknowledged by various communities, the serverless computing community still lacks awareness of the variance of serverless function performance. In the context of serverless computing, the underlying environments are complex and highly dynamic. However, the magnitude of performance variance and performance characteristics in the new programming model - serverless functions, remain unclear. While it is true that many practitioners and researchers may also have their suspicions about the performance variance of serverless computing, there is no scientific measurement of the effect size of it. In this paper, we provide an empirical study to properly measure and understand the magnitude of the problem. Without this, all we are left with is a “belief” rather than quantitative scientific evidence.
10. Conclusion
We conducted the first empirical study to investigate the variance of serverless function performance. First, we performed a literature review of 59 related papers, showing that attention to this variance is still in the infancy stage. Second, we analyzed the performance of 65 serverless functions collected from these papers obtained over multiple runs. We observed a significant performance variance. Then, we explored the distribution characteristics of serverless function performance, finding that the performance of over 90% of the serverless functions follows a non-normal distribution, and thus is more appropriate to use non-parametric analysis that does not assume normality. Finally, we analyzed the reliability of serverless function performance obtained by executing a low number of repetitions, as commonly done in our collected papers. We found that 61.54% of the functions have unreliable performance. Moreover, 98.46% of the functions required being executed at least 50 times to achieve reliable performance, but only 37.50% of the collected papers that report experiment repetitions execute serverless functions more than 50 times. This implies that serverless functions require far more repetitions than the ones commonly used in the literature.
References
- (1)
- mar (2019) 2019. A research and markets report. https://www.researchandmarkets.com/reports/4828585/serverless-architecture-market-by-deployment. Retrieved on December 10, 2022.
- aws (2021) 2021. Comparison of cold starts in serverless functions across AWS, Azure, and GCP. https://mikhail.io/serverless/coldstarts/big3/. Retrieved on December 10, 2022.
- ser (2022a) 2022a. 2018 serverless community survey: huge growth in serverless usage. https://www.serverless.com/blog/2018-serverless-community-survey-huge-growth-usage. Retrieved on December 10, 2022.
- aws (2022a) 2022a. Amazon S3. https://aws.amazon.com/s3/. Retrieved on December 10, 2022.
- aws (2022b) 2022b. AWS Lambda. https://docs.aws.amazon.com/lambda/latest/dg/welcome.html. Retrieved on December 10, 2022.
- AWS (2022a) 2022a. AWS Samples. https://github.com/aws-samples. Retrieved on December 10, 2022.
- pre (2022) 2022. The CIO’s guide to serverless computing. https://www.gartner.com/smarterwithgartner/the-cios-guide-to-serverless-computing. Retrieved on December 10, 2022.
- csr (2022) 2022. CSRankings. https://csrankings.org. Retrieved on December 10, 2022.
- AWS (2022b) 2022b. Default memory size of AWS Lambda. https://docs.aws.amazon.com/lambda/latest/operatorguide/computing-power.html. Retrieved on December 08, 2022.
- Goo (2022a) 2022a. Default memory size of Google Cloud Functions. https://cloud.google.com/functions/docs/configuring/memory. Retrieved on December 08, 2022.
- AWS (2022c) 2022c. Default timeout of AWS Lambda. https://docs.aws.amazon.com/lambda/latest/dg/configuration-function-common.html. Retrieved on December 08, 2022.
- Goo (2022b) 2022b. Default timeout of Google Cloud Functions. https://cloud.google.com/functions/docs/configuring/timeout. Retrieved on December 08, 2022.
- goo (2022) 2022. Google Cloud Functions. https://cloud.google.com/functions. Retrieved on December 10, 2022.
- nor (2022) 2022. Minmax normalization. https://www.oreilly.com/library/view/hands-on-machine-learning/9781788393485/fd5b8a44-e9d3-4c19-bebb-c2fa5a5ebfee.xhtml. Retrieved on December 10, 2022.
- Wpo (2022) 2022. Normality tests. https://pulmonarychronicles.com/index.php/pulmonarychronicles/article/view/805/1759. Retrieved on December 10, 2022.
- ser (2022b) 2022b. The state of serverless. https://www.datadoghq.com/state-of-serverless/. Retrieved on December 10, 2022.
- ADF (2022) 2022. Why is Augmented Dickey–Fuller test (ADF Test) so important. https://medium.com/@cmukesh8688/why-is-augmented-dickey-fuller-test-adf-test-so-important-in-time-series-analysis-6fc97c6be2f0. Retrieved on December 10, 2022.
- Cli (2023) 2023. Cliff’s delta. https://en.wikipedia.org/wiki/Effect_size. Retrieved on May 10, 2023.
- Com (2023) 2023. Compression and serialization techniques benchmarking. https://medium.com/@nitinpaliwal87/compression-and-serialization-techniques-benchmarking-fd1f34c1098b. Retrieved on May 08, 2023.
- Man (2023) 2023. Mann Whitney U test. https://en.wikipedia.org/wiki/Mann-Whitney_U_test. Retrieved on May 10, 2023.
- our (2023) 2023. Supplemental materials. https://github.com/JinfengWenCode/Serverless_Variance.
- Adzic and Chatley (2017) Gojko Adzic and Robert Chatley. 2017. Serverless computing: economic and architectural impact. In Proceedings of the 11th Joint Meeting on Foundations of Software Engineering. 884–889.
- Akkus et al. (2018) Istemi Ekin Akkus, Ruichuan Chen, Ivica Rimac, Manuel Stein, Klaus Satzke, Andre Beck, Paarijaat Aditya, and Volker Hilt. 2018. SAND: Towards high-performance serverless computing. In Proceedings of the 2018 USENIX Annual Technical Conference. 923–935.
- Ao et al. (2018) Lixiang Ao, Liz Izhikevich, Geoffrey M Voelker, and George Porter. 2018. Sprocket: A serverless video processing framework. In Proceedings of the ACM Symposium on Cloud Computing. 263–274.
- Bennin et al. (2017) Kwabena Ebo Bennin, Jacky Keung, Akito Monden, Passakorn Phannachitta, and Solomon Mensah. 2017. The significant effects of data sampling approaches on software defect prioritization and classification. In Proceedings of the ACM/IEEE International Symposium on Empirical Software Engineering and Measurement. 364–373.
- Bermbach et al. (2022) David Bermbach, Jonathan Bader, Jonathan Hasenburg, Tobias Pfandzelter, and Lauritz Thamsen. 2022. AuctionWhisk: Using an auction-inspired approach for function placement in serverless fog platforms. Software: Practice and Experience 52, 5 (2022), 1143–1169.
- Bukh (1992) Per Nikolaj D Bukh. 1992. The art of computer systems performance analysis, techniques for experimental design, measurement, simulation and modeling. (1992).
- Carreira et al. (2021) Joao Carreira, Sumer Kohli, Rodrigo Bruno, and Pedro Fonseca. 2021. From warm to hot starts: Leveraging runtimes for the serverless era. In Proceedings of the Workshop on Hot Topics in Operating Systems. 58–64.
- Cohen (1960) Jacob Cohen. 1960. A coefficient of agreement for nominal scales. Educational and psychological measurement 20, 1 (1960), 37–46.
- Copik et al. (2021) Marcin Copik, Grzegorz Kwasniewski, Maciej Besta, Michal Podstawski, and Torsten Hoefler. 2021. SeBS: A serverless benchmark suite for Function-as-a-Service computing. In Proceedings of the 22nd International Middleware Conference. 64–78.
- Dickey and Fuller (1979) David A Dickey and Wayne A Fuller. 1979. Distribution of the estimators for autoregressive time series with a unit root. Journal of the American statistical association 74, 366a (1979), 427–431.
- Eismann et al. (2021a) Simon Eismann, Long Bui, Johannes Grohmann, Cristina Abad, Nikolas Herbst, and Samuel Kounev. 2021a. Sizeless: Predicting the optimal size of serverless functions. In Proceedings of the 22nd International Middleware Conference. 248–259.
- Eismann et al. (2022) Simon Eismann, Diego Elias Costa, Lizhi Liao, Cor-Paul Bezemer, Weiyi Shang, André van Hoorn, and Samuel Kounev. 2022. A case study on the stability of performance tests for serverless applications. Journal of Systems and Software 189 (2022), 111294.
- Eismann et al. (2021b) Simon Eismann, Joel Scheuner, Erwin Van Eyk, Maximilian Schwinger, Johannes Grohmann, Nikolas Herbst, Cristina Abad, and Alexandru Iosup. 2021b. The state of serverless applications: collection, characterization, and community consensus. IEEE Transactions on Software Engineering 48, 10 (2021), 4152–4166.
- Eskandani and Salvaneschi (2021) Nafise Eskandani and Guido Salvaneschi. 2021. The Wonderless dataset for serverless computing. In Proceedings of the 2021 IEEE/ACM 18th International Conference on Mining Software Repositories. IEEE, 565–569.
- Fouladi et al. (2017) Sadjad Fouladi, Riad S Wahby, Brennan Shacklett, Karthikeyan Vasuki Balasubramaniam, William Zeng, Rahul Bhalerao, Anirudh Sivaraman, George Porter, and Keith Winstein. 2017. Encoding, fast and slow: low-Latency video processing using thousands of tiny threads. In Proceedings of the 14th USENIX Symposium on Networked Systems Design and Implementation. 363–376.
- Fuerst and Sharma (2022) Alexander Fuerst and Prateek Sharma. 2022. Locality-aware load-balancing for serverless clusters. In Proceedings of the 31st International Symposium on High-Performance Parallel and Distributed Computing. 227–239.
- Georges et al. (2007) Andy Georges, Dries Buytaert, and Lieven Eeckhout. 2007. Statistically rigorous java performance evaluation. ACM SIGPLAN Notices 42, 10 (2007), 57–76.
- Gibbons and Chakraborti (2014) Jean Dickinson Gibbons and Subhabrata Chakraborti. 2014. Nonparametric statistical inference. CRC press.
- Guizzo et al. (2020) Giovani Guizzo, Federica Sarro, and Mark Harman. 2020. Cost measures matter for mutation testing study validity. In Proceedings of the 28th ACM Joint Meeting on European Software Engineering Conference and Symposium on the Foundations of Software Engineering. 1127–1139.
- Hassan et al. (2021) Hassan B Hassan, Saman A Barakat, and Qusay I Sarhan. 2021. Survey on serverless computing. Journal of Cloud Computing 10, 1 (2021), 1–29.
- He et al. (2019) Sen He, Glenna Manns, John Saunders, Wei Wang, Lori Pollock, and Mary Lou Soffa. 2019. A statistics-based performance testing methodology for cloud applications. In Proceedings of the 27th ACM Joint Meeting on European Software Engineering Conference and Symposium on the Foundations of Software Engineering. 188–199.
- Jia and Witchel (2021) Zhipeng Jia and Emmett Witchel. 2021. Nightcore: efficient and scalable serverless computing for latency-sensitive, interactive microservices. In Proceedings of the 26th ACM International Conference on Architectural Support for Programming Languages and Operating Systems. 152–166.
- Jiang et al. (2021) Jiawei Jiang, Shaoduo Gan, Yue Liu, Fanlin Wang, Gustavo Alonso, Ana Klimovic, Ankit Singla, Wentao Wu, and Ce Zhang. 2021. Towards demystifying serverless machine learning training. In Proceedings of the 2021 International Conference on Management of Data. 857–871.
- Jonas et al. (2019) Eric Jonas, Johann Schleier-Smith, Vikram Sreekanti, Chia-Che Tsai, Anurag Khandelwal, Qifan Pu, Vaishaal Shankar, Joao Carreira, Karl Krauth, Neeraja Yadwadkar, Joseph E. Gonzalez, Raluca Ada Popa, Ion Stoica, and David A. Patterson. 2019. Cloud programming simplified: A Berkeley view on serverless computing. arXiv preprint arXiv:1902.03383 (2019).
- Kim and Lee (2019) Jeongchul Kim and Kyungyong Lee. 2019. Functionbench: A suite of workloads for serverless cloud function service. In Proceedings of the IEEE 12th International Conference on Cloud Computing. IEEE, 502–504.
- Kitchenham et al. (2017) Barbara A. Kitchenham, Lech Madeyski, David Budgen, Jacky Keung, Pearl Brereton, Stuart M. Charters, Shirley Gibbs, and Amnart Pohthong. 2017. Robust statistical methods for empirical software engineering. Empirical Software Engineering 22, 2 (2017), 579–630.
- Klimovic et al. (2018) Ana Klimovic, Yawen Wang, Patrick Stuedi, Animesh Trivedi, Jonas Pfefferle, and Christos Kozyrakis. 2018. Pocket: Elastic ephemeral storage for serverless analytics. In Proceedings of the 13th USENIX Symposium on Operating Systems Design and Implementation. 427–444.
- Landis and Koch (1977) J Richard Landis and Gary G Koch. 1977. The measurement of observer agreement for categorical data. Biometrics 33, 1 (1977), 159–174.
- Le Boudec (2010) Jean-Yves Le Boudec. 2010. Performance evaluation of computer and communication systems. Vol. 2. Epfl Press Lausanne.
- Lenarduzzi and Panichella (2020) Valentina Lenarduzzi and Annibale Panichella. 2020. Serverless testing: Tool vendors’ and experts’ points of view. IEEE Software 38, 1 (2020), 54–60.
- Li et al. (2022a) Yongkang Li, Yanying Lin, Yang Wang, Kejiang Ye, and Cheng-Zhong Xu. 2022a. Serverless computing: state-of-the-art, challenges and opportunities. IEEE Transactions on Services Computing (2022).
- Li et al. (2022b) Zijun Li, Yushi Liu, Linsong Guo, Quan Chen, Jiagan Cheng, Wenli Zheng, and Minyi Guo. 2022b. FaaSFlow: enable efficient workflow execution for function-as-a-service. In Proceedings of the 27th ACM International Conference on Architectural Support for Programming Languages and Operating Systems. 782–796.
- Lin and Khazaei (2020) Changyuan Lin and Hamzeh Khazaei. 2020. Modeling and optimization of performance and cost of serverless applications. IEEE Transactions on Parallel and Distributed Systems 32, 3 (2020), 615–632.
- Liu et al. (2023) Xuanzhe Liu, Jinfeng Wen, Zhenpeng Chen, Ding Li, Junkai Chen, Yi Liu, Haoyu Wang, and Xin Jin. 2023. FaaSLight: general application-Level cold-start latency optimization for Function-as-a-Service in serverless computing. ACM Transactions on Software Engineering and Methodology (2023).
- Mahgoub et al. (2022) Ashraf Mahgoub, Edgardo Barsallo Yi, Karthick Shankar, Sameh Elnikety, Somali Chaterji, and Saurabh Bagchi. 2022. ORION and the three rights: Sizing, bundling, and prewarming for serverless DAGs. In Proceedings of the 16th USENIX Symposium on Operating Systems Design and Implementation. 303–320.
- Maissen et al. (2020) Pascal Maissen, Pascal Felber, Peter Kropf, and Valerio Schiavoni. 2020. FaaSdom: A benchmark suite for serverless computing. In Proceedings of the 14th ACM International Conference on Distributed and Event-based Systems. 73–84.
- Maricq et al. (2018) Aleksander Maricq, Dmitry Duplyakin, Ivo Jimenez, Carlos Maltzahn, Ryan Stutsman, and Robert Ricci. 2018. Taming performance variability. In Proceedings of the 13th USENIX Symposium on Operating Systems Design and Implementation. 409–425.
- Müller et al. (2020) Ingo Müller, Renato Marroquín, and Gustavo Alonso. 2020. Lambada: Interactive data analytics on cold data using serverless cloud infrastructure. In Proceedings of the 2020 International Conference on Management of Data. 115–130.
- Papadopoulos et al. (2019) Alessandro Vittorio Papadopoulos, Laurens Versluis, André Bauer, Nikolas Herbst, Jóakim Von Kistowski, Ahmed Ali-Eldin, Cristina L Abad, José Nelson Amaral, Petr Tuma, and Alexandru Iosup. 2019. Methodological principles for reproducible performance evaluation in cloud computing. IEEE Transactions on Software Engineering 47, 8 (2019), 1528–1543.
- Patterson et al. (2022) Liam Patterson, David Pigorovsky, Brian Dempsey, Nikita Lazarev, Aditya Shah, Clara Steinhoff, Ariana Bruno, Justin Hu, and Christina Delimitrou. 2022. HiveMind: a hardware-software system stack for serverless edge swarms. In Proceedings of the 49th Annual International Symposium on Computer Architecture. 800–816.
- Perron et al. (2020) Matthew Perron, Raul Castro Fernandez, David DeWitt, and Samuel Madden. 2020. Starling: A scalable query engine on cloud functions. In Proceedings of the ACM SIGMOD International Conference on Management of Data. 131–141.
- Pham et al. (2020) Hung Viet Pham, Shangshu Qian, Jiannan Wang, Thibaud Lutellier, Jonathan Rosenthal, Lin Tan, Yaoliang Yu, and Nachiappan Nagappan. 2020. Problems and opportunities in training deep learning software systems: an analysis of variance. In Proceedings of the 35th IEEE/ACM International Conference on Automated Software Engineering. 771–783.
- Ristov et al. (2020) Sasko Ristov, Stefan Pedratscher, Jakob Wallnoefer, and Thomas Fahringer. 2020. Daf: Dependency-aware faasifier for node.js monolithic applications. IEEE Software 38, 1 (2020), 48–53.
- Scheuner and Leitner (2020) Joel Scheuner and Philipp Leitner. 2020. Function-as-a-service performance evaluation: A multivocal literature review. Journal of Systems and Software 170 (2020), 110708.
- Shahrad et al. (2019) Mohammad Shahrad, Jonathan Balkind, and David Wentzlaff. 2019. Architectural implications of function-as-a-service computing. In Proceedings of the 52nd annual IEEE/ACM international symposium on microarchitecture. 1063–1075.
- Shahrad et al. (2020) Mohammad Shahrad, Rodrigo Fonseca, Íñigo Goiri, Gohar Chaudhry, Paul Batum, Jason Cooke, Eduardo Laureano, Colby Tresness, Mark Russinovich, and Ricardo Bianchini. 2020. Serverless in the wild: Characterizing and optimizing the serverless workload at a large cloud provider. In Proceedings of the 2020 USENIX Annual Technical Conference. 205–218.
- Shankar et al. (2020) Vaishaal Shankar, Karl Krauth, Kailas Vodrahalli, Qifan Pu, Benjamin Recht, Ion Stoica, Jonathan Ragan-Kelley, Eric Jonas, and Shivaram Venkataraman. 2020. Serverless linear algebra. In Proceedings of the 11th ACM Symposium on Cloud Computing. 281–295.
- Shapiro and Wilk (1965) Samuel Sanford Shapiro and Martin B Wilk. 1965. An analysis of variance test for normality (complete samples). Biometrika 52, 3/4 (1965), 591–611.
- Singhvi et al. (2021) Arjun Singhvi, Arjun Balasubramanian, Kevin Houck, Mohammed Danish Shaikh, Shivaram Venkataraman, and Aditya Akella. 2021. Atoll: A scalable low-latency serverless platform. In Proceedings of the ACM Symposium on Cloud Computing. 138–152.
- Taibi et al. (2020) Davide Taibi, Josef Spillner, and Konrad Wawruch. 2020. Serverless computing-where are we now, and where are we heading? IEEE Software 38, 1 (2020), 25–31.
- Uta et al. (2020) Alexandru Uta, Alexandru Custura, Dmitry Duplyakin, Ivo Jimenez, Jan Rellermeyer, Carlos Maltzahn, Robert Ricci, and Alexandru Iosup. 2020. Is big data performance reproducible in modern cloud networks?. In Proceedings of the 17th USENIX symposium on networked systems design and implementation. 513–527.
- Wang et al. (2021) Ao Wang, Shuai Chang, Huangshi Tian, Hongqi Wang, Haoran Yang, Huiba Li, Rui Du, and Yue Cheng. 2021. FaaSNet: Scalable and fast provisioning of custom serverless container runtimes at Alibaba cloud function compute. In Proceedings of the 2021 USENIX Annual Technical Conference. 443–457.
- Wang et al. (2018) Liang Wang, Mengyuan Li, Yinqian Zhang, Thomas Ristenpart, and Michael Swift. 2018. Peeking behind the curtains of serverless platforms. In Proceedings of the 2018 USENIX Annual Technical Conference. 133–146.
- Wen et al. (2023) Jinfeng Wen, Zhenpeng Chen, Xin Jin, and Xuanzhe Liu. 2023. Rise of the planet of serverless computing: a systematic review. ACM Transactions on Software Engineering and Methodology (2023).
- Wen et al. (2021a) Jinfeng Wen, Zhenpeng Chen, Yi Liu, Yiling Lou, Yun Ma, Gang Huang, Xin Jin, and Xuanzhe Liu. 2021a. An empirical study on challenges of application development in serverless computing. In Proceedings of the 28th ACM Joint Meeting on European Software Engineering Conference and Symposium on the Foundations of Software Engineering. 416–428.
- Wen et al. (2021b) Jinfeng Wen, Yi Liu, Zhenpeng Chen, Junkai Chen, and Yun Ma. 2021b. Characterizing commodity serverless computing platforms. Journal of Software: Evolution and Process (2021), e2394.
- Wu et al. (2022) Yuncheng Wu, Tien Tuan Anh Dinh, Guoyu Hu, Meihui Zhang, Yeow Meng Chee, and Beng Chin Ooi. 2022. Serverless data science - are we there yet? a case study of model serving. In Proceedings of the 2022 International Conference on Management of Data. 1866–1875.
- Yu et al. (2020) Tianyi Yu, Qingyuan Liu, Dong Du, Yubin Xia, Binyu Zang, Ziqian Lu, Pingchao Yang, Chenggang Qin, and Haibo Chen. 2020. Characterizing serverless platforms with serverlessbench. In Proceedings of the 2020 ACM Symposium on Cloud Computing. 30–44.
- Zhang et al. (2021) Hong Zhang, Yupeng Tang, Anurag Khandelwal, Jingrong Chen, and Ion Stoica. 2021. Caerus: NIMBLE task scheduling for serverless analytics. In Proceedings of the 8th USENIX Symposium on Networked Systems Design and Implementation. 653–669.
- Zhao et al. (2021) Laiping Zhao, Yanan Yang, Yiming Li, Xian Zhou, and Keqiu Li. 2021. Understanding, predicting and scheduling serverless workloads under partial interference. In Proceedings of the International Conference for High Performance Computing, Networking, Storage and Analysis. 1–15.