From Unstructured to Structured: Transforming Chatbot Dialogues into Data Mart Schema for Visualization
Abstract.
Schools are among the primary avenues for public healthcare interventions. With resource limitations posing challenges to the routine conduct of health and wellness checks in Philippine public schools, the deployment of a chatbot-assisted health monitoring system may provide an alternative method. However, deriving insights from raw conversations is not straightforward due to the expressiveness of natural language that causes variances in the input. In this paper, we present a process for transforming unstructured dialogues into a structured schema. The process comprises four stages: (i) processing the dialogues through entity extraction and data aggregation, (ii) storing them as NoSQL documents on the cloud, (iii) transforming them into a star schema for online analytical processing and building an extract-transform-load workflow, and (iv) creating a web-based dashboard for visualizing summarized data and reports. Performance evaluation of this dashboard showed that increasing the number of stored dialogues by a factor of increased the loading time for the display of roll-up, drill-down, and filter results by around only one second.
1. Introduction
The promotion of health and wellness among primary school students is one of the thrusts of the United Nations Sustainable Development Goals (Nations, [n. d.]). In the Philippines, schools are the foremost avenues for public health intervention (Ruff et al., 2020), with national and regional programs, such as the Essential Heath Care Program (Monse et al., 2013), Oplan Kalusugan sa Department of Education (of the Philippines, 2019), and free vaccination initiatives (Guadalquiver, 2018), instituted to control the levels of preventable diseases among schoolchildren.
Despite these efforts, a significant barrier to performing routine wellness assessments in public elementary schools can be ascribed to a lack of manpower, as the usual approach to health monitoring requires nurses or doctors to facilitate the review of body systems. Moreover, student health records are typically stored as physical documents, which may become fragmented with the accumulation of more data over time and may be difficult to readily retrieve, update, and share across healthcare providers (Antonio et al., 2016; Thomas, 2009).
The deployment of an automated health monitoring system may help in facilitating routine wellness checks without the presence of a medical practitioner and store gathered information in the cloud. Since children may not be accustomed to navigating the highly structured paths in traditional WIMP (windows, icons, menus, and pointers) interfaces, integrating a chatbot into this system has the potential of capitalizing on a chatbot’s personified and anthropomorphic features to provide a familiar way for users to more freely interact and express themselves (Xiao et al., 2020).
Aside from employing a chatbot with speech and text processing abilities to interpret audio input and formulate intelligent responses, the health monitoring system should extract insights from the children’s conversations with the chatbot, update their health information in the cloud, and provide analytics and data visualization for healthcare professionals. Actualizing these necessitates a process that considers the unstructured nature of conversations, expressiveness of natural language input, and database design. The process includes transforming unstructured dialogues into a structured schema for data visualization. In particular, this process attempts to provide a way to:
-
•
Process the dialogues by performing entity extraction and data aggregation;
-
•
Store the processed dialogues in the cloud;
-
•
Transform the stored dialogues into a schema that facilitates online analytical processing (OLAP) and build an automated extract-transform-load (ETL) workflow; and
-
•
Create a web-based visualization dashboard that summarizes the data from the children’s conversations with the chatbot.
2. Related Works
Chatbots are computer programs that can interact with human users using natural language, thereby simulating coherent conversations (Abd-alrazaq et al., 2019; Group, [n. d.]). Chatbots tailored for healthcare allow clinicians to easily organize digital health records, retrieve patient data, and provide information on observed side effects and drug interactions (Xiao et al., 2020). Aside from assisting healthcare professionals, some are also designed for personal health monitoring and management (Bates, 2019).
2.1. Dialogue Processing and Management
As chatbots are involved in speech-based communication, they implement action selection methods in dialogue management to process input statements and return appropriate responses (Burgan, 2016; Laranjo et al., 2018), with healthcare chatbots typically employing medical entity recognition (Ghosh et al., 2018) and semantic similarity measures. Quro (Ghosh et al., 2018), a personalized healthcare assistant, uses medical entity recognition to extract symptoms from user input, where medical entities represent any medical concept (e.g., sign, symptom, disease, or drug), and detect a semantic relationship between the said entities.
Recently, semantic similarity measures for dialogue management have been adopted as an alternative to traditional pattern-matching approaches (Adel et al., 2020; Bhirud et al., 2019), removing the need to create scripting patterns, which may be time-consuming and error-prone. Adeh et al. (Adel et al., 2020) implemented an algorithm for measuring fuzzy sentence similarity that takes two phrases or short texts and provides a similarity measure of meaning between the two based on given syntactic and semantic elements. In comparison to an established similarity measure based on semantic networks and corpus statistics (Li et al., 2006), the use of fuzzy sentence similarity has been found to improve rule-matching, although it struggles in processing phrases with the word not since it causes the misfire of some rules, indicating that special considerations have to be made for words associated with negative meaning.
Fuzzy matching has been commonly used by healthcare chatbots to serve a range of purposes, from as simple as improving word recognition despite writing or typographical errors (Liu and Sundar, 2018), to working with webhooks and support vector machines to recognize medical entities, as with IBM Watson Assistant (Rahman et al., 2022).
2.2. Healthcare System Database Design
Healthcare systems manage large amounts of heterogeneous data. With the increase in digital healthcare data in particular, the volume and types of data become salient considerations. Dispersed pieces of information have to be collected from patients, prompting the need to extract and collate data into one repository (Carchiolo et al., 2015).
Data marts and warehouses can be helpful in this context, as they are repositories comprised of different data sources, all organized under a single schema for use in generating insights that aid in strategic decision-making (Sani et al., 2012; Silberschatz et al., 2020). Star schemas are often adopted in healthcare data management research (Appah and Amos, 2018; Narra et al., 2015; Taleb et al., 2021) due to their simplicity, leading to effective query handling, fast aggregations, as well as faster query execution times due to fewer join operations. As these schemas comprise a central fact table connected to multiple dimension tables, the resulting denormalization of dimension tables introduces redundancy and, consequently, increased storage requirements (Oliva and Felipe, 2018).
However, this is outweighed by the relatively lower cost of storage (Narra et al., 2015) and users’ preference for faster query operations across large volumes of data (Appah and Amos, 2018; Johnson and Jones, 2008). These characteristics make star schema a logical design choice for more efficient execution of OLAP operations (Taleb et al., 2021).
2.3. Healthcare Data Visualization
Data visualization is a method of presenting information using visual encodings of quantitative data (Yang, 2020), enabling decision-makers to interpret results and identify patterns more easily. As such, visualizations are widely used to deliver scientific information, including health data, to both professional and general audiences.
With the large variety of available data visualizations, several works have looked into the format preferences of target audiences upon being presented with health-related data. Fortin et al. (Fortin et al., 2001) investigated women’s visualization preferences to present the risk of heart disease, hip fracture, and breast cancer in women. They found that most respondents preferred simple bar charts to other traditional data visualizations.
Similarly, Dolan and Iadarola (Dolan and Iadarola, 2008) investigated six types of visualizations for presenting information on cancer and its prevention: augmented bar charts, icon arrays, flowcharts, and three other separate combinations of the aforementioned visualizations. It was found that, while bar charts and flowcharts were the preferred formats, presenting a combination of data visualization types is preferable to presenting a single standalone visualization.
The development of more creative and sophisticated data presentation formats has also prompted studies to look into the effect of interactivity on the understandability of visualizations, although studies that focus specifically on presenting healthcare-related data are limited (Yang, 2020). Ancker, Chan, and Kukafka (Ancker et al., 2009) assessed the usability of interactive graphs using icon arrays to display risk information. Their results indicated that the interactive graphs have the potential to present the magnitude of risk, as well as the feeling associated with it. This is in consonance with studies positing that high levels of interactivity in computer-mediated communication may positively influence users’ processing of information, attitude towards health, and emotional investment in health-related messages (Yang, 2020).
3. Design and Implementation
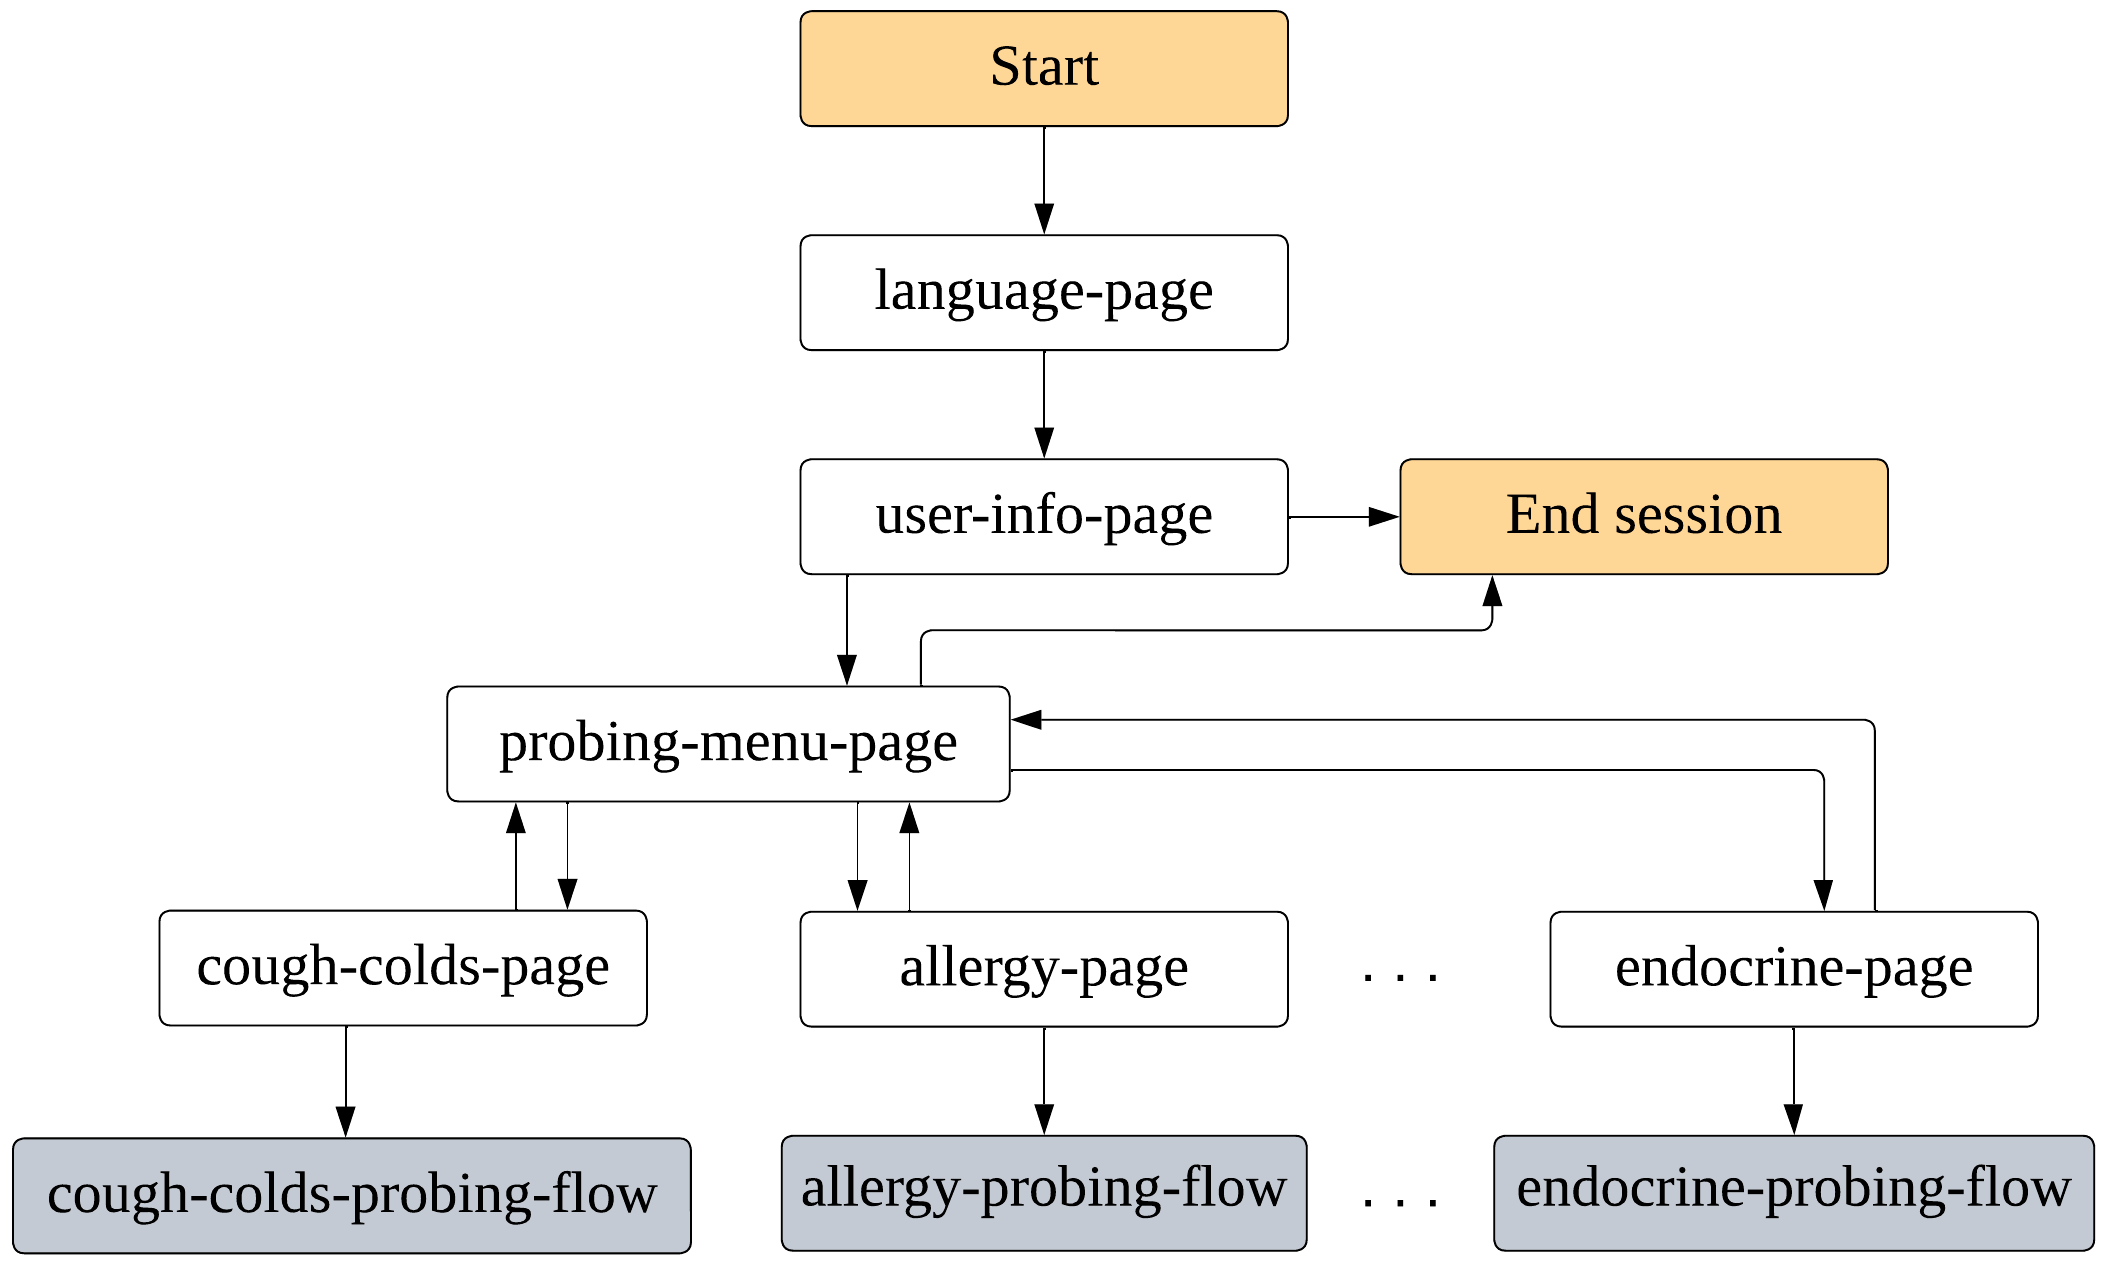
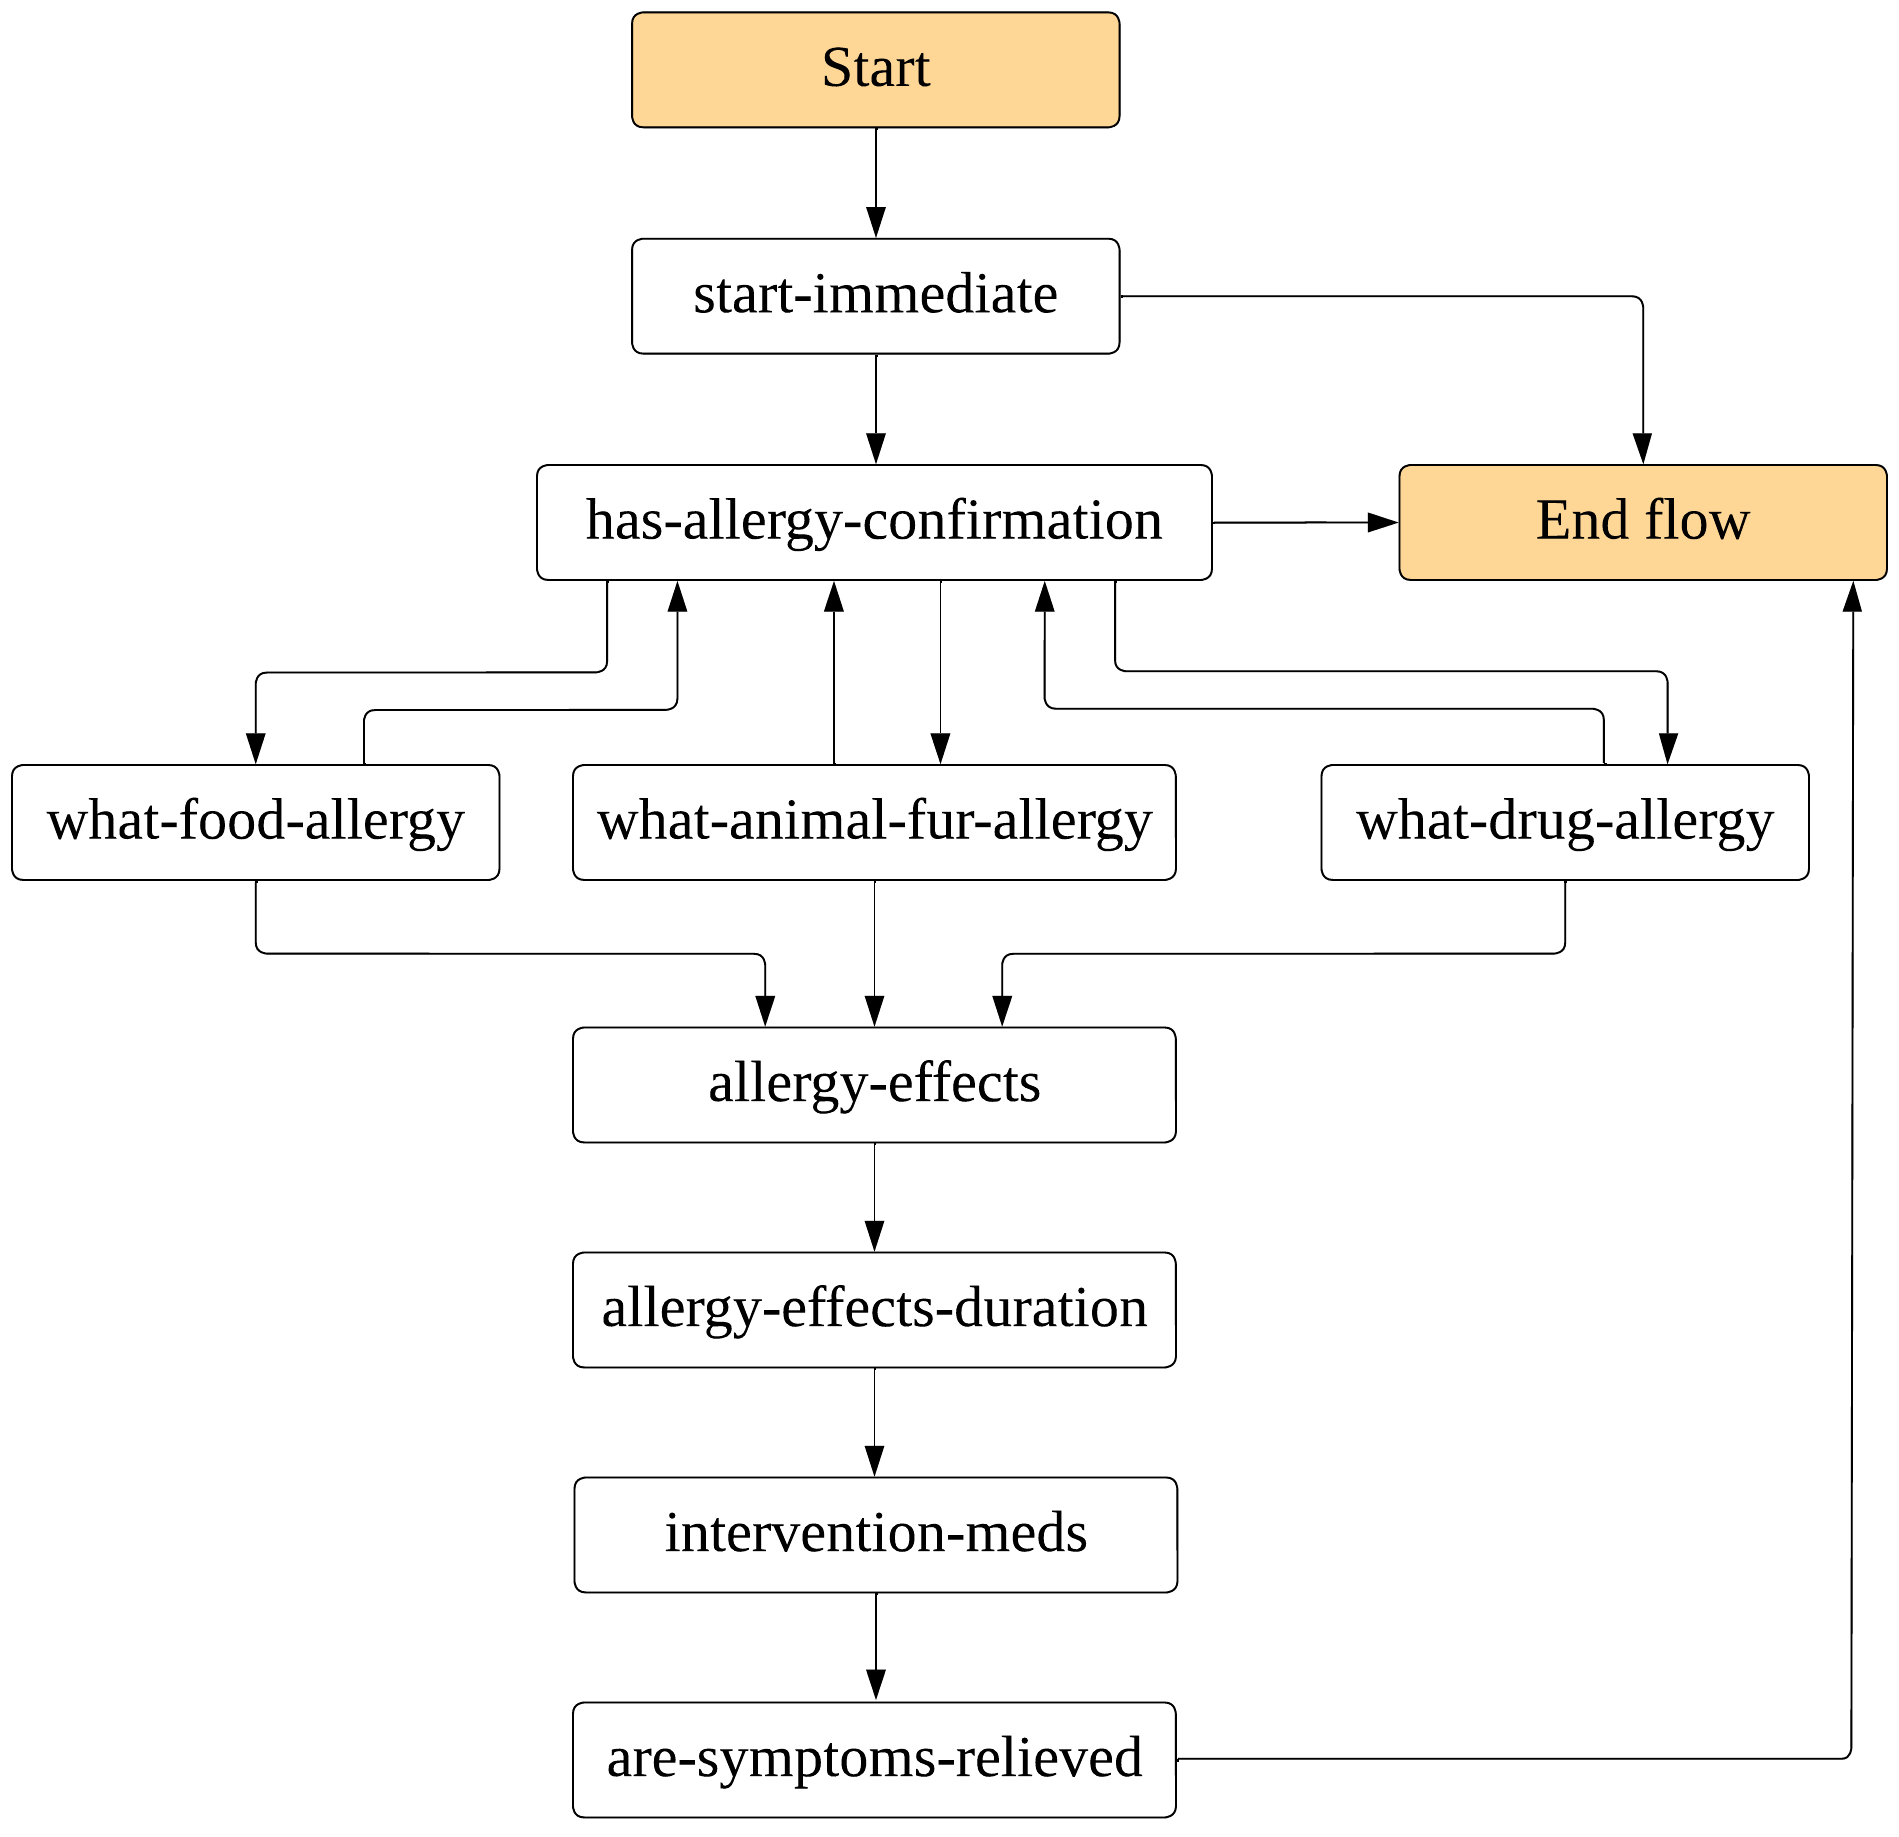
The chatbot was created using DialogFlowCX (Google, 2022c), a cloud-based service launched by Google in 2021 for designing conversational agents. Figure 1 illustrates the modularization of the conversation flow into smaller conversation flows corresponding to the sections of an adapted version of the Pediatric Review of Systems by Heartland Community Health Center (Center, [n. d.]). Each of these smaller conversation flows is, in turn, composed of several connected pages containing questions patterned after the Pediatric Review of Systems; an example is illustrated in Figure 2 for probing allergy symptoms.
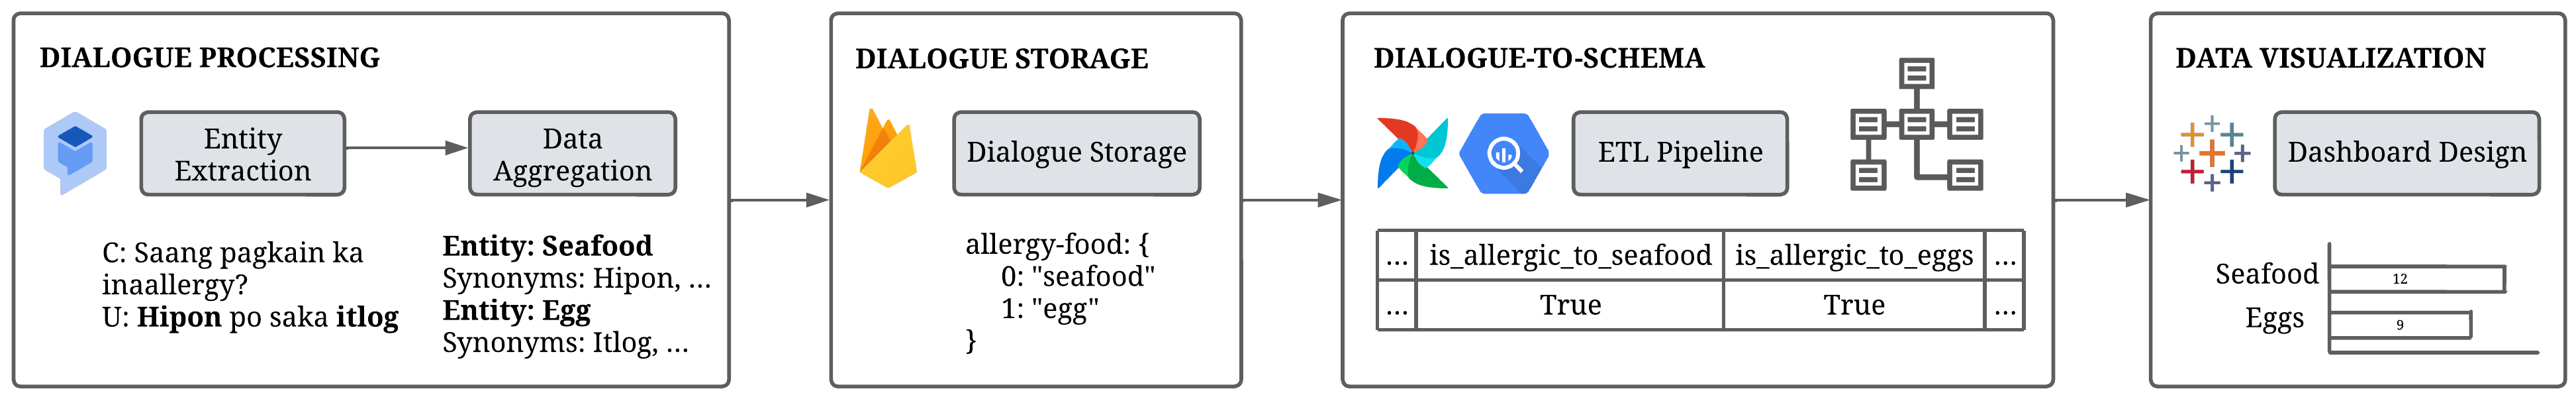
The remainder of this section presents each of the stages in the process of transforming unstructured dialogues with this chatbot into a structured schema for data visualization. Figure 3 presents the block diagram, from processing and storing the dialogues to transforming them into a data mart schema and finally creating a dashboard for data visualization.
3.1. Dialogue Processing
The first stage in the process is processing the dialogues. Since the bot-child conversations include open-ended questions (e.g., Saang pagkain ka inaallergy?), it is imperative to take the expressiveness of natural language input into account.
3.1.1. Expressiveness of Natural Language
The dialogue processing component should be capable of supporting two fundamental natural language understanding (NLU) functions: entity extraction and data aggregation. Entity extraction involves the recognition of keywords or phrases from the child’s utterance in the context of their intent. A sample conversation between the chatbot and the child is given in Listing 1; the entities are in bold.
Data aggregation involves grouping distinct words or phrases that are considered equivalent in the context of the conversation and assigning a single reference value for them. Table 1 enumerates examples of categories of word relationships that have to be subjected to aggregation; the reference value for each group of words is in bold.
| Relationship | Words |
|---|---|
| Orthographic Variations | tiyan, tyan |
| Misspellings | penicillin, penicilin, penisilin |
| Inflections | egg, eggs |
| Synonyms | yes, yeah, yep, of course |
| Hypernyms/Hyponyms | seafood, crab, mussels, shellfish |
| Named Entities | vitamins, Tiki Tiki, Poten-Cee |
| Translations | abrasion, gasgas |
|
Elliptical Phrases
(Context: Age) |
3, 3 year old, 3 years old |
|
Contextual Synonyms
(Context: Urine color) |
clear, no color, white |
3.1.2. Answer Integrator
To perform entity extraction and data aggregation, an answer integrator was developed using the Entities feature (Google, 2022d) built into DialogFlowCX. A list of entity entries and equivalent words (termed entity synonyms in DialogFlowCX) for each entity type was manually constructed to cover the word relationships in Table 1. Table 2 provides an example for the entity type about food allergies, which include reference values such as nuts, dairy, egg, and seafood.
| Reference Value | Selected Entity Synonyms |
|---|---|
| nuts | nuts, peanut, mani |
| dairy | dairy, cheese, yogurt, ice cream, milk, keso, queso, gatas |
| egg | egg, itlog |
| seafood | seafood, crab, mussels, shellfish, shrimp, pagkaing dagat, alimago, tahong, hipon |
The entity entry and synonym lists were primarily based on the conversations recorded from 227 respondents aged 6 to 7 years old who underwent a pediatric review of systems facilitated by partner nurses. They were subsequently expanded by the nurses serving as domain experts.
The answer integrator performs fuzzy matching with the entity entries to extract the entities from the child’s utterance. To this end, the fuzzy matching functionality (Google, 2022e) of DialogFlowCX is invoked. Data aggregation is then performed by mapping the extracted entities to their reference values. If the fuzzy matching returns an empty set, a sys.no-match-default event is triggered, and the chatbot reprompts the child.
As similarly demonstrated in the work of Liu and Sundar (Liu and Sundar, 2018), and in HealthConsultantBot (Rahman et al., 2022), the advantage of employing fuzzy matching over exact or regular expression-based matching is that misspellings, orthographic variations, and inflections can be accommodated to an extent without the need to manually add them to the entity synonym set or create hard-coded regular expression patterns that may become unwieldy or inadequate as the chatbot’s complexity increases.
This approach is also capable of handling multiple-word entities, which is especially important since the typical Tagalog and Bisaya sentence structure places a pronoun subject between the negating particle and the verb. For example, hindi ko po alam and wala ko kabalo are fuzzily matched to hindi alam and wala kabalo, which both map to the reference value don’t know.
However, it may yield false matches for words with a small edit distance; for instance, hipon (shrimp) may be matched with sipon (colds) if the latter is already the closest approximate match from among the entities. To mitigate this, orthographically similar words that map to distinct reference values were manually added to the entity entry and synonym lists. Fuzzy matching was also turned off for responses that should match with exact values (e.g., usernames).
3.2. Dialogue Storage
The second stage in the process is saving each processed dialogue as a JSON document and storing it in a collection hosted in Cloud Firestore (Google, 2022b), a scalable NoSQL database that provides seamless integration with other Google Cloud Platform services (including DialogFlowCX). A field-value pair in this document corresponds to a question and the entity reference value capturing the child’s response as determined by the answer integrator.
Since a dialogue is essentially a series of questions and responses, modeling it as a NoSQL document composed of field-value pairs allows for a straightforward and flexible representation compared to the table-based approach of relational databases (Silberschatz et al., 2020). Moreover, some fields (e.g., food allergies and symptoms felt during an allergic reaction) should be capable of holding multiple values. While this is not an issue for JSON documents, support for multi-valued data types in relational databases varies depending on the database management system (DBMS) (Group, [n. d.]).
Table 3 shows the relevant field-value pairs in the document representation of the sample dialogue in Listing 1; fields storing the user and session information are also included. Since each document corresponds to a session with the chatbot, the document ID generated by Cloud Firestore also serves as the session ID.
| Field | Value |
|---|---|
| session_id | 123456789 |
| username | juan-dela-cruz |
| sex | M |
| data_privacy_consent | True |
| allergy_food | seafood, egg |
| allergy_animal_fur | None |
| allergy_felt | difficulty breathing, rashes |
| allergy_intervention | ointment |
3.3. Dialogue-to-Schema Transformation
The third stage in the process is transforming the stored dialogues into a structured data mart schema for OLAP. In order to take advantage of the suitability of relational databases and the expressive power of SQL for executing OLAP operations, a star schema and an ETL pipeline were designed.
3.3.1. Star Schema Design
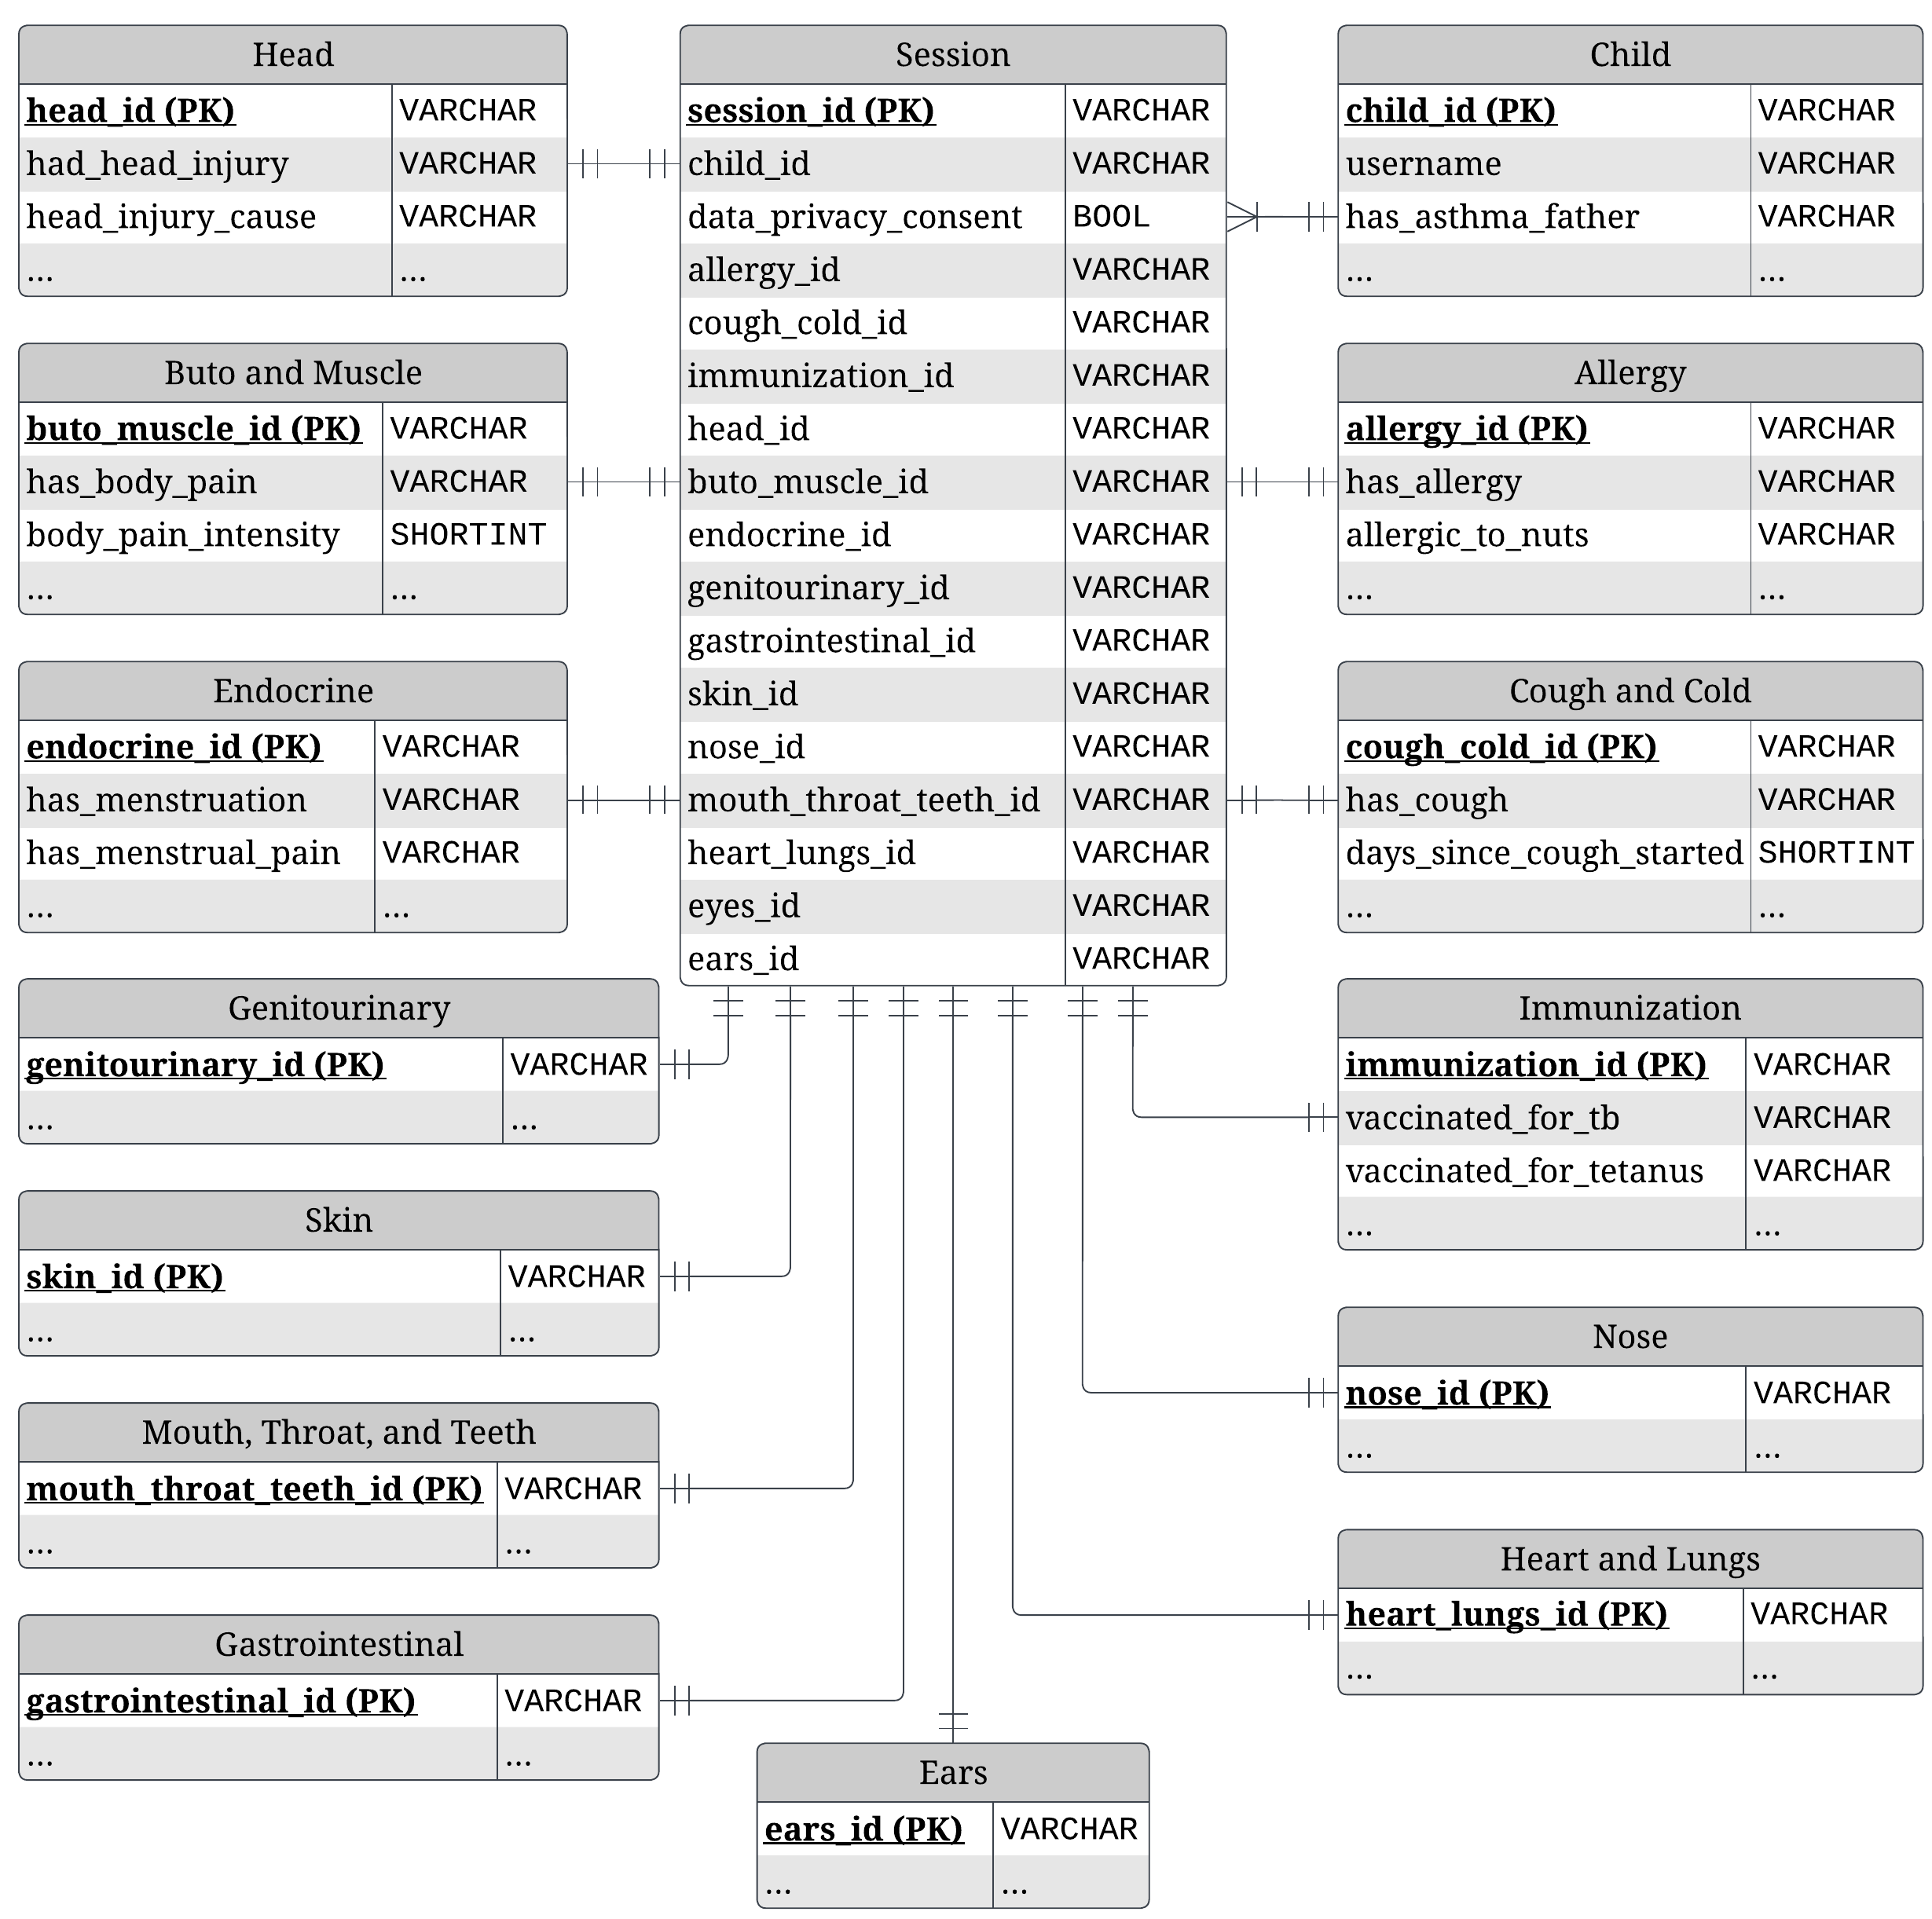
The database design follows a star schema. As shown in the entity relationship diagram in Figure 4, it consists of (i) one fact table storing the session ID and the keys connecting it to the dimension tables and (ii) 14 dimension tables corresponding to the sections in the adapted Pediatric Review of Systems. The primary key of the fact table is the session ID, while the primary key of each dimension table is a surrogate key generated during row insertion.
The advantage of following a star schema is that dimension tables are denormalized, resulting in fewer tables (Johnson and Jones, 2008). Consequently, the number of join statements needed to perform OLAP operations is reduced, simplifying queries and speeding up their execution (Silberschatz et al., 2020). Due to these benefits, the star schema is implemented in several healthcare systems, as the database design makes the management of large amounts of heterogeneous data easier (Appah and Amos, 2018; Narra et al., 2015; Oliva and Felipe, 2018).
An important database design consideration is accommodating fields with multiple values. The approach taken in this schema is to split these values into multiple columns, which is possible since the answer integrator module (Section 3.1.2) enumerates all the entity reference values recognized by the chatbot. For illustration, Table 4 shows some of the relevant tables and fields (columns) in the transformation of the document in Table 3 following this schema; since the child and allergy information are stored in separate tables, surrogate keys (namely child_id and allergy_id) are assigned.
| Field (Column) | Value |
|---|---|
| Session Table | |
| session_id | 123456789 |
| child_id | 424242424 |
| allergy_id | 787878787 |
| … | … |
| Child Table | |
| child_id | 424242424 |
| username | juan-dela-cruz |
| … | … |
| Allergy Table | |
| allergy_id | 787878787 |
| allergic_to_nuts | no |
| allergic_to_eggs | yes |
| allergic_to_seafood | yes |
| … | … |
| felt_difficulty_breathing | yes |
| felt_rashes | yes |
| … | … |
| intervention_applied_ointment | yes |
| intervention_away_from_allergens | no |
| … | … |
While this approach entails adding a new column to the schema for every addition to the list of entity reference values, this was considered acceptable in the context of this project since the entity reference values (e.g., common food allergies and allergic reaction symptoms in medical literature or checklists (of Clinical Immunology and Allergy, [n. d.]; of Health Cordillera Center for Health Development, [n. d.])) are not expected to change frequently.
Alternative options that were considered include storing multiple values using a multi-valued data type or as a comma-separated string. However, the former will introduce an additional layer of complexity in case of migration, as support for multi-valued data types is DBMS-dependent (Group, [n. d.]). Meanwhile, the latter is regarded as an antipattern since a comma-separated string has to be parsed before summary statistics can be extracted, thus making queries for OLAP aggregation more complex and inefficient (Karwin and Antipatterns, 2010).
Designing a snowflake schema is another approach that was also considered. Although this offers scalability, it carries the overhead of creating two tables (i.e., a table to hold the possible values and a mapping table) for every multi-valued field. Enforcing this degree of normalization increases the number of join statements and, consequently, the execution time of OLAP queries (Silberschatz et al., 2020).
Finally, although storing each value in a separate row may be adopted as a possible denormalization strategy, it comes with the caveat that a dialogue with the healthcare chatbot includes several multiple-response questions, thereby resulting in high levels of redundancy and significantly increased storage requirements. These may pose a challenge for the integration of the chatbot into a nationwide health monitoring system.
3.3.2. ETL Pipeline
Following the star schema described in Section 3.3.1, a relational database was created and stored in BigQuery (Google, 2022a), a Google Cloud platform-as-a-service for data warehousing. An ETL pipeline was built for automating and scheduling the transfer of the processed dialogues in Cloud Firestore to the database in BigQuery. Figure 5 presents the high-level directed acyclic graph representing this pipeline as implemented in Apache Airflow (Apache, [n. d.]), a workflow management platform for data engineering.
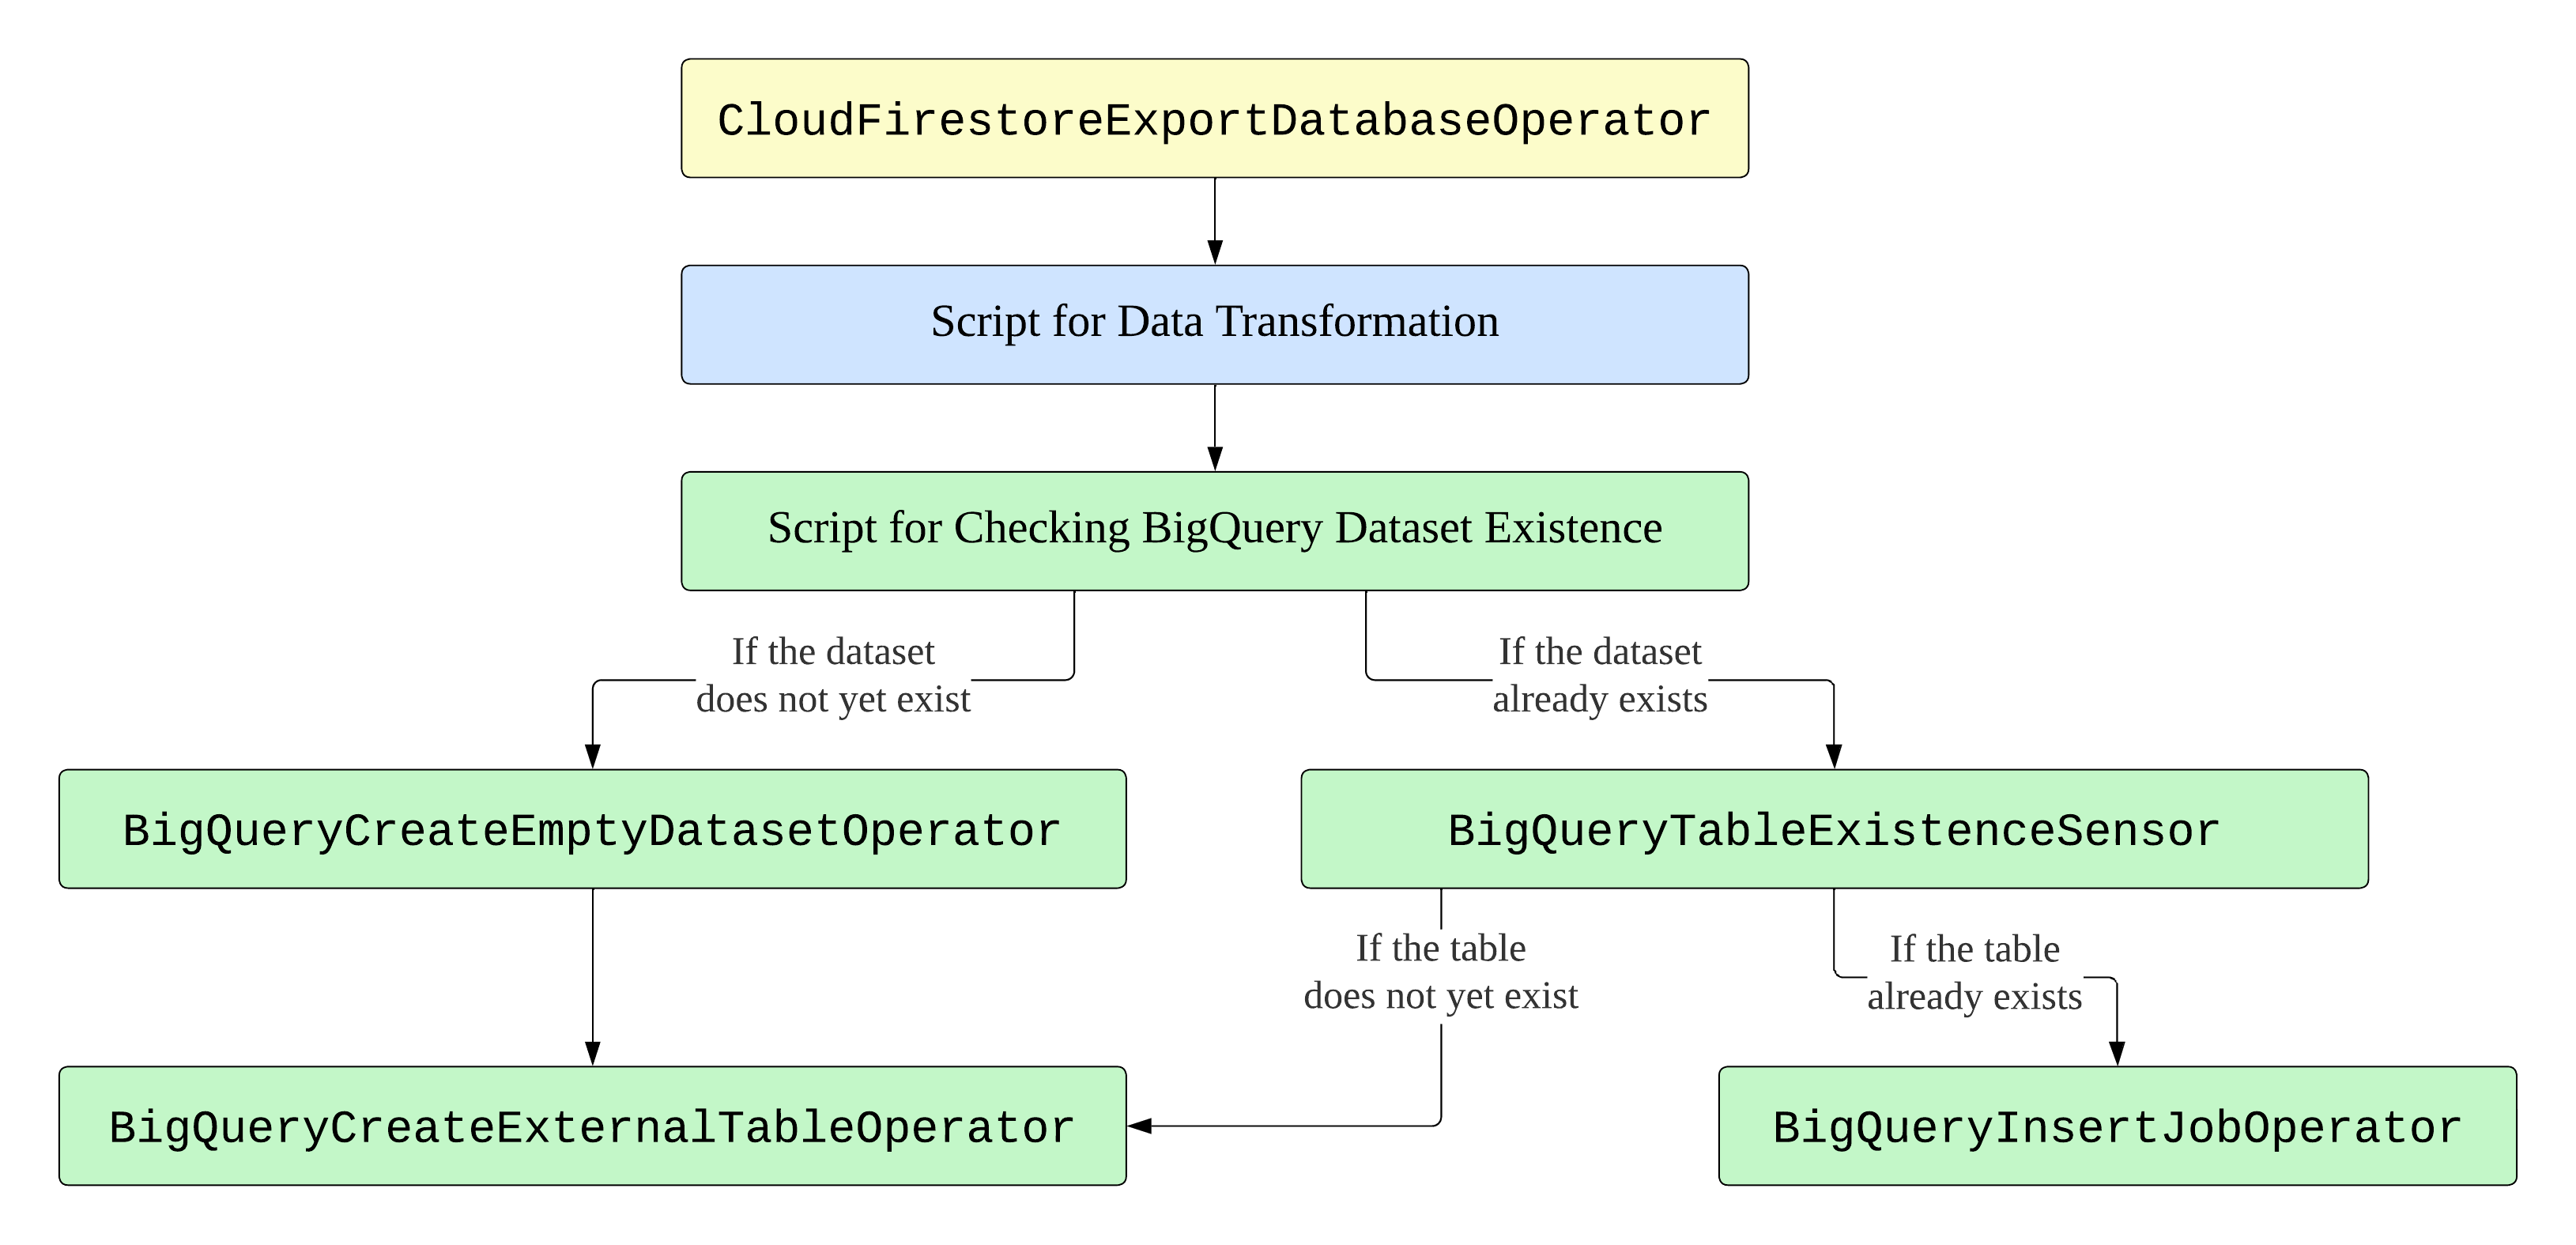
The script for the transformation stage has two primary functions. The first function maps the fields in the JSON document to their respective tables in the star schema. Its implementation is fairly straightforward since the prefix of the field names related to the review of systems is indicative of the pertinent table. The second function handles multi-valued fields and splits them into multiple fields following the logic discussed in Section 3.3.1.
3.4. Data Summary and Visualization
The final stage in the process is creating a web-based dashboard for summarizing and visualizing health data from the children’s conversations with the chatbot. This dashboard was created using the visual analytics platform Tableau. In order to fetch the data, a live connection between the BigQuery database and the dashboard was established using Tableau’s BigQuery driver.
3.4.1. Dashboard Design
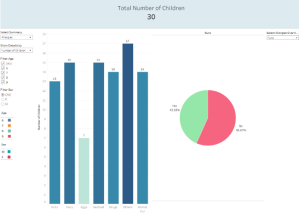
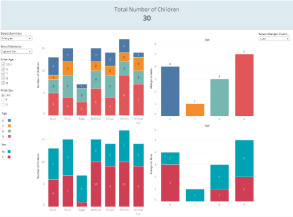
The dashboard consists of several charts corresponding to questions of interest in the adapted Pediatric Review of Systems. The design is intended to enable interactive and intuitive support for multiple OLAP operations. As such, it follows an underlying data hierarchy to allow users to change the granularity, i.e., perform roll-up and drill-down by demographic information (namely age and sex), as shown in Figure 6.
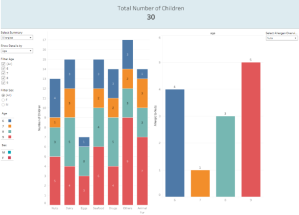
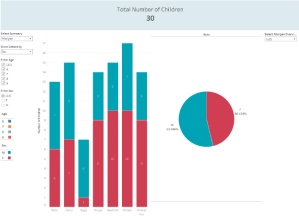
It also permits slicing and dicing by providing an option for users to dynamically filter the data based on demographic information and response, as shown in Figure 7. A dashboard with dynamic filters was used not only for compiling all the charts into one setting but also for presenting combinations of charts and adding interactivity. This ties to the intention of providing users with presentation flexibility, thus allowing them to understand the given health data more easily and positively facilitating their processing of the information (Yang, 2020).
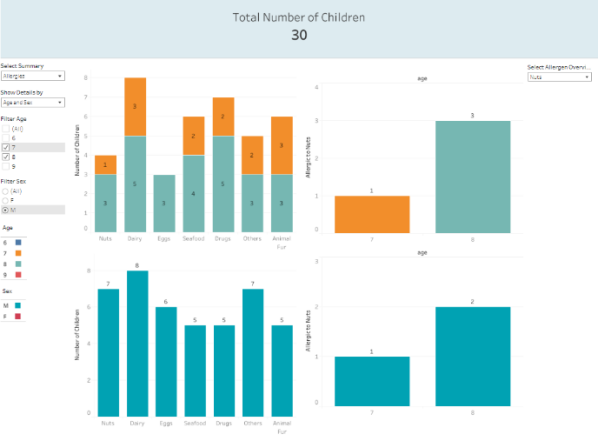
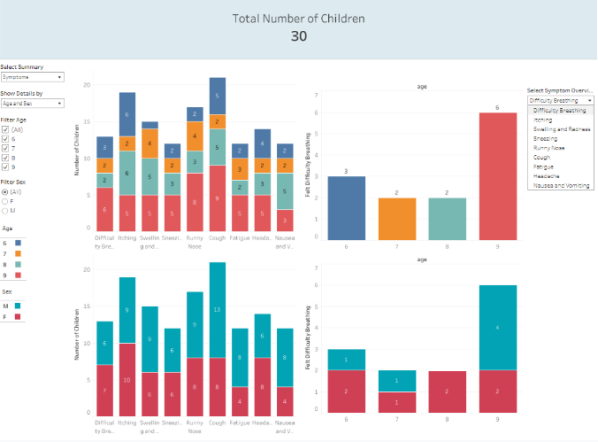
In line with the common guidelines of public health dashboard design as mentioned in the work of Lechner and Fruhling (Lechner and Fruhling, 2014), the dynamic filters also allow viewers to use a drill-down functionality to show more detailed visualizations from a more general summary, and present comparisons of data based on age and sex.
The data visualization consists primarily of three types of charts: (i) pie charts for queries that admit only a single response (e.g., comparing the number of children who are allergic to nuts versus those who are not), (ii) bar charts for those that admit multiple responses (e.g., comparing the number of children across each of the common allergies), and (iii) stacked bar charts for drill-down queries (e.g., comparing the number of children across each of the common allergies and zeroing in on their age as well).
3.4.2. Performance Evaluation
The performance of the dashboard was evaluated by measuring the loading time of different views. The tests were conducted on a machine with an AMD RyzenTM 7 5800H octa-core processor (3.20 GHz processor base frequency), 16.0 GB memory, 475 GB hard disk drive, and Microsoft Windows 10 (64-bit) operating system. To discard the effects of confounding variables, such as Internet connectivity and bandwidth, all the tests were conducted on the desktop version of Tableau, and the data were fetched from a live MySQL server hosted locally.
Aside from the initial loading time, the loading times of selected OLAP operations were also measured to provide a picture of the performance under varying numbers of stored sessions (dialogues) with the chatbot. The selected operations are as follows: (i) roll-up, (ii) one-level drill-down (by age), (iii) two-level drill-down (by age then sex), (iv) single filter (by response), and (v) double filter (by age and sex). Table 5 presents the results averaged over five trials.
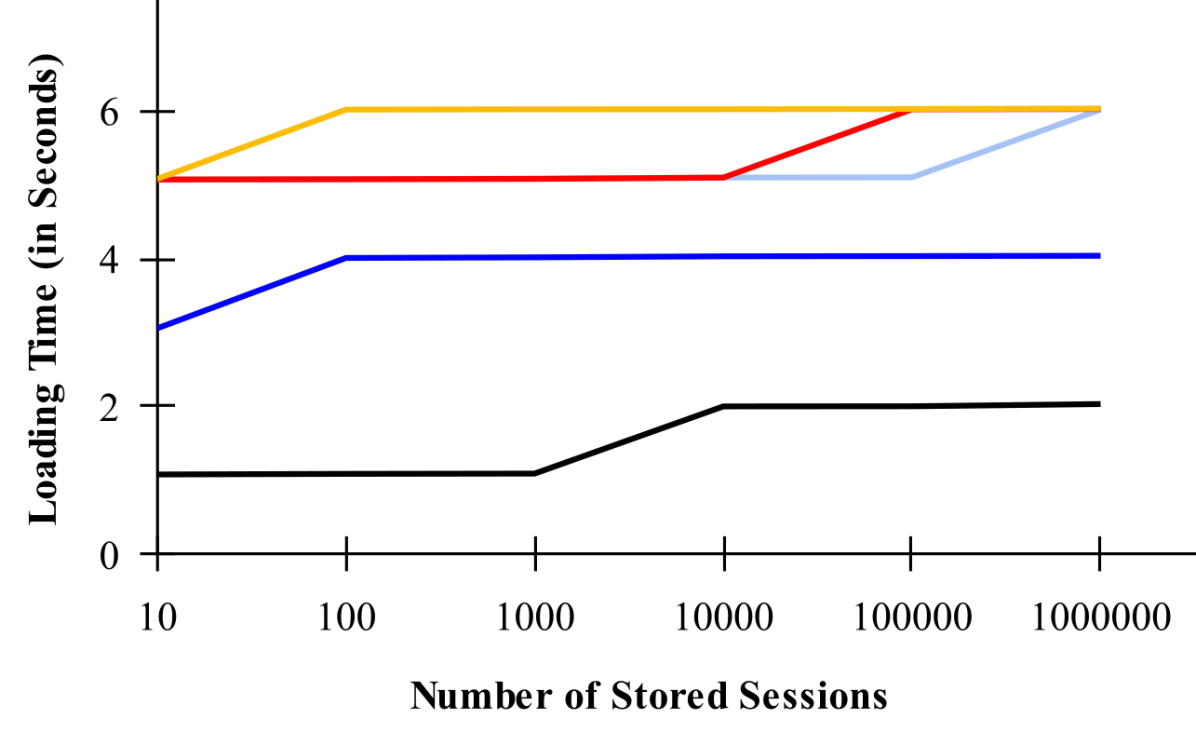
The initial loading time includes fetching data from the server, joining the tables, caching the data, and generating the first user-facing charts. Since a bulk of this time is spent communicating with the server and preparing the data for interactive actions, the design of the logical schema (Section 3.3.1) is critical in this regard. Moreover, as seen in Figure 8, an increase in the number of stored entries by a factor of increases the loading time for the display of roll-up, drill-down, and filter results by around only one second.
| Num. of Stored | Initial Loading | Roll-Up | Drill-Down | Drill-Down | Filter | Filter |
|---|---|---|---|---|---|---|
| Sessions | By Age | By Age then Sex | By Response | By Age and Sex | ||
| 10 | 16.089 | 5.063 | 5.068 | 5.076 | 1.080 | 3.056 |
| 100 | 17.031 | 5.070 | 5.071 | 6.012 | 1.088 | 4.007 |
| 1000 | 17.065 | 5.080 | 5.076 | 6.016 | 1.092 | 4.015 |
| 10000 | 21.082 | 5.094 | 5.093 | 6.017 | 2.000 | 4.029 |
| 100000 | 23.032 | 5.096 | 6.016 | 6.020 | 2.002 | 4.032 |
| 1000000 | 331.044 | 6.013 | 6.020 | 6.026 | 2.032 | 4.036 |
Reducing the overhead in the display of the results of these OLAP operations involves a trade-off between data caching and data freshness. This dashboard employs Tableau’s built-in drill-down, roll-up, and drill-down features, which operate on cached data instead of the more computationally expensive approach of communicating with the server for every OLAP query. These cached data are updated periodically, with the default being hours (Salesforce, [n. d.]). This trade-off was considered acceptable in the context of this project since the goal is to aggregate data over a period of time as opposed to generating real-time analytical reports.
4. Conclusion
Deriving insights from raw conversations necessitates taking into account the expressiveness of natural language and database considerations. This paper presented a four-stage process for transforming unstructured dialogues into a structured data mart schema for visualization. First, the dialogues are processed by performing entity extraction and data aggregation using DialogFlowCX. Afterwards, the processed dialogues are stored as documents in Cloud Firestore. They are then transformed into a star schema for OLAP, with the relational database stored in BigQuery, and an ETL workflow built with Apache Airflow. Finally, an interactive web-based visualization for summarizing the data from conversations with the chatbot provides insights for health analytics.
Evaluating the performance of this dashboard showed that increasing the number of stored sessions (dialogues) with the chatbot by a factor of increased the loading time for the display of roll-up, drill-down, and filter results by around only one second. The analytics provided by this visualization may serve as a source of information on common sicknesses, symptoms, and health complaints of public school students in the Philippines. These present valuable insights for healthcare professionals, as well as those in charge of medical budgeting and intervention planning.
Future directions include improving the answer integrator module by expanding the entity synonym list with ontology-driven dictionaries and exploring multilingual word embeddings, as well as validating the current group of keywords and entity synonyms with domain experts. Usability tests may also be conducted as a basis to improve the design and interactivity of subsequent iterations of the visualization dashboard.
Acknowledgements.
This work is part of a project funded by the Department of Science and Technology – Philippine Council for Industry, Energy, and Emerging Technology Research and Development (DOST-PCIEERD).References
- (1)
- Abd-alrazaq et al. (2019) Alaa A. Abd-alrazaq, Mohannad Alajlani, Ali Abdallah Alalwan, Bridgette M. Bewick, Peter Gardner, and Mowafa Househ. 2019. An overview of the features of chatbots in mental health: A scoping review. International Journal of Medical Informatics 132 (2019), 103978.
- Adel et al. (2020) Naeemeh Adel, Keeley Crockett, David Chandran, and Joao P. Carvalho. 2020. Interpreting Human Responses in Dialogue Systems using Fuzzy Semantic Similarity Measures. In 2020 IEEE International Conference on Fuzzy Systems (FUZZ-IEEE). 1–8. https://doi.org/10.1109/FUZZ48607.2020.9177605
- Ancker et al. (2009) Jessica S. Ancker, Connie Chan, and Rita Kukafka. 2009. Interactive Graphics for Expressing Health Risks: Development and Qualitative Evaluation. Journal of Health Communication 14, 5 (2009), 461–475. PMID: 19657926.
- Antonio et al. (2016) Carl Abelardo T Antonio, Ivy D Patdu, and Alvin B Marcelo. 2016. Health information privacy in the Philippines: trends and challenges in policy and practice. Acta Medica Philippina 50, 4 (2016).
- Apache ([n. d.]) Apache. [n. d.]. Apache Airflow. https://airflow.apache.org/
- Appah and Amos (2018) Bremang Appah and David Amos. 2018. Multidimensional Data Model for Health Service Decision Making Data. International Journal of Computer Science Engineering Techniques 3, 3 (2018), 1–6.
- Bates (2019) Mary Bates. 2019. Health Care Chatbots Are Here to Help. IEEE Pulse 10, 3 (2019), 12–14. https://doi.org/10.1109/MPULS.2019.2911816
- Bhirud et al. (2019) Nivedita Bhirud, Subhash Tataale, Sayali Randive, and Shubham Nahar. 2019. A literature review on chatbots in healthcare domain. International Journal of Scientific & Technology Research 8, 7 (2019), 225–231.
- Burgan (2016) Deeno Burgan. 2016. Dialogue systems and dialogue management. Technical Report. DST Group Edinburgh Edinburgh SA Australia.
- Carchiolo et al. (2015) Vincenza Carchiolo, Alessandro Longheu, Michele Malgeri, and Giuseppe Mangioni. 2015. Multisource agent-based healthcare data gathering. In 2015 Federated Conference on Computer Science and Information Systems (FedCSIS). 1723–1729.
- Center ([n. d.]) Heartland Community Health Center. [n. d.]. Pediatric Review of Systems (10 Years and Under). https://heartlandhealth.org/wp-content/uploads/2012/06/Review-of-Systems-10-and-Under-2.14.17.pdf
- Dolan and Iadarola (2008) James G Dolan and Stephen Iadarola. 2008. Risk communication formats for low probability events: an exploratory study of patient preferences. BMC medical informatics and decision making 8 (April 2008), 14.
- Fortin et al. (2001) JM Fortin, LK Hirota, BE Bond, AM O’Connor, and NF Col. 2001. Identifying patient preferences for communicating risk estimates: a descriptive pilot study. BMC medical informatics and decision making 1 (2001), 2.
- Ghosh et al. (2018) Shameek Ghosh, Sammi Bhatia, and Abhi Bhatia. 2018. Quro: Facilitating User Symptom Check Using a Personalised Chatbot-Oriented Dialogue System. Studies in Health Technology and Informatics 252 (2018), 51—56.
- Google (2022a) Google. 2022a. BigQuery. https://cloud.google.com/bigquery/docs/introduction
- Google (2022b) Google. 2022b. Cloud Firestore. https://firebase.google.com/docs/firestore
- Google (2022c) Google. 2022c. DialogFlowCX. https://cloud.google.com/dialogflow/cx/docs
- Google (2022d) Google. 2022d. Entities. https://cloud.google.com/dialogflow/cx/docs/concept/entity
- Google (2022e) Google. 2022e. Fuzzy Matching. https://cloud.google.com/dialogflow/cx/docs/concept/entity-fuzzy
- Group ([n. d.]) PostgreSQL Global Development Group. [n. d.]. 8.15. Arrays. https://www.postgresql.org/docs/current/arrays.html
- Guadalquiver (2018) Nanette Guadalquiver. 2018. Free health services await 1.6M public school students in Region 6. https://www.pna.gov.ph/articles/1040126
- Johnson and Jones (2008) Eric Johnson and Joshua Jones. 2008. A developer’s guide to data modeling for SQL server: covering SQL server 2005 and 2008. Addison-Wesley Professional.
- Karwin and Antipatterns (2010) Bill Karwin and SQL Antipatterns. 2010. Avoiding the pitfalls of database programming. The Pragmatic Bookshelf (2010), 15–155.
- Laranjo et al. (2018) Liliana Laranjo, Adam G Dunn, Huong Ly Tong, Ahmet Baki Kocaballi, Jessica Chen, Rabia Bashir, Didi Surian, Blanca Gallego, Farah Magrabi, Annie Y S Lau, and Enrico Coiera. 2018. Conversational agents in healthcare: a systematic review. Journal of the American Medical Informatics Association 25, 9 (07 2018), 1248–1258.
- Lechner and Fruhling (2014) Bettina Lechner and Ann Fruhling. 2014. Towards Public Health Dashboard Design Guidelines. In HCI in Business, Fiona Fui-Hoon Nah (Ed.). Springer International Publishing, Cham, 49–59.
- Li et al. (2006) Y. Li, D. McLean, Z.A. Bandar, J.D. O’Shea, and K. Crockett. 2006. Sentence similarity based on semantic nets and corpus statistics. IEEE Transactions on Knowledge and Data Engineering 18, 8 (2006), 1138–1150.
- Liu and Sundar (2018) Bingjie Liu and S. Shyam Sundar. 2018. Should Machines Express Sympathy and Empathy? Experiments with a Health Advice Chatbot. Cyberpsychology, Behavior, and Social Networking 21, 10 (2018), 625–636. PMID: 30334655.
- Monse et al. (2013) Bella Monse, Habib Benzian, Ella Naliponguit, Vincente Belizario, Alexander Schratz, and Wim van Palenstein Helderman. 2013. The Fit for School Health Outcome Study - a longitudinal survey to assess health impacts of an integrated school health programme in the Philippines. BMC Public Health 13 (March 2013), 256. https://europepmc.org/articles/PMC3610233
- Narra et al. (2015) Lekha Narra, Tony Sahama, and Peta Stapleton. 2015. Clinical data warehousing: a business analytics approach for managing health data. In Proceedings of the 8th Australasian Workshop on Health Informatics and Knowledge Management [Conferences in Research and Practice in Information Technology (CRPIT), Volume 164], A Maeder and J Warren (Eds.). Australian Computer Society, Australia, 101–104.
- Nations ([n. d.]) United Nations. [n. d.]. 3. Ensure healthy lives and promote well-being for all at all ages. https://sdgs.un.org/goals/goal3
- of Clinical Immunology and Allergy ([n. d.]) Australian Society of Clinical Immunology and Allergy. [n. d.]. Allergic Rhinitis (Hay Fever) Checklist. http://www.allergy.org.au/images/stories/aer/infobulletins/pdf/ascia_allergic_rhinitis_checklist.pdf
- of Health Cordillera Center for Health Development ([n. d.]) Department of Health Cordillera Center for Health Development. [n. d.]. Food Allergies. https://caro.doh.gov.ph/food-allergies/
- of the Philippines (2019) Republic of the Philippines. 2019. Oplan Kalusugan sa DepEd One Health Week. https://www.deped.gov.ph/wp-content/uploads/2019/07/DM_s2019_083.pdf
- Oliva and Felipe (2018) Samuel Z. Oliva and Joaquim C. Felipe. 2018. Optimizing Public Healthcare Management Through a Data Warehousing Analytical Framework. IFAC-PapersOnLine 51, 27 (2018), 407–412. 10th IFAC Symposium on Biological and Medical Systems BMS 2018.
- Rahman et al. (2022) Asad Rahman, Madiha Liaqat, Ali Javeed, and Farman Hassan. 2022. Health Consultant Bot: Primary Health Care Monitoring Chatbot for Disease Prediction. (2022).
- Ruff et al. (2020) Ryan Richard Ruff, Bella Monse, Denise Duijster, Gina Santos Itchon, Ella Naliponguit, and Habib Benzian. 2020. Effectiveness of school-based strategies to prevent tooth decay in Filipino children: A cluster-randomized trial. Community Dentistry and Oral Epidemiology n/a, n/a (February 2020).
- Salesforce ([n. d.]) Salesforce. [n. d.]. Set a Data Freshness Policy. https://help.tableau.com/current/online/en-us/data_freshness_policy.htm
- Sani et al. (2012) Nor Fazlida Mohd Sani, Lilly Suriani Affendey, Rahmita Wirza O.K. Rahmat, Mohd. Hasan Selamat, Rabiah Abdul Kadir, and Mohd. Zamrin Dimon. 2012. Conceptual Database Design for Smart Medical Clinical System. In 2012 International Conference on Advanced Computer Science Applications and Technologies (ACSAT). 472–475. https://doi.org/10.1109/ACSAT.2012.41
- Silberschatz et al. (2020) Abraham Silberschatz, Henry F Korth, and S Sudarshan. 2020. Database System Concepts 7th ed.
- Taleb et al. (2021) Talib M. J. Al Taleb, Sami Hasan, and Yaqoob Yousif Mahd. 2021. On-line Analytical Processing (OLAP) Operation for Outpatient Healthcare. Iraqi Journal of Science (Jan. 2021), 225–231.
- Thomas (2009) Joseph Thomas. 2009. Medical records and issues in negligence. Indian Journal of Urology 25, 3 (July 2009), 384—388. https://europepmc.org/articles/PMC2779965
- Xiao et al. (2020) Ziang Xiao, Michelle X. Zhou, Q. Vera Liao, Gloria Mark, Changyan Chi, Wenxi Chen, and Huahai Yang. 2020. Tell Me About Yourself: Using an AI-Powered Chatbot to Conduct Conversational Surveys with Open-Ended Questions. ACM Trans. Comput.-Hum. Interact. 27, 3, Article 15 (June 2020), 37 pages.
- Yang (2020) Fan Yang. 2020. Data Visualization for Health and Risk Communication. John Wiley & Sons, Ltd, Chapter 13, 213–232.