Anisotropic–Isotropic Transition of Cages at the Glass Transition
Abstract
Characterizing the local structural evolution is an essential step in understanding the nature of glass transition. In this work, we probe the evolution of Voronoi cell geometry in simple glass models, and find that the individual particle cages deform anisotropically in supercooled liquid and isotropically in glass. We introduce an anisotropy parameter for each Voronoi cell, which mean value exhibits a sharp change at the mode-coupling glass transition . Moreover, a power law of packing fraction is discovered in the liquid regime with , in contrast to in the glass regime, where is the first peak position of structure factor, and is the space dimension. This power law is explained by the change of . The active motions in supercooled liquid are spatially correlated with long axes rather than short axes of Voronoi cells. In addition, the dynamic slowing down approaching the glass transition can be well characterized through a modified free volume model based on . These findings reveal that the nonagnostic structural parameter determines glassy dynamics and is effective in identifying the structure-dynamics correlations and the glass transition.
1 Introduction
Glasses or amorphous solids are produced by cooling [1] or densifying [2] liquids. As the glass transition is approached, dynamics slows down drastically without any noticeable structural change [3, 4]. The mode-coupling theory (MCT) [5, 6] or Vogel-Fulcher-Tamman law [1] predicts the drastic growth of relaxation time before the glass transition but do not provide structural features for the slowing down. Although experiments [7, 8, 9, 10, 11, 12] and simulations [13, 14, 15, 16, 17, 18, 19, 20] have made intensive efforts in searching for effective structural parameters in characterizing the glass transition, the structural mechanism of glass transition remains unclear. Whether glass transition has a structural origin or is purely dynamic remains controversial [1, 21].
Various parameters, such as two-point entropy [9, 22], soft spot from vibration modes [23], and neighboring structures from machine learning [24, 25], have been proposed to link local structures with dynamic slowing down, but these approaches are structural agnostic [9, 22] and lack intuitive structural features. Great efforts have been devoted to identify nonagnostic locally favored structures (LFSs) responsible for the dynamic slowing down. For instance, icosahedral [26, 21], crystalline [9, 12], and tetrahedral clusters [27, 19] have been found to correlate with the slow dynamics in different glass-forming liquids, but these structural signatures are system-dependent [28] and cannot distinguish glass structure from liquid because these motifs similarly exist in both liquid and glass regimes. In addition, structural indicators of icosahedra or tetrahedra [26, 21, 27, 19] are not applicable for 2D systems. Recently, a quantitative relation between structural order and slow glassy dynamics for both 2D and 3D systems has been constructed by measuring particle’s deviation from the reference cluster [17], but it is also order-agnostic without a prior knowledge of the preferred local structure [29]. Therefore, a structure parameter that can reveal the local structural changes in glass transition without the above limitations is needed.
Another topic in glass studies is the structural power law [30, 31]. For a -dimensional crystal, its mean atomic volume must satisfy the power law, , where is the lattice constant. is the first peak position of the structure factor , and is the packing fraction. Amorphous solids also follow the power law [30],
| (1) |
However, in many glasses [30, 32, 33, 31, 34, 35, 36], which gives rise to controversies on its mechanism. Recent studies showed that pressure (or equivalently, density) and composition changes lead to different power laws. Under pressure change, in glasses for particles with the same softness, but deviates from when the system is composed of hard and soft particles [35]. Link in the reciprocal space to certain structural change in real space is difficult because contains structures spanning broad length scales in real space. How the local deformations affect the power law in reciprocal space remains unclear. Moreover, whether the power law holds in liquid regime and how it changes at the glass transition have not been explored.
Each particle in a supercooled liquid is caged by its nearest neighboring particles [37]. The cage effect has been widely used to qualitatively explain the dynamical behaviors [38, 39] and plastic deformations [40, 41]. However, a direct link between cage structure and glass transition remains unavailable. The cage of each particle is described by its Voronoi cell [42] [Fig. 1(a)], which reflects the particle’s free volume not shared by its neighbors. Voronoi tessellation is usually applied to characterize the local packing of particles, which has been used to understand the jamming transition [43] and Boson peak [44] in amorphous solids. Here, we find that the cage anisotropy can effectively reveal the structure change at the glass transition.

2 Results
Methods
We perform molecular dynamics simulations [45] for binary Weeks–Chandler–Andersen (WCA) particles [46] and event-driven molecular dynamics simulations [47] for binary hard spheres (HSs) in both two (2D) and three dimensions (3D). Binary sized particles are used to avoid crystallization. Systems are investigated in the ensemble under periodic boundary conditions. 2D and 3D glassy systems have similar behavior and caging effects [48, 10, 49]. Hence, we focus on 2DWCA systems as examples with various diameter ratios and fractions of large spheres . The simulation details are provided in the Supplemental Material.
2.1 Cage anisotropy parameter
We use radical Voronoi tessellation [42] [Fig. 1(a)] rather than traditional Voronoi tessellation for binary systems to avoid the incorrect bisecting line cutting through a large sphere. The asymmetric shape of the Voronoi cell is characterized by a tensor [37, 50], , which integrates over the cell volume ; is the position vector relative to the particle’s center, and denotes a dyadic product. represents the shape of the Voronoi cell, and its principal axes are obtained by diagonalizing . The two orthogonal eigenvectors, and , represent the long and short axes of the cage, respectively [Fig. 1(a)]. Their ratio defines the cage anisotropy parameter
| (2) |
for an isotropic cage, and the deviation from 1 quantifies the elongation anisotropy of the cage. Similar parameters about the asymmetric elongation of the cage have been used to study soft colloidal glasses [37] and jamming transition in 3D HS systems [50]. However, the causal link between the anisotropy parameter and glass transition has rarely been explored. Figure 1(a) shows that points to its neighboring particles, whereas points to the gap between two neighbors. The uniform distribution of directions in Figs. 1(a) and (b) manifests the uniformity of the liquid.
2.2 Anisotropy and volume of cages at glass transition
As increases, free volumes around particles are squeezed, yielding more isotropic cages, that is, higher averaged . In Fig. 1(c), increases and reaches a plateau at for 2DWCA and 2DHS systems, demonstrating a structure change at their glass transitions. The increase in at in Fig. 1(c) shows that cages are compressed more along than direction, that is, the cage deformation is anisotropic, as illustrated in Fig. 1(e). In the liquid regime, is higher in 2DWCA than that in 2DHS system [Fig. 1(c)] because the softer WCA particles can adjust their positions more easily to form more homogenous structures with more isotropic cages. At , is comparable for 2DWCA and 2DHS systems because both WCA and HS particles interact via their hard cores at high . is approximately constant at [Fig. 1(c)], indicating that cages isotropically deform in glasses [Fig. 1(f)]. Similar behavior of is also observed in 3DWCA and 3DHS systems [Fig. 1(d)] and 2DWCA systems with different (Supplemental Fig. S1). is lower in 3D system than that in the 2D systems [Figs. 1(c) and 1(d)] because particles in the 3D system are more disordered and more difficult to adjust their positions due to stronger confinement from more neighboring particles.

The anisotropic-to-isotropic transition of cage deformation [Figs. 1(c) and 1(d)] is further verified by the Voronoi cell volume . Figure 2(a) shows that of large particles satisfies a log-normal distribution well at each ,
| (3) |
barely changes at in Fig. 2(a), implying isotropic shrinkages of cages, in accordance with Fig. 1(c). By contrast, the anisotropic deformations of cages at change , as shown in Fig. 2(a). The height and standard deviation of exhibit a clear change at [Figs. 2(b) and 2(c)], which is consistent with Fig. 1(c). of small particles shows the same transition at (Supplemental Fig. S2). The previous work scaled the distribution along the axis with the standard deviation [51] and did not report the transition shown in Fig. 2.
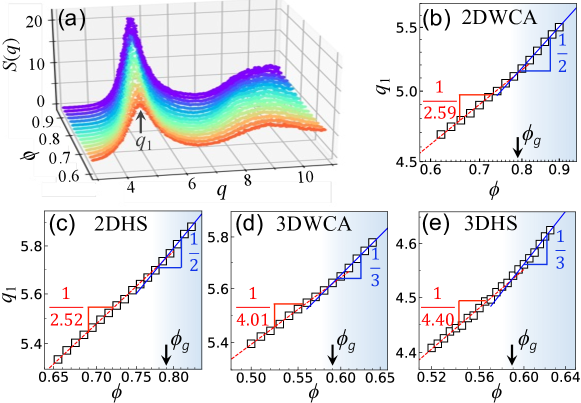
2.3 Structural power law
We generalize the power law Eq. (1) from glass [32, 34, 35] to liquid. in Eq. (1) is measured from the structure factor . As increases, the interparticle distance decreases, and increases [Fig. 3(a)]. For glasses composed of binary particles with the same softness, the compression is locally uniform, and thus [35]. Large and small spheres in 2DWCA systems have the same WCA potential, that is, the same softness, so the compression-induced deformation is spatially uniform [35]. Consequently, the exponent , which is confirmed in the glass regime at [Fig. 3(b)]. The power law still holds in the liquid regime, however, for 2DWCA. Such in the glass regime and in the liquid regime have also been observed in 2DHS [Fig. 3(c)], 3DWCA [Fig. 3(d)], 3DHS [Fig. 3(e)], and 2DWCA systems at different and (Supplemental Fig. S3). Thus, the coincidence between the glass transition and anisotropic–isotropic transition of cage deformation is robust.
deviating from has been observed in various metallic glasses under composition change [30, 36] or glasses composed of particles with different softness under pressure change [32, 35]. Such deviation manifests nonuniform deformations, but the type of deformation that can increase or decrease is unclear [32, 33]. Here, we find that in liquid [Figs. 3(b)–3(e)] arises from local anisotropic deformation [Fig. 1(e)] as follows. For a global density change, the compressed volume contributed from one anisotropic cage is equivalent to those from several isotropic cages because anisotropic cages usually have more free volumes than isotropic cages. Furthermore, a large concentrated at one place (i.e., one anisotropic cage) affects less on than multiple small spread in the sample (i.e., multiple isotropic cages). Therefore, the more anisotropic cages in liquid lower the slope of , that is, increase [Figs. 3(b)–3(e)]. Consequently, the transition between and [Figs. 3(b)–3(e)] corresponds to the anisotropic–isotropic transition of cages at the glass transition. Eq. (1) arises from the structure change rather than the structure at a certain ; thus, it is not related to any fractal structure in glass and can be greater than [36].
2.4 Structure-dynamics correlations
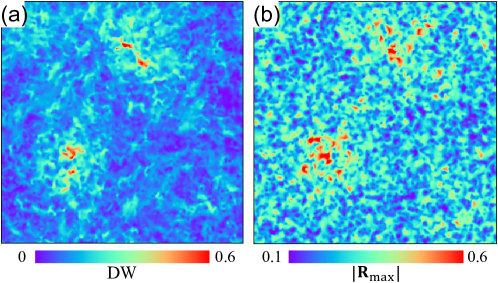
The dynamics of particle can be characterized by the Debby–Waller factor , where denotes the average over a time before cage breaking (Supplementary Information) [52], and is the average particle diameter. Particles with large DW factors (i.e., strong dynamics) in Fig. 4(a) are spatially localized and more correlated with the large- regions in Fig. 4(b), implying that particles tend to move along rather than (Supplemental Fig. S4). Therefore, reflects a particle’s dynamical propensity. This is reasonable because more free volume distributes along [Fig. 5(a)].
The structure relaxation time is measured as the decay time of the self-intermediate scattering function [Supplemental Fig. S5(a)]. can be fitted by the MCT relation [5, 1] with [Fig. 5(b)]. It coincides well with the structure transitions in Figs. 1(c), 2(b), 2(c), and 3(b), that is, . Considering that is linear in the supercooled liquids [Fig. 1(c)], the MCT relation can be rewritten as
| (4) |
In contrast to the classic MCT relation based on the global thermodynamic parameter (or ), Eq. (4) links the glassy dynamics to specific local structure at the single particle level in supercooled liquids. The fitted [Fig. 5(c)] is consistent with the measured in the glass regime [Fig. 1(c)]. We attribute the increasing dynamic slowing down in supercooled liquids to the increase in , that is, cages becoming more isotropic [Fig. 1(f)], which reduces the free volume and mobility of particles.
2.5 Free volume model
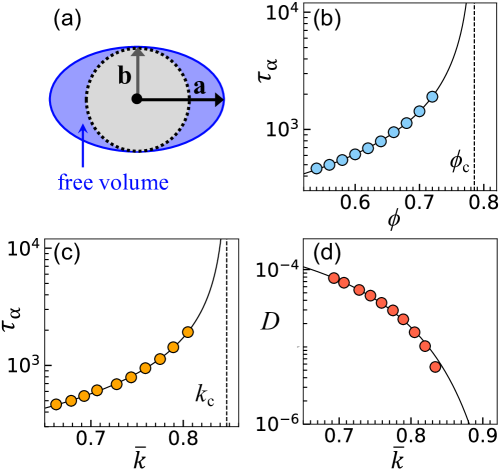
The free volume mode is one of the most widely used and simple theories for the glass transition [53, 1, 54], which attributes the dynamic slowing down to the decreased “free volume to move” for particles as increases [1]. If the free volume is known, then it can predict the average long-time diffusion constant of particles as , where is the reduced free volume. is the volume of a particle, and is the specific volume [53]. However, this model does not consider the packing structure [53], and is unavailable. Here, we suggest that can be evaluated on the basis on of the local cage. Considering that free volumes mainly locate along the long axis, the reduced free volume can be derived from our ellipse approximation of the cage, as shown in Fig. 5(a), with , that is, the blue region in Fig. 5(a). This result is robust for 3D spheroid approximation: . Substituting to [53] gives
| (5) |
is mainly used to estimate the free volume from the measured [53] because is not available directly. By contrast, Eq. (5) establishes a direct link between the diffusion and local structure, by which one can predict based on the geometric parameter .
The measured satisfies Eq. 5 well in Fig. 5(d), indicating that the anisotropy parameter can provide a single-particle form of the free volume model. To remove the influence of long-range Mermin–Wagner fluctuations in 2D [49] in the measurement of , we use the local coordinate for each particle’s position: Particle ’s position is relative to the mean position of its nearest neighbors [55, 10]. The cage-relative mean-square displacement (CR-MSD) is defined as [55, 10], where is the ensemble average. The long-time is measured from the slope of the CR-MSD at [Supplemental Fig. S5(b)].
3 Discussion
In this work, we propose a nonagnostic structure parameter with a simple geometrical meaning to characterize the cage anisotropy. exhibits different behavior in liquid and glass regimes, and the structural anisotropic–isotropic transition coincides with the dynamic MCT glass transition at . This is robust in both 2D and 3D systems [Figs. 1(c) and 1(d) and Supplementary Fig. S1], providing a structural signature at the MCT glass transition point. Moreover, we find an MCT-like relation Eq. (4) that links the dynamics to local structures at the single-particle level [Fig. 5(c)].
Two applications of are further studied: (1) The structural power law in glasses [30, 32, 33, 31, 34, 35] is generalized to the liquid regime with (Fig. 3). It is qualitatively explained by the free volume change associated with . (2) Substituting into the classical free-volume model yields Eq. (5), which can explain and predict the diffusion constant of from the structure at the particle scale [Eq. (5) and Fig. 5(d)]. reflects the local free volume. reflect a particle’s dynamical propensity, that is, particles tend to move along because more free volumes exist along this direction. Thus, and can connect to mechanical behaviors of glass, such as soft spot [56, 57] and shear transformation zone [58, 59]. Moreover, we expect that is also applicable in characterizing the crystallization [60, 61, 62, 63] and melting transitions [64], in which the local cages will change from anisotropic in liquids to isotropic in crystals.
4 ACKNOWLEDGEMENTS
This work was supported by the National Natural Science Foundation of China (No. 12274336), the Key R&D Project of Shaanxi Province (No. 2022GY-400), the Fundamental Research Funds for Central Universities (No. xxj032021001), Hong Kong Research Grants Council (No. CRF-C6016-20G and C6021-19EF), and the Guangdong Basic and Applied Basic Research Foundation (No. 2020B1515120067).
References
- [1] L. Berthier and G. Biroli. Theoretical perspective on the glass transition and amorphous materials. Rev. Mod. Phys., 83:587, 2011.
- [2] Giorgio Parisi and Francesco Zamponi. Mean-field theory of hard sphere glasses and jamming. Rev. Mod. Phys., 82:789, 2010.
- [3] Jeppe C Dyre. Colloquium: The glass transition and elastic models of glass-forming liquids. Rev. Mod. Phys., 78:953, 2006.
- [4] Kurt Binder and Walter Kob. Glassy materials and disordered solids: An introduction to their statistical mechanics. World scientific, 2011.
- [5] Wolfgang Götze. Complex dynamics of glass-forming liquids: A mode-coupling theory, volume 143. Oxford University Press on Demand, 2009.
- [6] Chengjie Luo, Joshua F Robinson, Ilian Pihlajamaa, Vincent E Debets, C Patrick Royall, and Liesbeth MC Janssen. Many-body correlations are non-negligible in both fragile and strong glassformers. Phys. Rev. Lett., 129:145501, 2022.
- [7] Tina Hecksher, Albena I Nielsen, Niels Boye Olsen, and Jeppe C Dyre. Little evidence for dynamic divergences in ultraviscous molecular liquids. Nat. Phys., 4(9):737, 2008.
- [8] Giovanni Brambilla, Djamel El Masri, Matteo Pierno, Ludovic Berthier, Luca Cipelletti, George Petekidis, and Andrew B Schofield. Probing the equilibrium dynamics of colloidal hard spheres above the mode-coupling glass transition. Phys. Rev. Lett., 102:085703, 2009.
- [9] Hajime Tanaka, Takeshi Kawasaki, Hiroshi Shintani, and Keiji Watanabe. Critical-like behaviour of glass-forming liquids. Nat. Mater., 9:324–331, 2010.
- [10] Skanda Vivek, Colm P Kelleher, Paul M Chaikin, and Eric R Weeks. Long-wavelength fluctuations and the glass transition in two dimensions and three dimensions. Proc. Natl. Acad. Sci. U.S.A., 114:1850–1855, 2017.
- [11] James E Hallett, Francesco Turci, and C Patrick Royall. Local structure in deeply supercooled liquids exhibits growing lengthscales and dynamical correlations. Nat. Commun., 9:3272, 2018.
- [12] Indrajit Tah, Shiladitya Sengupta, Srikanth Sastry, Chandan Dasgupta, and Smarajit Karmakar. Glass transition in supercooled liquids with medium-range crystalline order. Phys. Rev. Lett., 121:085703, 2018.
- [13] Walter Kob and Ludovic Berthier. Probing a liquid to glass transition in equilibrium. Phys. Rev. Lett., 110:245702, Jun 2013.
- [14] Giulio Biroli, Smarajit Karmakar, and Itamar Procaccia. Comparison of static length scales characterizing the glass transition. Phys. Rev. Lett., 111:165701, Oct 2013.
- [15] H. B. Yu, R. Richert, R. Maaß, and K. Samwer. Unified criterion for temperature-induced and strain-driven glass transitions in metallic glass. Phys. Rev. Lett., 115:135701, Sep 2015.
- [16] Andrea Ninarello, Ludovic Berthier, and Daniele Coslovich. Models and algorithms for the next generation of glass transition studies. Phys. Rev. X, 7:021039, Jun 2017.
- [17] H. Tong and H. Tanaka. Revealing hidden structural order controlling both fast and slow glassy dynamics in supercooled liquids. Phys. Rev. X, 8:011041, 2018.
- [18] Lijin Wang, Ning Xu, W. H. Wang, and Pengfei Guan. Revealing the link between structural relaxation and dynamic heterogeneity in glass-forming liquids. Phys. Rev. Lett., 120:125502, Mar 2018.
- [19] Susana Marín-Aguilar, Henricus H Wensink, Giuseppe Foffi, and Frank Smallenburg. Tetrahedrality dictates dynamics in hard sphere mixtures. Phys. Rev. Lett., 124:208005, 2020.
- [20] Ludovic Berthier and David R Reichman. Modern computational studies of the glass transition. Nat. Rev. Phys., 5:102–116, 2023.
- [21] C. P. Royall and S. R. Williams. The role of local structure in dynamical arrest. Phys. Rep., 560:1–75, 2015.
- [22] Zhongyu Zheng, Ran Ni, Yuren Wang, and Yilong Han. Translational and rotational critical-like behaviors in the glass transition of colloidal ellipsoid monolayers. Sci. Adv., 7:eabd1958, 2021.
- [23] Asaph Widmer-Cooper, Heidi Perry, Peter Harrowell, and David R Reichman. Irreversible reorganization in a supercooled liquid originates from localized soft modes. Nat. Phys., 4:711–715, 2008.
- [24] Samuel S Schoenholz, Ekin D Cubuk, Daniel M Sussman, Efthimios Kaxiras, and Andrea J Liu. A structural approach to relaxation in glassy liquids. Nat. Phys., 12:469–471, 2016.
- [25] Victor Bapst, Thomas Keck, A Grabska-Barwińska, Craig Donner, Ekin Dogus Cubuk, Samuel S Schoenholz, Annette Obika, Alexander WR Nelson, Trevor Back, Demis Hassabis, et al. Unveiling the predictive power of static structure in glassy systems. Nat. Phys., 16:448–454, 2020.
- [26] Frederick Charles Frank. Supercooling of liquids. Proc. R. Soc. Lond. A, 215:43–46, 1952.
- [27] Chengjie Xia, Jindong Li, Yixin Cao, Binquan Kou, Xianghui Xiao, Kamel Fezzaa, Tiqiao Xiao, and Yujie Wang. The structural origin of the hard-sphere glass transition in granular packing. Nat. Commun., 6:8409, 2015.
- [28] Glen M Hocky, Daniele Coslovich, Atsushi Ikeda, and David R Reichman. Correlation of local order with particle mobility in supercooled liquids is highly system dependent. Phys. Rev. Lett., 113:157801, 2014.
- [29] Hajime Tanaka, Hua Tong, Rui Shi, and John Russo. Revealing key structural features hidden in liquids and glasses. Nat. Rev. Phys., 1(5):333–348, 2019.
- [30] D. Ma, A. D. Stoica, and X.-L. Wang. Power-law scaling and fractal nature of medium-range order in metallic glasses. Nat. Mater., 8:30–34, 2009.
- [31] Q Zeng, Y Lin, Y Liu, Zhidan Zeng, Crystal Y. Shi, Bo Zhang, Hongbo Lou, Stanislav V. Sinogeikin, Yoshio Kono, Curtis Kenney-Benson, Changyong Park, Wenge Yang, Weihua Wang, Hongwei Sheng, H.-K. Mao, and Wendy L. Mao. General 2.5 power law of metallic glasses. Proc. Natl. Acad. Sci. U.S.A., 113:1714–1718, 2016.
- [32] Qiaoshi Zeng, Yoshio Kono, Yu Lin, Zhidan Zeng, Junyue Wang, Stanislav V. Sinogeikin, Changyong Park, Yue Meng, Wenge Yang, Ho-Kwang Mao, and Wendy L. Mao. Universal fractional noncubic power law for density of metallic glasses. Phys. Rev. Lett., 112:185502, May 2014.
- [33] David Z. Chen, Crystal Y. Shi, Qi An, Qiaoshi Zeng, Wendy L. Mao, William A. Goddard, and Julia R. Greer. Fractal atomic-level percolation in metallic glasses. Science, 349:1306–1310, 2015.
- [34] Chengjie Xia, Jindong Li, Binquan Kou, Yixin Cao, Zhifeng Li, Xianghui Xiao, Yanan Fu, Tiqiao Xiao, Liang Hong, Jie Zhang, et al. Origin of noncubic scaling law in disordered granular packing. Phys. Rev. Lett., 118:238002, 2017.
- [35] Huijun Zhang, Kaiyao Qiao, and Yilong Han. Power laws in pressure-induced structural change of glasses. Nat. Commun., 11:2005, 2020.
- [36] Huijun Zhang, Chengjie Luo, Zhongyu Zheng, and Yilong Han. Effects of size ratio on particle packing in binary glasses. Acta Mater., 246:118700, 2023.
- [37] C Mayer, E Zaccarelli, E Stiakakis, CN Likos, F Sciortino, A Munam, M Gauthier, Nikolaos Hadjichristidis, H Iatrou, P Tartaglia, et al. Asymmetric caging in soft colloidal mixtures. Nat. Mater., 7:780–784, 2008.
- [38] Eric R Weeks, John C Crocker, Andrew C Levitt, Andrew Schofield, and David A Weitz. Three-dimensional direct imaging of structural relaxation near the colloidal glass transition. Science, 287:627–631, 2000.
- [39] Pinaki Chaudhuri, Pablo I Hurtado, Ludovic Berthier, and Walter Kob. Relaxation dynamics in a transient network fluid with competing gel and glass phases. J. Chem. Phys., 142:174503, 2015.
- [40] Marco Laurati, Philipp Maßhoff, Kevin J Mutch, Stefan U Egelhaaf, and Alessio Zaccone. Long-lived neighbors determine the rheological response of glasses. Phys. Rev. Lett., 118:018002, 2017.
- [41] Hai-Bin Yu, Meng-Hao Yang, Yang Sun, Feng Zhang, Jian-Bo Liu, Cai-Zhuang Wang, Kai-Ming Ho, Ranko Richert, and Konrad Samwer. Fundamental link between relaxation, excess wings, and cage-breaking in metallic glasses. J. Phys. Chem. Lett., 9:5877–5883, 2018.
- [42] Chris Rycroft. Voro++: A three-dimensional Voronoi cell library in C++. Chaos, 19:041111, 2009.
- [43] Jennifer M. Rieser, Carl P. Goodrich, Andrea J. Liu, and Douglas J. Durian. Divergence of voronoi cell anisotropy vector: A threshold-free characterization of local structure in amorphous materials. Phys. Rev. Lett., 116:088001, Feb 2016.
- [44] J. Yang, Yun-Jiang Wang, E. Ma, A. Zaccone, L. H. Dai, and M. Q. Jiang. Structural parameter of orientational order to predict the boson vibrational anomaly in glasses. Phys. Rev. Lett., 122:015501, Jan 2019.
- [45] S. Plimpton. Fast parallel algorithms for short-range molecular dynamics. J. Comput. Phys., 117:1–19, 1995.
- [46] John D Weeks, David Chandler, and Hans C Andersen. Role of repulsive forces in determining the equilibrium structure of simple liquids. J. Chem. Phys., 54:5237–5247, 1971.
- [47] M. N. Bannerman, R. Sargant, and L. Lue. Dynamo: a free general event-driven molecular dynamics simulator. J. Comput. Chem., 32:3329–3338, 2011.
- [48] Hayato Shiba, Yasunori Yamada, Takeshi Kawasaki, and Kang Kim. Unveiling dimensionality dependence of glassy dynamics: 2D infinite fluctuation eclipses inherent structural relaxation. Phys. Rev. Lett., 117:245701, 2016.
- [49] Bernd Illing, Sebastian Fritschi, Herbert Kaiser, Christian L Klix, Georg Maret, and Peter Keim. Mermin–wagner fluctuations in 2d amorphous solids. Proc. Natl. Acad. Sci. U.S.A., 114:1856–1861, 2017.
- [50] Gerd E Schröder-Turk, Walter Mickel, Matthias Schröter, Gary W Delaney, Mohammad Saadatfar, Tim J Senden, Klaus Mecke, and Tomaso Aste. Disordered spherical bead packs are anisotropic. Europhys. Lett., 90:34001, 2010.
- [51] Francis W. Starr, Srikanth Sastry, Jack F. Douglas, and Sharon C. Glotzer. What do we learn from the local geometry of glass-forming liquids? Phys. Rev. Lett., 89:125501, Aug 2002.
- [52] Xin Cao, Huijun Zhang, and Yilong Han. Release of free-volume bubbles by cooperative-rearrangement regions during the deposition growth of a colloidal glass. Nat. Commun., 8:362, 2017.
- [53] David Turnbull and Morrel H Cohen. Free-volume model of the amorphous phase: glass transition. J. Chem. Phys., 34:120–125, 1961.
- [54] Wei Hua Wang. The elastic properties, elastic models and elastic perspectives of metallic glasses. Prog. Mater. Sci., 57:487–656, 2012.
- [55] Sylvain Mazoyer, Florian Ebert, Georg Maret, and Peter Keim. Dynamics of particles and cages in an experimental 2D glass former. Europhys. Lett., 88:66004, 2010.
- [56] M. L. Manning and A. J. Liu. Vibrational modes identify soft spots in a sheared disordered packing. Phys. Rev. Lett., 107:108302, Aug 2011.
- [57] E. D. Cubuk, S. S. Schoenholz, J. M. Rieser, B. D. Malone, J. Rottler, D. J. Durian, E. Kaxiras, and A. J. Liu. Identifying structural flow defects in disordered solids using machine-learning methods. Phys. Rev. Lett., 114:108001, Mar 2015.
- [58] P. Schall, D. A. Weitz, and F. Spaepen. Structural rearrangements that govern flow in colloidal glasses. Science, 318(5858):1895–1899, 2007.
- [59] David Richard, Geert Kapteijns, Julia A. Giannini, M. Lisa Manning, and Edan Lerner. Simple and broadly applicable definition of shear transformation zones. Phys. Rev. Lett., 126:015501, Jan 2021.
- [60] Urs Gasser, Eric R Weeks, Andrew Schofield, PN Pusey, and DA Weitz. Real-space imaging of nucleation and growth in colloidal crystallization. Science, 292:258–262, 2001.
- [61] E Zaccarelli, C Valeriani, E Sanz, WCK Poon, ME Cates, and PN Pusey. Crystallization of hard-sphere glasses. Phys. Rev. Lett., 103:135704, 2009.
- [62] H. Zhang, S. Peng, X. Zhou, and X. Ju. Polymorphic crystals selected in the nucleation stage. Europhys. Lett., 107:46002, 2014.
- [63] Qiong Gao, Jingdong Ai, Shixiang Tang, Minhuan Li, Yanshuang Chen, Jiping Huang, Hua Tong, Lei Xu, Limei Xu, Hajime Tanaka, et al. Fast crystal growth at ultra-low temperatures. Nat. Mater., 20:1431–1439, 2021.
- [64] Ziren Wang, Feng Wang, Yi Peng, Zhongyu Zheng, and Yilong Han. Imaging the homogeneous nucleation during the melting of superheated colloidal crystals. Science, 338:87–90, 2012.