Improving Image-Based Precision Medicine with Uncertainty-Aware Causal Models
Abstract
Image-based precision medicine aims to personalize treatment decisions based on an individual’s unique imaging features so as to improve their clinical outcome. Machine learning frameworks that integrate uncertainty estimation as part of their treatment recommendations would be safer and more reliable. However, little work has been done in adapting uncertainty estimation techniques and validation metrics for precision medicine. In this paper, we use Bayesian deep learning for estimating the posterior distribution over factual and counterfactual outcomes on several treatments. This allows for estimating the uncertainty for each treatment option and for the individual treatment effects (ITE) between any two treatments. We train and evaluate this model to predict future new and enlarging T2 lesion counts on a large, multi-center dataset of MR brain images of patients with multiple sclerosis, exposed to several treatments during randomized controlled trials. We evaluate the correlation of the uncertainty estimate with the factual error, and, given the lack of ground truth counterfactual outcomes, demonstrate how uncertainty for the ITE prediction relates to bounds on the ITE error. Lastly, we demonstrate how knowledge of uncertainty could modify clinical decision-making to improve individual patient and clinical trial outcomes.
1 Introduction
Precision medicine permits more informed treatment decisions to be made based on individual patient characteristics (e.g. age, sex), with the goal of improving patient outcomes. Deep causal models based on medical images can significantly improve personalization by learning individual, data-driven features to predict the effect of treatments.***See [24] for a review on causality in medical imaging. As a result, they could significantly improve patient outcomes, particularly in the context of chronic, heterogeneous diseases [18], potentially non-invasively.
However, despite significant advances, predictive deep learning models for medical image analysis are not immune to error, and severe consequences for the patient can occur if a clinician trusts erroneous predictions. A provided measure of uncertainty for each prediction is therefore essential to trust the model [26]. Although uncertainty is now commonly embedded in predictive medical image analysis (e.g. [1, 15, 22]), it is not well-studied for precision medicine.
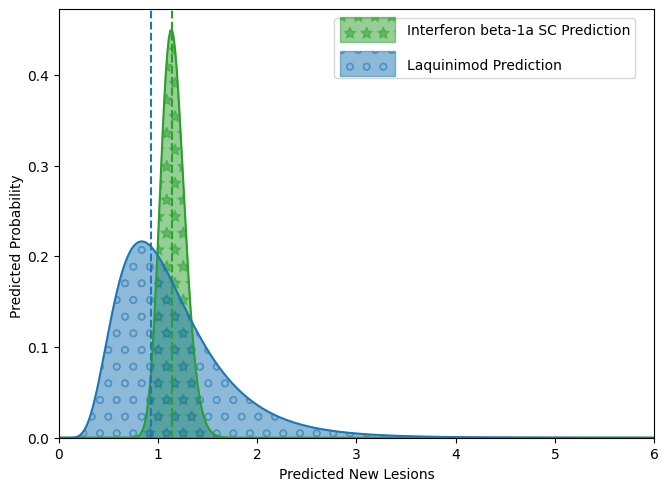
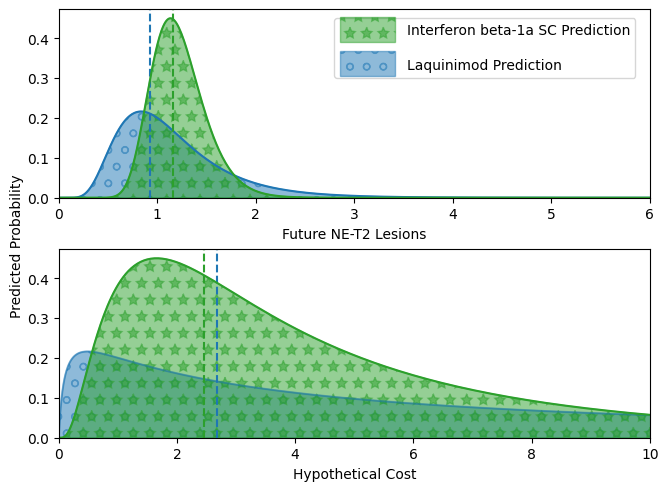
Image-based precision-medicine is highly relevant in multiple sclerosis (MS), a chronic disease characterized by the appearance over time of new or enlarging T2 lesions (NE-T2) on MRI [17, 9]. Several treatment options exist to suppress future NE-T2 lesions, but their level of efficacy and side effects are heterogeneous across the population [12]. Although one other model has been proposed for estimating the individual treatment effect (ITE) based on MR images [2], it does not incorporate uncertainty. Fig. 1 illustrates how knowledge of the model’s uncertainty could improve treatment recommendations.
To integrate uncertainty into clinical decision making, new validation measures must be defined. The usual strategy for validating uncertainty estimates, discarding uncertain predictions [14, 8] and examining performance on the remaining predictions, is not always appropriate when predicting treatment effects. For example, discarding uncertain predictions could result in discarding predictions for the most responsive of individuals. A better strategy for this individual would be to consider the level of response and uncertainty jointly when making a treatment decision.
In this work, we present the first uncertainty-aware causal model for precision medicine based on medical images. We validate our model on a large, multi-center dataset of MR images from four different randomized clinical trials (RCTs) for MS. Specifically, we develop a multi-headed, Bayesian deep learning probabilistic model [13] which regresses future lesion counts, a more challenging task than classification, but which provides more fine-grained estimates of treatment effect. We evaluate the model’s uncertainty by showing correlation of predictive uncertainty on factual and counterfactual error, and demonstrate how to bound the treatment effect error using group-level ground truth data to evaluate its correlation with the predicted personalized treatment effect. We then show the use of incorporating predictive uncertainty to improve disease outcomes by better treatment recommendations. Lastly, we demonstrate how uncertainty can be used to enrich clinical trials and increase their statistical power [21].
2 Methods
2.1 Background on Individual Treatment Effect Estimation
We frame precision medicine as a causal inference problem. Specifically, we wish to predict factual outcomes (on the treatment a patient received), counterfactual outcomes (on treatments a patient did not receive), as well as the individual treatment effect (ITE, the difference between the outcomes on two treatments). Let be the input features, be the outcome of interest, and be the treatment allocation with as a control (e.g. placebo) and the remaining are treatment options. Given a dataset containing triples , the ITE for patient and a drug can be defined using the Neyman/Rubin Potential Outcome Framework [16] as , where and represents potential outcomes on treatment and control, respectively. The is an unobservable causal quantity because only one of the two potential outcomes is observed. The average treatment effect () is defined as and is an observable quantity. Treatment effect estimation in machine learning therefore relies on a related causal estimand, :
| (1) |
†††Also known as conditional average treatment effect (CATE) can be identified from RCT data (as in our case), where [5]. Individual treatment outcomes and , and , can therefore be estimated using machine learning models such that [11].
2.2 Probabilistic Model of Individual Treatment Effects
In this work, we seek to learn the probability distribution of individual potential outcome predictions and the effect estimates . Let be a normal distribution for potential outcome predictions whose parameters are outputs of a neural network. This probabilistic framework conveniently allows for propagating the uncertainty estimates for each potential outcome to an uncertainty estimate for personalized treatment effects. Assuming independence between the two Gaussian distributions, .
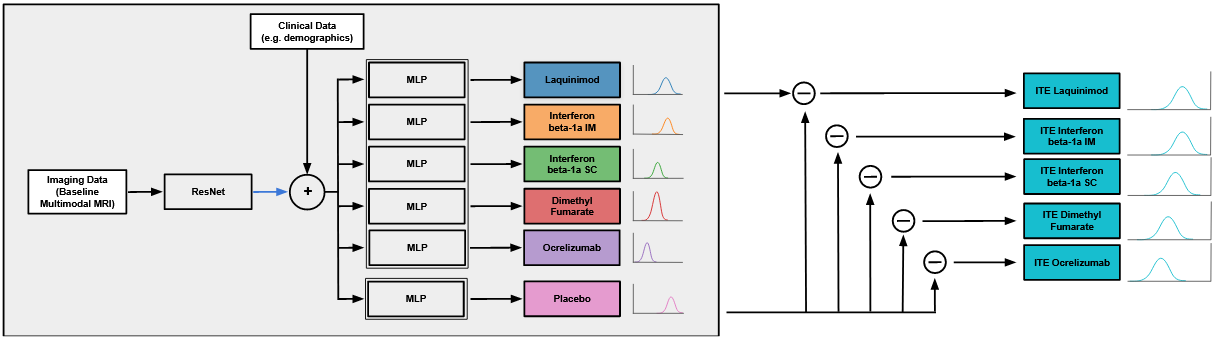
For our specific context, the input to our model consists of multi-sequence patient MRI, lesion maps, and clinical and demographic features at baseline. The model is based on a multi-headed network for treatment response estimation [2, 19]. Each head predicts and for a particular treatment. For the case of MS, the model maximizes the log likelihood of the observed number of log NE-T2 lesions formed between 1 year and 2 years in the future (Fig. 2).
2.3 Evaluating Probabilistic Predictions
2.3.1 Bounds for the ITE Error
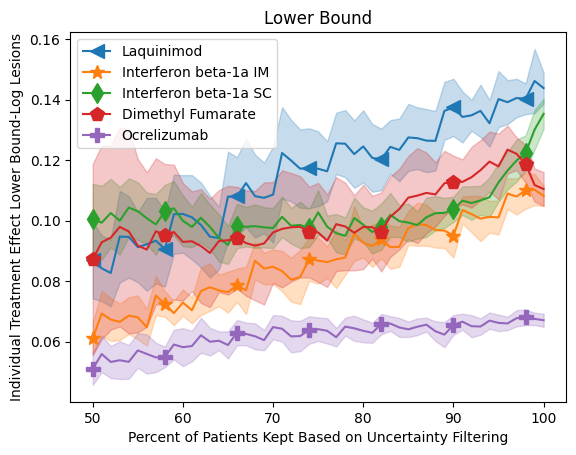
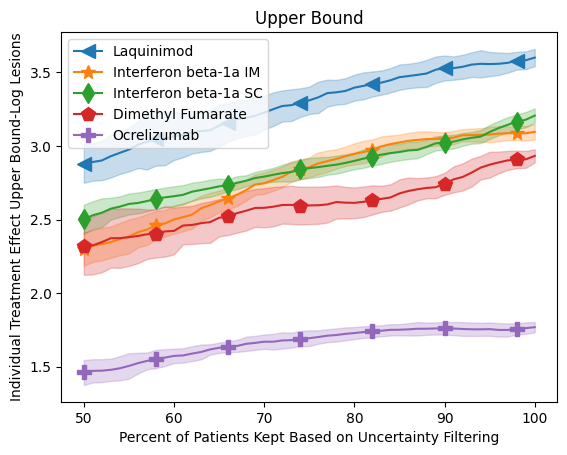
We can validate the quality of the estimated uncertainty for factual outcome predictions through the correlation between predictive uncertainty and Mean Squared Error (MSE) error. However, given that ground truth for the individual treatment effects are not available, we cannot compute MSE between and . In this work, we choose to compute the upper and lower bounds for this MSE. We validate our uncertainty estimates by showing that selecting patients with the highest confidence in their predictions reduces the bounds on the ITE error. The bounds serve as an approximation to the true ITE error, and can validate models even if the ground truth ITE is not available. We use the upper bound for the MSE as in [19]. Jensen’s inequality can be used to obtain a lower bound on the MSE as follows:
| (2) |
2.3.2 Evaluating Individual Treatment Recommendations
Predictive uncertainty can be used to improve treatment recommendations for the individual. Let be a treatment recommendation policy taking as input a patient’s features and their factual treatment assignment . The binary output of denotes whether is recommended under . In this work, we set to be a function of the model’s predictions, and . For example, can be defined such that a treatment is recommended if the number of predicted NE-T2 lesions on a particular treatment are less than 2 [4]. An uncertainty aware policy could instead recommend a drug according to . The expected response under proposed treatments (ERUPT) [27] can then be used to quantify the effectiveness of that policy:
| (3) |
For the example of NE-T2 lesions, a lower value for ERUPT is better because there were fewer lesions on average for patients on the recommended treatment.
2.3.3 Uncertainty for Clinical Trial Enrichment
Enriching a trial with predicted responders has been shown to increase statistical power in the context of MS [3]. We measure the statistical power by the z-score: . Where is the variance of factual outcomes on treatment . The approach taken by [3] achieves higher statistical power by selecting a subset of the population with larger . Our proposed uncertainty-based enrichment selects patients with lower ITE uncertainty (), with the goal of reducing the population variance (). The benefit of this approach is most apparent if we inspect a specific population (defined by a particular value for ATE in the numerator).
3 Experiments and Results
3.1 Dataset
The dataset is composed of patients from four randomized clinical trials: BRAVO [25], OPERA 1 [6], OPERA 2 [6], and DEFINE [7]. Each trial enrolled patients with relapsing-remitting MS. Each patient sample consists of multi-sequence patient MRI (T1 weighted pre-contrast, T1 weighted post-contrast, FLAIR, T2-weighted, and proton density weighted), lesion maps (T2 hyperintense and gadolinium-enhancing lesions), as well as relevant clinical and demographic features (age, sex, expanded disability status scale scores [10]) at baseline. The number of NE-T2 lesions between 1 and 2 years after trial initiation were provided for each patient. Excluding patients with incomplete data resulted in a dataset with patients. In total the dataset contains the following treatment arms: placebo (), laquinimod () , interferon beta-1a intramuscular (INFB-IM) (), interferon beta-1a subcutaneous (INFB-SC) (), dimethyl fumarate (DMF) (), and ocrelizumab (). We perform 4 fold nested cross validation on this dataset. [23]
3.2 Evaluation of Factual Predictions and Uncertainty Estimation
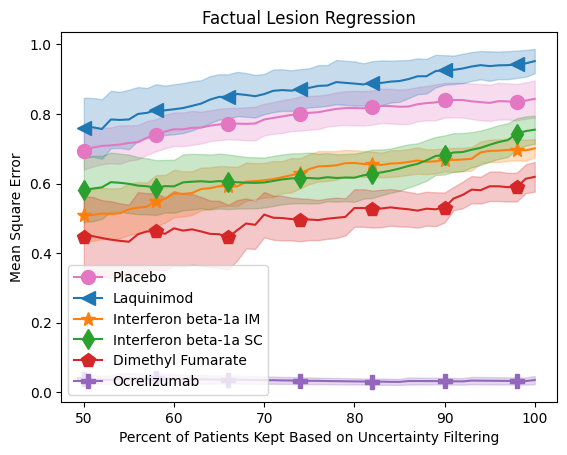
Each patient is given a single treatment. The MSE for the future log-NE-T2 lesion count on the observed (factual) treatment and is used as a measure of the model’s predictive accuracy. Taking all treatments in aggregate, the model achieves an MSE of . Separating each treatment, it achieves an error of for placebo, for laquinimod, for INFB-IM, for INFB-SC, for DMF, and for ocrelizumab. Next we evaluate the correlation between the model error and the predicted variance. An accurate uncertainty estimate should be positively correlated with prediction accuracy [14]. This relationship is shown in Fig. 3(a), where the MSE for the factual predictions decreases as we select a sub-group of patients with lower predictive uncertainty.
Next, we examine the results for the ITE error. Fig. 3(b) and Fig. 3(c) show the upper and lower bounds (Eq. 2). Similarly to the factual error, the lower bound and upper bound on the ITE error decrease with decreasing ITE uncertainty.
3.3 Uncertainty for Individual Treatment Recommendations
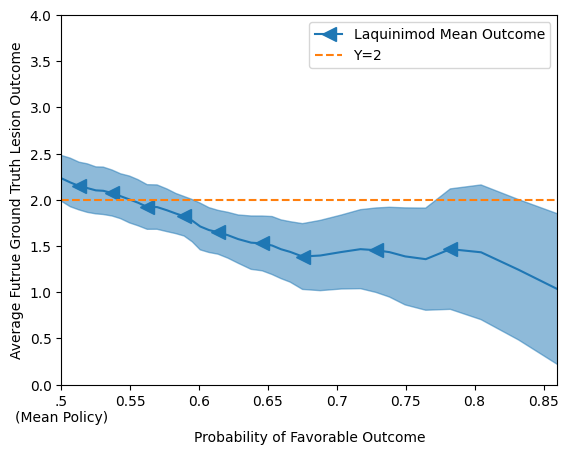
The effect of integrating uncertainty into treatment recommendations is evaluated by defining a policy using this uncertainty (Eq. 3). Here, we report outcomes on the lesion values (as opposed to log-lesions) for interpretability. In Fig. 4(a), a treatment, laquinimod‡‡‡Results on other treatments can be found in the Appendix., is recommended if the predicted probability of having fewer than 2 NE-T2 lesions is greater than a threshold : . A policy requiring greater confidence indeed selects patients who more often have fewer than 2 lesions. It is worth noting that laquinimod was not found to be efficacious at the whole group level in clinical trials [25] and is therefore not approved, but this analysis shows that using personalized recommendations based on uncertainty can identify a sub-group of individuals that can benefit.
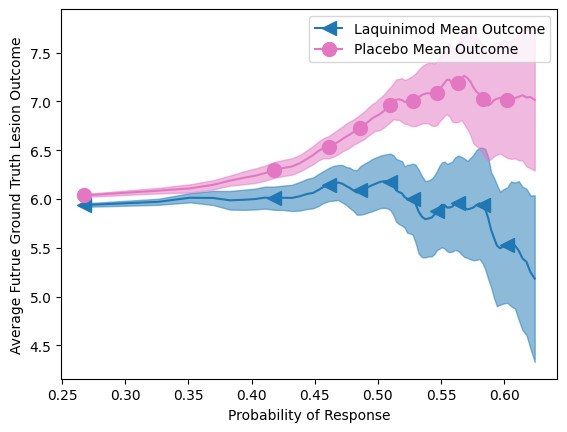
In Fig. 4(b), a treatment effect-based policy is used such that laquinimod is recommended if the probability of any treatment response is greater than a threshold : . As certainty in response grows, the difference between the treated and placebo groups grows suggesting an uncertainty aware policy better identifies patients for which the drug will have an effect.
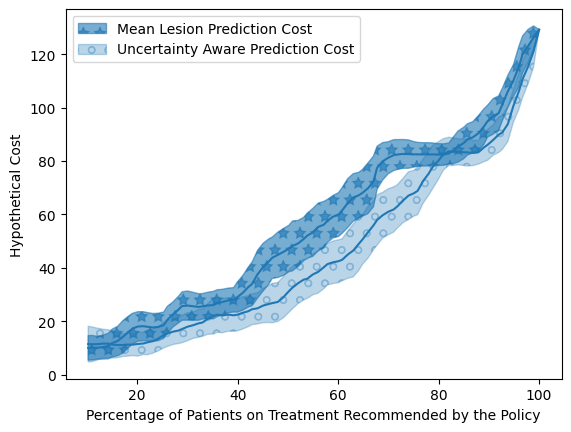
Uncertainty can be useful when we wish to attribute a cost, or risk, to a certain range of outcomes. In our case, we assume a hypothetical non-linear cost for having more NE-T2 lesions, where . Fig. 5(a) describes a case where the recommended treatment (in terms of the mean) changes if this cost transformation is applied. In this case, the shape of the distribution over possible outcomes (which informs our uncertainty about this outcome) affects how much the mean of the distribution shifts under this transformation. This analysis is extended to the entire laquinimod cohort in Fig. 5(b). We compute the average cost (Eq. 3) rather than the number of future NE-T2 lesions (as in Fig. 4(a)) for two types of policies. In the uncertainty-aware policy, the predicted distribution is used to make the treatment decision, whereas for the mean policy, the decision is based on only on . As expected, uncertainty-aware recommendations incur a lower expected cost across the entire cohort compared to the mean policy. The advantage is most visible for intermediate values on the -axis, because at the far right all patients are recommended laquinimod, and at the far left patients have closer to 0 NE-T2 lesions on average and the magnitude of the improvement due to the uncertainty-aware policy lessens.
3.4 Uncertainty for Clinical Trial Enrichment
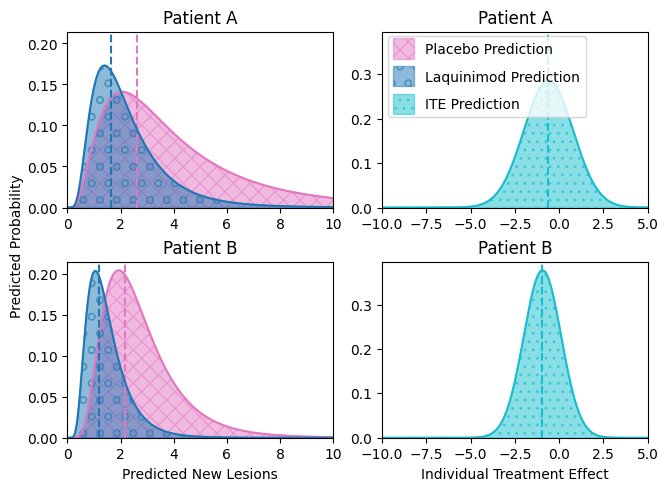
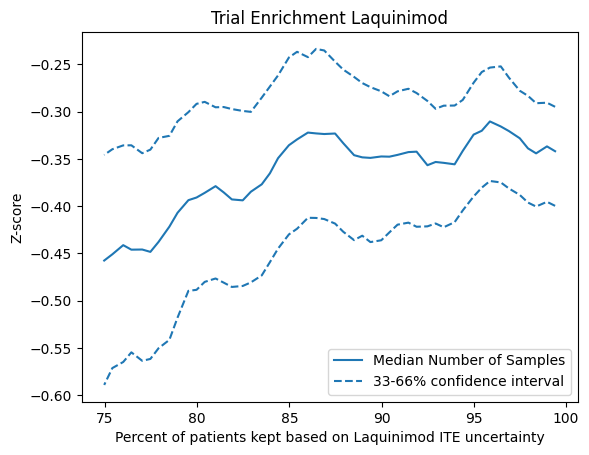
Uncertainty estimation can also be useful when selecting a sub-population of to enroll in a clinical trial, in a technique called predictive enrichment [20]. Fig. 1(b), shows an example where two patients have similar estimated future lesions but different ITE uncertainties. For trial enrichment, the second patient is more likely to experience a significant effect from this drug, and therefore enriching the trial with such patients could increase it’s statistical power to detect an effect if done appropriately (see Sec. 2.3.3). In Fig. 6 we show the effect of uncertainty-aware trial enrichment. For a population with a particular effect size, we remove patients (right to left) with high ITE uncertainty and compute the z-score between the untreated and treated populations for the remaining groups. As expected, groups with smaller average ITE uncertainty have greater statistical differences (lower z scores).
4 Conclusion
In this work, we present a novel, causal, probabilistic, deep learning framework for image-based precision medicine. Our multi-headed architecture produces distributions over potential outcomes on multiple treatment options and a distribution over personalized treatment effects. We evaluate our model on a real-world, multi-trial MS dataset, where we demonstrate quantitatively that integrating the uncertainties associated with each prediction can improve treatment-related outcomes in several real clinical scenarios compared to a simple mean prediction. The evaluation methods used in this work are agnostic to the method of uncertainty quantification which permits flexibility in the choice of measure. Overall, this work has the potential to greatly increase trust in the predictions of causal models for image-based precision medicine in the clinic.
Acknowledgement
This investigation was supported by the International Progressive Multiple Sclerosis Alliance (PA-1412-02420), the companies who generously provided the data: Biogen, BioMS, MedDay, Novartis, Roche / Genentech, and Teva, the Canada Institute for Advanced Research (CIFAR) AI Chairs program, the Natural Sciences and Engineering Research Council of Canada, the MS Society of Canada, Calcul Quebec, and the Digital Research Alliance of Canada. The authors would like to thank L. Collins and M. Dadar for preprocessing the MRI data, Z. Caramanos, A. M. Pinzon, C. Guttmann and I, Mórocz for collating the clinical data, and S. Narayanan and M.-P. Sormani for their MS expertise.
References
- [1] Abdar, M., et al.: A review of uncertainty quantification in deep learning: Techniques, applications and challenges. Information Fusion 76, 243–297 (2021)
- [2] Durso-Finley, J., et al.: Personalized prediction of future lesion activity and treatment effect in multiple sclerosis from baseline mri (2022)
- [3] Falet, J.P.R., et al.: Estimating treatment effect for individuals with progressive multiple sclerosis using deep learning (2021)
- [4] Freedman, M., et al.: Treatment optimization in multiple sclerosis: Canadian ms working group recommendations. Canadian Journal of Neurological Sciences / Journal Canadien des Sciences Neurologiques 47, 1–76 (04 2020)
- [5] Gutierrez, P., et al.: Causal inference and uplift modelling: A review of the literature. vol. 67, pp. 1–13. PMLR (12)
- [6] Hauser, S.L., et al.: Ocrelizumab versus interferon beta-1a in relapsing multiple sclerosis. New England Journal of Medicine 376(3), 221–234 (2017)
- [7] Havrdova, E., et al.: Oral BG-12 (dimethyl fumarate) for relapsing-remitting multiple sclerosis: a review of DEFINE and CONFIRM. Evaluation of: Gold R, Kappos L, Arnold D, and others Placebo-controlled phase 3 study of oral BG-12 for relapsing multiple sclerosis. Expert Opin Pharmacother 14(15), 2145–2156 (Oct 2013)
- [8] Jesson, A., et al.: Identifying causal effect inference failure with uncertainty-aware models (2020)
- [9] Kappos, L., et al.: Predictive value of gadolinium-enhanced magnetic resonance imaging for relapse rate and changes in disability or impairment in multiple sclerosis: a meta-analysis. Lancet (London, England) 353, 964–969 (1999)
- [10] Kurtzke, J.F.: Rating neurologic impairment in multiple sclerosis. Neurology 33 (1983)
- [11] Künzel, S.R., Sekhon, J.S., Bickel, P.J., Yu, B.: Metalearners for estimating heterogeneous treatment effects using machine learning. Proceedings of the National Academy of Sciences 116(10), 4156–4165 (feb 2019)
- [12] Lucchinetti, C., et al.: Heterogeneity of multiple sclerosis lesions: Implications for the pathogenesis of demyelination. Annals of neurology 47, 707–17 (07 2000)
- [13] MacKay, D.J.C.: A Practical Bayesian Framework for Backpropagation Networks. Neural Computation 4(3), 448–472 (05 1992)
- [14] Nadeem, M.S.A., et al.: Accuracy-rejection curves (arcs) for comparing classification methods with a reject option. In: Proceedings of the third International Workshop on Machine Learning in Systems Biology. Proceedings of Machine Learning Research, vol. 8, pp. 65–81. PMLR, Ljubljana, Slovenia (05–06 Sep 2009)
- [15] Nair, T., et al.: Exploring uncertainty measures in deep networks for multiple sclerosis lesion detection and segmentation. Medical image analysis 59, 101557 (2020)
- [16] Rubin, D.B.: Estimating causal effects of treatments in randomized and nonrandomized studies. Journal of Educational Psychology 66, 688–701 (1974)
- [17] Rudick, R., et al.: Significance of t2 lesions in multiple sclerosis: A 13-year longitudinal study. Annals of neurology 60, 236–42 (08 2006)
- [18] Sanchez, P., et al.: Causal machine learning for healthcare and precision medicine. Royal Society Open Science 9(8) (2022)
- [19] Shalit, U., et al.: Estimating individual treatment effect: generalization bounds and algorithms (2017)
- [20] Simon, R., Maitournam, A.: Evaluating the efficiency of targeted designs for randomized clinical trials. Clinical cancer research : an official journal of the American Association for Cancer Research 10, 6759–63 (11 2004)
- [21] Temple, R.: Enrichment of clinical study populations. Clinical Pharmacology & Therapeutics 88(6), 774–778 (2010)
- [22] Tousignant, A., et al.: Prediction of disease progression in multiple sclerosis patients using deep learning analysis of mri data. In: International conference on medical imaging with deep learning. pp. 483–492. PMLR (2019)
- [23] Vabalas, A., et al.: Machine learning algorithm validation with a limited sample size. PLoS ONE 14(11) (Nov 2019)
- [24] Vlontzos, A., et al.: A review of causality for learning algorithms in medical image analysis (2022)
- [25] Vollmer, T.L., et al.: A randomized placebo-controlled phase III trial of oral laquinimod for multiple sclerosis. J Neurol 261(4), 773–783 (Apr 2014)
- [26] Zhang, Y., et al.: Effect of confidence and explanation on accuracy and trust calibration in ai-assisted decision making. CoRR (2020)
- [27] Zhao, Y., et al.: Uplift modeling with multiple treatments and general response types (2017)