Magnetic excitation spectrum and Hamiltonian of the quantum spin chain \ceBaCuTe2O6
Abstract
The magnetic excitation spectrum and Hamiltonian of the quantum magnet \ceBaCuTe2O6 is studied by inelastic neutron scattering (INS) and density functional theory (DFT). INS on powder and single crystal samples reveals overlapping spinon continuua – the spectrum of an antiferromagnetic spin-1/2 spin chain – due to equivalent chains running along the a, b, and c directions. Long-range magnetic order onsets below K due to interchain interactions, and is accompanied by the emergence of sharp spin-wave excitations which replace the continuua at low energies. The spin-wave spectrum is highly complex and was successfully modelled achieving excellent agreement with the data. The extracted interactions reveal an intrachain interaction, meV, while the antiferromagnetic hyperkagome interaction , is the sub-leading interaction responsible for coupling the chains together in a frustrated way. DFT calculations reveal a similar picture for \ceBaCuTe2O6 of dominant and sub-leading antiferromagnetic interactions and also indicate a high sensitivity of the interactions to small changes of structure which could explain the very different Hamiltonians observed in the sister compounds SrCuTe2O6 and \cePbCuTe2O6.
I Introduction
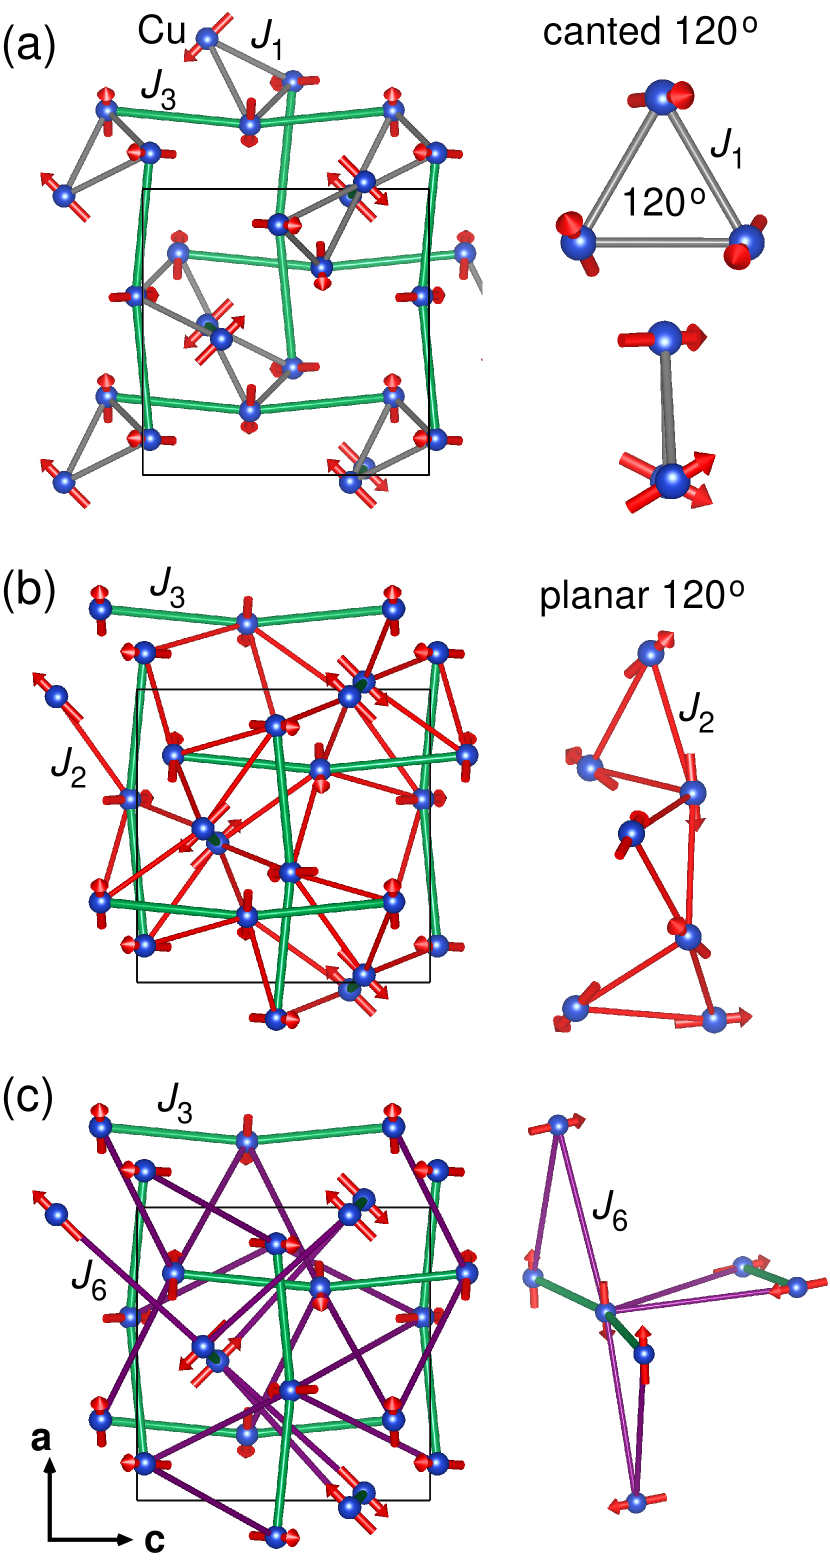
The compounds CuTe2O6 ( = Sr2+, Pb2+, Ba2+) form a fascinating family of materials. Their properties include quantum magnetism, spin liquid behavior, ferroelectricity and magnetoelectricity. The magnetic properties arise from the Cu2+ ions which have quantum spin-1/2 and are coupled by antiferromagnetic (AFM) interactions into chain and triangular structures. Meanwhile, the dielectric properties probably arise from the lone pair of electrons on the Te4+ and Pb2+ ions. The compounds form in the cubic space group (#213) where all the Cu2+ ions are equivalent and occupy the single Wyckoff site. The Cu2+ ions are coupled by a combination of one-dimensional (1D) and frustrated magnetic exchange interactions. As shown by Fig. 1, the first neighbor interaction couples them into isolated triangles, the second neighbor interaction couples them into a three-dimensional (3D) network of corner-sharing triangles known as the highly frustrated hyperkagome lattice and the third neighbor interaction, couples them into chains with equivalent chains parallel to the a-, b- and c-axes due to the cubic symmetry. In addition, there are further neighbor interactions such as which also give rise to spin chains along the body diagonals and which couples together the parallel chains formed by the interaction.
Behavior consistent with a quantum spin liquid was found in \cePbCuTe2O6. No indication of long-range magnetic order or spin freezing was found using a variety of experimental techniques even down to 20 mK [1, 2, 3, 4, 5]. Instead, both nuclear magnetic resonance and muon spin resonance measurements suggested a non-spin-singlet ground state with persistent spin fluctuations [2], while inelastic neutron scattering showed broad diffuse excitations inconsistent with the spin-waves of a conventional magnet. Density functional theory calculations showed that the hyperkagome interaction is antiferromagnetic and strongest giving rise to strong magnetic frustration [1, 3] while the interaction was found to have similar strength [3], leading to the novel hyper-hyperkagome lattice - a member of the distorted windmill lattice family [6, 7]. Pseudo-Fermion functional renormalization group calculations based on these interactions confirm the absence of magnetic order and reproduce the observed magnetic structure factor. Further theoretical works using projective symmetry group analysis also suggest that \cePbCuTe2O6 could host quantum spin liquid states [8, 9]. More recently, interest has turned to a 1 K transition found in the single crystal samples which has been identified as a transition to ferroelectric order possibility related to the lone pairs on both the Pb2+ and Te4+ ions [4]. Interestingly, no long-range magnetic order was found so far to occur at this transition [4] and furthermore the transition is suppressed in powder samples because it is energetically unfavorable in small crystallites [5].
The behavior of SrCuTe2O6 is very different from \cePbCuTe2O6. In this compound the unfrustrated interaction is dominant and antiferromagnetic giving rise to three equivalent spin chains parallel to the a-, b- and c-axes. Evidence for this comes from broad peaks due to short-range order in the DC susceptibility and heat capacity [12, 13, 14, 15, 16]. Furthermore inelastic neutron scattering finds that the excitations form a spinon continuum characteristic of the spin-1/2 Heisenberg antiferromagnetic chain [17]. Physical properties measurements also reveal two transitions to long-range magnetic order and a complex phase diagram as a function of magnetic field and temperature [12, 13, 14, 15, 16]. Furthermore measurement of the dielectric properties reveal magnetoelectric behaviour [13, 14]. The long-range magnetic order in the ground state was studied by neutron diffraction and the magnetic structure is characterized by antiferromagnetic order along the chains and planar 120∘ order around the isolated triangles ( irreducible representation) [15, 16]. Since long-range magnetic order is not possible in a one-dimensional magnet [18], there must be additional magnetic interactions which couple the chains together. Several Density functional theory calculations were performed to calculate the interactions in SrCuTe2O6 which stated that the strongest interchain interaction is the hyperkagome interaction which was initially found to be antiferromagnetic (AFM) [12, 13] but later found to be ferromagnetic (FM) [19] along with a smaller AFM interaction [12, 19]. The interchain interactions were also investigated by inelastic neutron scattering. By fitting the low energy magnetic spectrum at low temperatures to spin-wave theory, Chillal et al [17] showed that the FM /AFM model is compatible with the data while an AFM also explains the spectrum.
The newest member of the ACuTe2O6 family is \ceBaCuTe2O6. As for SrCuTe2O6, the unfrustrated interaction is also dominant and antiferromagnetic in \ceBaCuTe2O6, giving rise to spin chains parallel to the a-, b- and c-axes. The intrachain interaction was found to have strength meV from DC susceptibility and heat capacity measurements [10, 19]. This was confirmed by inelastic neutron scattering measurements which observed the characteristic spinon continuum expected for a spin-1/2 Heisenberg antiferromagnetic chain, allowing comparison to theory which yielded meV [10]. Long-range antiferromagnetic order occurs at the much lower temperature of K [10, 19] revealing the presence of weak interchain interactions. The magnetic structure was found to follow the irreducible representation [10]. It is illustrated by the red arrows along with the exchange interactions , , and in Fig. 1. As for SrCuTe2O6 the order is antiferromagnetic along the chains formed by , however there is canted 120∘ order about the isolated triangles rather than the planar 120∘ order of SrCuTe2O6. Furthermore there is planar 120∘ order around the triangles of the hyperkagome lattice formed by (rather that canted 120∘ order). This suggests that an antiferromagnetic interaction is primarily responsible for coupling the chains and gives rise to the long-range magnetic order. Recent DFT calculations support this view, they predict that the chain interaction is meV, while meV and the interchain coupling is due to an AFM meV. They also predict an AFM meV while all other interactions are negligible [19].
In this paper we determine the magnetic exchange interactions of \ceBaCuTe2O6 using two independent methods. We extract the interactions from the magnetic excitation spectrum observed at low temperatures and energies using inelastic neutron scattering (INS). We also perform density functional theory (DFT) calculations to estimate the interactions based on the crystal structure. The results are compared to those of SrCuTe2O6 and \cePbCuTe2O6.
II Magnetic Excitation Spectrum
II.1 Experimental Details
Powder and single crystal samples of \ceBaCuTe2O6 were synthesized and characterized at the Core Laboratory Quantum Materials, Helmholtz-Zentrum Berlin für Materialien und Energie, Germany. Further details can be found in Ref. [10].
The spin dynamics of \ceBaCuTe2O6 were studied by inelastic neutron scattering (INS). Data for both powder and single crystal samples were collected on the LET, cold neutron multi-chopper Time-of-Flight spectrometer operating at Target Station 2 of the ISIS facility, Rutherford Appleton Laboratory, UK [21, 22]. The samples were cooled using an orange cryostat and data were measured at =2 K and 8 K. The spectrum of the powder sample (mass 10.1(4) g) was collected simultaneously at five independent incident energies = 14.1, 4.88, 2.45, 1.47 and 0.978 meV with corresponding elastic energy resolutions, = 0.697, 0.144, 0.053, 0.025 and 0.014 meV for a total current of 240 A and 310 A at low and high temperatures, respectively. The single crystal sample consisted of three co-aligned crystals (total mass 4.80(1) g) oriented with the crystallographic direction vertical. The crystals were wrapped in Al foil and attached to an Al sample holder using Al wire. This sample was measured at K and K with incident energies, = 13.75, 7.6, 4.81, 3.32 and 2.43 meV and corresponding elastic energy resolutions, = 0.782, 0.333, 0.175, 0.105 and 0.068 meV. During the measurements the crystals were rotated about their vertical axis over an angular range of 159∘ in steps of 0.5∘ or 1∘ for a current of 8 A per step. Data processing and visualization were carried out using the Horace software [23].
Further INS measurements were performed to provide information about the low-energy magnetic excitations below the transition temperature. The co-aligned system of \ceBaCuTe2O6 single crystals was measured again on the single detector, Triple-Axis-Spectrometer FLEXX, at Helmholtz-Zentrum Berlin für Materialien und Energie, Germany [24]. Data were collected at K, using an orange cryostat. The wavevector of the scattered neutrons was fixed to Å-1 which provided an elastic energy resolution of =0.12 meV, while the monochromator was used in the horizontally and vertically focused mode to optimize intensity. Data were collected by scanning the energy with step size 0.05 meV, for fixed wavevectors along the , and directions with values of and taken at intervals of 0.1 r.l.u. or smaller, measuring for min per step. In addition, -scans at constant-energy along the and directions were performed for a step of 0.05 r.l.u. for several fixed energies with the same counting time. The visualization of the data was achieved using the software package Spec1D in Matlab.
The magnetic Hamiltonian of \ceBaCuTe2O6, was simulated using linear spin-wave theory within the Matlab package, SpinW [25] and compared to the data at low energies and temperatures to obtain the exchange interactions.
II.2 Results
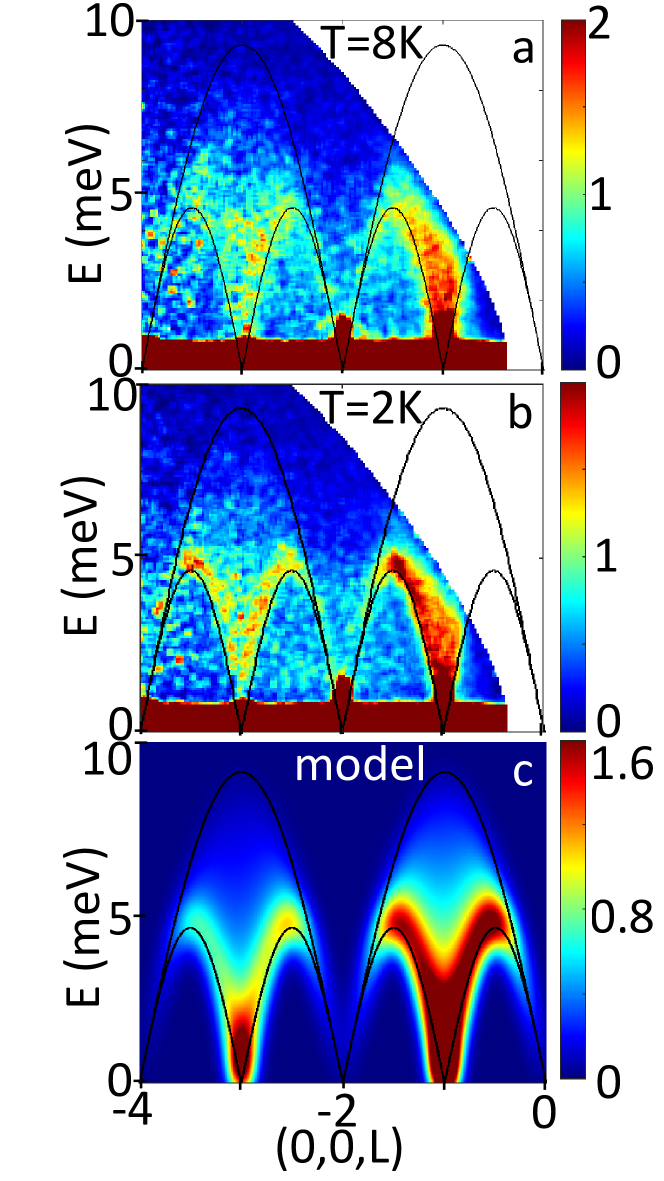
Figure 2 shows the full magnetic spectrum from the single crystal sample plotted as a function of energy up to 10 meV and wavevector along the direction of one set of chains due to the interaction. The data were measured with an incident energy of 13.75 meV on the LET spectrometer just above the Néel temperature at 8 K( K) (Fig. 2(a)) and well below it at 2 K() (Fig. 2(b)). Only subtle changes are observed with the decrease in temperature at most energy scales. As discussed in Ref. [10] the spectrum is typical of a spin-1/2, Heisenberg, antiferromagnetic chain showing a spinon continuum extending from a lower boundary given by the des Cloizeaux-Pearson expression to an upper boundary given by [26]. This allowed the value of the intrachain interaction, meV, to be extracted [10]. Figure 2(c) shows the theoretical spinon continuum simulated for this value of for comparison with the data.
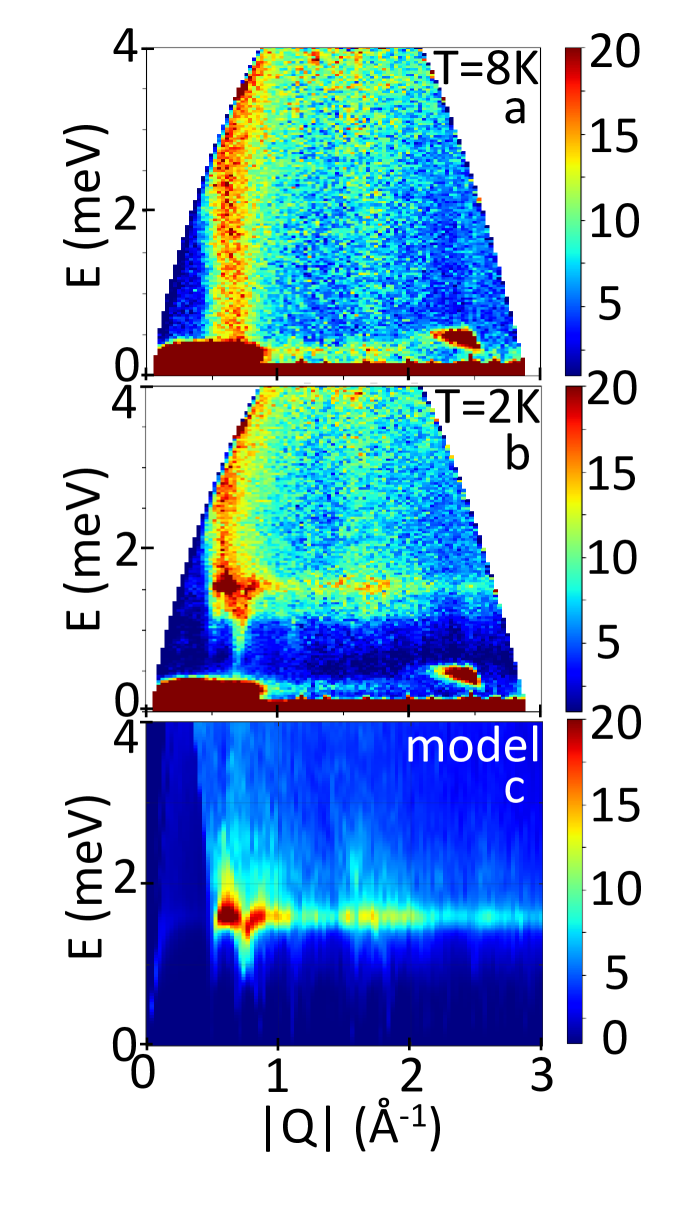
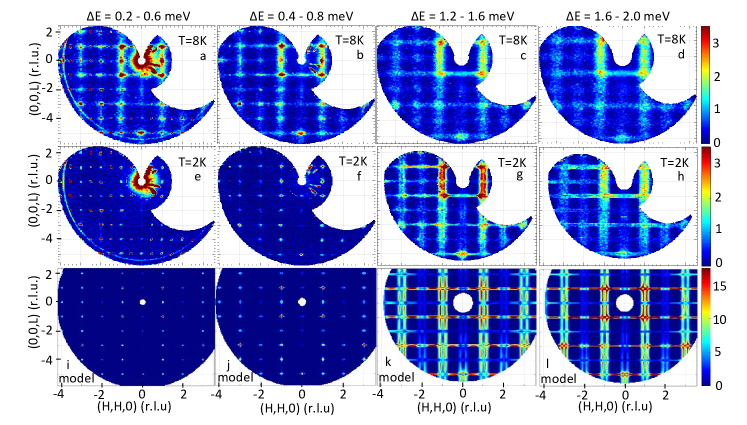
Differences in the spectrum above and below are most pronounced at low energies. Figure 3 presents the low energy INS data collected on the LET spectrometer for the powder sample at 8 K (Fig. 3(a)) and 2 K (Fig. 3(b)) plotted as a function of energy and wavevector. At 8 K, there are streaks of scattering at the wavevectors 0.5 and 1.5 Å-1 which are due to the spinon continuum that comes down to low energies at (0,0,1) and (0,0,3) respectively. Note that these minima occur at odd-integer rather than half-odd-integer values of because each chain has two Cu2+ ions per unit cell. These are the same features observed in the high energy single crystal data shown in Fig. 2. Below the low energy spectrum is very different, a flat band appears at meV and at lower energies new weak streaks appear at the wavevectors 0.5, 0.7 and 1.15 Å-1 which correspond to the magnetic Bragg peaks (0,0,1), (1,1,0) and (0,1,2)/(1,1,2) observed in neutron diffraction [10].
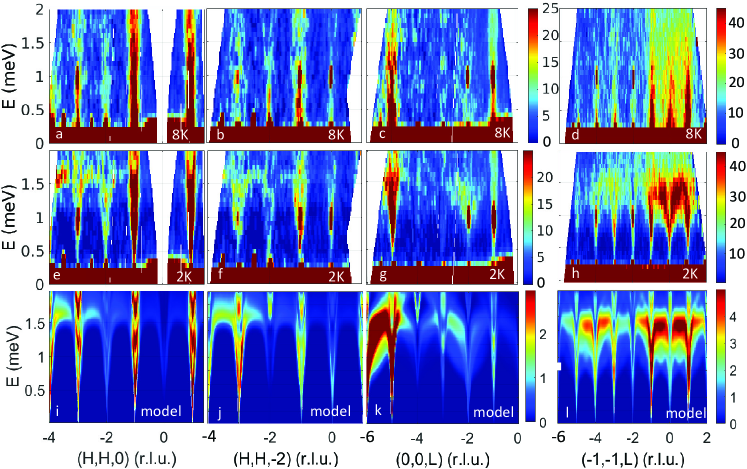
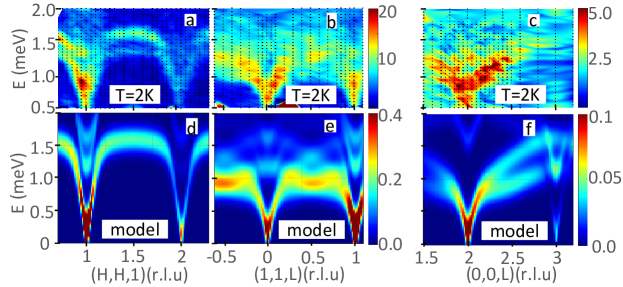
In order to learn more about the low energy spin dynamics of \ceBaCuTe2O6, further INS data were collected from the single crystal sample using lower incident energies on the LET spectrometer. Figure 4 presents the spectrum collected for an incident energy of =4.81 meV plotted as a function of energy and wavevector for selected high symmetry directions. Above at 8 K, strong magnetic signal is observed at odd integer values of and due to the spinon continuum, however at 2 K the signal below 2 meV is again significantly modified with a new dispersionless band at meV and the intensities at lower energies are dramatically altered.
These changes can also be observed in the constant energy slices plotted in Fig. 5. At 8 K (top panels of Fig. 5) two sets of perpendicular streaks are observed. The streaks parallel to , which are strongest for odd , are due to the chains parallel to the c-axis, these chains are effectively decoupled above so that the dispersion perpendicular to these chains is negligible. Likewise the streaks parallel to are due to the chains along the a- and b-directions. Below (middle panels of Fig. 5) the excitations have clearly become dispersive. At the lowest energies, the streaks are replaced by dots suggesting spin-waves dispersing upwards from integer values of and . Above meV the streaks are again visible, however they appear sharper than at 8 K and close observation shows them to be in fact double streaks, providing further evidence that these excitations are spin-waves.
The results from the single crystal measurement on the FLEXX spectrometer are similar to the LET results. Figure 6 shows the data at 2 K as a function of energy and wavevector along various directions. A corresponding measurement above was not performed on this spectrometer.
In summary, while we can think of the chains due to the interaction as being essentially decoupled above resulting in a spinon continuum in \ceBaCuTe2O6, at lower temperatures the interchain coupling gives rise to long-range magnetic order and spin-wave excitations at low energies. The higher energy spinon excitations are however almost unchanged by the transition. While the boundary between the spinon and spin-wave regimes is not sharp, the biggest temperature changes occur below meV which is the top of the interchain spin-wave dispersion at low temperatures (see Fig. 3, 4 and 6) identifying this as the spin-wave bandwidth. Above this dispersion is gone implying that the spin-waves (which have quantum spin number ) have ’deconfined’ into pairs of spinons (which have quantum spin number ). In contrast, above meV the excitations are broad and show almost no changes with temperature suggesting that this is the spinon regime. The intermediate energy regime ( meV) is a crossover regime where the excitations can be described as broadened spin-waves or partially confined spinons.
Such confinement of the spinon excitations into spin-waves at low energies and temperatures due to the interchain coupling was observed previously and studied extensively in the spin-chain compound KCuF3 [27, 28, 29] and was also found in the sister compound SrCuTe2O6 [17], which is isostructural to \ceBaCuTe2O6.
II.3 Analysis
Because we observe spin-waves excitations at low energies and temperatures in \ceBaCuTe2O6, the low energy INS data can be analyzed using linear spin-wave theory to extract the interchain exchange interactions. The steepest spin-wave dispersion along the chain at low energies merges with the lower boundary of the spinon continuum at higher energies given by the des Cloizeaux-Pearson expression [26]. Therefore, in order to model the dispersion along the chains using spin-wave theory, the renormalized intrachain exchange constant should be used. A consistent value of meV has already been established in the literature from DC susceptibility, heat capacity, inelastic neutron scattering and DFT [10, 19]. Here we use meV derived by comparing our high energy INS data to the spectrum of the theoretical spinon continuum (Fig. 2) [10], which gives us the value meV.
The spin-wave simulations for \ceBaCuTe2O6 were calculated using the spinW program [25] with the intrachain coupling fixed at meV. The interchain interactions , and were included and all the interactions were assumed to be isotropic or Heisenberg which is usually a good approximation for Cu2+ ions. The neutron scattering structure factor was simulated for a very wide range of combinations of both ferromagetic and antiferromagnetic values of the intrachain couplings. In all cases a complex multi-branch spin-wave spectrum was found. Many of the combinations could be instantly rejected because they were incompatible with the known magnetic structure of \ceBaCuTe2O6 [10]. The simulations from the remaining combinations were compared to various low energy cuts and slices at 2 K collected on the LET and FLEXX spectrometers such as those shown in Figures 4, 5 and 6. A detailed visual comparison was performed of the data and simulation taking into account both the disperion energies and intensities to judge if there was a match. The ranges of the exchange interactions found to be compatible with the data are described in Table 1 and lie within the rectangular area in Fig. 7.
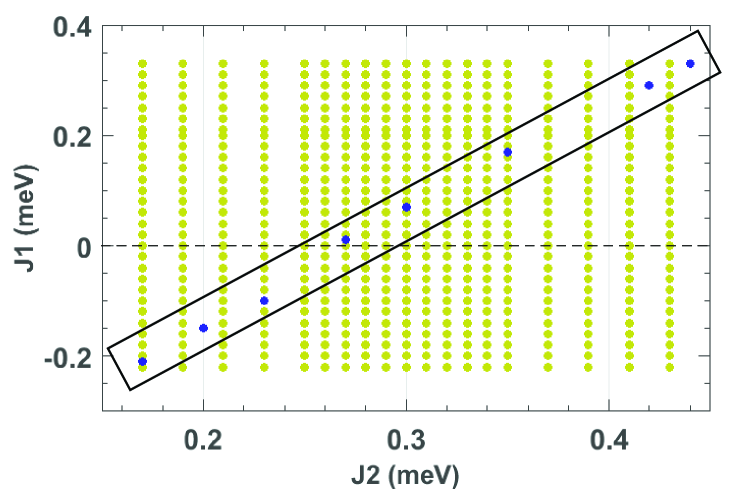
We found that it is essential to have a finite and antiferromagnetic to explain the data, this is to be expected because of the 120∘ magnetic order around each corner-sharing triangle formed by this interaction. At the same time we found the values of and to be highly coupled. can take values in the range meV. For a given , was found to lie within the range meV. For the smallest value of meV, is ferromagnetic with size -0.20 meV, while for the largest value of meV, is antiferromagnetic of size 0.34 meV. The factor of two in the relation between and can be understood to arise from the fact that there are twice as many bonds as bonds so a two times larger change in is needed to influence the spectrum. Finally was found to have very little effect on the excitations and could take either ferromagnetic values or antiferromagnetic values with no observable change in the simulations. The insensitivity of the magnetic spectrum to can be understood as due to the fact that couples together parallel chains (see Fig. 1(c)). Since there is a shift between neighboring chains, a Cu2+ ion on one chain is coupled by to two Cu2+ ions on each neighboring chain, and since these two Cu2+ ions are antiparallel due to the strong antiferromagnetic interaction this coupling is frustrated for both ferromagnetic and antiferromagnetic values of . As a consequence, the energy of the bonds effectively cancels. We note that the spins on neighboring chains coupled by are always perpendicular to each other in response to this frustration. It was not possible to identify a unique solution for the Hamiltonian of \ceBaCuTe2O6 since the simulated spectrum changes only very gradually within the range of compatible solutions. Example combinations of exchange interactions that fit the data are listed in Table 1.
| Allowed Values | Examples | ||||
|---|---|---|---|---|---|
| & | |||||
| & | |||||
The spin-wave spectra simulated for the solution where meV, meV, meV and meV are shown alongside the data in the lower panels of Figures 3, 4, 5 and 6. To make a direct comparison to the data, the simulated structure factor was convolved with a Gaussian to mimic the effects of the energy resolution and the magnetic form factor of the Cu2+ ion was included in the calculations. The same energy and wavevector integration ranges used for the LET data were also used in the simulations. This was achieved by, averaging several simulated slices with different out-of-plane ([,,0]) wavevectors within the out-of-plane integration range of the data, and where appropriate a similar averaging was performed over wavevector within the in-plane integration range ([,,0] or [0,0,]) and over energy within the energy integration range. For the simulations of the FLEXX data, the wavevector resolution broadening was taken into account by taking the Gaussian weighted average over the expected resolution widths in the directions out-of-plane ([,,]) and in-plane perpendicular to each slice by Å-1 and Å-1 respectively.
In general, good agreement between the energies and intensities of the low energy magnetic excitations measured at K and the spin-wave calculations was accomplished. The experimental data appear somewhat broader that the simulations, we attribute this to partial deconfinement of the spin-waves into spinons with increasing energy.
III Density functional theory
III.1 Methods
Density functional theory (DFT) provides an alternative way to determine the magnetic exchange interactions of a material based on its crystal structure. We performed all electron density functional theory calculations using the full potential local orbital (FPLO) code [30] employing the generalized gradient approximation (GGA) exchange and the correlation functional [31]. For the electronic structure calculations, we used the K crystal structure of \ceBaCuTe2O6 which was determined in Ref. [10] by neutron diffraction. For comparison we also used the K crystal structure determined from X-ray diffraction [19]. The symmetry was lowered to in order to have six symmetry inequivalent Cu2+ sites, allowing for 13 spin configurations with distinct energies, thus enabling the extraction of the exchange couplings , , , and by energy mapping [32, 33].
III.2 Results
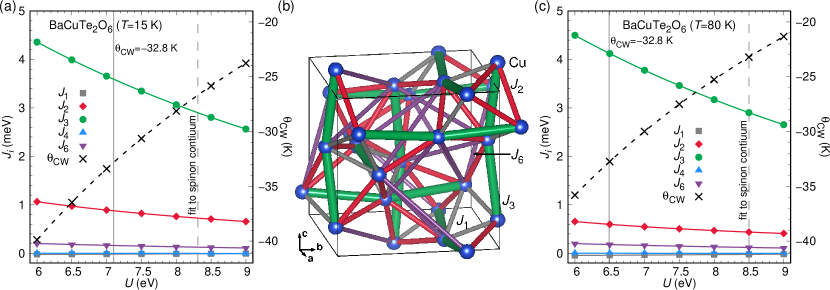
Figure 8 (a) shows the strengths of the exchange interactions , , , and resulting from the DFT energy mapping for the structure determined at K using powder neutron diffraction [10]. Figure 8 (c) shows the same couplings, but calculated for the x-ray diffraction structure determined at K [19]. Since the onsite Coulomb repulsion of the Cu orbitals is unknown, the couplings were extracted for seven values of within the expected range of 6 to 9 eV, while the Hund’s rule coupling strength was kept constant at 1 eV as this has been shown to describe many Cu2+ compounds correctly [34, 35]. As there is no a priori way to know the parameter, the energy mapping method needs additional information to fix the overall energy scale of the interactions. Usually, the experimental Curie Weiss temperature is used for this purpose. We can calculate it from the exchange couplings via
| (1) |
where . The value of K extracted from DC magnetic susceptibility measurements () for \ceBaCuTe2O6 [10] leads to the on-site potential eV for the K crystal structure, indicated in Fig. 8 (a) by the solid vertical gray line and corresponds to the set of couplings meV, meV, meV, meV, meV. The same criterion for the K structure (Fig. 8 (c)) corresponds to eV, yielding meV, meV, meV, meV, meV.
In the case of \ceBaCuTe2O6, the comparison of the expression for the spinon continuum to the high energy INS spectrum as detailed in the previous section and Ref. [10], provides another criterion for the overall energy scale by fixing the largest exchange interaction at meV. Evaluating the DFT calculation in this way leads to the Coulomb interaction eV for the K crystal structure (dashed vertical gray line in Fig. 8 (a)), resulting in the set of exchange parameters meV, meV, meV, meV, meV. The energy scale of these interactions is somewhat smaller that those based on and yields K. The same evaluation for the K structure (Fig. 8 (c)) yields eV and meV, meV, meV, meV, meV and corresponds to a Curie-Weiss temperature of K. This last set of couplings is in excellent agreement with the calculation reported in Ref. 19 for the same 80 K crystal structure. All these DFT results are listed for comparison in Table 2. One unusual feature of the Heisenberg Hamiltonian thus obtained is the fact that the shortest exchange path ( Å) is found to have only a negligible exchange interaction which is less than 1% of the dominant exchange . This must be due to the involved geometry of the material; the shortest superexchange paths for both couplings are Cu-O-Ba-O-Cu, but the path for is much more bent than the path for . However, in long paths like this, complex cancellation effects which are not accessible to simple arguments are possible.
For a given structure, the two sets of exchange interactions are very consistent despite the difference in overall energy scale. The details of the energy dispersions will be governed by the ratios and . For the K structure, the ratios are almost the same, being and for the interactions based on the Curie-Weiss temperature from , and and for the interactions based on the INS value. The K structure gives the ratios and for the criterion and and for the INS criterion.
IV Discussion
The Hamiltonians derived from the DFT calculations for the two different crystal structures and the INS data are in good qualitative agreement. They both show \ceBaCuTe2O6 to be dominated by an antiferromagnetic which results in quantum spin chains running parallel to the crystallographic a, b and c-axes. The important subleading exchange is the hyperkagome interaction which couples the chains together and gives rise to long-range antiferromagnetic order. Other weaker interactions that may be present are and/or .
Table 2 compares the DFT and INS results. Both the DFT interactions based on the Curie-Weiss temperature and on the INS value are listed. The accuracy of the value of Curie-Weiss temperature determined from the DC susceptibility data is of course important to determine the correct interactions by the first method. A significantly smaller value of K was indeed previously found [19] showing the possible range of this quantity. However, according to Fig. 8 (a) and (c) this small would imply, at eV, values of onsite interaction that are unusually large for Cu2+. On the other hand, an accurate value of is required to determine the interactions by the second method. was found by comparing the lower boundary of the spinon continuum observed in the high energy INS data to the des Cloiseaux-Pearson expression [26]. It should be noted that this expression is for an ideal chain without interchain coupling. The presence of weak interchain coupling in \ceBaCuTe2O6 would probably reduce the renormalisation factor of leading to an underestimation of although this effect should be small.
The choice of criterion, or influences the overall scale of the interactions while maintaining the ratios of these interactions. On the other hand, the two different structures considered have somewhat different ratios of the interactions, with being larger in the case of the K structure than the K structure. As the exchange paths for and are complicated and the two crystal structures are very similar, no simple explanation based on perturbation theory arguments can be found. It is clear that the DFT result are highly sensitive to the structure and this underlines the importance of precise experimental determination of oxygen positions in correlated oxides. It should be noted however that the present DFT result for the K structure are very similar to those given in Ref. [19] which also used this structure.
The fitting of the low energy INS spectrum below to spin-wave theory gives a range of possible solutions for the interchain interactions which agree equally well with the data, where the values of and were found to be highly coupled. For meV the constraints were meV and meV, while a weak value of (either AFM or FM) was possible but difficult to extract from the data. Two example solutions are given in Table 2. It should be noted that the excitations of frustrated magnets tend to be renormalized downward compared to spin-wave theory due to quantum fluctuations. Since the and interactions of \ceBaCuTe2O6 are frustrated, when fitting the low energy and low temperature excitations to spin-wave theory, an underestimation of these interaction values could occur.
| DFT (15 K struct.) | |||||
| =-32.8K | -0.02(1) | 0.88(1) | 3.59(1) | 0.00(1) | 0.16(1) |
| DFT (15 K struct.) | |||||
| =33.7K | -0.01(1) | 0.73(1) | 2.90(1) | 0.00(1) | 0.13(1) |
| DFT (80 K struct.) | |||||
| =-32.8K | -0.04(1) | 0.60(1) | 4.13(1) | 0.00(1) | 0.18(1) |
| DFT (80 K struct.) | |||||
| =33.7K | -0.02(1) | 0.44(1) | 2.90(1) | 0.00(1) | 0.12(1) |
| DFT (80 K struct.) | |||||
| Ref. [19] | 0 | 0.43 | 2.93 | 0 | 0.17 |
| INS data | |||||
| e.g. 1: max | 0.34 | 0.44 | 2.90 | 0.0 | |
| INS data | |||||
| e.g. 2: | 0.0 | 0.27 | 2.90 | 0.0 |
On a quantitative level, the INS results give the ratio of in the range 5.8 - 15.2 %, which is lower than the DFT value of 25 % for the K structure, however it does include the 80 K structure DFT prediction of 15%. Concerning the other interactions, DFT predicts to be close to zero while is weakly antiferromagnetic. In contrast INS finds a small but finite value of for most solutions while the value of is small and cannot be determined. There is one INS solution where is zero which requires % - a ratio somewhat lower than the DFT predictions which however can be explained by the presence of quantum fluctuations (see discussion above). On the other hand, taking the maximum allowed INS ratio of % results in an AFM of 0.34 meV somewhat larger than the DFT prediction (see Table 2).
BaCuTe2O6 can be compared to its isostructural sister compounds SrCuTe2O6 and \cePbCuTe2O6. While for \cePbCuTe2O6 the dominant antiferromagnetic and interactions lead to a highly frustrated possible spin liquid ground state, in SrCuTe2O6 the chain interaction is AFM and dominant as we find here for \ceBaCuTe2O6. For SrCuTe2O6, meV [12, 16, 13, 17, 19] while the value is smaller at 2.90 meV for \ceBaCuTe2O6 [10, 19].
In SrCuTe2O6, the subleading interactions that couple the chains together and bring long-range magnetic order in the irreducible representation, are either the combination of an AFM with a weaker FM [17] or a FM and an AFM [17, 19]. In contrast, for \ceBaCuTe2O6 the long-range order forms in the irreducible representation [10] which we show here to be stabilized by an AFM interaction while weaker or interactions may also be present.
V Summary and Conclusions
In summary, we explored the magnetic excitations of the quantum spin chain antiferromagnet \ceBaCuTe2O6 using high resolution INS and found that the spinon continuum at the high and medium energy ranges gives way, at low energies and temperatures, to a complex series of spin-wave modes. While the spinon continuum fixes the values of the intrachain exchange constant, a spin-wave fit taking a renormalized value into account, successfully models the low energy spectrum. Good overall agreement was achieved for many energy and wavevector directions, by taking into consideration the energy resolution and integration ranges. The hyperkagome exchange interaction was shown to be the sub-leading antiferromagnetic term responsible for coupling the chains together, and a range of allowed antiferromagnetic values was found. was shown to be weaker and highly coupled to while could not be determined.
The exchange interactions were also calculated by DFT. In agreement with INS, DFT found that is antiferromagnetic and dominant and the next strongest interaction is an antiferromagnetic , a weak was also predicted while was close to zero. These calculations were surprisingly sensitive to the crystal structure so that the small difference between the structure at 80 K determined from X-ray diffraction and the 15 K structure from neutron diffraction resulted in a 40% change in the ratio of . Altogether, a qualitative picture of \ceBaCuTe2O6 emerges of a spin chain compound with frustrated antiferromagnetic hyperkagome interchain couplings, different from SrCuTe2O6 where these interactions are ferromagnetic or \cePbCuTe2O6 which is highly frustrated due to dominant antiferromagnetic and .
In conclusion, the CuTe2O6 family shows a surprising sensitivity to the -site ion and crystal structure, and continues to surprise us with the varied range of Hamiltonians that it harbours. We hope a deeper understanding of the structure-magnetic property relationship will be achieved in the future.
Acknowledgements.
We thank Jean-Sébastien Caux for his calculation of the dynamical structure factor of the spin-1/2 Heisenberg antiferromagnetic chain. B.L. acknowledges the support of Deutsche Forschungsgemeinschaft (DFG) through project B06 of SFB 1143: Correlated Magnetism: From Frustration To Topology (ID 247310070). The powder synthesis, crystal growth and physical properties measurements took place at the Core Lab Quantum Materials, Helmholtz Zentrum Berlin für Materialien und Energie, Germany. We gratefully acknowledge the Science and Technology Facilities Council (STFC) for access to neutron beamtime at the LET ISIS facility and also for the provision of sample preparation.References
- Koteswararao et al. [2014] B. Koteswararao, R. Kumar, P. Khuntia, S. Bhowal, S. K. Panda, M. R. Rahman, A. V. Mahajan, I. Dasgupta, M. Baenitz, K. H. Kim, and F. C. Chou, Magnetic properties and heat capacity of the three-dimensional frustrated antiferromagnet \cePbCuTe2O6, Phys. Rev. B 90, 035141 (2014).
- Khuntia et al. [2016] P. Khuntia, F. Bert, P. Mendels, B. Koteswararao, A. V. Mahajan, M. Baenitz, F. C. Chou, C. Baines, A. Amato, and Y. Furukawa, Spin liquid state in the 3d frustrated antiferromagnet \cePbCuTe2O6: Nmr and muon spin relaxation studies, Phys. Rev. Lett. 116, 107203 (2016).
- Chillal et al. [2020a] S. Chillal, Y. Iqbal, H. O. Jeschke, J. A. Rodriguez-Rivera, R. Bewley, P. Manuel, D. Khalyavin, P. Steffens, R. Thomale, A. T. M. N. Islam, J. Reuther, and B. Lake, Evidence for a three-dimensional quantum spin liquid in \cePbCuTe2O6, Nat. Commun. 11, 2348 (2020a).
- Thurn et al. [2021] C. Thurn, P. Eibisch, A. Ata, U. Tutsch, Y. Saito, S. Hartmann, J. Zimmermann, A. R. N. Hanna, A. T. M. N. Islam, S. Chillal, B. Lake, B. Wolf, and M. Lang, Spin liquid and ferroelectricity close to a quantum critical point in \cePbCuTe2O6, npj Quantum Mater. 6, 95 (2021).
- Hanna et al. [2021] A. R. N. Hanna, A. T. M. N. Islam, R. Feyerherm, K. Siemensmeyer, K. Karmakar, S. Chillal, and B. Lake, Crystal growth, characterization, and phase transition of \cePbCuTe2O6, Phys. Rev. Mater. 5, 113401 (2021).
- Nakamura et al. [1997] A. H. Nakamura, K. Yoshimoto, M. Shiga, M. Nishi, and K. Kakurai, Strong antiferromagnetic spin fluctuations and the quantum spin-liquid state in geometrically frustrated -mn, and the transition to a spin-glass state caused by non-magnetic impurity, J. Phys.: Condens. Matter 9, 4701 (1997).
- Isakov et al. [2008] S. V. Isakov, J. M. Hopkinson, and H.-Y. Kee, Fate of partial order on trillium and distorted windmill lattices, Phys. Rev. B 78, 014404 (2008).
- Jin and Zhou [2020] H.-K. Jin and Y. Zhou, Classical and quantum order in hyperkagome antiferromagnets, Phys. Rev. B 101, 054408 (2020).
- Chern and Kim [2021] L. E. Chern and Y. B. Kim, Theoretical study of quantum spin liquids in hyper-hyperkagome magnets: Classification, heat capacity, and dynamical spin structure factor, Phys. Rev. B 104, 094413 (2021).
- Samartzis et al. [2021] A. Samartzis, S. Chillal, A. T. M. N. Islam, K. Siemensmeyer, K. Prokes, D. J. Voneshen, A. Senyshyn, D. Khalyavin, and B. Lake, Structural and magnetic properties of the quantum magnet \ceBaCuTe2O6, Phys. Rev. B 103, 094417 (2021).
- Momma and Izumi [2008] K. Momma and F. Izumi, J. Appl. Crystallogr. 41, 653 (2008).
- Ahmed et al. [2015] N. Ahmed, A. A. Tsirlin, and R. Nath, Multiple magnetic transitions in the spin- chain antiferromagnet \ceSrCuTe2O6, Phys. Rev. B 91, 214413 (2015).
- Koteswararao et al. [2015] B. Koteswararao, S. K. Panda, R. Kumar, K. Yoo, A. V. Mahajan, I. Dasgupta, B. H. Chen, K. H. Kim, and F. C. Chou, 27, 426001 (2015).
- Koteswararao et al. [2016] B. Koteswararao, K. Yoo, F. Chou, and K. Kim, Observation of magnetoelectric effects in a frustrated spin chain magnet \ceSrCuTe2O6, APL Mater. 4, 036101 (2016).
- Saeaun et al. [2020] P. Saeaun, Y. Zhao, P. Piyawongwatthana, T. J. Sato, F. C. Chou, M. Avdeev, G. Gitgeatpong, and K. Matan, Magnetic properties and magnetic structure of the frustrated quasi-one-dimensional antiferromagnet \ceSrCuTe2O6, Phys. Rev. B 102, 134407 (2020).
- Chillal et al. [2020b] S. Chillal, A. T. M. N. Islam, H. Luetkens, E. Canévet, Y. Skourski, D. Khalyavin, and B. Lake, Magnetic structure of the quantum magnet \ceSrCuTe2O6, Phys. Rev. B 102, 224424 (2020b).
- Chillal et al. [2021] S. Chillal, A. T. M. N. Islam, P. Steffens, R. Bewley, and B. Lake, Weak three-dimensional coupling of Heisenberg quantum spin chains in \ceSrCuTe2O6, Phys. Rev. B 104, 144402 (2021).
- Mermin and Wagner [1966] N. D. Mermin and H. Wagner, Absence of ferromagnetism or antiferromagnetism in one- or two-dimensional isotropic Heisenberg models, Phys. Rev. Lett. 17, 1133 (1966).
- Bag et al. [2021] P. Bag, N. Ahmed, V. Singh, M. Sahoo, A. A. Tsirlin, and R. Nath, Low-dimensional magnetism of \ceBaCuTe2O6, Phys. Rev. B 103, 134410 (2021).
- Caux and Maillet [2005] J.-S. Caux and J. M. Maillet, Computation of dynamical correlation functions of Heisenberg chains in a magnetic field, Phys. Rev. Lett. 95, 077201 (2005).
- [21] R. Bewley, J. Taylor, and S. Bennington., Nucl. Instrum. Methods Phys. Res., Sect. A 10.1016/j.nima.2011.01.173.
- Lake et al. [2017] B. Lake, A. Samartzis, E. Klyushina, N. Islam, and D. Voneshen, Investigation of a new three-dimensional frustrated quantum magnet https://doi.org/10.5286/ISIS.E.RB1710246 (2017).
- Ewings et al. [2016] R. Ewings, A. Buts, M. Le, J. van Duijn, I. Bustinduy, and T. Perring, Horace: Software for the analysis of data from single crystal spectroscopy experiments at time-of-flight neutron instruments, Nucl. Instrum. Methods Phys. Res., Sect. A 834, 132 (2016).
- Le et al. [2014] M. D. Le, M. Skoulatos, D. L. Quintero-Castro, R. Toft-Petersen, F. Groitl, K. C. Rule, and K. Habicht, The upgraded cold neutron three-axis spectrometer FLEXX at BER II at HZB, Neutron News 25, 19 (2014).
- Toth and Lake [2015] S. Toth and B. Lake, Linear spin wave theory for single-Q incommensurate magnetic structures, J. Phys.: Condens. Matter 27, 166002 (2015).
- des Cloizeaux and Pearson [1962] J. des Cloizeaux and J. J. Pearson, Spin-wave spectrum of the antiferromagnetic linear chain, Phys. Rev. 128, 2131 (1962).
- Lake et al. [2000] B. Lake, D. A. Tennant, and S. E. Nagler, Novel longitudinal mode in the coupled quantum chain compound \ceKCuF3, Phys. Rev. Lett. 85, 832 (2000).
- Lake et al. [2005a] B. Lake, D. A. Tennant, and S. E. Nagler, Longitudinal magnetic dynamics and dimensional crossover in the quasi-one-dimensional spin- heisenberg antiferromagnet , Phys. Rev. B 71, 134412 (2005a).
- Lake et al. [2005b] B. Lake, D. A. Tennant, C. D. Frost, and S. E. Nagler, Quantum criticality and universal scaling of a quantum antiferromagnet, Nature Materials 4, 329 (2005b).
- Koepernik and Eschrig [1999] K. Koepernik and H. Eschrig, Full-potential nonorthogonal local-orbital minimum-basis band-structure scheme, Phys. Rev. B 59, 1743 (1999).
- Perdew et al. [1996] J. P. Perdew, K. Burke, and M. Ernzerhof, Generalized gradient approximation made simple, Phys. Rev. Lett. 77, 3865 (1996).
- Guterding et al. [2016] D. Guterding, R. Valentí, and H. O. Jeschke, Reduction of magnetic interlayer coupling in barlowite through isoelectronic substitution, Phys. Rev. B 94, 125136 (2016).
- Iqbal et al. [2017] Y. Iqbal, T. Müller, K. Riedl, J. Reuther, S. Rachel, R. Valentí, M. J. P. Gingras, R. Thomale, and H. O. Jeschke, Signatures of a gearwheel quantum spin liquid in a spin- pyrochlore molybdate heisenberg antiferromagnet, Phys. Rev. Mater. 1, 071201 (2017).
- Jeschke et al. [2013] H. O. Jeschke, F. Salvat-Pujol, and R. Valentí, First-principles determination of Heisenberg Hamiltonian parameters for the spin- kagome antiferromagnet \ceZnCu3(OH)6Cl2, Phys. Rev. B 88, 075106 (2013).
- Jeschke et al. [2015] H. O. Jeschke, F. Salvat-Pujol, E. Gati, N. H. Hoang, B. Wolf, M. Lang, J. A. Schlueter, and R. Valentí, Barlowite as a canted antiferromagnet: Theory and experiment, Phys. Rev. B 92, 094417 (2015).