A Census of WISE-selected Dual and Offset AGN Across the Sky: New Constraints on Merger-Driven Triggering of Obscured AGN
Abstract
Pairs of galaxies hosting active galactic nuclei (AGN) are powerful probes of merger-driven supermassive black hole (SMBH) growth as they can resolve individual AGN and trace mergers over a large range of physical separations. To exploit this on a large scale for the first time for both obscured and unobscured AGN, we use photometric redshifts of AGN selected by the Wide-field Infrared Survey Explorer (WISE) to find probabilistic pairs (100 kpc separations) across the sky, along with a comparison sample of inactive galaxy pairs. Our final sample of integrated pair probabilities yields 198 AGN-AGN pairs (dual AGN) and 2767 AGN-galaxy pairs (offset AGN) with uniformly measured AGN and host galaxy physical properties. We find the fraction of galaxy pairs hosting WISE AGN is dominated by offset AGN and significantly elevated above that of inactive galaxies for large host stellar masses. We show how the AGN merger fraction directly increases with AGN extinction for both offset and dual AGN, with up to 40% of heavily obscured AGN found in galaxy pairs. Elevated AGN merger fractions coincide with increased host specific star formation rates that suggest merger-driven co-evolution of galaxies and SMBHs. Among dual AGN, the most rapid SMBH growth may occur within the less massive galaxy. Relative to stochastic mechanisms, mergers produce an excess of AGN at increasingly smaller separations, especially for obscured AGN (up to a factor of 5), and augmented by correlated triggering. Finally, this excess is stronger than for lower luminosity optically-selected AGN, regardless of AGN obscuration level.
1 Introduction
Supermassive black holes (SMBHs; ) at the centers of galaxies primarily grow through accretion of matter, during which time they appear as active galactic nuclei (AGN). Theory predicts that fueling of the most massive SMBHs can be driven efficiently by interactions and mergers of gas-rich galaxies that deliver gas and dust to galaxy nuclei through gravitational dynamical forces (e.g. Hernquist, 1989; Mihos & Hernquist, 1996; Hopkins et al., 2008; Van Wassenhove et al., 2012; Blecha et al., 2017). Additionally, mergers can induce star-formation and randomize stellar orbits in the host galaxies, contributing to SMBH-galaxy co-evolution (e.g. Di Matteo et al., 2005; Springel et al., 2005; Capelo et al., 2017).
However, a comprehensive observational picture of the role that mergers play in AGN triggering has remained elusive. In particular, whether galaxy mergers are necessary for explaining a significant fraction of the observed AGN population, or if their accretion is largely driven by stochastic processes within their host galaxies, is currently unclear. Indeed, a large number of works based on morphologically-selected mergers find that AGN do not preferentially reside in mergers (e.g. Georgakakis et al., 2009; Kocevski et al., 2012; Simmons et al., 2012; Villforth et al., 2014; Mechtley et al., 2015; Villforth et al., 2016; Farrah et al., 2017).
Obscuration of AGN (which can be significant in galaxy mergers; e.g. Sanders et al., 1988; Satyapal et al., 2017) is often posited as a possible explanation for tenuous AGN-merger connections. For example, while the sensitivity of X-rays to AGN emission and their high energies make that observational regime effective at studying AGN in merging environments (e.g. Comerford et al., 2015; Barrows et al., 2016, 2017a; Ricci et al., 2017, 2021; De Rosa et al., 2022), Compton scattering heavily attenuates X-ray photons at large neutral hydrogen column densities. Therefore, many heavily obscured AGN will elude X-ray surveys (Koss et al., 2022, e.g.; though this issue would be mitigated by a sensitive hard X-ray observatory, such as the High Energy X-ray Probe mission concept; Madsen et al. 2019), whereas models predict that Compton thick AGN may account for 10 40% of the AGN population (e.g. Gilli et al., 2007; Treister et al., 2009; Ueda et al., 2014).
The observational hurdle of detecting obscured AGN on a large and uniform scale is overcome using the Wide-field Infrared Survey Explorer (WISE; Wright et al., 2010). WISE has surveyed the entire sky in four mid infrared (MIR) bands - ( 3.4 µm), ( 4.6 µm), ( 12.1 µm), and ( 22 µm) - which are much less sensitive than X-rays to obscuration. Furthermore, the color efficiently distinguishes between the blackbody spectral shape of galaxies and the typical powerlaw spectral shape of AGN at MIR wavelengths (e.g. Ashby et al., 2009; Assef et al., 2010; Jarrett et al., 2011; Stern et al., 2012; Mateos et al., 2012; Assef et al., 2013; Secrest et al., 2015; Assef et al., 2018), enabling the selection of both obscured and unobscured AGN using WISE photometry. Indeed, several observational works show that galaxy pairs have an elevated number density of WISE-selected AGN relative to isolated galaxies (e.g. Satyapal et al., 2014; Weston et al., 2017; Goulding et al., 2018; Gao et al., 2020).
However, simulations strongly suggest that the link between AGN and galaxy mergers has a complex dependence on host galaxy properties. Specifically, though several studies have noted a dependence of the AGN merger fraction on AGN luminosity (e.g. Treister et al., 2012; Glikman et al., 2015; Barrows et al., 2017a), some simulations and models predict those trends are determined by host galaxy stellar mass (e.g. Steinborn et al., 2016; Weigel et al., 2018), while others suggest they are driven by merger-induced dynamical forces (e.g. McAlpine et al., 2020; Byrne-Mamahit et al., 2022). Furthermore, the sensitivity of AGN triggering to mergers is expected to increase toward later merger stages (e.g. Van Wassenhove et al., 2012; Stickley & Canalizo, 2014; Capelo et al., 2015). Mergers are also predicted to enhance AGN extinction (e.g. Blecha et al., 2017), but the obscuring material may be strongly connected to the galaxy-wide supply of gas and dust. Testing these predictions requires disentangling the intrinsic AGN and host galaxy physical properties for samples of obscured and unobscured AGN. To this end, we recently constructed a catalog of host galaxies, photometric redshifts, and physical properties for WISE-selected AGN (Barrows et al., 2021) based on broadband spectral energy distributions (SEDs).
In this paper, we use the photometric redshift () probability distribution functions (PDFs) of that sample and the methodology employed in probabilistic galaxy merger rate estimates to analyze the effects of galaxy pairing and merging on AGN triggering, obscuration, and accretion rates. The broadband SED models (consisting of AGN and galaxy templates) provide uniform estimates of intrinsic AGN and host galaxy properties. Moreover, the sample is selected such that the AGN are spatially associated with distinct, resolved galaxies to avoid source confusion and biases due to morphological selection. This feature permits us to distinguish between pairs with only one AGN (offset AGN) and those with two AGN (dual AGN) to test the impact of mergers on correlated AGN triggering.
While many examples of serendipitously discovered dual AGN exist (e.g. Komossa et al., 2003; Guainazzi et al., 2005; Hudson et al., 2006; Bianchi et al., 2008; Piconcelli et al., 2010; Koss et al., 2011; Mazzarella et al., 2012; Hou et al., 2022), few systematically constructed samples exist (e.g. Liu et al., 2011; Koss et al., 2012; Hou et al., 2020), and even fewer are sensitive to obscured AGN (e.g. Müller-Sánchez et al., 2015; Weston et al., 2017), with all relying on spectroscopic redshifts that severely limit the sample sizes. By incorporating photometric detections and probabilistic pairs across the sky, this analysis takes advantage of the vast numbers of WISE AGN to identify many previously unknown pairs and to construct the largest sample of galaxy mergers with obscured AGN.
This paper is structured as follows: in Section 2 we describe our methodology for computing pair probabilities, in Section 3 we describe our measurements of redshift-dependent physical properties and merger fractions, in Section 4 we test whether mergers contribute significantly to the population of MIR-selected AGN, in Section 5 we examine how merger-driven AGN triggering impacts AGN accretion rates, AGN obscuration, and host galaxy star formation, in Section 6 we examine how mergers enhance triggering of obscured and unobscured AGN throughout the merger process, and in Section 7 we present our conclusions. Throughout we assume a flat cosmology defined by the nine-year Wilkinson Microwave Anisotropy Probe observations (Hinshaw et al., 2013): 69.3 km Mpc-1 s-1 and 0.287.
2 Procedure
Here we describe our procedure. In Section 2.1 we provide an overview of the parent sample of WISE AGN, and in Section 2.2 we describe the comparison sample of galaxies. In Section 2.3 we detail our methodology for finding photometric pairs. Lastly, in Section 2.4 we compare our results with the spectroscopic subset.
2.1 WISE AGN Sample
We use the wide-area catalog of host galaxies for WISE-selected AGN (Barrows et al., 2021) which is based on the AllWISE data release111https://wise2.ipac.caltech.edu/docs/release/allwise/. The catalog footprint covers the whole sky above 30∘ declination (minus solid angles within 10∘ of the Galactic Plane and 30∘ of the Galactic Center; 23,259 deg2 total), and consists of 695,273 WISE-selected AGN (90% reliability selection from Assef et al., 2018) with photometric redshifts and associated distance properties of the AGN and host galaxies. These estimates were obtained from model fits to broadband SEDs covering ultraviolet to MIR wavelengths. In addition to the WISE bands, this photometry comes from the Galaxy Evolution Explorer, the Sloan Digital Sky Survey (SDSS) Data Release 14 (DR14), Gaia DR2, the Panoramic Survey Telescope and Rapid Response System DR2, and the Two Micron All Sky Survey. We refer the reader to Barrows et al. (2021) for further details.
2.2 Galaxy Sample
To test if AGN are biased toward merging environments relative to inactive galaxies and if mergers have a higher fraction of AGN, we build a sample of galaxies from the SDSS DR17 table of photometric galaxies. We choose this catalog because its footprint provides the largest uniform overlap with the WISE AGN parent sample and provides similar survey coverage for estimates (Section 2.3.1). We further limit the galaxies to the same area as the WISE AGN parent sample (Section 2.1) and require them to satisfy the same WISE photometric quality criteria applied to the WISE AGN selection: 8, 7, and S/N 5 for . Doing so builds a galaxy sample that is subject to all selection criteria of the parent WISE AGN sample except for the MIR AGN color selection (14,975,571 galaxies total). Within this galaxy sample, 0.7% are in the WISE AGN parent sample, with the remainder not satisfying the WISE AGN selection criteria.
2.3 Photometric Pairs
Our procedure for computing pair probabilities uses the full PDFs (e.g. Fernández-Soto et al., 2002; Cunha et al., 2009) to avoid the uncertainties imposed by a strict velocity separation criterion. We follow the methodology of López-Sanjuan et al. (2010, 2015) and its application to photometric samples for computing galaxy merger fractions (e.g. Duncan et al., 2019; Rodriguez et al., 2020). This consists of generating PDFs (Section 2.3.1), correcting the PDFs (Section 2.3.2), and computing pair probabilities (Section 2.3.3).
2.3.1 Photometric Redshifts
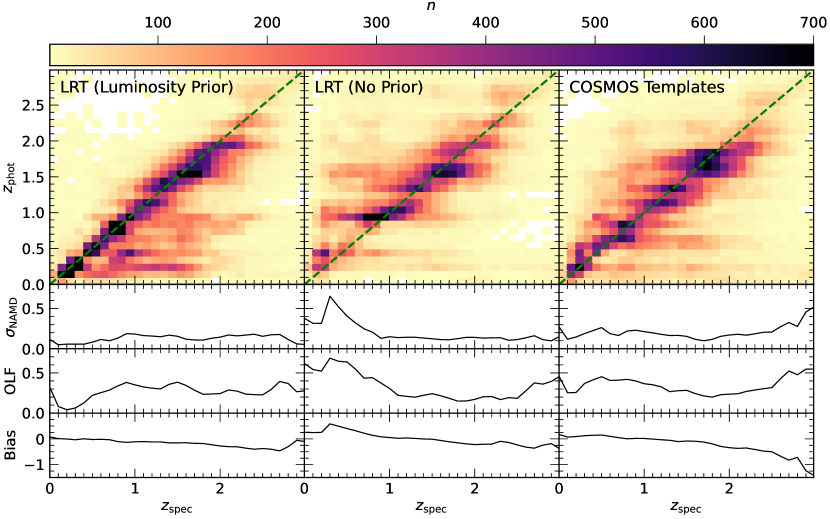
The values and PDFs for the parent WISE AGN sample (Section 2.1) were previously generated in Barrows et al. (2021) using the Low-Resolution Templates (LRT; Assef et al., 2010) while applying a physically motivated galaxy luminosity prior (Assef et al., 2008). Since the pair probability methodology relies critically on the shapes of the PDFs, for comparison we also compute values applying two different template/prior combinations to the same sets of photometry. For the first, we use the LRT without any priors. For the second, we use a larger set of empirical templates with mixed galaxy and AGN contributions developed from the Cosmic Evolution Survey (COSMOS; Scoville et al., 2007) field (Polletta et al., 2007; Salvato et al., 2009, 2011). When using the COSMOS templates, we apply a prior (based on band magnitude and redshift) that is empirically fit to the data. These additional fits are optimized using LePhare (Arnouts et al., 1999; Ilbert et al., 2006), and we apply the same reduced chi-squared threshold as in Barrows et al. (2021).
The quality for all three sets of estimates is quantified graphically in Figure 1 by comparison to spectroscopic redshifts (; for uniformity, this is limited to the subset within the SDSS DR17 spectroscopic sample). We quantify the accuracy using the normalized median absolute deviation (NMAD; Hoaglin et al., 1983) metric of 1.48 median(), where , and the outlier fraction (OLF; defined as the fraction with 0.15). The estimates from the LRT with the luminosity prior applied ( and OLF ) are overall better than those obtained without the prior ( and OLF ) or from the COSMOS templates ( and OLF ). Hence, we adopt these PDFs when computing pair probabilities. However, as shown in Assef et al. (2010), while the luminosity prior reduces the overall scatter, it also introduces a systematic offset toward underestimated values, resulting in a larger bias (median ) than without the prior (median ) or with the COSMOS templates (median ).
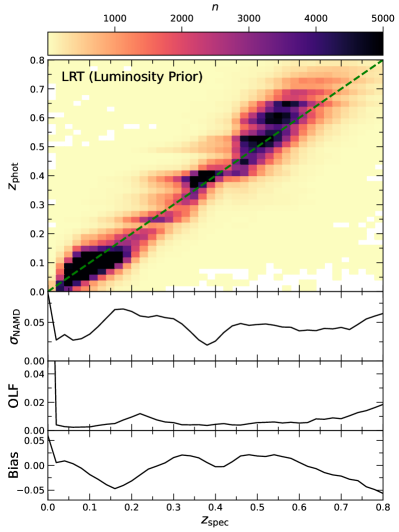
We then compute values for the galaxy sample (Section 2.2) using the LRT with the luminosity prior applied (for uniform comparison with the optimal AGN estimates). The galaxy accuracy is quantified graphically in Figure 2 and yields , OLF , and bias .
2.3.2 Photometric Redshift PDF Corrections
Due to the inherent variety of SED shapes compared to the templates used to fit them, the PDFs will not perfectly reflect the true uncertainties of the estimates. These deviations will also be affected by the specific minimization algorithms used (i.e. LRT versus LePhare). Therefore, we correct the PDFs of the full WISE AGN and galaxy samples following the procedure from Wittman et al. (2016) and as implemented in Duncan et al. (2018). Using the subset with values from the SDSS DR17, for each PDF (P) we solve for a magnitude-dependent correction (the SDSS spectroscopic coverage is 25% and 30% for the WISE AGN and galaxy samples, respectively). The corrected PDF is , and for greater than the reference magnitude (otherwise ). For the reference magnitude, we use the band and a value of 18. The magnitude-dependent correction accounts for potential biases in magnitude between the spectroscopic and photometric samples.
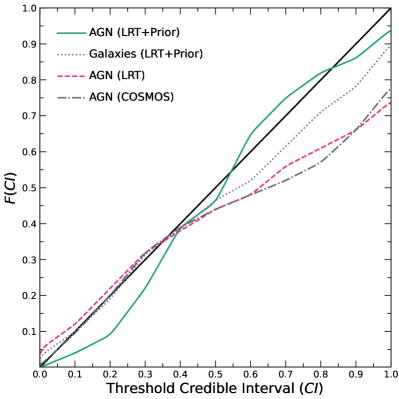
We then compute the fraction of sources with values within a given credible interval, : . For example, the 10% is the redshift range around the PDF peak value within which the integrated probability is equal to 10% of the total PDF probability. We then use EMCEE (Foreman-Mackey et al., 2013) to solve for the value of that minimizes the offset of from the expected fraction defined by the if the PDFs perfectly represent the uncertainties for the aggregate sample (i.e. the one-to-one relation). The results are shown for the WISE AGN and galaxies in Figure 3.
2.3.3 Pair Probabilities
Following López-Sanjuan et al. (2015), we compute the redshift-dependent line-of-sight pair probabilities where the subscripts ‘1’ and ‘2’ denote the two sources in each pair. A source can be part of more than one pair, and each unique pair probability distribution is determined separately.
We compute these probability distributions for pairs of WISE AGN (dual AGN) and WISE AGN (within the galaxy sample) paired with galaxies without WISE AGN (offset AGN). We also compute probabilities for pairs of galaxies without WISE AGN (galaxy pairs). The total numbers of dual AGN, offset AGN, and galaxy pairs within a given redshift range (, , and , respectively) are computed by summing the pair probabilities of all unique dual AGN, offset AGN, and galaxy pairs (, , and , respectively), integrated over the redshift limits ( and ):
For all pair probability functions, the range defined by and is restricted to values for which the pair angular separation corresponds to a projected physical separation of 100 kpc. This limit is chosen to investigate the full range of physical separations over which simulations predict that mergers affect galaxy and AGN properties. These criteria yield a total of 198 dual WISE AGN (47 of which are in the SDSS galaxy sample) and 2767 offset WISE AGN out to 3. Since this study is the first to use these WISE AGN PDFs for pair identification, these dual and offset AGN pair probabilities were previously unknown. For comparison, using a strict velocity offset upper limit of 500 km s-1 among the subset with SDSS DR17 spectra, the numbers of spectroscopic dual and offset WISE AGN are only 6 and 16, respectively.
The total numbers of parent WISE AGN and galaxies ( and , respectively) are similarly computed by summing the PDFs of all AGN and galaxies ( and , respectively), integrated over the same redshift limits:
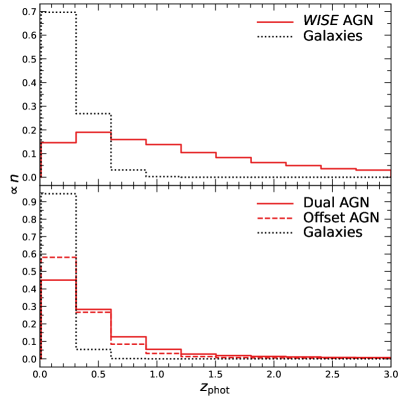
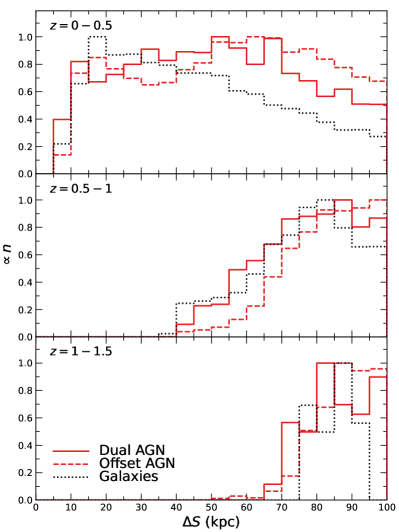
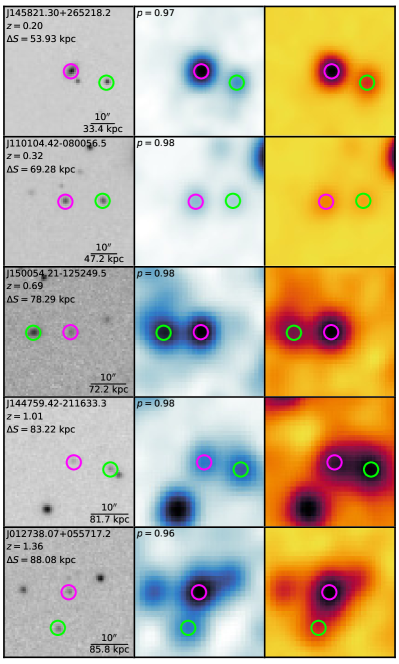
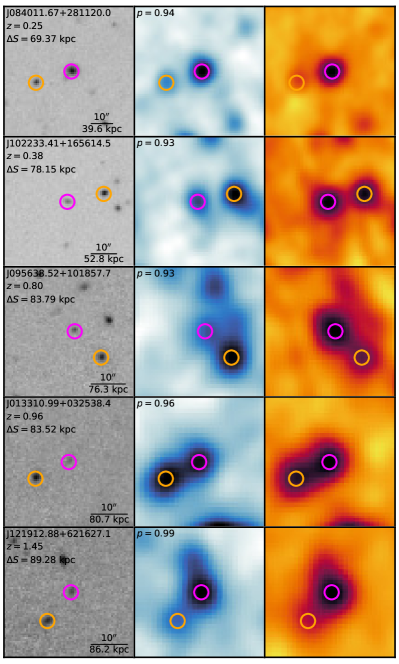
The PDFs of the parent WISE AGN and galaxy samples are shown in Figure 4, along with the pair probabilities of the dual AGN, offset AGN, and galaxy pairs. Compared to the AGN, the galaxies exhibit a strong bias toward lower redshifts, and the 100 kpc requirement biases all pairs toward lower redshifts. The probability-weighted values are shown in Figure 5, where the resolvable physical separations are seen to significantly increase with redshift (this is accounted for when computing merger fractions; Section 3). Figures 6 and 7 show examples of WISE dual and offset AGN, respectively, with integrated pair probabilities of 0.90.
2.4 Comparison with Spectroscopic Pairs
To test the efficacy of the procedure described in Section 2.3 for finding photometric pairs, as in Duncan et al. (2019) we compare the number of pairs identified from photometry against the number based on velocity offsets from the SDSS DR17 values. In addition to the 100 kpc criterion, we consider spectroscopic pairs to be those with velocity offsets within 1000 km s-1 (while this threshold is larger than the commonly adopted value of 500 km s-1, we choose it so that at least two spectroscopic sources are in each redshift bin). Photometric pairs are computed as described in Section 2.3.3 from the spectroscopic sample.
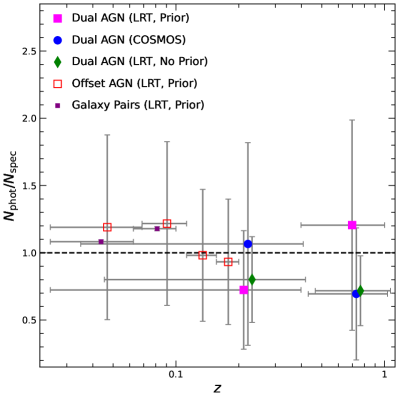
The ratio of the number of photometric pairs () to the number of spectroscopic pairs () is shown in Figure 8 for dual AGN, offset AGN, and galaxy pairs. Due to the relatively small numbers of spectroscopic dual WISE AGN, we also show these results using the two additional estimates described in Section 2.3.1. Relative to the dual AGN, the offset AGN and galaxy pairs probe a lower redshift range (a result of the shallower SDSS photometric galaxy sample; Figure 4). The ratios are consistent with unity over the redshift range examined ( 0 1, based on the available spectroscopic pairs) for dual AGN, offset AGN, and galaxy pairs, and among the different sets of photometric redshift estimates. For comparison, when adopting a velocity offset threshold of 500 km s-1, the ratios are still all consistent with unity, though with larger uncertainties.
3 Redshift-Dependent Physical Properties and Mass-Completeness
Since physical distance properties are dependent on the estimates, the AGN properties of bolometric luminosity () and obscuration (color excess; ) as a function of redshift are determined by fitting the LRT models (galaxy templates plus an extinguished AGN template) to the SEDs of the WISE AGN over a grid of redshifts that covers the full range explored in the estimate step (Section 2.3.1). Likewise, the host galaxy properties of stellar mass () and star formation rate (SFR) are determined by fitting galaxy models using the Code Investigating GALaxy Emission (CIGALE; Noll et al., 2009; Boquien et al., 2019), as in Barrows et al. (2021), to the SEDs of the galaxies and AGN (after subtracting the fitted observed AGN component) over the same redshift grid.
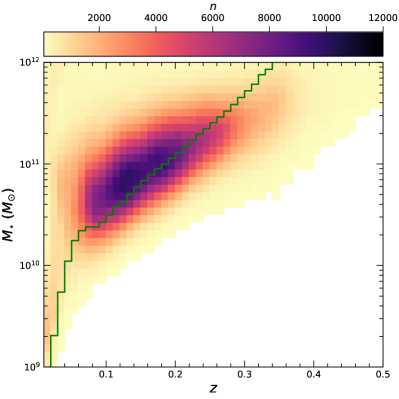
For estimating merger fractions, we define a flux-based and redshift-dependent stellar mass lower limit. Following the procedures outlined in Pozzetti et al. (2010) and Darvish et al. (2015), at each redshift step we compute this limit as the 95th percentile of the limiting masses (Figure 9). Since we limit the AGN merger fractions to the subset in the galaxy sample (for comparison with the non-AGN merger fractions), we compute this limit for the galaxy sample and adopt a limit of 19 (this omits the faintest 10% of the galaxies) for computing the limiting masses. We also impose strict lower and upper stellar mass limits of and , respectively. We then compute the fraction of unique AGN in offset and dual systems ( and , respectively) and the fraction of unique galaxies in galaxy pairs (). All sources are subject to the redshift integration limits for which the corresponding values of satisfy these requirements so that they are complete down to a common limiting stellar mass at each redshift. Since these fractions are ratios of individual sources, we can test them as a function of individual galaxy or AGN properties (Sections 4 and 5).
Furthermore, since the pair samples span a large range of the merger sequence, we develop two subsamples using bins of even size along the distribution: 10 40 kpc and 40 70 kpc. These bins are chosen to optimize the subsample sizes while also exploring out to separations over which mergers are predicted to influence galaxy properties (e.g. Van Wassenhove et al., 2012; Stickley & Canalizo, 2014; Capelo et al., 2015). So that the merger fractions are complete down to the lower limit, we restrict all probability distributions of the two subsamples to 0.08 and 0.58, corresponding to 10 kpc and 40 kpc for an angular separation of 6′′ (the resolution limit of WISE AGN pairs imposed by the band detections).
4 WISE-Selected AGN Are Preferentially Found in Offset or Dual Systems
Numerical simulations ubiquitously demonstrate that the dynamics of galaxy mergers can efficiently trigger AGN (e.g. Hernquist, 1989; Mihos & Hernquist, 1996; Hopkins et al., 2008; Van Wassenhove et al., 2012; Capelo et al., 2015; Blecha et al., 2017). However, AGN can also be triggered by stochastic processes that occur within galaxies (e.g. Lynden-Bell, 1979; Sellwood, 1981; van Albada & Roberts Jr, 1981; Combes & Gerin, 1985; Pfenniger & Friedli, 1991; Heller & Shlosman, 1994; Bournaud & Combes, 2002; Athanassoula, 2003; Sakamoto et al., 1999). If these internal galaxy processes are the dominant mechanisms for triggering accretion onto SMBHs, then galaxy mergers may be largely incidental to the AGN population.
Investigating the role of galaxy mergers among AGN requires comparison with control samples of galaxies without AGN to determine if accreting SMBHs show a preference for existing in merging environments. Variations of this test have been used in numerous studies and with a wide range of results. Some find an elevated fraction of AGN in mergers compared to non-mergers (e.g. Ellison et al., 2011; Silverman et al., 2011; Ellison et al., 2013; Satyapal et al., 2014; Weston et al., 2017; Goulding et al., 2018; Gao et al., 2020), while others find no AGN fraction enhancement for galaxies with disturbed morphologies (e.g. Kocevski et al., 2012; Villforth et al., 2014; Mechtley et al., 2015; Villforth et al., 2016; Jin et al., 2021; Silva et al., 2021) or in disk-dominated galaxies (e.g. Georgakakis et al., 2009; Simmons et al., 2012). These disagreements span a variety of morphological selection methods and exist for AGN selected from both optical and X-ray observations. However, as discussed in Section 1, studies utilizing MIR AGN selection do generally find a preference for AGN to be found in mergers (e.g. Satyapal et al., 2014; Weston et al., 2017; Goulding et al., 2018; Gao et al., 2020) due to the inclusion of obscured AGN. Still, AGN fractions may depend strongly on host stellar mass (e.g. Kartaltepe et al., 2010; Aird et al., 2012), and testing this dependence requires disentangling the relative contributions of the AGN and host galaxies among mergers. Our sample, with uniform SED models that account for the presence of AGN, is ideal for this purpose.
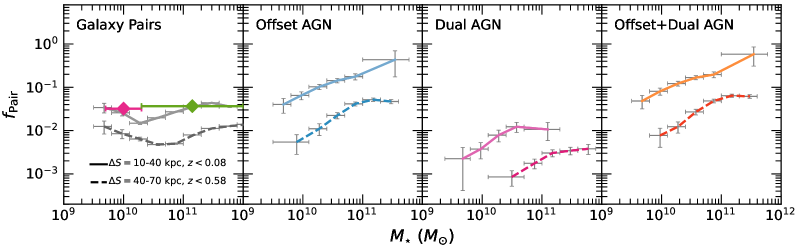
Figure 10 shows , , , and (the fraction of AGN in either offset or dual systems) as a function of . The left panel shows that is broadly consistent with current estimates of the galaxy merger or pair fractions as estimated from a variety of methods in the literature (e.g. Qu et al., 2017; Mundy et al., 2017; Duncan et al., 2019). Above , a potential positive trend is seen for with . Indeed, some works do suggest such a positive dependence for major mergers (e.g. Weigel et al., 2017; Wang et al., 2020; Nevin et al., 2023). However, the next three panels show that , , and have a stronger positive dependence with . Additionally, is approximately one order of magnitude lower than across the range of stellar masses examined (the implications for correlated AGN triggering are discussed further in Section 6). These results are qualitatively similar for both the 10 40 kpc and 40 70 kpc subsamples, though the merger fractions are overall higher for the smaller separation pairs.
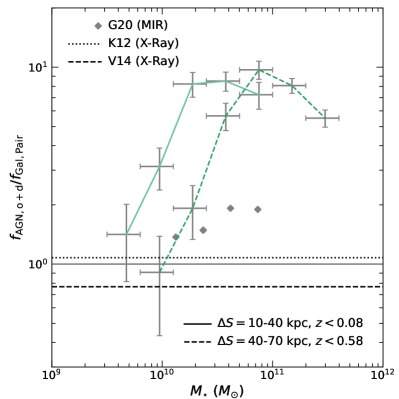
To quantify the AGN merger fraction excess relative to the galaxy merger fraction and compare with previous results, Figure 11 shows the ratio of to . While is near unity for galaxy stellar masses , it increases toward higher masses, reaching a value of 10 for . This result suggests that, among massive galaxies, the preference for WISE-selected AGN to reside in galaxy mergers is stronger than that of galaxies without AGN. These excesses generally reflect those from previous MIR AGN studies (e.g. Weston et al., 2017; Gao et al., 2020) and are also generally larger than those using X-ray AGN (e.g. Kocevski et al., 2012; Villforth et al., 2014). While this trend is qualitatively similar for both the 10 40 kpc and 40 70 kpc subsamples, the excesses are systematically larger for the smaller separation pairs (the effect of pair separation is explicitly examined in Section 6).
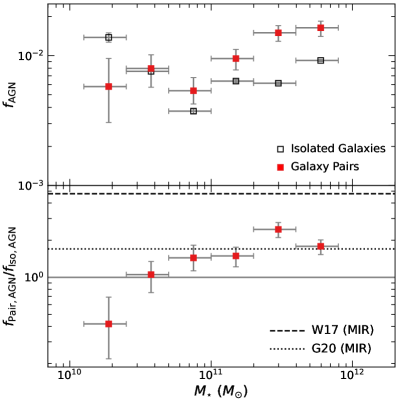
AGN variability on timescales of 100 Myr may affect the observed AGN fractions (see Hickox et al., 2014). Therefore, as an alternative test, we first select galaxy pairs and isolated galaxies ( 100 kpc) and subsequently compare the fraction of isolated galaxies that host an AGN () to the fraction of galaxy pairs with an AGN (in either offset or dual systems; ). The ratio increases with increasing , exceeding unity at the largest host masses examined (Figure 12). As in Figure 11, this excess is similar to that seen in other MIR-selected AGN samples (e.g. Weston et al., 2017; Goulding et al., 2018; Gao et al., 2020), with quantitative differences possibly due to the variation of merger selection techniques used.
5 The Role of Galaxy Mergers for Triggering MIR AGN and SMBH-Galaxy Co-Evolution
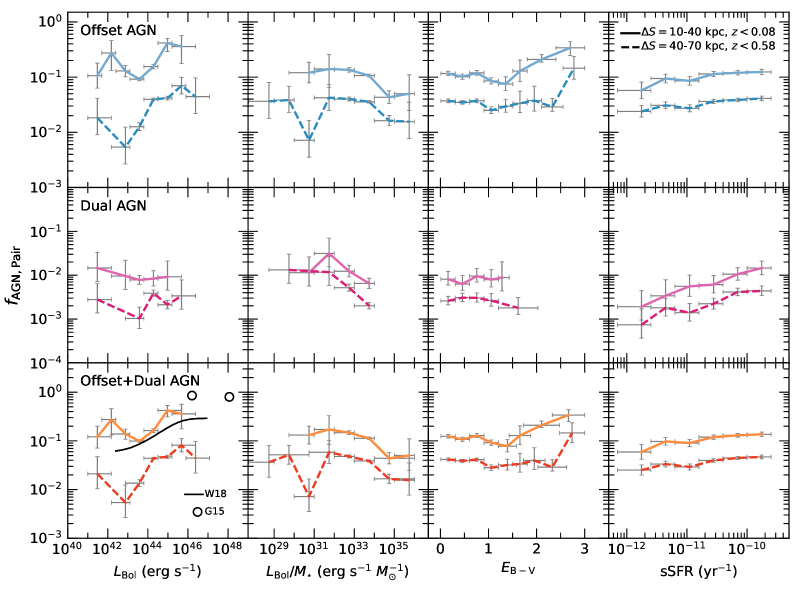
In this section we explore how the fractions of AGN in mergers evolve with physical properties that affect the growth of SMBHs and co-evolution with their host galaxies. Specifically, in Section 5.1 we examine the dependence on AGN bolometric luminosity, in Section 5.2 we examine the dependence on obscuration and host galaxy star formation, and in Section 5.3 we determine which galaxies of pairs host the more rapidly growing SMBHs.
5.1 Galaxy Mergers Do Not Enhance Accretion Efficiencies of WISE-Selected AGN
Several works have shown that the AGN merger fraction increases with AGN luminosity among samples selected from optical, X-ray, and MIR observations (e.g. Treister et al., 2012; Barrows et al., 2017a) and that the most luminous AGN are perhaps preferentially associated with on-going galaxy interactions and post-coalescence systems (e.g. Urrutia et al., 2008; Glikman et al., 2015). With the intrinsic AGN bolometric luminosities available through our SED models, in the left panel of Figure 13 we show how the AGN pair fractions of our sample evolve with . Overall, an increase with is observed among the offset and dual AGN samples, consistent with predictions from the phenomenological model of Weigel et al. (2018). This trend is similar for both the 10 40 kpc and 40 70 kpc subsamples (as with the dependence on , the fractions are higher for the smaller separation pairs). The trends show potential evidence for leveling off below erg s-1, possibly indicating that low luminosity AGN triggering is mostly independent of mergers. Also shown are the disturbed fractions for luminous dust-reddened quasi-stellar objects from Glikman et al. (2015) that are consistent with an extrapolation of our 10 40 kpc subsample out to comparably high luminosities.
However, some numerical and analytical simulations predict that the observed increase of the AGN merger fraction with luminosity is primarily driven by host galaxy stellar mass (Steinborn et al., 2016; Weigel et al., 2018). These predictions suggest that the Eddington ratios of AGN in galaxy mergers are not significantly different from those of the general AGN population. On the other hand, recent analysis of different simulation results does suggest merger-driven enhancements of Eddington ratios (McAlpine et al., 2020; Byrne-Mamahit et al., 2022). With our measurements of host galaxy stellar mass that account for the AGN contribution, we test these predictions by examining the mass-normalized values of ( ) in the second panel of Figure 13. This normalization effectively removes the positive correlations observed with : 1 significance of a non-zero slope (positive or negative, based on a powerlaw fit) is seen among the offset and dual AGN, regardless of pair separation. Under the assumption that the SMBH mass scales with , the AGN merger fractions do not increase with Eddington ratios, and mergers do not enhance the accretion efficiencies of WISE-selected AGN. This result aligns with predictions that suggest the luminosities of AGN in mergers are still dominated by the properties of their host galaxies (e.g. stellar mass and cold gas supplies). While the potential negative trend with is not significant, if real it could be reflecting the bias for AGN in mergers to reside in more massive host galaxies (i.e. Section 4 and Figure 10), corresponding to lower Eddington ratios.
5.2 Galaxy Mergers Enhance AGN Obscuration and Star Formation Efficiencies
Simulations predict that a significant fraction of merger-driven SMBH growth is obscured (e.g. Blecha et al., 2017). However, observational tests of such predictions have been limited by biases toward unobscured AGN. In particular, while connections between mergers and obscuration have been measured using X-ray selected AGN (e.g. Ricci et al., 2017, 2021), many heavily obscured sources are still missed (see Section 1). Moreover, AGN samples selected using MIR diagnostics are not necessarily obscured, and MIR photometry alone is not sufficient to determine the level of obscuration (e.g. Hickox et al., 2007; Netzer, 2015). Additionally, relying simply on MIR optical colors to infer the level of AGN obscuration can introduce complications from star formation contributions. The sample developed through this work overcomes these limitations by measuring AGN obscuration from combined AGN and galaxy broadband SED models.
The third panel of Figure 13 shows the AGN pair fractions as a function of AGN color excess (). With the large sample size and dynamic range of obscuration measurements, we are able to test this connection over the range 0 3. For the first time, we show how the fraction of AGN in offset and dual systems both increase with increasing (i.e. toward higher values of AGN obscuration). The trend is strongest in the 10 40 kpc subsample, with a best-fit powerlaw slope 0 at a significance of 3.09 for the offset and dual AGN combined. Still, the positive trend observed at 2 among the 40 70 kpc subsample suggests that nuclear obscuration may still be enhanced among larger separation pairs. Indeed, observations show that galaxy pairing out to separations of 40 kpc may enhance the fraction of obscured AGN (e.g. Satyapal et al., 2014). We are not able to test for a similar result among the dual AGN due to smaller sample sizes and hence a limited range of values.
These extinction values show that the fraction of AGN in mergers significantly increases (up to 40%) among sources with column densities cm-2 (using the gas-to-dust ratio of Maiolino et al. 2001), and particularly for those with smaller physical pair separations. By implication, galaxy interactions do contribute significantly to the population of obscured AGN (removing, to a large degree, the dependence on dusty torus orientations).
AGN and star formation are dependent on a common supply of cold gas and dust, and numerical work suggests this connection is strongest when galaxies are merging due to the enhanced dynamical forces involved (e.g. Volonteri et al., 2015). Indeed, assuming a direct connection between star-forming galaxies and AGN hosts (when accounting for AGN variability) can naturally explain the observed correlation between the AGN merger fraction and (i.e. Hickox et al., 2014). However, exploring the connection between AGN and star formation requires disentangling their relative contributions. The sample presented here overcomes this limitation with physical properties of the host galaxies that account for the presence of an AGN, allowing us to test this connection for the largest sample of obscured AGN in mergers.
The right panel of Figure 13 shows the fraction of AGN in galaxy pairs as a function of host galaxy specific SFR (sSFR). For WISE AGN in either offset or dual systems, the pair fractions rise with sSFR. For the combined offset and dual AGN, the best-fit powerlaw slope is 0 at a significance of 2.55 in the 10 40 kpc sample, rising to 2.66 for the 40 70 kpc subsample. This systematic increase in AGN pair fraction suggests that the global sSFR may be connected with AGN triggering in mergers (though not necessarily with Eddington ratios; i.e. Section 5.1). Furthermore, this positive trend may be stronger among the dual AGN (powerlaw exponent of 0.57) than among the offset AGN (powerlaw exponent of 0.15). However, we do not find any evidence for a significant positive or negative correlation between and sSFR among the offset or dual AGN (when limited to a pair probability threshold 90%), suggesting that a direct connection may be washed out by the different spatial and temporal scales between global star formation and AGN nuclear emission (e.g. Barrows et al., 2017b).
5.3 Galaxy Mergers May Preferentially Grow SMBHs in the Less Massive Galaxy
The results from Section 4 suggest that galaxy mergers can significantly enhance the rate of AGN triggering. In phenomenological and numerical models, this process may result in rapid growth of the SMBH in the less massive galaxy, exceeding that of the SMBH in the primary galaxy (e.g. Yu et al., 2011; Capelo et al., 2016). If so, unequal mass mergers may be a significant driver of low-mass black hole growth (e.g. Barrows et al., 2018, 2019). The sample of dual AGN developed through this work is ideal for testing this scenario since the host galaxy of each AGN is known, along with the host stellar mass and AGN bolometric luminosity, allowing for an observational test of the physics that drives accretion onto SMBHs in galaxy mergers.
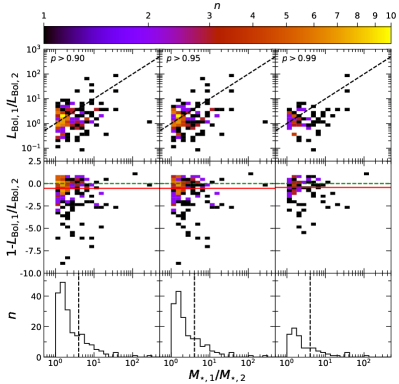
Assuming the SMBH mass scales directly with , we examine the relative Eddington ratios of both AGN in the dual AGN systems by plotting against , where the subscripts ‘1’ and ‘2’ denote the more and less massive galaxies, respectively (top panels of Figure 14). Since this analysis assumes each plotted pair is a true pair, we limit it to those with pair probabilities 90%, and we examine the effect of increasingly stricter criteria ( 95% and 99%). To quantify the deviation from the one-to-one relation, the middle panels of Figure 14 show the offset of from the one-to-one relation as a function of . Regardless of probability threshold, the median offset is negative. This offset is due to a significant tail of pairs in which is larger in the less massive galaxy.
Since the fraction of dual AGN with negative offsets of from the one-to-one relation increases with , this preferential growth may most likely occur among minor mergers. When adopting a division between major and minor mergers of 4, 10% of the dual AGN are in minor mergers (bottom panels of Figure 14). Furthermore, among the offset AGN, the stellar mass ratios between the AGN host and companion galaxy have a median value of 0.75 (for the same pair probability thresholds used for the dual AGN). These combined results suggest that the mergers may be funneling comparable amounts of gas and dust to each nucleus, thereby preferentially increasing the Eddington ratios of the SMBHs in the less massive galaxies.
6 Obscured AGN Are Preferentially Found in Late-Stage Dual Systems
Numerical simulations consistently predict that the late stages of galaxy mergers are when the most significant merger-driven AGN triggering and SMBH accretion occurs (e.g. Hernquist, 1989; Mihos & Hernquist, 1996; Hopkins et al., 2008; Van Wassenhove et al., 2012; Stickley & Canalizo, 2014; Capelo et al., 2015; Blecha et al., 2017). Hence, observed AGN enhancements in mergers are expected to be strongest at small pair separations. Indeed, previous results have shown that the AGN merger fraction (for X-ray and/or MIR-selected AGN) increases toward smaller pair separations (e.g. Barrows et al., 2017a; Stemo et al., 2021). Moreover, comparison to control samples of inactive galaxies have generally revealed that mergers have an excess of AGN at increasingly later merger stages (e.g. Ellison et al., 2011, 2013; Satyapal et al., 2014; Fu et al., 2018; Shah et al., 2020; Steffen et al., 2022). However, these results are limited to systems where offset versus dual AGN can not be distinguished, or otherwise to nearby optically-selected samples for which the dependence on AGN obscuration can not be determined. To bridge this gap, we use our samples of offset and dual AGN, with measures of obscuration, to examine the enhancement of merger-driven AGN in pairs, relative to that expected from stochastic triggering, as a function of .
From the galaxy sample, we first compute the observed number of offset AGN, dual AGN, and galaxy pairs as a function of . To create a volume-limited sample, similar to Fu et al. (2018) and Steffen et al. (2022) we normalize the probabilities of each pair by the volume weights (). Doing so yields volume densities for the offset AGN, dual AGN, offset plus dual AGN, and galaxy pairs: , , , and , respectively. Estimates of are computed at each redshift step of the pair probability distributions by applying the galaxy stellar mass estimate (of the less massive galaxy) at that redshift to the flux-based mass-completeness function described in Section 3.
We then estimate the expected number of AGN among the galaxy pairs from stochastic AGN triggering independent of mergers. These estimates are obtained by computing the fraction of the galaxy sample that host WISE AGN. Following the procedure from Fu et al. (2018) and Steffen et al. (2022), this fraction is parameterized as a log-normal function of host stellar mass and redshift. This function is then applied to components ‘a’ and ‘b’ of each galaxy pair to determine the probability it hosts a WISE AGN: and . The predicted volume density of galaxy pairs with randomly occurring offset AGN is . The predicted volume density with randomly occurring dual AGN is , and the predicted volume density with either is . We also derive these volume densities for the unobscured ( 0.5) and obscured ( 0.5) subsets.
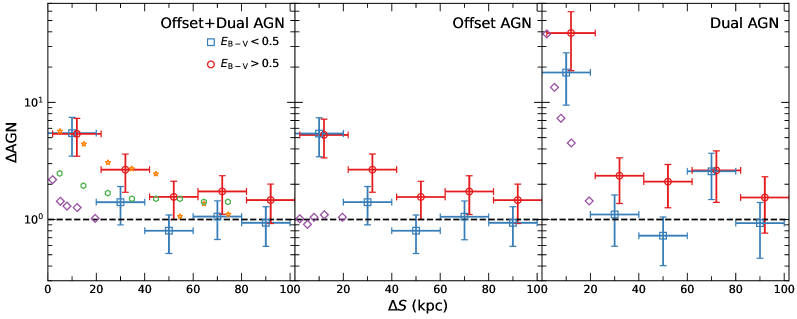
The ratios , , and as a function of are shown in Figure 15. The ratios increase toward smaller separations for both offset and dual AGN, implying that the merger process itself triggers WISE AGN in both types of systems and that this is increasingly more likely at later merger stages (in agreement with the works cited above).
Both the unobscured and obscured subsets show qualitatively similar trends. However, the excesses of both the offset and dual AGN are systematically larger for the obscured subset (30% higher than for unobscured AGN). This result suggests that merger-driven triggering of AGN preferentially occurs in heavily obscured nuclei, regardless of whether or not correlated triggering occurs. As also seen in Figure 15, the WISE AGN merger excesses are larger than those of nearby optically-selected AGN. While this has been suggested previously based on comparison of MIR and optical AGN selection (i.e. Satyapal et al., 2014), our results explicitly show how this is dependent on AGN color excess and that this occurs among both dual and offset AGN. Indeed, in contrast to the null excess observed for the optically-selected offset AGN, the WISE offset AGN excesses do increase toward small (with excesses up to a factor of 5). Moreover, this excess relative to optically-selected AGN holds regardless of WISE AGN obscuration level. Hence, detection of obscured sources may not completely account for the discrepancies between the optical and MIR-selected samples previously observed (e.g. Ellison et al., 2013; Satyapal et al., 2014), and the more luminous nature of WISE AGN (relative to nearby optical AGN) may also contribute to the stronger merger dependence (as suggested by the luminosity dependence in Figure 13).
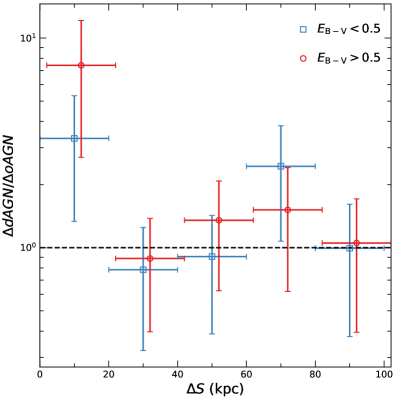
Figure 16 shows the ratio of the dual AGN excess to the offset AGN excess as a function of for the unobscured and obscured subsets. The relatively stronger excess among the dual AGN at small (factors of 3 and 7 for obscured and unobscured AGN, respectively) can be explained by correlated triggering, i.e. that the likelihood of one AGN being triggered increases the likelihood of the other being triggered during late merger stages. This distinction between offset and dual AGN was also shown in Fu et al. (2018) and Steffen et al. (2022) for nearby optically-selected AGN (based on narrow emission line diagnostics), and here we show it exists for relatively more luminous WISE AGN as well. For direct comparison, we compute the separation-dependent correlated fraction as in Steffen et al. (2022). This procedure estimates that 18% of pairs with only one AGN become dual AGN due to correlated triggering (similar to, but larger than, the fraction of 11.5% for optically-selected AGN from Steffen et al. 2022). Finally, the probability of correlated AGN triggering at small may be strongest among obscured AGN, though the current uncertainties preclude this result from being significant.
7 Conclusions
We compute photometric redshift PDFs for a wide-area sample of WISE-selected AGN and a comparison sample of galaxies. From these PDFs we generate probabilities for pairs within 100 kpc projected separations, producing the largest sample of WISE-selected AGN in galaxy pairs (2767 offset AGN and 198 dual AGN; Figures 6 and 7). With uniform physical properties measured for the AGN and host galaxies of each system, we address several outstanding questions regarding the role of galaxy mergers for driving and obscuring SMBH growth. We examine the fraction of WISE AGN found in offset and dual AGN systems, compare it to that of galaxies, and quantify its dependence on several parameters that influence AGN triggering in galaxy mergers. Our conclusions are as follows:
-
1.
WISE-selected AGN show a preference for residing in interacting galaxy pairs (offset or dual AGN), with this preference becoming stronger for larger host stellar masses (up to a factor of 10; Figures 11 and 12). The number of AGN in dual systems is 10% the number in offset systems, so this merger excess is dominated by galaxy pairs with only one AGN.
-
2.
The WISE AGN merger fraction does not show a statistically significant increase with mass-normalized AGN bolometric luminosity (Figure 13). Hence, while mergers enhance the frequency of AGN triggering, they do not necessarily enhance the Eddington ratios of WISE AGN.
-
3.
The WISE AGN merger fraction does increase significantly with AGN obscuration (significance of 3.09 for the combined offset and dual AGN; Figure 13). The strongest increase (up to an AGN fraction of 40%) occurs for column densities cm-2. This is the first result to show how the AGN merger fraction explicitly evolves with AGN obscuration for both offset and dual AGN systems, and it suggests that a significant fraction of heavily obscured AGN are in galaxy pairs.
-
4.
The fraction of AGN in pairs increases with host galaxy specific star formation rate (significance of up to 2.66 for the combined offset and dual AGN; Figure 13). This enhancement potentially suggests that AGN triggering is correlated with star formation in mergers and that these systems are potential sites of merger-driven co-evolution between galaxies and SMBHs.
-
5.
For dual AGN systems, the AGN in the less massive galaxies are potentially biased toward larger Eddington ratios compared to those in the more massive galaxies (Figure 14). Mergers may therefore be effective at growing relatively low-mass SMBHs.
-
6.
The incidence of merger-driven AGN triggering increases toward smaller pair separations (up to an excess of 5 relative to stochastic mechanisms) and is stronger than that of optically-selected AGN for both offset and dual systems (Figure 15). This trend is stronger for dual AGN (by a factor of 3 7; Figure 16), suggesting that the dynamics triggering WISE-selected AGN in mergers also promote correlated AGN triggering in both galaxies.
-
7.
The AGN merger excesses suggest a preference for merger-driven SMBH growth to occur under obscured conditions (30% higher than for unobscured AGN). Moreover, this dependence on obscuration at late merger stages may be strongest among dual AGN. However, even unobscured WISE AGN merger excesses are larger than those of lower luminosity optically-selected AGN, suggesting that the luminous nature of WISE AGN also contributes to their strong merger dependence.
References
- Aird et al. (2012) Aird, J., Coil, A. L., Moustakas, J., et al. 2012, ApJ, 746, 90, doi: 10.1088/0004-637X/746/1/90
- Arnouts et al. (1999) Arnouts, S., Cristiani, S., Moscardini, L., et al. 1999, MNRAS, 310, 540, doi: 10.1046/j.1365-8711.1999.02978.x
- Ashby et al. (2009) Ashby, M. L. N., Stern, D., Brodwin, M., et al. 2009, ApJ, 701, 428, doi: 10.1088/0004-637X/701/1/428
- Assef et al. (2018) Assef, R. J., Stern, D., Noirot, G., et al. 2018, ApJS, 234, 23, doi: 10.3847/1538-4365/aaa00a
- Assef et al. (2008) Assef, R. J., Kochanek, C. S., Brodwin, M., et al. 2008, ApJ, 676, 286, doi: 10.1086/527533
- Assef et al. (2010) —. 2010, AJ, 713, 970, doi: 10.1088/0004-637X/713/2/970
- Assef et al. (2013) Assef, R. J., Stern, D., Kochanek, C. S., et al. 2013, ApJ, 772, 26, doi: 10.1088/0004-637X/772/1/26
- Astropy Collaboration et al. (2013) Astropy Collaboration, Robitaille, T. P., Tollerud, E. J., et al. 2013, A&A, 558, A33, doi: 10.1051/0004-6361/201322068
- Astropy Collaboration et al. (2018) Astropy Collaboration, Price-Whelan, A. M., Sipőcz, B. M., et al. 2018, AJ, 156, 123, doi: 10.3847/1538-3881/aabc4f
- Athanassoula (2003) Athanassoula, E. 2003, Monthly Notices of the Royal Astronomical Society, 341, 1179
- Barrows et al. (2018) Barrows, R. S., Comerford, J. M., & Greene, J. E. 2018, ApJ, 869, 154, doi: 10.3847/1538-4357/aaedb6
- Barrows et al. (2016) Barrows, R. S., Comerford, J. M., Greene, J. E., & Pooley, D. 2016, ApJ, 829, 37, doi: 10.3847/0004-637X/829/1/37
- Barrows et al. (2017a) —. 2017a, ApJ, 838, 129, doi: 10.3847/1538-4357/aa64d9
- Barrows et al. (2021) Barrows, R. S., Comerford, J. M., Stern, D., & Assef, R. J. 2021, ApJ, 922, 179, doi: 10.3847/1538-4357/ac1352
- Barrows et al. (2017b) Barrows, R. S., Comerford, J. M., Zakamska, N. L., & Cooper, M. C. 2017b, ApJ, 850, 27, doi: 10.3847/1538-4357/aa93de
- Barrows et al. (2019) Barrows, R. S., Mezcua, M., & Comerford, J. M. 2019, ApJ, 882, 181, doi: 10.3847/1538-4357/ab338a
- Bianchi et al. (2008) Bianchi, S., Chiaberge, M., Piconcelli, E., Guainazzi, M., & Matt, G. 2008, MNRAS, 386, 105, doi: 10.1111/j.1365-2966.2008.13078.x
- Blecha et al. (2017) Blecha, L., Snyder, G. F., Satyapal, S., & Ellison, S. L. 2017, ArXiv e-prints. https://arxiv.org/abs/1711.02094
- Boquien et al. (2019) Boquien, M., Burgarella, D., Roehlly, Y., et al. 2019, A&A, 622, A103, doi: 10.1051/0004-6361/201834156
- Bournaud & Combes (2002) Bournaud, F., & Combes, F. 2002, Astronomy & Astrophysics, 392, 83
- Byrne-Mamahit et al. (2022) Byrne-Mamahit, S., Hani, M., Ellison, S., Quai, S., & Patton, D. 2022, arXiv e-prints, arXiv:2212.07342. https://arxiv.org/abs/2212.07342
- Capelo et al. (2016) Capelo, P. R., Dotti, M., Volonteri, M., et al. 2016, ArXiv e-prints. https://arxiv.org/abs/1611.09244
- Capelo et al. (2017) —. 2017, MNRAS, 469, 4437, doi: 10.1093/mnras/stx1067
- Capelo et al. (2015) Capelo, P. R., Volonteri, M., Dotti, M., et al. 2015, MNRAS, 447, 2123, doi: 10.1093/mnras/stu2500
- Combes & Gerin (1985) Combes, F., & Gerin, M. 1985, Astronomy and Astrophysics, 150, 327
- Comerford et al. (2015) Comerford, J. M., Pooley, D., Barrows, R. S., et al. 2015, ApJ, 806, 219, doi: 10.1088/0004-637X/806/2/219
- Cunha et al. (2009) Cunha, C. E., Lima, M., Oyaizu, H., Frieman, J., & Lin, H. 2009, MNRAS, 396, 2379, doi: 10.1111/j.1365-2966.2009.14908.x
- Darvish et al. (2015) Darvish, B., Mobasher, B., Sobral, D., Scoville, N., & Aragon-Calvo, M. 2015, ApJ, 805, 121, doi: 10.1088/0004-637X/805/2/121
- De Rosa et al. (2022) De Rosa, A., Vignali, C., Severgnini, P., et al. 2022, MNRAS, doi: 10.1093/mnras/stac3664
- Di Matteo et al. (2005) Di Matteo, T., Springel, V., & Hernquist, L. 2005, Nature, 433, 604, doi: 10.1038/nature03335
- Duncan et al. (2019) Duncan, K., Conselice, C. J., Mundy, C., et al. 2019, ApJ, 876, 110, doi: 10.3847/1538-4357/ab148a
- Duncan et al. (2018) Duncan, K. J., Brown, M. J. I., Williams, W. L., et al. 2018, MNRAS, 473, 2655, doi: 10.1093/mnras/stx2536
- Ellison et al. (2013) Ellison, S. L., Mendel, J. T., Scudder, J. M., Patton, D. R., & Palmer, M. J. D. 2013, MNRAS, 430, 3128, doi: 10.1093/mnras/sts546
- Ellison et al. (2011) Ellison, S. L., Patton, D. R., Mendel, J. T., & Scudder, J. M. 2011, MNRAS, 418, 2043, doi: 10.1111/j.1365-2966.2011.19624.x
- Farrah et al. (2017) Farrah, D., Petty, S., Connolly, B., et al. 2017, ApJ, 844, 106, doi: 10.3847/1538-4357/aa78f2
- Fernández-Soto et al. (2002) Fernández-Soto, A., Lanzetta, K. M., Chen, H. W., Levine, B., & Yahata, N. 2002, MNRAS, 330, 889, doi: 10.1046/j.1365-8711.2002.05131.x
- Foreman-Mackey et al. (2013) Foreman-Mackey, D., Hogg, D. W., Lang, D., & Goodman, J. 2013, PASP, 125, 306, doi: 10.1086/670067
- Fu et al. (2018) Fu, H., Steffen, J. L., Gross, A. C., et al. 2018, ApJ, 856, 93, doi: 10.3847/1538-4357/aab364
- Gao et al. (2020) Gao, F., Wang, L., Pearson, W. J., et al. 2020, A&A, 637, A94, doi: 10.1051/0004-6361/201937178
- Georgakakis et al. (2009) Georgakakis, A., Coil, A. L., Laird, E. S., et al. 2009, MNRAS, 397, 623, doi: 10.1111/j.1365-2966.2009.14951.x
- Gilli et al. (2007) Gilli, R., Comastri, A., & Hasinger, G. 2007, A&A, 463, 79, doi: 10.1051/0004-6361:20066334
- Glikman et al. (2015) Glikman, E., Simmons, B., Mailly, M., et al. 2015, ApJ, 806, 218, doi: 10.1088/0004-637X/806/2/218
- Goulding et al. (2018) Goulding, A. D., Greene, J. E., Bezanson, R., et al. 2018, PASJ, 70, S37, doi: 10.1093/pasj/psx135
- Guainazzi et al. (2005) Guainazzi, M., Piconcelli, E., Jiménez-Bailón, E., & Matt, G. 2005, A&A, 429, L9, doi: 10.1051/0004-6361:200400104
- Heller & Shlosman (1994) Heller, C. H., & Shlosman, I. 1994, The Astrophysical Journal, 424, 84
- Hernquist (1989) Hernquist, L. 1989, Nature, 340, 687, doi: 10.1038/340687a0
- Hickox et al. (2014) Hickox, R. C., Mullaney, J. R., Alexander, D. M., et al. 2014, ApJ, 782, 9, doi: 10.1088/0004-637X/782/1/9
- Hickox et al. (2007) Hickox, R. C., Jones, C., Forman, W. R., et al. 2007, ApJ, 671, 1365, doi: 10.1086/523082
- Hinshaw et al. (2013) Hinshaw, G., Larson, D., Komatsu, E., et al. 2013, The Astrophysical Journal Supplement Series, 208, 19, doi: 10.1088/0067-0049/208/2/19
- Hoaglin et al. (1983) Hoaglin, D. C., Mosteller, F., & Tukey, J. W. 1983, Understanding robust and exploratory data anlysis
- Hopkins et al. (2008) Hopkins, P. F., Hernquist, L., Cox, T. J., & Kereš, D. 2008, ApJS, 175, 356, doi: 10.1086/524362
- Hou et al. (2020) Hou, M., Li, Z., & Liu, X. 2020, ApJ, 900, 79, doi: 10.3847/1538-4357/aba4a7
- Hou et al. (2022) Hou, M., Li, Z., Liu, X., et al. 2022, arXiv e-prints, arXiv:2212.06399. https://arxiv.org/abs/2212.06399
- Hudson et al. (2006) Hudson, D. S., Reiprich, T. H., Clarke, T. E., & Sarazin, C. L. 2006, A&A, 453, 433, doi: 10.1051/0004-6361:20064955
- Ilbert et al. (2006) Ilbert, O., Arnouts, S., McCracken, H. J., et al. 2006, A&A, 457, 841, doi: 10.1051/0004-6361:20065138
- Jarrett et al. (2011) Jarrett, T. H., Cohen, M., Masci, F., et al. 2011, ApJ, 735, 112, doi: 10.1088/0004-637X/735/2/112
- Jin et al. (2021) Jin, G., Dai, Y. S., Pan, H.-A., et al. 2021, ApJ, 923, 6, doi: 10.3847/1538-4357/ac2901
- Kartaltepe et al. (2010) Kartaltepe, J. S., Sanders, D. B., Le Floc’h, E., et al. 2010, ApJ, 709, 572, doi: 10.1088/0004-637X/709/2/572
- Kocevski et al. (2012) Kocevski, D. D., Faber, S. M., Mozena, M., et al. 2012, ApJ, 744, 148, doi: 10.1088/0004-637X/744/2/148
- Komossa et al. (2003) Komossa, S., Burwitz, V., Hasinger, G., et al. 2003, ApJ, 582, L15, doi: 10.1086/346145
- Koss et al. (2012) Koss, M., Mushotzky, R., Treister, E., et al. 2012, ApJ, 746, L22, doi: 10.1088/2041-8205/746/2/L22
- Koss et al. (2011) —. 2011, ApJ, 735, L42+, doi: 10.1088/2041-8205/735/2/L42
- Koss et al. (2022) Koss, M. J., Trakhtenbrot, B., Ricci, C., et al. 2022, ApJS, 261, 1, doi: 10.3847/1538-4365/ac6c8f
- Liu et al. (2011) Liu, X., Shen, Y., Strauss, M. A., & Hao, L. 2011, ApJ, 737, 101, doi: 10.1088/0004-637X/737/2/101
- López-Sanjuan et al. (2010) López-Sanjuan, C., Balcells, M., Pérez-González, P. G., et al. 2010, A&A, 518, A20, doi: 10.1051/0004-6361/201014236
- López-Sanjuan et al. (2015) López-Sanjuan, C., Cenarro, A. J., Varela, J., et al. 2015, A&A, 576, A53, doi: 10.1051/0004-6361/201424913
- Lynden-Bell (1979) Lynden-Bell, D. 1979, Monthly Notices of the Royal Astronomical Society, 187, 101
- Madsen et al. (2019) Madsen, K., Hickox, R., Bachetti, M., et al. 2019, in Bulletin of the American Astronomical Society, Vol. 51, 166
- Maiolino et al. (2001) Maiolino, R., Marconi, A., Salvati, M., et al. 2001, A&A, 365, 28, doi: 10.1051/0004-6361:20000177
- Mateos et al. (2012) Mateos, S., Alonso-Herrero, A., Carrera, F. J., et al. 2012, MNRAS, 426, 3271, doi: 10.1111/j.1365-2966.2012.21843.x
- Mazzarella et al. (2012) Mazzarella, J. M., Iwasawa, K., Vavilkin, T., et al. 2012, AJ, 144, 125, doi: 10.1088/0004-6256/144/5/125
- McAlpine et al. (2020) McAlpine, S., Harrison, C. M., Rosario, D. J., et al. 2020, MNRAS, 494, 5713, doi: 10.1093/mnras/staa1123
- Mechtley et al. (2015) Mechtley, M., Jahnke, K., Windhorst, R. A., et al. 2015, ArXiv e-prints. https://arxiv.org/abs/1510.08461
- Mihos & Hernquist (1996) Mihos, J. C., & Hernquist, L. 1996, ApJ, 464, 641, doi: 10.1086/177353
- Müller-Sánchez et al. (2015) Müller-Sánchez, F., Comerford, J. M., Nevin, R., et al. 2015, ApJ, 813, 103, doi: 10.1088/0004-637X/813/2/103
- Mundy et al. (2017) Mundy, C. J., Conselice, C. J., Duncan, K. J., et al. 2017, MNRAS, 470, 3507, doi: 10.1093/mnras/stx1238
- Netzer (2015) Netzer, H. 2015, ARA&A, 53, 365, doi: 10.1146/annurev-astro-082214-122302
- Nevin et al. (2023) Nevin, R., Blecha, L., Comerford, J., et al. 2023, MNRAS, doi: 10.1093/mnras/stad911
- Noll et al. (2009) Noll, S., Burgarella, D., Giovannoli, E., et al. 2009, A&A, 507, 1793, doi: 10.1051/0004-6361/200912497
- Pfenniger & Friedli (1991) Pfenniger, D., & Friedli, D. 1991, Astronomy and Astrophysics, 252, 75
- Piconcelli et al. (2010) Piconcelli, E., Vignali, C., Bianchi, S., et al. 2010, ApJ, 722, L147, doi: 10.1088/2041-8205/722/2/L147
- Polletta et al. (2007) Polletta, M., Tajer, M., Maraschi, L., et al. 2007, ApJ, 663, 81, doi: 10.1086/518113
- Pozzetti et al. (2010) Pozzetti, L., Bolzonella, M., Zucca, E., et al. 2010, A&A, 523, A13, doi: 10.1051/0004-6361/200913020
- Qu et al. (2017) Qu, Y., Helly, J. C., Bower, R. G., et al. 2017, MNRAS, 464, 1659, doi: 10.1093/mnras/stw2437
- Ricci et al. (2017) Ricci, C., Bauer, F. E., Treister, E., et al. 2017, MNRAS, doi: 10.1093/mnras/stx173
- Ricci et al. (2021) Ricci, C., Privon, G. C., Pfeifle, R. W., et al. 2021, MNRAS, 506, 5935, doi: 10.1093/mnras/stab2052
- Rodriguez et al. (2020) Rodriguez, F., Gonzalez, E. J., O’Mill, A. L., et al. 2020, A&A, 634, A123, doi: 10.1051/0004-6361/201937215
- Sakamoto et al. (1999) Sakamoto, K., Okumura, S., Ishizuki, S., & Scoville, N. 1999, The Astrophysical Journal, 525, 691
- Salvato et al. (2009) Salvato, M., Hasinger, G., Ilbert, O., et al. 2009, ApJ, 690, 1250, doi: 10.1088/0004-637X/690/2/1250
- Salvato et al. (2011) Salvato, M., Ilbert, O., Hasinger, G., et al. 2011, ApJ, 742, 61, doi: 10.1088/0004-637X/742/2/61
- Sanders et al. (1988) Sanders, D. B., Soifer, B. T., Elias, J. H., et al. 1988, ApJ, 325, 74, doi: 10.1086/165983
- Satyapal et al. (2014) Satyapal, S., Ellison, S. L., McAlpine, W., et al. 2014, MNRAS, 441, 1297, doi: 10.1093/mnras/stu650
- Satyapal et al. (2017) Satyapal, S., Secrest, N. J., Ricci, C., et al. 2017, ApJ, 848, 126, doi: 10.3847/1538-4357/aa88ca
- Scoville et al. (2007) Scoville, N., Aussel, H., Brusa, M., et al. 2007, ApJS, 172, 1, doi: 10.1086/516585
- Secrest et al. (2015) Secrest, N. J., Dudik, R. P., Dorland, B. N., et al. 2015, ApJS, 221, 12, doi: 10.1088/0067-0049/221/1/12
- Sellwood (1981) Sellwood, J. 1981, Astronomy and Astrophysics, 99, 362
- Shah et al. (2020) Shah, E. A., Kartaltepe, J. S., Magagnoli, C. T., et al. 2020, ApJ, 904, 107, doi: 10.3847/1538-4357/abbf59
- Silva et al. (2021) Silva, A., Marchesini, D., Silverman, J. D., et al. 2021, ApJ, 909, 124, doi: 10.3847/1538-4357/abdbb1
- Silverman et al. (2011) Silverman, J. D., Kampczyk, P., Jahnke, K., et al. 2011, ApJ, 743, 2, doi: 10.1088/0004-637X/743/1/2
- Simmons et al. (2012) Simmons, B. D., Urry, C. M., Schawinski, K., Cardamone, C., & Glikman, E. 2012, ApJ, 761, 75, doi: 10.1088/0004-637X/761/1/75
- Springel et al. (2005) Springel, V., Di Matteo, T., & Hernquist, L. 2005, ApJ, 620, L79, doi: 10.1086/428772
- Steffen et al. (2022) Steffen, J. L., Fu, H., Brownstein, J. R., et al. 2022, arXiv e-prints, arXiv:2212.02677. https://arxiv.org/abs/2212.02677
- Steinborn et al. (2016) Steinborn, L. K., Dolag, K., Comerford, J. M., et al. 2016, MNRAS, 458, 1013, doi: 10.1093/mnras/stw316
- Stemo et al. (2021) Stemo, A., Comerford, J. M., Barrows, R. S., et al. 2021, ApJ, 923, 36, doi: 10.3847/1538-4357/ac0bbf
- Stern et al. (2012) Stern, D., Assef, R. J., Benford, D. J., et al. 2012, ApJ, 753, 30, doi: 10.1088/0004-637X/753/1/30
- Stickley & Canalizo (2014) Stickley, N. R., & Canalizo, G. 2014, ApJ, 786, 12, doi: 10.1088/0004-637X/786/1/12
- Treister et al. (2012) Treister, E., Schawinski, K., Urry, C. M., & Simmons, B. D. 2012, ApJ, 758, L39, doi: 10.1088/2041-8205/758/2/L39
- Treister et al. (2009) Treister, E., Urry, C. M., & Virani, S. 2009, ApJ, 696, 110, doi: 10.1088/0004-637X/696/1/110
- Ueda et al. (2014) Ueda, Y., Akiyama, M., Hasinger, G., Miyaji, T., & Watson, M. G. 2014, ApJ, 786, 104, doi: 10.1088/0004-637X/786/2/104
- Urrutia et al. (2008) Urrutia, T., Lacy, M., & Becker, R. H. 2008, ApJ, 674, 80, doi: 10.1086/523959
- van Albada & Roberts Jr (1981) van Albada, G. D., & Roberts Jr, W. 1981, The Astrophysical Journal, 246, 740
- Van Wassenhove et al. (2012) Van Wassenhove, S., Volonteri, M., Mayer, L., et al. 2012, ApJ, 748, L7, doi: 10.1088/2041-8205/748/1/L7
- Villforth et al. (2014) Villforth, C., Hamann, F., Rosario, D. J., et al. 2014, MNRAS, 439, 3342, doi: 10.1093/mnras/stu173
- Villforth et al. (2016) Villforth, C., Hamilton, T., Pawlik, M. M., et al. 2016, ArXiv e-prints. https://arxiv.org/abs/1611.06236
- Volonteri et al. (2015) Volonteri, M., Capelo, P. R., Netzer, H., et al. 2015, MNRAS, 452, L6, doi: 10.1093/mnrasl/slv078
- Wang et al. (2020) Wang, L., Pearson, W. J., & Rodriguez-Gomez, V. 2020, A&A, 644, A87, doi: 10.1051/0004-6361/202038084
- Weigel et al. (2018) Weigel, A. K., Schawinski, K., Treister, E., Trakhtenbrot, B., & Sanders, D. B. 2018, MNRAS, 476, 2308, doi: 10.1093/mnras/sty383
- Weigel et al. (2017) Weigel, A. K., Schawinski, K., Caplar, N., et al. 2017, ApJ, 845, 145, doi: 10.3847/1538-4357/aa8097
- Weston et al. (2017) Weston, M. E., McIntosh, D. H., Brodwin, M., et al. 2017, MNRAS, 464, 3882, doi: 10.1093/mnras/stw2620
- Wittman et al. (2016) Wittman, D., Bhaskar, R., & Tobin, R. 2016, MNRAS, 457, 4005, doi: 10.1093/mnras/stw261
- Wright et al. (2010) Wright, E. L., Eisenhardt, P. R. M., Mainzer, A. K., et al. 2010, AJ, 140, 1868, doi: 10.1088/0004-6256/140/6/1868
- Yu et al. (2011) Yu, Q., Lu, Y., Mohayaee, R., & Colin, J. 2011, ApJ, 738, 92, doi: 10.1088/0004-637X/738/1/92