Early excess emission in Type Ia supernovae from the interaction between supernova ejecta and their circumstellar wind
Abstract
The effects of the interaction between Type Ia supernova ejecta and their circumstellar wind on the photometric properties of Type Ia supernovae are investigated. We assume that a hydrogen-rich, dense, and extended circumstellar matter (CSM) is formed by the steady mass loss of their progenitor systems. The CSM density is assumed to be proportional to . When the mass-loss rate is above with a wind velocity of 100 , CSM interaction results in an early flux excess in optical light-curves within 4 days of explosion. In these cases, the optical colour quickly evolves to the blue. The ultraviolet flux below 3000 Å is found to have a persistent flux excess compared to Type Ia supernovae as long as CSM interaction continues. Type Ia supernovae with progenitor mass-loss rates between and may not have a CSM that is dense enough to affect spectra to make them Type Ia-CSM, but they may still result in Type Ia supernovae with an early optical flux excess. Because they have a persistent ultraviolet flux excess, ultraviolet light curves around the luminosity peak would be significantly different from those with a low-density CSM.
keywords:
supernovae: general – circumstellar matter1 Introduction
Type Ia supernovae (SNe Ia) are thermonuclear explosions of white dwarfs (e.g., Nugent et al., 2011; Bloom et al., 2012). The evolutionary path leading to white dwarf explosions is a long-standing issue in astrophysics (e.g., Maeda & Terada, 2016; Livio & Mazzali, 2018; Wang, 2018; Soker, 2019, for recent reviews). Two major paths have been proposed. One is a so-called “single-degenerate” channel in which a white dwarf gains its mass through the accretion from a non-degenerate companion star (e.g., Nomoto, 1982). The other path is a “double-degenerate” channel in which coalescence of binary white dwarfs leads to a thermonuclear explosion (e.g., Iben & Tutukov, 1984; Webbink, 1984).
The two channels predict different properties of circumstellar matter (CSM) around SNe Ia. In the case of the single-degenerate channel, mass transfer from a non-degenerate star to a white dwarf can lead to mass loss (e.g., Chomiuk et al., 2012; Moriya et al., 2019, and references therein). Thus, single-degenerate systems can lead to the formation of an extended dense hydrogen-rich or helium CSM (e.g., Dragulin & Hoeflich, 2016). However, the double-degenerate channel involves two white dwarfs. Therefore, no significant mass loss forming a dense extended CSM is expected from such a system before the explosion. Observationally, a fraction of SNe Ia show clear signatures of interaction between the SN Ia ejecta and an extended dense hydrogen-rich or helium CSM in their optical light-curves and spectra (e.g., Hamuy et al., 2003; Dilday et al., 2012; Silverman et al., 2013; Kool et al., 2022; Sharma et al., 2023), and they are likely related to the single-degenerate channel. It is also possible that SN Ia signatures are often hidden in the interaction features and a certain fraction of interacting SNe are linked to SNe Ia (e.g., Leloudas et al., 2015; Jerkstrand et al., 2020). The fact that some SNe Ia tend to appear in star-forming regions also suggests importance of large mass loss in their progenitor systems and implies the existence of dense CSM around SNe Ia (e.g., Bartunov et al., 1994; Anderson et al., 2015; Pavlyuk & Tsvetkov, 2016; Hakobyan et al., 2016).
Several observational features have been linked to the possible presence of hydrogen-rich dense CSM around SNe Ia. For example, strong calcium absorption observed in early spectra of SNe Ia has been related to the existence of hydrogen-rich CSM (e.g., Gerardy et al., 2004; Mazzali et al., 2005a, b; Tanaka et al., 2008). Some SNe Ia also show hydrogen emission lines at late phases that could be excited by CSM interaction (e.g., Kollmeier et al., 2019; Vallely et al., 2019; Prieto et al., 2020; Elias-Rosa et al., 2021). In addition, narrow, blueshifted sodium absorption lines detected in SNe Ia are suggested to indicate the existence of extended CSM around their progenitors (e.g., Patat et al., 2007; Maguire et al., 2013). The density of extended CSM around SN Ia progenitor systems can also be probed by radio and X-ray observations of SNe Ia. However, no radio and X-ray emission from SNe Ia has been observed (e.g., Chomiuk et al., 2012, 2016; Pérez-Torres et al., 2014; Harris et al., 2016, 2018, 2021; Lundqvist et al., 2020; Russell & Immler, 2012; Margutti et al., 2012, 2014; Dwarkadas, 2023) except for SN 2020eyj (Kool et al., 2022)111There is a controversial case of SN 2005ke (Immler et al., 2006; Hughes et al., 2007). SN 2012ca was detected in X-rays (Bochenek et al., 2018), but it may not be a SN Ia (Inserra et al., 2016).. The lack of radio and X-ray detection indicates that the CSM density around SNe Ia is generally not as high as those predicted by the single-degenerate channel, but it is important to note that the inferred CSM density depends on uncertain physics determining the emission properties (e.g., Chomiuk et al., 2016). It is also possible that there is a delay between the accretion phase and explosion in the single-degenerate channel (e.g., Di Stefano et al., 2011; Justham, 2011).
In addition to the aforementioned CSM signatures, early emission from SNe Ia is suggested to contain information on progenitor systems of SNe Ia. Recent early SN Ia observations are starting to reveal that some SNe Ia have excess optical emission within several days after the explosions (e.g., Goobar et al., 2014; Cao et al., 2015; Marion et al., 2016; Jiang et al., 2017; Jiang et al., 2018; Jiang et al., 2020, 2021; Hosseinzadeh et al., 2017, 2022; Miller et al., 2018, 2020; Shappee et al., 2019; Li et al., 2019; Dimitriadis et al., 2019; Tucker et al., 2021; Burke et al., 2021; Ashall et al., 2022; Sai et al., 2022; Ni et al., 2022; Srivastav et al., 2022; Lim et al., 2023). The fraction of SNe Ia showing early excess emission is estimated to be % (e.g., Deckers et al., 2022; Magee et al., 2022). Early excess emission was originally suggested to be caused by the impact of the SN ejecta on a non-degenerate companion star in the progenitor system, and therefore to constitute evidence in favour of the single-degenerate channel (e.g., Kasen, 2010; Kutsuna & Shigeyama, 2015; Maeda et al., 2014; Liu et al., 2015). Other mechanisms have been proposed to cause early excess emission, such as mixing of to outer layers (e.g., Piro & Morozova, 2016; Noebauer et al., 2017; Maeda et al., 2018; Polin et al., 2019; Magee & Maguire, 2020; Magee et al., 2021), Doppler line shifts (Ashall et al., 2022), and existence of carbon and oxygen-rich envelope around white dwarfs (e.g., Ashall et al., 2021; Maeda et al., 2023). In addition to the excess emission, early colour evolution is found to have diversity in SNe Ia (e.g., Stritzinger et al., 2018; Bulla et al., 2020; Burke et al., 2022).
Another possible way to produce early excess emission is the interaction between the SN ejecta and a locally produced CSM. Interaction between SN ejecta and a confined, dense CSM composed mostly of carbon and oxygen has been suggested to cause early excess emission in SNe Ia (e.g., Dessart et al., 2014a; Levanon et al., 2015; Levanon & Soker, 2017, 2019; Piro & Morozova, 2016; Kromer et al., 2016). This type of CSM is expected to form during the merger of two white dwarfs in the double-degenerate channel (e.g., Hachinger et al., 2012; Schwab et al., 2012; Shen et al., 2012; Pakmor et al., 2013; Tanikawa et al., 2015). However, in the case of the single-degenerate channel, extended hydrogen-rich CSM formed by the mass loss from progenitor systems is expected to exist as discussed earlier. In this study, we investigate how the early emission properties of SNe Ia are affected by the interaction between SN ejecta and such an extended hydrogen-rich CSM.
2 Methods
2.1 Numerical modelling
The interaction between SN ejecta and CSM involves the conversion of kinetic energy of SN ejecta to radiation. Thus, it is necessary to treat hydrodynamics and radiation transfer, as well as their mutual effects, simultaneously. We use the one-dimensional multi-frequency radiation hydrodynamics code STELLA (Blinnikov et al., 1998, 2000, 2006) to investigate the consequences of the interaction between SN ejecta and CSM in SNe Ia. STELLA has been used for light-curve modelling of SNe Ia (e.g., Blinnikov et al., 2006; Woosley et al., 2007; Kamiya et al., 2012; Noebauer et al., 2017), including the interaction between SN Ia ejecta and a confined, dense carbon-oxygen CSM (Noebauer et al., 2016). In short, STELLA numerically treats the hydrodynamic equations coupled with radiation, and implicitly solves the time-dependent equations of the angular moments of the radiation intensity averaged over a frequency bin by using the variable Eddington method. STELLA calculates spectral energy distributions (SEDs) at each time step. Multicolour light-curves can be obtained by convolving filter functions with the SEDs. The standard 100 frequency bins in the SED calculations, i.e., from 1 Å to Å on a log scale, are adopted in this study. STELLA assumes spherical symmetry in calculating hydrodynamic and radiation properties. Although SNe Ia and their CSM may not be spherical (e.g., Liu et al., 2017), our assumption of spherical symmetry would be good enough to obtain the overall properties of CSM interaction features in SNe Ia (cf. Cikota et al., 2019).
2.2 Initial conditions
We take the hydrodynamic structure of the W7 model in Nomoto et al. (1984); Thielemann et al. (1986) to represent the SN Ia ejecta. The W7 model is a carbon fast deflagration explosion model of a white dwarf. The W7 model is known to explain the overall properties of SNe Ia (e.g., Nugent et al., 1997; Tanaka et al., 2011), although its nucleosynthesis is known to have some issues (e.g., Iwamoto et al., 1999). Because in the W7 model the SN ejecta properties and the mass, which are the most influential photometric properties of SNe, are overall consistent with SN Ia observations (e.g., Stehle et al., 2005; Mazzali et al., 2008), it is reasonable to adopt it to investigate the effects of CSM interaction in SN Ia photometric properties.
Before colliding on the CSM, the SN Ia ejecta are assumed to expand homologously for when the outermost layers reach . Because the most extended companion stars in SN Ia progenitor systems are likely red giants having radii of (e.g., Hachisu et al., 1996), the CSM interaction may actually start earlier. Still, the collision time is small compared to the timescales of significant changes in photospheric properties. These occur on a timescale of several days, as shown below, such that the assumed collision radius is reasonable.
The CSM structure is attached to the SN ejecta at and extends above. If we assume that the progenitor system experienced steady mass loss, the CSM density can be expressed as
| (1) |
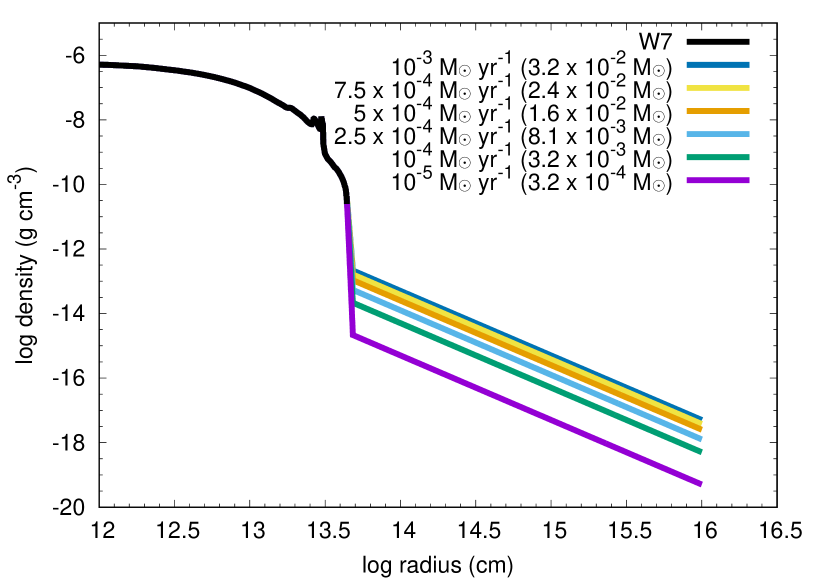
where is the mass-loss rate, is the wind velocity, and is the radius. The CSM density, which is the most influential parameter in CSM interaction, is determined by . In this paper, we assume and vary to investigate the effects of the interaction between SN Ia ejecta and CSM. Our results are not significantly affected by the wind velocity as long as this is smaller than the typical SN Ia ejecta velocity which is much larger than . Wind velocities of SN Ia progenitors are expected to be (e.g., Chomiuk et al., 2016). The CSM extends to in our standard models, so that the interaction continues through the peak of the light-curve. The choice of CSM radius does not affect our conclusions as long as the radius is sufficiently large, as discussed below. We also show some models with different CSM radii. The CSM is assumed to have solar composition. The exact composition, however, does not affect our results because the emission properties are mostly determined by the hydrodynamics. Fig. 1 shows the initial density structure of our standard models. Our models cover from to .
The major differences between our initial conditions and those in previous studies of interaction between SN Ia ejecta and CSM concern the density structure. Previous studies considered a CSM formed in the mergers of two white dwarfs and adopt a CSM density structure (e.g., Piro & Morozova, 2016; Maeda et al., 2018). Thus, the radius of the dense CSM in those studies is smaller than in our model. The CSM composition is also different, but this is not expected to affect interaction-powered light curves, as they are powered mechanically.


3 Results
3.1 Bolometric light-curves
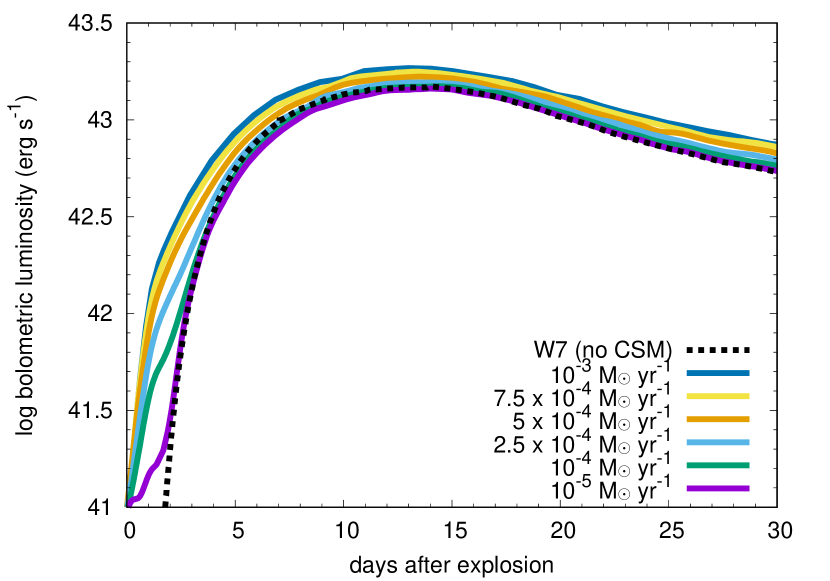
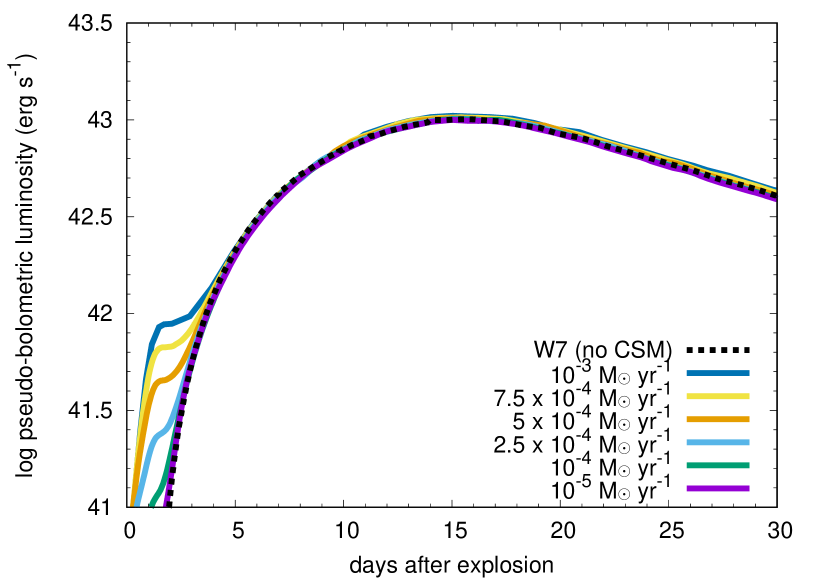
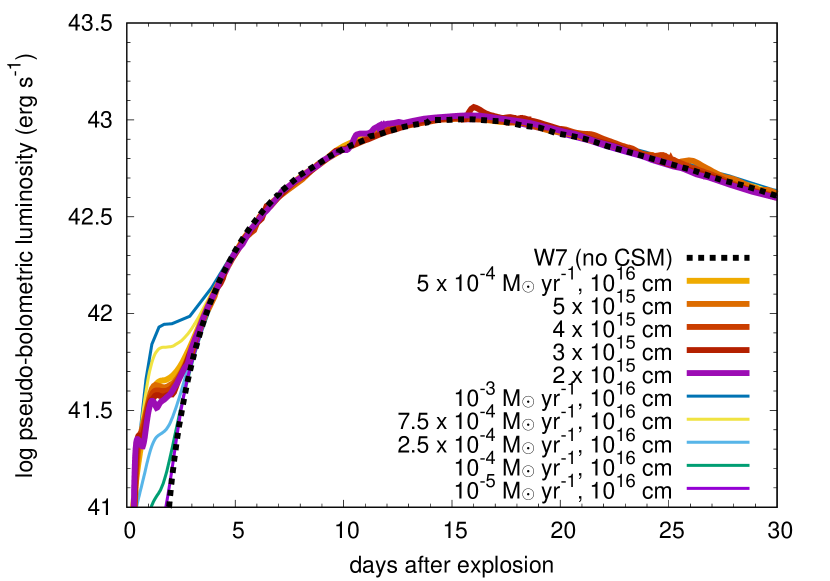
The top panel of Fig. 2 presents our synthetic bolometric light-curves. We can find that the existence of CSM affects light-curve properties of SNe Ia. When , the bolometric luminosity of SN Ia models with CSM deviate from that without CSM mostly at the earliest phases, within 4 days of explosion. Although CSM interaction continues at later phases, the luminosity from CSM interaction is much less than the luminosity caused by heating from and decay. When , the luminosity provided by CSM interaction becomes sufficiently high and the bolometric luminosity is higher than that in the model without CSM as long as the interaction continues. Even in these cases, tthough, the contribution of CSM impact to the luminosity is most significant at the earliest phases, within 4 days of explosion.
The bottom panel of Fig. 2 shows the pseudo-bolometric luminosity evolution that is obtained by integrating the fluxes at optical wavelengths ( Å). Compared to the bolometric light-curves, excess luminosity due to CSM interaction is only noticeable within 4 days of explosion in all the models. As discussed in the next section, the luminosity excess at later epochs is mostly at ultraviolet (UV) wavelengths. The effect of CSM interaction is only visible at optical wavelengths when , and only in the earliest phases.
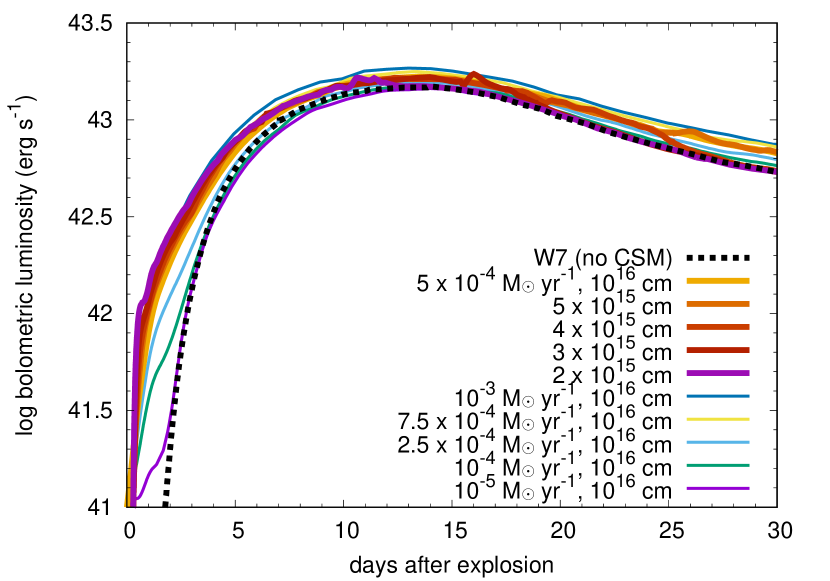
Fig. 3 shows the effects of CSM radius on the bolometric and pseudo-bolometric light-curves. The CSM is artificially cut at in our models, but the actual outer edge of the CSM is determined by the duration of the mass-loss phase from the progenitor system. Although there are slight differences caused by the CSM radius, the effect of CSM density is found to be much more significant than that of CSM radius. When the CSM radius is too small, however, CSM interaction does not persist long enough for a luminosity excess to be observed. To summarize, our conclusions in this work are not affected by our assumption on the CSM radius if this is large enough to cause CSM interaction at the earliest phases.
3.2 Optical and ultraviolet light-curves
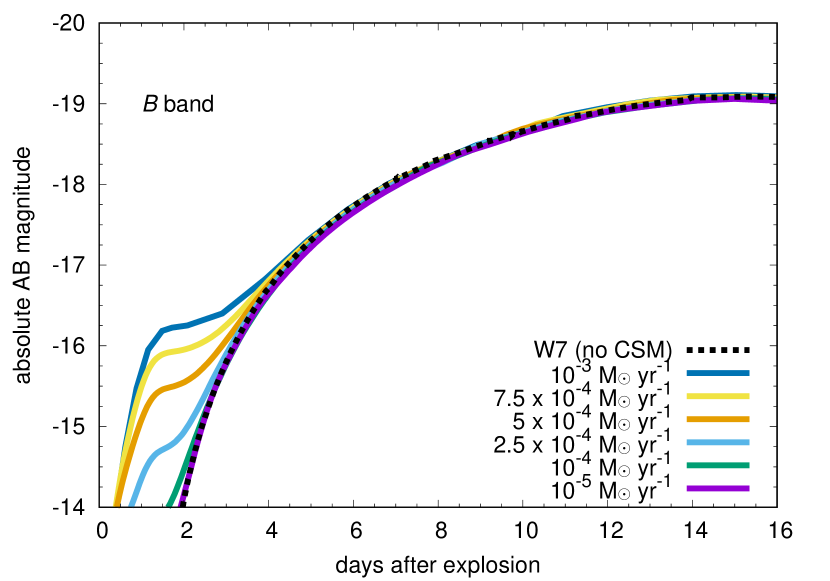
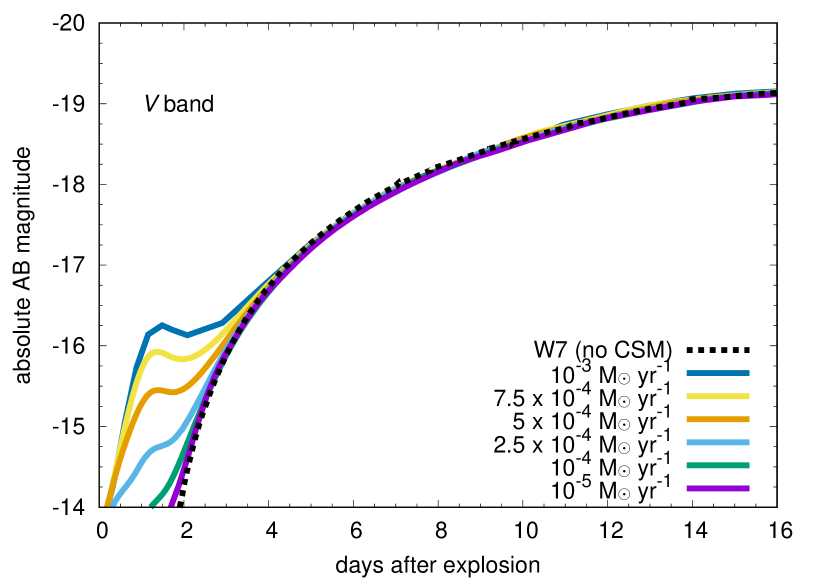
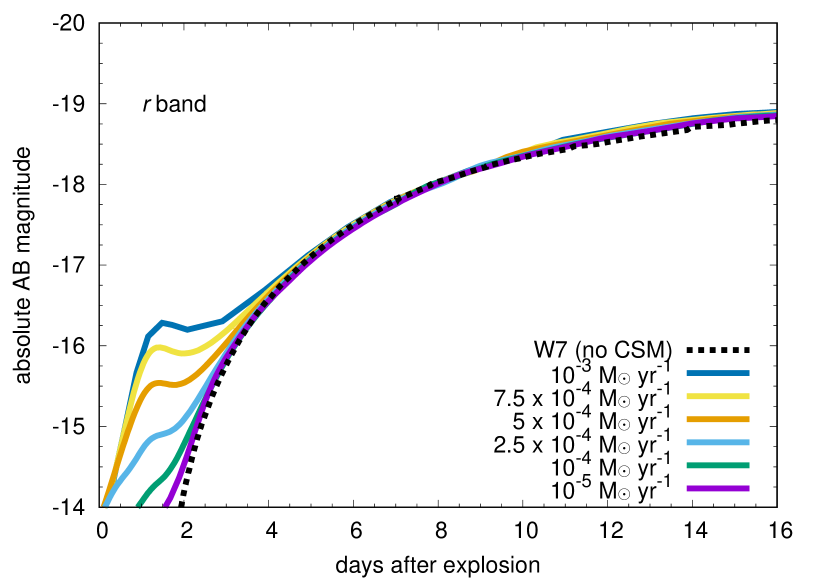
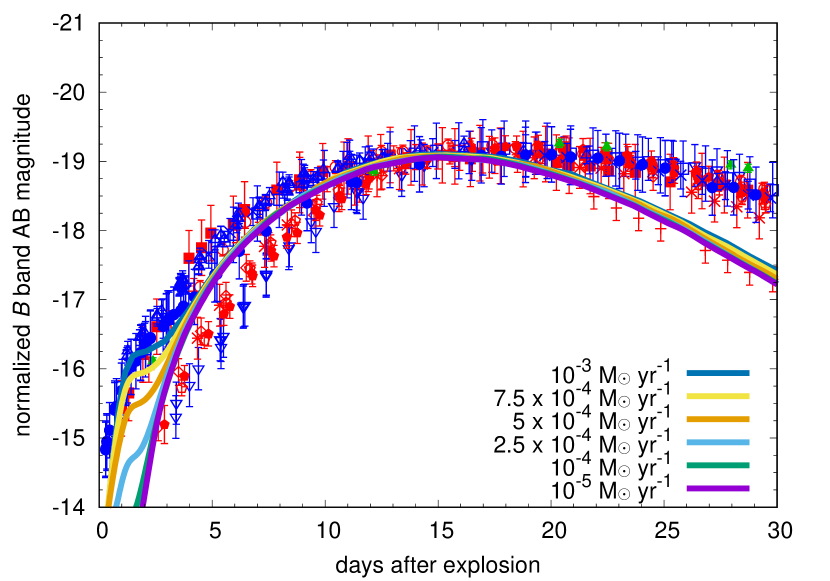
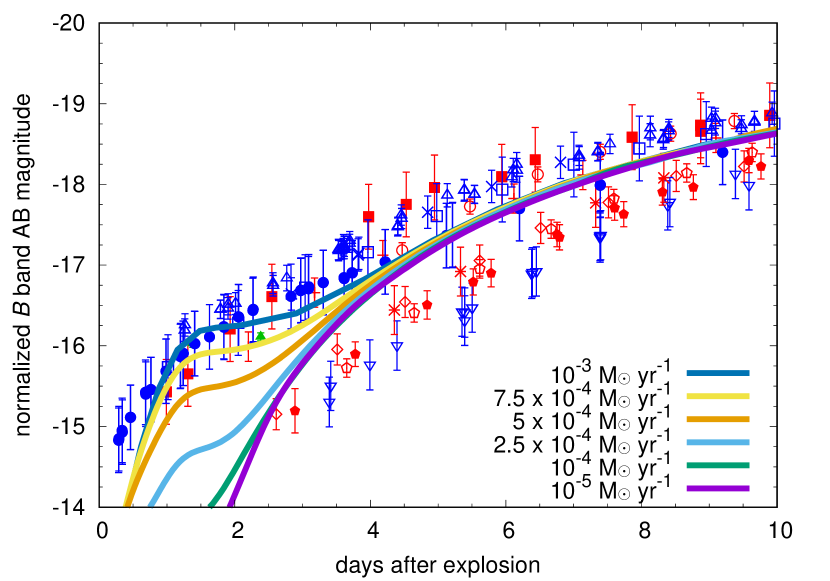
Fig. 4 shows our synthetic light-curves in optical bands. We show the light-curves in the B and V bands from the Carnegie Supernova Project (CSP, Hamuy et al. 2006) and the g and r bands from the Zwicky Transient Facility (ZTF, Bellm et al. 2019). As discussed in the previous section, optical light-curves are only affected at the earliest phases within 4 days of explosion. We can find that CSM interaction results in a significant early-phase flux excess in the optical bands when .
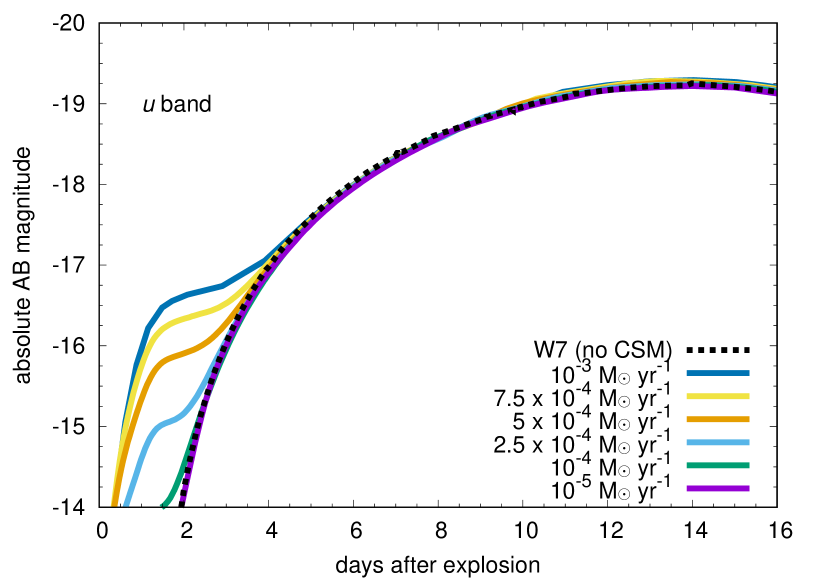
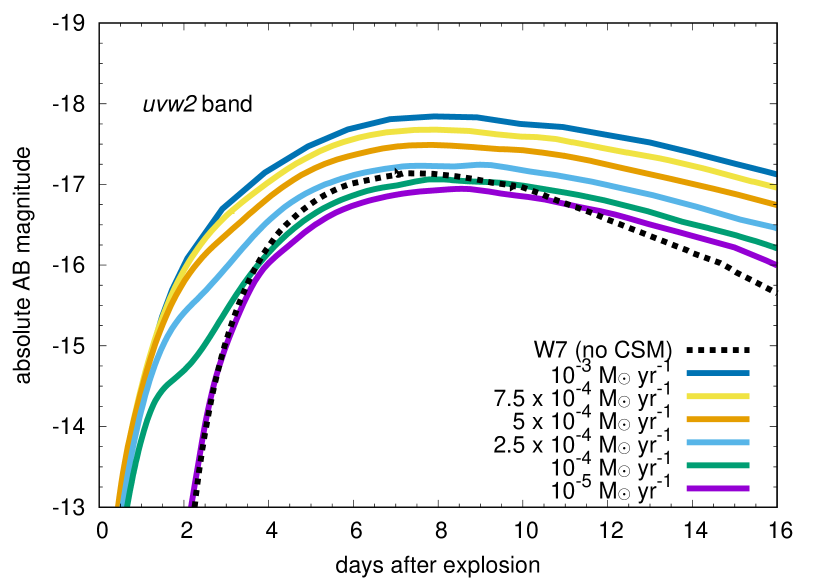
The light-curve evolution in UV bands below 3000 Å is presented in Fig. 5. We adopt the u band ( Å) from CSP, and the uvw2 and uvw1 bands from Neil Gehrels Swift Observatory (Gehrels et al., 2004; Roming et al., 2005), which are sensitive below 3000 Å. The u band light-curves have similar properties to those of the optical light-curves with the early-phase excess emission discussed above. However, UV light-curves below 3000 Å show significantly different light-curve features from those found in optical light-curves. In particular, the UV light-curves computed using show a persistent flux excess at all phases when interaction is active. The SN UV flux below 3000 Å is usually suppressed in SNe Ia by absorption by Fe-group elements (e.g., Höflich et al., 1998; Mazzali, 2000; Lentz et al., 2000; Kasen et al., 2006; Mazzali et al., 2014; Dessart et al., 2014b). Meanwhile, a large fraction of the radiation from CSM interaction is emitted at the UV wavelengths because of the high shock temperature ( K, e.g., Moriya et al. 2011). This UV flux is emitted at large radii and can therefore escape. Thus, the effect of CSM interaction is seen mainly at UV wavelengths, and the extra flux from CSM interaction can easily dominate the UV flux of interacting SNe Ia.
3.3 Colour
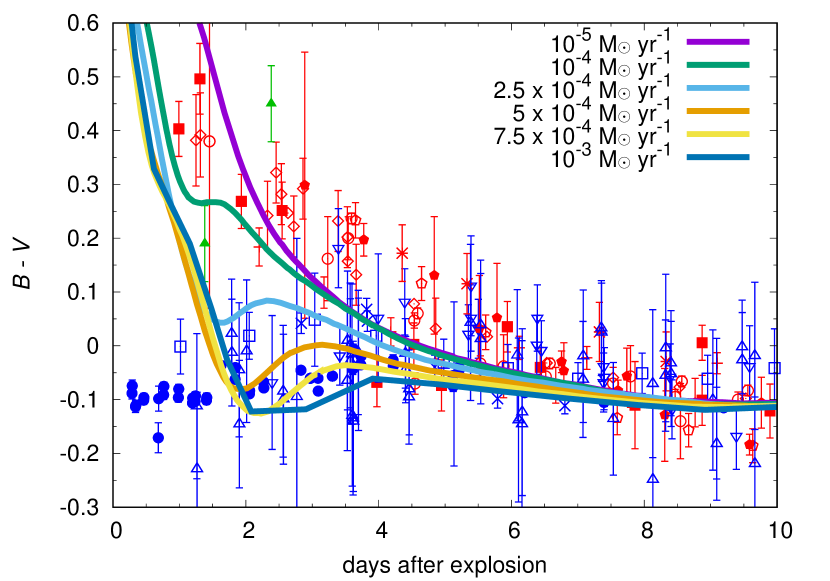
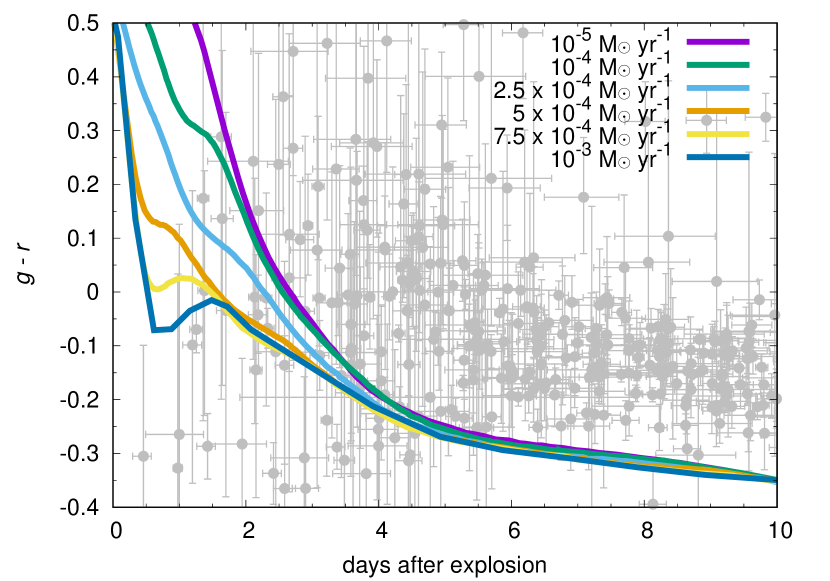
Fig. 6 shows that the colour evolution of our synthetic SN Ia models is also affected by CSM interaction. When the CSM density is high, SNe Ia are found to become blue more rapidly because of stronger CSM interaction. We discuss a comparison with observations in the next section.
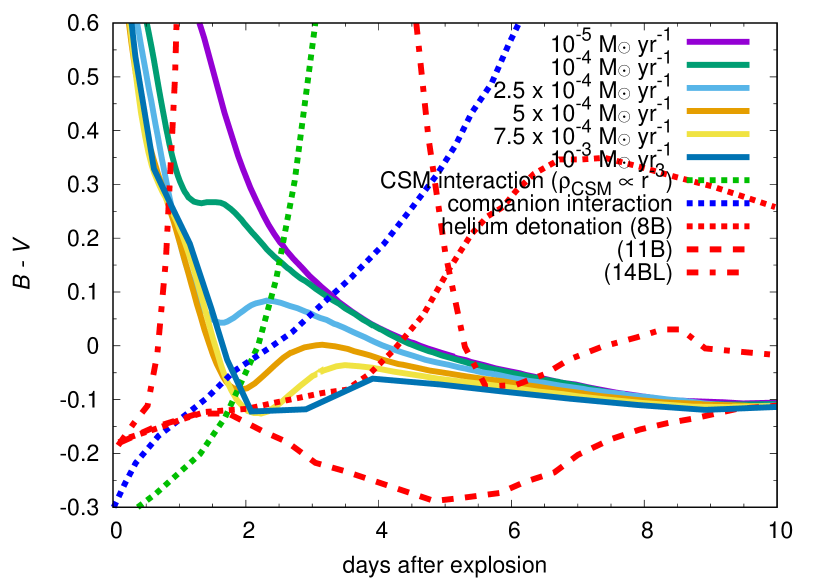
Figure 7 compares the colour evolution of several models predicting early flux excess in SNe Ia from Maeda et al. (2018). A CSM interaction model with a CSM density distribution of from a WD merger, a companion interaction model, and three helium detonation models ( at outer layers) are compared. Our CSM interaction model () is found to have a distinct colour evolution compared to other models.
4 Discussion
We have shown that the collision between SNe Ia ejecta and an extended CSM caused by a steady wind from the progenitor system leads to a flux excess in the SN optical light-curves in the first 4 days after explosion if with a wind velocity of 100 (Fig. 4). The colour evolution is also affected by CSM interaction (Fig. 6). It has been suggested that there may be distinct populations in colour evolution in the early phases () of SNe Ia (Stritzinger et al., 2018), although some studies find the evidence less conclusive (e.g., Bulla et al., 2020). In order to test whether interaction with a CSM could lead to the observed behaviour, the observed colour evolution of SNe Ia is compared to the colour evolution in our synthetic models in Fig. 6. In the case of the colour evolution presented by Stritzinger et al. (2018), we find that SNe Ia with an early red colour are consistent with the models with , while SNe Ia with an early blue colour evolution are more consistent with models with . The change from red evolution to blue evolution occurs over a small range of ().
The ZTF SNe Ia sample (Bulla et al., 2020) does not show the presence of two groups with different colour evolution (Fig. 6). Our synthetic models match the evolution of the SNe Ia sample in Stritzinger et al. (2018) well, from early to late phases, but the colour evolution is quite different at most phases from that of the ZTF SNe Ia as reported by Bulla et al. (2020). We cannot offer a clear reason for this difference. As our numerical calculations do not resolve spectral line features in the g and r bands well, some lines in spectra might be responsible for the difference. It is also possible that the explosion dates of the ZTF SN Ia sample, which are estimated by adopting a power-law function, are not well determined, and there might be a systematic shift in the colour evolution.
If the separation in colour evolution at early phases is the result of a difference in CSM, SNe Ia that are blue at the early phases should always have an early flux excess from CSM interaction. Fig. 8 shows the band light-curves of SNe Ia in the Stritzinger’s sample (top panel of Fig. 6). SNe Ia with an early B-band flux excess tend to have blue colour. In particular, the flux excess and early colour evolution of SN 2017cbv (Hosseinzadeh et al., 2017; Stritzinger et al., 2018) are well explained by our CSM interaction model. However, one SN Ia (SN 2009ig, Blondin et al. 2012; Foley et al. 2012; Marion et al. 2013) with early flux excess has red colour evolution. This suggests that more than one mechanism may be responsible for the early flux excess, as discussed in Section 1. The colour evolution of SN 2017cbv towards the blue is faster than the model prediction. It may be an effect of asphericity in the CSM, allowing photons from the interaction region to escape faster. The discrepancy between the synthetic and observed light curves after peak seen in Fig. 8 may be caused by differences inside the ejecta and it does not affect the early bumps caused by the interaction with the outermost ejecta.
An early flux excess due to CSM interaction requires mass-loss rates from SN Ia progenitor systems of at least , assuming a wind velocity of 100 . Such high mass-loss rates are usually excluded by radio and X-ray observations (Section 1). However, we do know that some SN Ia-CSM progenitor systems had mass-loss rates exceeding (e.g., Sharma et al., 2023). It is possible that SN Ia progenitor systems with do not exhibit clear CSM interaction signatures in spectra as do SNe Ia-CSM, but only show a flux excess in the light-curves.
SNe Ia with a moderate mass-loss rate such that they only show the early flux excess in optical bands but no spectroscopic signature may still show significant, persistent flux excess also in the UV, and CSM interaction may thus explain some diversity in the UV properties of SNe Ia (e.g., Brown et al., 2012; Brown & Crumpler, 2020; Pan et al., 2018; Pan et al., 2020; Srivastav et al., 2022; Sauer et al., 2008). Because % of SNe Ia show early flux excess (e.g., Deckers et al., 2022; Magee et al., 2022) and there are several mechanisms to cause early flux excess, up to around 10% of SNe Ia may have such early flux excess due to CSM interaction discussed in this paper. Chomiuk et al. (2016) estimated that less than 10% of SNe Ia have mass-loss rates higher than based on radio luminosity limits. This is consistent with our estimates of the fraction of SNe Ia with early flux excess from wind interaction. SN Ia progenitor systems with high mass-loss rates may result from optically thick winds (e.g., Kato & Hachisu, 1994) or common-envelope winds (e.g., Cui et al., 2022), for example. The fraction of SNe Ia with early flux excess from the CSM interaction is presumably higher than the fraction of SNe Ia-CSM among SNe Ia (% of SNe Ia, Sharma et al. 2023).
Finally, we note that SNe Ia without early flux excess show a rather slow light-curve rise, often referred to as a “dark phase” (e.g., Mazzali et al., 2001; Piro & Nakar, 2013). Fitting bolometric light curves with a function leads to an explosion date estimate of about one day later than the actual explosion date (Fig. 2). A difference of even just one day may be critical in interpreting the earliest photometric and spectroscopic properties of SNe Ia. Interpretation of early observational data needs a careful assessment of the explosion date.
5 Conclusions
We investigated the effect on the photometric properties of SNe Ia of the interaction between the SN ejecta and a surrounding hydrogen-rich, dense, extended CSM. The CSM is assumed to be formed by steady mass loss from the progenitor system. It is assumed to have an extended structure with (Eq. 1) and solar metallicity. An early flux excess in optical light-curves is caused by CSM interaction if . UV (below 3000 Å) light-curves are affected significantly and the flux excess there persists as long as CSM interaction continues.
CSM interaction also affects the early colour evolution in SNe Ia. When the CSM density is high enough to cause an early optical flux excess, the optical colour is also found to evolve rapidly towards the blue. Thus, CSM interaction may be partly responsible for the diversity of the early colour evolution that has been seen in SNe Ia. It is possible that a fraction of SNe Ia do not have high enough CSM density for the spectra to display the features of SNe Ia-CSM (), but still have a sufficient CSM density to cause early-phase flux excess in optical light-curves. This requires (). CSM interaction should also affect the X-ray and radio properties. Multi-wavelength observations of SNe Ia is therefore important in constraining their CSM properties. Such high mass-loss rates are rather extreme even among single-degenerate progenitor systems. However, even though systems with such high mass-loss rates may be rare, they can provide important clues as to the evolutionary path towards SNe Ia. Because the CSM interaction signatures appear clearly in the UV, early SN Ia observations by future ultraviolet satellites such as ULTRASAT222https://www.weizmann.ac.il/ultrasat/ and CASTOR333https://www.castormission.org/ will be critical in uncovering the circumstellar environments and progenitor systems of SNe Ia.
Acknowledgements
We thank Benjamin Shappee and Maximilian Stritzinger for useful discussions. This work was supported by the NAOJ Research Coordination Committee, NINS (NAOJ-RCC-22FS-0502, NAOJ-RCC-22FS-0503). PAM and EP are grateful for support and hospitality at NAOJ in Mitaka under program NAOJ-RCC-22FS-0502 and NAOJ-RCC-22FS-0503. TJM is supported by the Grants-in-Aid for Scientific Research of the Japan Society for the Promotion of Science (JP20H00174, JP21K13966, JP21H04997). AC acknowledges support by NASA grant JWST-GO-02114.032-A. Numerical computations were in part carried out on PC cluster at Center for Computational Astrophysics (CfCA), National Astronomical Observatory of Japan.
Data Availability
The data underlying this article will be shared on reasonable request to the corresponding author.
References
- Anderson et al. (2015) Anderson J. P., James P. A., Habergham S. M., Galbany L., Kuncarayakti H., 2015, Publ. Astron. Soc. Australia, 32, e019
- Ashall et al. (2021) Ashall C., et al., 2021, ApJ, 922, 205
- Ashall et al. (2022) Ashall C., et al., 2022, ApJ, 932, L2
- Bartunov et al. (1994) Bartunov O. S., Tsvetkov D. Y., Filimonova I. V., 1994, PASP, 106, 1276
- Bellm et al. (2019) Bellm E. C., et al., 2019, PASP, 131, 018002
- Blinnikov et al. (1998) Blinnikov S. I., Eastman R., Bartunov O. S., Popolitov V. A., Woosley S. E., 1998, ApJ, 496, 454
- Blinnikov et al. (2000) Blinnikov S., Lundqvist P., Bartunov O., Nomoto K., Iwamoto K., 2000, ApJ, 532, 1132
- Blinnikov et al. (2006) Blinnikov S. I., Röpke F. K., Sorokina E. I., Gieseler M., Reinecke M., Travaglio C., Hillebrandt W., Stritzinger M., 2006, A&A, 453, 229
- Blondin et al. (2012) Blondin S., et al., 2012, AJ, 143, 126
- Bloom et al. (2012) Bloom J. S., et al., 2012, ApJ, 744, L17
- Bochenek et al. (2018) Bochenek C. D., Dwarkadas V. V., Silverman J. M., Fox O. D., Chevalier R. A., Smith N., Filippenko A. V., 2018, MNRAS, 473, 336
- Brown & Crumpler (2020) Brown P. J., Crumpler N. R., 2020, ApJ, 890, 45
- Brown et al. (2012) Brown P. J., Dawson K. S., Harris D. W., Olmstead M., Milne P., Roming P. W. A., 2012, ApJ, 749, 18
- Bulla et al. (2020) Bulla M., et al., 2020, ApJ, 902, 48
- Burke et al. (2021) Burke J., et al., 2021, ApJ, 919, 142
- Burke et al. (2022) Burke J., et al., 2022, arXiv e-prints, p. arXiv:2207.07681
- Cao et al. (2015) Cao Y., et al., 2015, Nature, 521, 328
- Chomiuk et al. (2012) Chomiuk L., et al., 2012, ApJ, 750, 164
- Chomiuk et al. (2016) Chomiuk L., et al., 2016, ApJ, 821, 119
- Cikota et al. (2019) Cikota A., et al., 2019, MNRAS, 490, 578
- Cui et al. (2022) Cui Y., Meng X., Podsiadlowski P., Song R., 2022, A&A, 667, A154
- Deckers et al. (2022) Deckers M., et al., 2022, MNRAS, 512, 1317
- Dessart et al. (2014a) Dessart L., Blondin S., Hillier D. J., Khokhlov A., 2014a, MNRAS, 441, 532
- Dessart et al. (2014b) Dessart L., Hillier D. J., Blondin S., Khokhlov A., 2014b, MNRAS, 441, 3249
- Di Stefano et al. (2011) Di Stefano R., Voss R., Claeys J. S. W., 2011, ApJ, 738, L1
- Dilday et al. (2012) Dilday B., et al., 2012, Science, 337, 942
- Dimitriadis et al. (2019) Dimitriadis G., et al., 2019, ApJ, 870, L1
- Dragulin & Hoeflich (2016) Dragulin P., Hoeflich P., 2016, ApJ, 818, 26
- Dwarkadas (2023) Dwarkadas V. V., 2023, MNRAS, 520, 1362
- Elias-Rosa et al. (2021) Elias-Rosa N., et al., 2021, A&A, 652, A115
- Foley et al. (2012) Foley R. J., et al., 2012, ApJ, 744, 38
- Gehrels et al. (2004) Gehrels N., et al., 2004, ApJ, 611, 1005
- Gerardy et al. (2004) Gerardy C. L., et al., 2004, ApJ, 607, 391
- Goobar et al. (2014) Goobar A., et al., 2014, ApJ, 784, L12
- Hachinger et al. (2012) Hachinger S., Mazzali P. A., Taubenberger S., Fink M., Pakmor R., Hillebrandt W., Seitenzahl I. R., 2012, MNRAS, 427, 2057
- Hachisu et al. (1996) Hachisu I., Kato M., Nomoto K., 1996, ApJ, 470, L97
- Hakobyan et al. (2016) Hakobyan A. A., et al., 2016, MNRAS, 456, 2848
- Hamuy et al. (2003) Hamuy M., et al., 2003, Nature, 424, 651
- Hamuy et al. (2006) Hamuy M., et al., 2006, PASP, 118, 2
- Harris et al. (2016) Harris C. E., Nugent P. E., Kasen D. N., 2016, ApJ, 823, 100
- Harris et al. (2018) Harris C. E., et al., 2018, ApJ, 868, 21
- Harris et al. (2021) Harris C. E., Chomiuk L., Nugent P. E., 2021, ApJ, 912, 23
- Höflich et al. (1998) Höflich P., Wheeler J. C., Thielemann F. K., 1998, ApJ, 495, 617
- Hosseinzadeh et al. (2017) Hosseinzadeh G., et al., 2017, ApJ, 845, L11
- Hosseinzadeh et al. (2022) Hosseinzadeh G., et al., 2022, ApJ, 933, L45
- Hughes et al. (2007) Hughes J. P., Chugai N., Chevalier R., Lundqvist P., Schlegel E., 2007, ApJ, 670, 1260
- Iben & Tutukov (1984) Iben I. J., Tutukov A. V., 1984, ApJS, 54, 335
- Immler et al. (2006) Immler S., et al., 2006, ApJ, 648, L119
- Inserra et al. (2016) Inserra C., et al., 2016, MNRAS, 459, 2721
- Iwamoto et al. (1999) Iwamoto K., Brachwitz F., Nomoto K., Kishimoto N., Umeda H., Hix W. R., Thielemann F.-K., 1999, ApJS, 125, 439
- Jerkstrand et al. (2020) Jerkstrand A., Maeda K., Kawabata K. S., 2020, Science, 367, 415
- Jiang et al. (2017) Jiang J.-A., et al., 2017, Nature, 550, 80
- Jiang et al. (2018) Jiang J.-a., Doi M., Maeda K., Shigeyama T., 2018, ApJ, 865, 149
- Jiang et al. (2020) Jiang J.-a., et al., 2020, ApJ, 892, 25
- Jiang et al. (2021) Jiang J.-a., et al., 2021, ApJ, 923, L8
- Justham (2011) Justham S., 2011, ApJ, 730, L34
- Kamiya et al. (2012) Kamiya Y., Tanaka M., Nomoto K., Blinnikov S. I., Sorokina E. I., Suzuki T., 2012, ApJ, 756, 191
- Kasen (2010) Kasen D., 2010, ApJ, 708, 1025
- Kasen et al. (2006) Kasen D., Thomas R. C., Nugent P., 2006, ApJ, 651, 366
- Kato & Hachisu (1994) Kato M., Hachisu I., 1994, ApJ, 437, 802
- Kollmeier et al. (2019) Kollmeier J. A., et al., 2019, MNRAS, 486, 3041
- Kool et al. (2022) Kool E. C., et al., 2022, arXiv e-prints, p. arXiv:2210.07725
- Kromer et al. (2016) Kromer M., et al., 2016, MNRAS, 459, 4428
- Kutsuna & Shigeyama (2015) Kutsuna M., Shigeyama T., 2015, PASJ, 67, 54
- Leloudas et al. (2015) Leloudas G., et al., 2015, A&A, 574, A61
- Lentz et al. (2000) Lentz E. J., Baron E., Branch D., Hauschildt P. H., Nugent P. E., 2000, ApJ, 530, 966
- Levanon & Soker (2017) Levanon N., Soker N., 2017, MNRAS, 470, 2510
- Levanon & Soker (2019) Levanon N., Soker N., 2019, ApJ, 872, L7
- Levanon et al. (2015) Levanon N., Soker N., García-Berro E., 2015, MNRAS, 447, 2803
- Li et al. (2019) Li W., et al., 2019, ApJ, 870, 12
- Lim et al. (2023) Lim G., et al., 2023, arXiv e-prints, p. arXiv:2303.05051
- Liu et al. (2015) Liu Z.-W., Moriya T. J., Stancliffe R. J., 2015, MNRAS, 454, 1192
- Liu et al. (2017) Liu Z.-W., Stancliffe R. J., Abate C., Matrozis E., 2017, ApJ, 846, 117
- Livio & Mazzali (2018) Livio M., Mazzali P., 2018, Phys. Rep., 736, 1
- Lundqvist et al. (2020) Lundqvist P., et al., 2020, ApJ, 890, 159
- Maeda & Terada (2016) Maeda K., Terada Y., 2016, International Journal of Modern Physics D, 25, 1630024
- Maeda et al. (2014) Maeda K., Kutsuna M., Shigeyama T., 2014, ApJ, 794, 37
- Maeda et al. (2018) Maeda K., Jiang J.-a., Shigeyama T., Doi M., 2018, ApJ, 861, 78
- Maeda et al. (2023) Maeda K., Jiang J.-a., Doi M., Kawabata M., Shigeyama T., 2023, MNRAS, 521, 1897
- Magee & Maguire (2020) Magee M. R., Maguire K., 2020, A&A, 642, A189
- Magee et al. (2021) Magee M. R., Maguire K., Kotak R., Sim S. A., 2021, MNRAS, 502, 3533
- Magee et al. (2022) Magee M. R., et al., 2022, MNRAS, 513, 3035
- Maguire et al. (2013) Maguire K., et al., 2013, MNRAS, 436, 222
- Margutti et al. (2012) Margutti R., et al., 2012, ApJ, 751, 134
- Margutti et al. (2014) Margutti R., Parrent J., Kamble A., Soderberg A. M., Foley R. J., Milisavljevic D., Drout M. R., Kirshner R., 2014, ApJ, 790, 52
- Marion et al. (2013) Marion G. H., et al., 2013, ApJ, 777, 40
- Marion et al. (2016) Marion G. H., et al., 2016, ApJ, 820, 92
- Mazzali (2000) Mazzali P. A., 2000, A&A, 363, 705
- Mazzali et al. (2001) Mazzali P. A., Nomoto K., Cappellaro E., Nakamura T., Umeda H., Iwamoto K., 2001, ApJ, 547, 988
- Mazzali et al. (2005a) Mazzali P. A., Benetti S., Stehle M., Branch D., Deng J., Maeda K., Nomoto K., Hamuy M., 2005a, MNRAS, 357, 200
- Mazzali et al. (2005b) Mazzali P. A., et al., 2005b, ApJ, 623, L37
- Mazzali et al. (2008) Mazzali P. A., Sauer D. N., Pastorello A., Benetti S., Hillebrandt W., 2008, MNRAS, 386, 1897
- Mazzali et al. (2014) Mazzali P. A., et al., 2014, MNRAS, 439, 1959
- Miller et al. (2018) Miller A. A., et al., 2018, ApJ, 852, 100
- Miller et al. (2020) Miller A. A., et al., 2020, ApJ, 898, 56
- Moriya et al. (2011) Moriya T., Tominaga N., Blinnikov S. I., Baklanov P. V., Sorokina E. I., 2011, MNRAS, 415, 199
- Moriya et al. (2019) Moriya T. J., Liu D., Wang B., Liu Z.-W., 2019, MNRAS, 488, 3949
- Ni et al. (2022) Ni Y. Q., et al., 2022, arXiv e-prints, p. arXiv:2206.12437
- Noebauer et al. (2016) Noebauer U. M., Taubenberger S., Blinnikov S., Sorokina E., Hillebrandt W., 2016, MNRAS, 463, 2972
- Noebauer et al. (2017) Noebauer U. M., Kromer M., Taubenberger S., Baklanov P., Blinnikov S., Sorokina E., Hillebrandt W., 2017, MNRAS, 472, 2787
- Nomoto (1982) Nomoto K., 1982, ApJ, 253, 798
- Nomoto et al. (1984) Nomoto K., Thielemann F. K., Yokoi K., 1984, ApJ, 286, 644
- Nugent et al. (1997) Nugent P., Baron E., Branch D., Fisher A., Hauschildt P. H., 1997, ApJ, 485, 812
- Nugent et al. (2011) Nugent P. E., et al., 2011, Nature, 480, 344
- Pakmor et al. (2013) Pakmor R., Kromer M., Taubenberger S., Springel V., 2013, ApJ, 770, L8
- Pan et al. (2018) Pan Y. C., Foley R. J., Filippenko A. V., Kuin N. P. M., 2018, MNRAS, 479, 517
- Pan et al. (2020) Pan Y. C., Foley R. J., Jones D. O., Filippenko A. V., Kuin N. P. M., 2020, MNRAS, 491, 5897
- Patat et al. (2007) Patat F., et al., 2007, Science, 317, 924
- Pavlyuk & Tsvetkov (2016) Pavlyuk N. N., Tsvetkov D. Y., 2016, Astronomy Letters, 42, 495
- Pérez-Torres et al. (2014) Pérez-Torres M. A., et al., 2014, ApJ, 792, 38
- Piro & Morozova (2016) Piro A. L., Morozova V. S., 2016, ApJ, 826, 96
- Piro & Nakar (2013) Piro A. L., Nakar E., 2013, ApJ, 769, 67
- Polin et al. (2019) Polin A., Nugent P., Kasen D., 2019, ApJ, 873, 84
- Prieto et al. (2020) Prieto J. L., et al., 2020, ApJ, 889, 100
- Roming et al. (2005) Roming P. W. A., et al., 2005, Space Sci. Rev., 120, 95
- Russell & Immler (2012) Russell B. R., Immler S., 2012, ApJ, 748, L29
- Sai et al. (2022) Sai H., et al., 2022, MNRAS, 514, 3541
- Sauer et al. (2008) Sauer D. N., et al., 2008, MNRAS, 391, 1605
- Schwab et al. (2012) Schwab J., Shen K. J., Quataert E., Dan M., Rosswog S., 2012, MNRAS, 427, 190
- Shappee et al. (2019) Shappee B. J., et al., 2019, ApJ, 870, 13
- Sharma et al. (2023) Sharma Y., et al., 2023, arXiv e-prints, p. arXiv:2301.04637
- Shen et al. (2012) Shen K. J., Bildsten L., Kasen D., Quataert E., 2012, ApJ, 748, 35
- Silverman et al. (2013) Silverman J. M., et al., 2013, ApJS, 207, 3
- Soker (2019) Soker N., 2019, New Astron. Rev., 87, 101535
- Srivastav et al. (2022) Srivastav S., et al., 2022, arXiv e-prints, p. arXiv:2211.10544
- Stehle et al. (2005) Stehle M., Mazzali P. A., Benetti S., Hillebrandt W., 2005, MNRAS, 360, 1231
- Stritzinger et al. (2018) Stritzinger M. D., et al., 2018, ApJ, 864, L35
- Tanaka et al. (2008) Tanaka M., et al., 2008, ApJ, 677, 448
- Tanaka et al. (2011) Tanaka M., Mazzali P. A., Stanishev V., Maurer I., Kerzendorf W. E., Nomoto K., 2011, MNRAS, 410, 1725
- Tanikawa et al. (2015) Tanikawa A., Nakasato N., Sato Y., Nomoto K., Maeda K., Hachisu I., 2015, ApJ, 807, 40
- Thielemann et al. (1986) Thielemann F. K., Nomoto K., Yokoi K., 1986, A&A, 158, 17
- Tucker et al. (2021) Tucker M. A., et al., 2021, ApJ, 914, 50
- Vallely et al. (2019) Vallely P. J., et al., 2019, MNRAS, 487, 2372
- Wang (2018) Wang B., 2018, Research in Astronomy and Astrophysics, 18, 049
- Webbink (1984) Webbink R. F., 1984, ApJ, 277, 355
- Woosley et al. (2007) Woosley S. E., Kasen D., Blinnikov S., Sorokina E., 2007, ApJ, 662, 487