Optimizing SMS Reminder Campaigns for Pre- and Post-Diagnosis Cancer Check-Ups using Socio-Demographics: An In-Silco Investigation Into Bladder Cancer
Abstract
Timely pre- and post-diagnosis check-ups are critical for cancer patients, across all cancer types, as these often lead to better outcomes. Several socio-demographic properties have been identified as strongly connected with both cancer’s clinical dynamics and (indirectly) with different individual check-up behaviors. Unfortunately, existing check-up policies typically consider only the former association explicitly. In this work, we propose a novel framework, accompanied by a high-resolution computer simulation, to investigate and optimize socio-demographic-based SMS reminder campaigns for cancer check-ups. We instantiate our framework and simulation for the case of bladder cancer, the 10th most prevalent cancer today, using extensive real-world data. Our results indicate that optimizing an SMS reminder campaign based solely on simple socio-demographic features can bring about a statistically significant reduction in mortality rate compared to alternative campaigns by up to 5.8%.
Keywords: Cancer; Check-Up Reminders; Socio-clinical dynamics; Healthcare policy management; Bladder cancer.
1 Introduction
Cancer is a generic name for a wide range of diseases in which cells in the human body grow and reproduce uncontrollably, resulting in a broad spectrum of clinical conditions and complications, commonly resulting in low life quality and early death [1]. In addition to its potentially deadly clinical consequences, cancer is also associated with poor quality of life and a substantial economic burden on patients, their families, and the entire healthcare systems [2, 3]. The exact causes of cancer are yet to be fully understood, but a combination of genetic and environmental factors, including socio-demographic ones, are known to be strongly linked with the onset and progression of the disease [4].
There are many different types of cancer and each one may have a different set of risk factors and causes. Nonetheless, it is generally acknowledged that the early detection of the disease (via pre-diagnosis check-ups) and its appropriate monitoring for recurrence (via post-diagnosis check-ups) are pivotal in determining treatment options, reducing treatment costs, improving quality of life, and, arguably most important, lowering mortality rates across all patient groups [5, 6, 7, 8]. Thus, developing and implementing proper cancer check-up policies, both Pre- and Post-Diagnosis (PPD), is crucial [9]. Unfortunately, determining an optimal PPD check-up policy for a given individual is still an open, yet active, area of research [10, 11, 12, 13]. For example, [14] reviewed multiple policies for breast cancer PPD check-ups and found that the current policies lack clinical or economic evidence as to their effectiveness from a healthcare service provider (HSP) perspective. In a similar manner, [15] performed an evaluation of 20 check-up policies for breast cancer by considering the various costs associated with implementing these policies and the potential subsequent medical costs. The authors found that policies that are specifically tailored to different age groups result in significantly better outcomes. Accordingly, in order to derive socio-demographic-based PPD check-up policies, researchers commonly use mathematical models, a practice which has proved to be very powerful [16, 17, 18, 19, 20]. That is, researchers rely on data-driven models, usually trained with machine learning algorithms, and optimization techniques to derive approximated or optimal PPD check-up policies in a fast, secure, and affordable manner [21, 22, 23, 24].
Unfortunately, an optimized PPD check-up policy need not necessarily be followed by all individuals alike [25, 26]. That is, the real-world effectiveness of a PPD check-up policy strongly depends on individual compliance [27] which, in turn, is known to be strongly linked to one’s socio-demographic characteristics [28]. For example, [29] showed compliance to colorectal cancer screening is significantly higher in women than in men and changes non-linearly with age. In order to increase individual compliance, particularly in high-risk patient groups, various stakeholders such as HSPs and governmental agencies have been implementing diverse compliance-increasing strategies such as health education programs, taxation, discount offers, and SMS reminder campaigns [30, 31]. These strategies differ in their effectiveness, costs, and operational overhead. However, SMS reminder campaigns are often considered to be very effective, cheap, flexible, and operationally simple to implement compared to the mentioned alternatives. For example, [32] reviewed seven research projects concerning SMS reminder campaigns in Africa, concluding that vaccination reminder has led to improvements in vaccination uptakes under various metrics, whether through the increase in vaccination coverage, decrease in dropout rates, increase in completion rate or decrease in delay for vaccination. In particular, [33] showed that the SMS campaign gain similar clinical benefits to other approaches such as home visits while being significantly cheaper and much more scalable. [34] shown that SMS reminders can be used to reduce health and social inequity while providing better clinical outcomes for patients suffering from Human Immunodeficiency Virus. Unfortunately, to the best of our knowledge, existing cancer PPD check-up policies are currently accompanied by a naïve \sayone-size-fits-all SMS reminder campaigns, where all patients are treated the same.
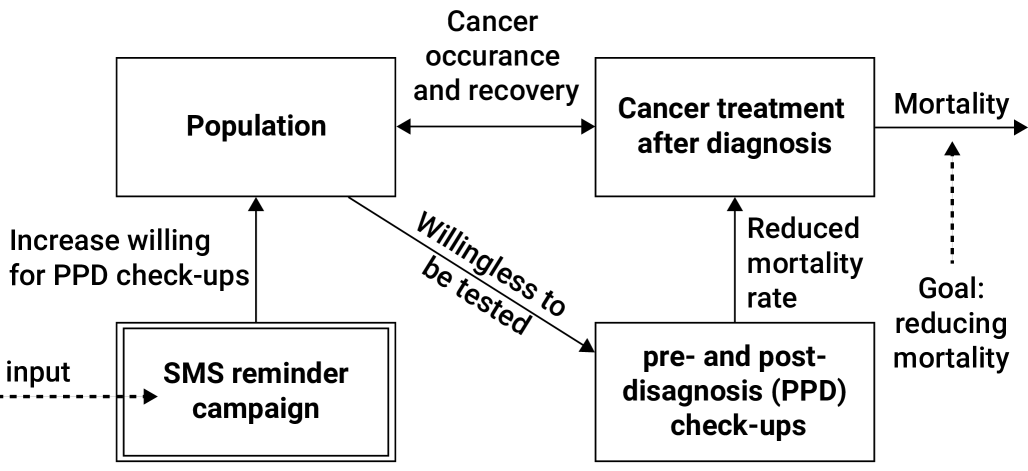
In this work, we propose a novel framework, accompanied by a high-resolution computer simulation, to investigate and optimize a socio-demographic-based SMS reminder campaign for cancer PPD check-ups. Our framework can be instantiated to any type of cancer and PPD policy, for which an optimal socio-demographic-based SMS reminder campaign is approximated through a Monte Carlo optimization technique. Fig. 1 shows a schematic view of the proposed model’s structure, input, and objective.
We instantiate our framework and provide an in-depth in silco investigation into Bladder Cancer (BC). BC is the 10th most common cancer worldwide, with more than half a million new cases yearly and 200 thousand associated deaths in 2018 [35]. A more recent report reveals 34 thousand BC-related deaths during 2021 and 90 thousand new cases in the United States alone [36], indicating a growing trend in both metrics. Similar trends are found in many other types of cancer as well [36]. BC is also associated has a high recurrence rate, invasive surveillance strategies, and high treatment costs which combine to make it the single most expensive cancer to manage in both England and the United States [37]. As such, BC is a prime candidate for the implementation of compliance-increasing strategies such as SMS reminder campaigns.
2 Framework
Our proposed framework consists of several interconnected components which are detailed and discussed below. First, we define the clinical dynamics of cancer’s onset and progression in the context of PPD check-ups and treatment. Then, we formalize the challenge of determining a PPD check-up policy as a resource-bounded optimization task. Based on these two components, we formulate the SMS reminder campaign optimization task and propose a Monte Carlo optimization technique that is shown to coverage to a near-optimal solution given enough computational resources. Then, we propose a fitting procedure to set the parameters of an instance of the framework using historical data and facilitates the fitting of unavailable parameters’ values that agree with realistic scenarios. Last, we detail how the different components are assembled together into a single framework.
2.1 Clinical dynamics
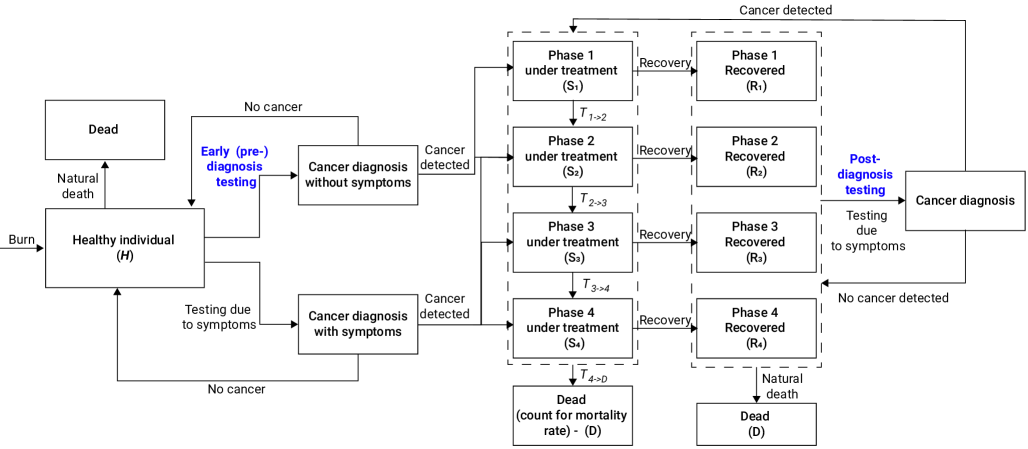
Individuals are categorized into one of 10 clinical-oncological statuses (denoted by their parameter): healthy ), sick at phase ( such that ) Recovered from phase ( such that ), and dead such that where is the population’s size at a given point in time. Individuals in the first (healthy) status were never diagnosed with cancer (). If the individual never gets sick with cancer, it eventually naturally dies after steps in time and transforms to the dead () status. Healthy individuals can perform a pre-diagnosis check-up by either following the existing pre-diagnosis policy or due to symptoms. We assume that if the individual suffers from symptoms, s/he will choose to perform a pre-diagnosis check-up regardless of the PPD policy. A policy-based pre-diagnosis check-up will result in one of three outcomes: either indicating that the individual is healthy () or s/he has cancer of phase 1 or 2 (). Note that cancer of phase 3 must include significant symptoms that are assumed to be noticeable by the medically-unprofessional patient such as extreme pain. In a similar manner, a check-up due to symptoms will either result in a non-cancer diagnosis (i.e., healthy () from a cancer perspective – potentially indicating a non-oncological disease), or a cancer diagnosis with either phase 2, 3, or 4 (). Once an individual is diagnosed, treatment takes place immediately. Each individual has a personal duration and probability to recover, according to their socio-demographic properties and cancer phase. If the individual dies during the treatment, it transforms into the dead () status, and mortality due to the disease is recorded. Otherwise, the individual recovers and transforms to the corresponding recovery phase . Similar to healthy individuals, any other individual eventually naturally dies after steps in time and transforms into the dead () status. Here, we assume that getting sick with cancer does not affect the individual’s life expectancy if s/he recovers from it. Similar to healthy individuals, recovered individuals can perform post-diagnosis check-ups following the post-diagnosis policy and/or due to symptoms. Here, both check-up types may result in a healthy outcome (i.e., the individual remains in the same clinical status) or in a cancer outcome (i.e., recurrent cancer) of phase [38, 39]. During the illness, the transition from one phase to the consecutive one, until death, follows a socio-demographic-based dynamics indicated by , , , and . Fig. 2 provides a schematic view of the clinical statuses and the flow between them as a result of PPD check-ups.
2.2 PPD check-up policy
Each individual in the population is represented by a timed finite state machine [40] as follows: where is the current clinical status of the individual, is the time passed from the last change of the clinical status , is the probability that the individual will naturally comply with the pre-diagnosis check-up (without any compliance-increasing strategy), is the individual’s degree of openness or susceptibility to compliance-increasing strategies, is the individual’s age, is the individual’s gender, is the relative socio-economic tenth percentile of the individual, and the time steps until the individual naturally dies.
From a socio-demographic perspective, the model uses parameters as indicated by the tuple : where is the probability that an individual would get sick with cancer for the first time, is the probability that the individual would get sick with recurrent cancer after recovering from phase , is the duration delta between two consecutive pre-diagnosis check-ups recommended to that individual, and is the duration delta between two consecutive post-diagnosis check-ups recommended to that individual. We assume that the life expectancy of an individual, , is dependent on the socio-economic status () and gender () alone.
It is important to note that we consider PPD check-up policies to be mere recommendations that cannot be enforced on any individual.
2.3 SMS reminder campaign
SMS (Short Message Service) reminder campaigns are a popular compliance-increasing strategy in healthcare [32, 34]. The implementing agency (e.g., HSP) can send any number of reminders to any subset of patients in order to encourage them to comply with the PPD policy [41]. Formally, an SMS reminder campaign is a function, , that accepts the population, represented by a set of finite state machines, over time and returns when and how many SMSs each socio-demographic group (defined by the and parameters of each individual) should get. Each SMS increases an individual’s likelihood to follow the PPD policy as proposed by [32]:
where and are the SMS effectiveness coefficients and is the number of SMSs the individual received thus far. In addition, each SMS has a fixed cost . Since the implementing agency is limited by some budget for a fixed duration , deriving an SMS reminder campaign can be formulated as the following resource-bounded optimization task:
| (1) |
where is a function that returns the average mortality rate during and is a function that returns the total cost of an SMS reminder campaign . Note that makes decisions in a discrete manner. Since is not able to pick a specific individual from each socio-demographic group as the and parameters of each individual are not available to in realistic cases, an SMS is sent in random inside each socio-demographic group in an equally distributed manner.
In order to solve the SMS reminder campaign optimization task (Eq. (1)), we used a Monte Carlo approach [42]. Namely, we sample the SMS reminder campaign parameter space. It takes a form of a four-dimensional tensor with one temporal dimension and three dimensions representing the age, gender, and socio-economic status of each socio-demographic group. Each value in the resulting matrix represents the relative part of the entire budget () allocated to SMS distribution among each socio-demographic group at each step in time. After the parameter values are set, we run the model for rounds and calculate the average mortality rate. If a configuration resulted in an average mortality rate smaller than any previous parameter configuration, we declare this configuration to be the best one so far. Since the parameter configuration space is finite, this computational procedure is guaranteed to converge to the optimal solution as the number of samples goes to infinity [43]. Overall, for the case of stochastic processes with random functions that are piecewise convex and a discrete state space, such as the case here, it has been proven elsewhere that this optimization process has a probability to reach the optimal solution that approaches one exponentially fast with an increase in the number of simulations [44].
2.4 Fitting procedure
In order to obtain the parameters that best fit historical records, we use the gradient descent (GD) method for the parameters’ space following [45]. Formally, given the model’s initial condition, the parameter space, historical data, and a loss function we use the GD method [46] to find the parameters that minimize on a fixed and finite duration in time such that . Formally, let us denote the parameter space by where is the number of parameters in the implemented framework. In addition, a specific parameter configuration is denoted by . We also denote the parameter configuration of the iteration of the GD by . Since the GD is computed on the parameter space with respect to a loss function , the gradient is numerically obtained by following the five-point stencil numerical scheme [47]:
where and is the step’s size.
For our case, let us assume an instance of the framework, , with the parameter configuration . In order to fit on historical data, we define a metric between the prediction of the mortality rate and the historically recorded mortality rate:
| (2) |
where is the historical recorded mortality rate, is a function that gets the simulation’s state as defined by the distribution of the individuals’ clinical state , and is a point in time and returns the average predicted mortality rate of the framework at this point in time. We define to be the mean absolute error of the predicted mortality rate since this is the metric that one, presumably, wishes to minimize using a designated SMS reminder campaign.
2.5 Assembling the components into a single framework
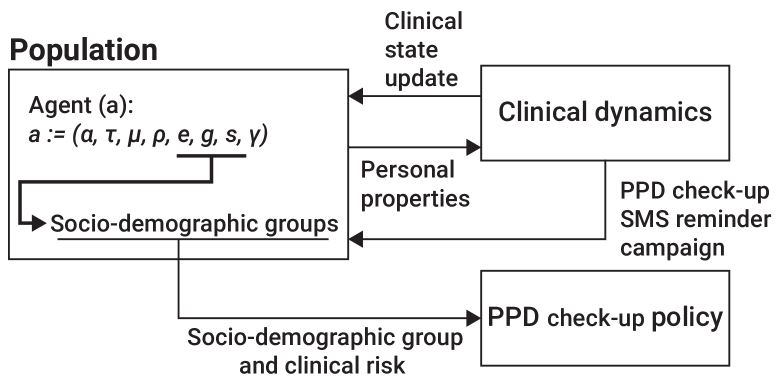
The framework has a global and discrete clock that all the individuals in the population follow. Namely, let us define each step in time as a round , where . In the first round (), the population is created to satisfy a pre-define co-distribution of socio-demographic and clinical distributions. The PPD check-up policy is defined and fixed at this stage as well. Then, at each round , each individual is following the PPD policy with its personal probability , according to its clinical status . Afterward, the clinical dynamics are executed for each individual in the population, in a random order. Right after, the SMS reminder campaign is activated based on the population’s state, sending, if any, SMSs to each socio-demographic group according to . In addition, the population naturally grows at a rate, which corresponds to its current size. All born individuals assume to keep the population’s socio-demographic co-distribution as identical as possible and set to be healthy (). Fig. 3 shows a schematic view of the framework’s components and the interactions between them.
3 Investigation Into Bladder Cancer
The following analysis consists of three parts: First, we outline the implementation of the above generic framework for the case of BC in the United States. Then, we propose five candidate SMS reminder campaigns targeted at minimizing the expected mortality rate. Last, we explore the characteristics of the best-performing SMS reminder campaign and its statistical relationship to its underlying socio-demographic characteristics.
3.1 BC Implementation
For realising the proposed framework, several parameters have to be set. Since most of the relevant data is available for the United States, it is the focus of our analysis. We rely on the following sources [48, 49, 50, 51, 52, 53, 54, 55] which are accrued, integrated, pre-processed for our needs and made available as a data file in the supplementary material. Specifically, in order to obtain the population’s growth rate (), we use the data of the United States population’s growth between 1950 and 2020111https://ourworldindata.org/grapher/population-growth-rate-with-and-without-migration, fitting a standard exponential smoothing time-series forecasting model [56]. The window size for this forecasting model is obtained using the grid search method, ranging between 2 and 25 years [57] and aiming to minimize the mean absolute error. For the life expectancy, , we use the United States average life expectancy as reported by the United Nations222https://www.macrotrends.net/countries/USA/united-states/life-expectancy, ranging between 1950 and 2020. In order to get the life expectancy divided into gender and socioeconomic status, we used life expectancy gender differences reported by [58] and the socioeconomic status differences reported by [59]. When the socioeconomic status is divided by tenths, this division results in 20 time-series with 12 constraints - 10 for the socioeconomic status, one for the gender differences, and one to agree with the average reported life expectancy. Since there are more relationships than constraints, there is an infinite number of possible solutions to this computational task. We find a feasible solution using the least mean square method [60], obtaining a time-series function for the life expectancy for each gender and socioeconomic status separately in the same way the population’s growth rate was obtained.
As the underlying PPD check-up policy, we consider the recommendation of the American Cancer Society333https://www.cancer.org/. Specifically, individuals are encouraged to perform a pre-diagnosis check-up once a year following the age of 45 (none before that) and post-diagnosis check-ups once a year for those recovered from phase 1 or 2, or twice a year for those recovered from phase 3 or 4 regardless of age. That is, people of all ages may be encouraged to perform check-ups and thus get SMS reminders. In order to find the SMS effectiveness coefficients (), we used the data reported by [32] and fitted it using the least mean square method [60]. In addition, we averaged the SMS sending cost of five leading SMS providers in the US, as manually sampled in 2023, obtaining an average SMS cost of 0.049 US dollars.
For initialization, we used the age, gender, and socioeconomic data from the US in 2022 as reported by the US Census Bureau444https://www.census.gov/topics/population/age-and-sex/data/tables.html. Since the data is not provided as the cross of all three properties (i.e., the number of individuals for each combination of age, gender, and socioeconomic status), we assume the age and gender distributions for each socioeconomic group are identical. This assumption is known to be false but it is commonly adopted due to a lack of finer-grained data at a publicly available level [61]. Overall, we include 333 million individuals in the initial condition, divided into 140 socio-demographic groups (i.e., two gender groups, seven age groups, and ten socioeconomic groups). In addition, we assume a budget of ten million dollars. We set and and each round, , to be a single day.
3.2 Parameter fitting
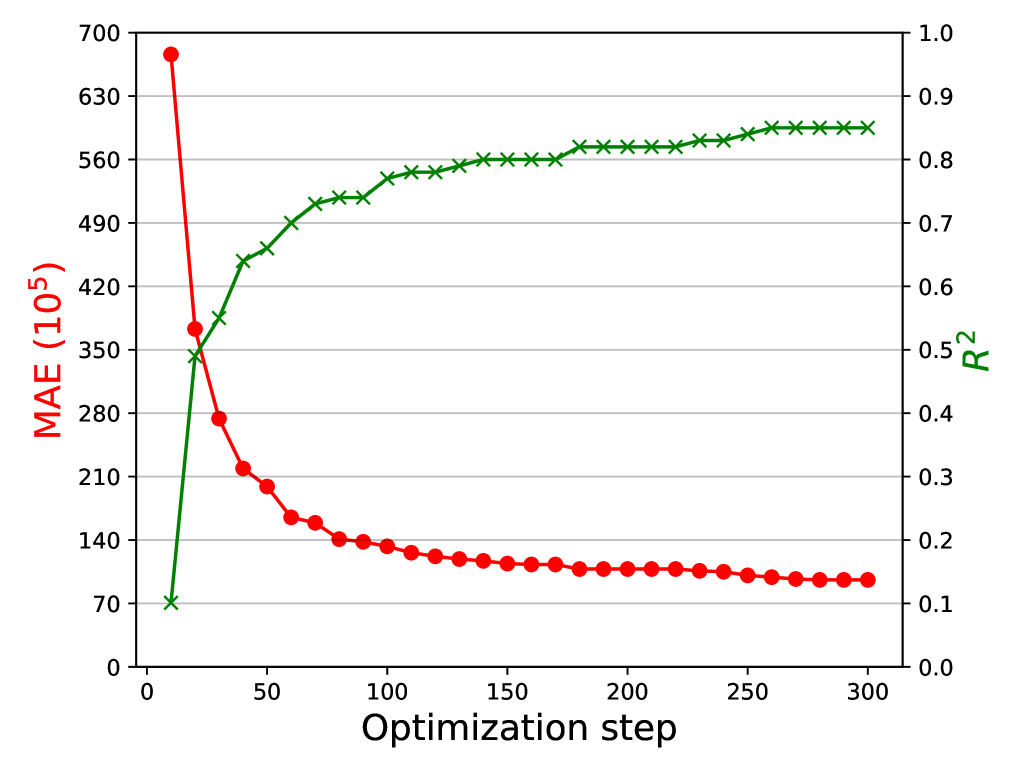
Given the framework’s initial condition and available parameter values (see Section 3.1), we used the proposed fitting procedure (see Section 2.4) in order to obtain the remaining parameter values that best align with historical data. Notably, as part of this process, we find the values of and across the population. This is important as these values are not readily available and can only be approximated by fitting a model that describes the dynamics of the observed historical data. Fig 4 shows the model’s MAE from the historical data (red line), as defined by Eq. (2), and the coefficient of determination () (green line). Due to the stochastic nature of the framework, the results are shown as the mean of simulations. We fitted both signals using the SciMed symbolic regression model [62], obtaining: and with and , respectively, where is the optimization step’s index. One can notice that the optimization process coverage around an MAE of with an of .
3.3 SMS reminder campaigns
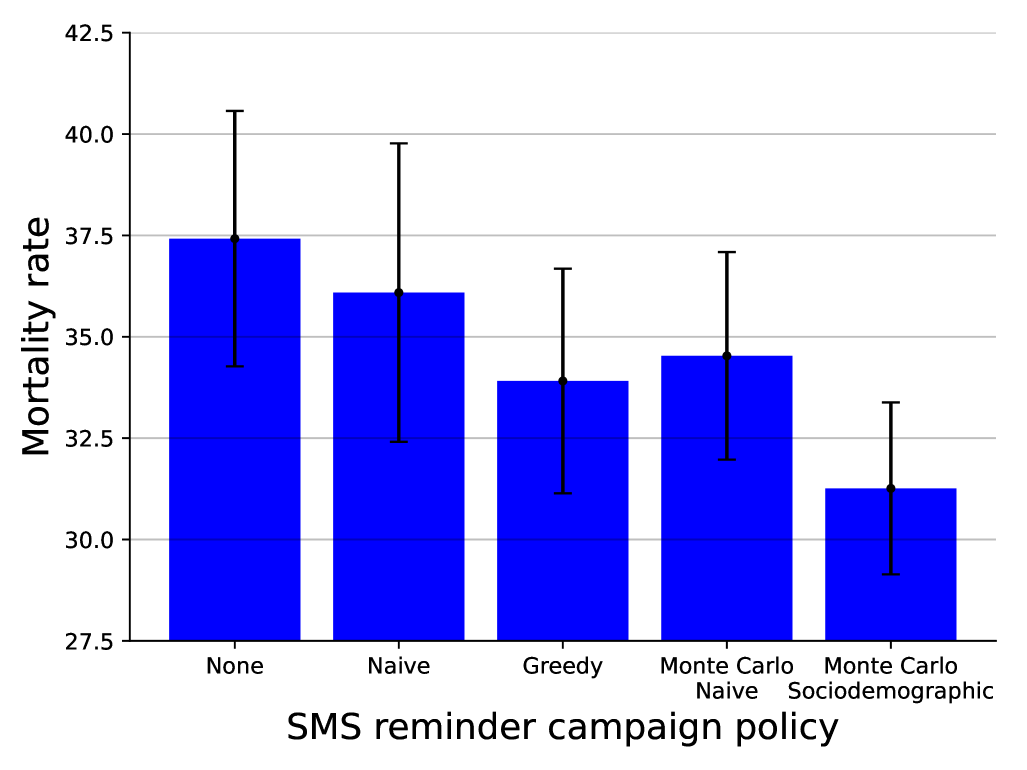
We compare five SMS reminder campaigns with increasing levels of sophistication: \sayNone, Naïve, Greedy, Naïve Monte Carlo, and Socio-demographic Monte Carlo. The first, the \sayNone campaign, indicates that there are no SMS reminders sent at all. The Naïve campaign treats all individuals as if they belong to the same (single) socio-demographic group. As such, the Naïve campaign treats individuals differently only based on the PPD check-up policy and their clinical state (). The Greedy campaign takes into consideration the mortality rate associated with each socio-demographic group such that the allocated budget to each group is proportional to its relative contribution to the overall mortality rate in the entire population. Namely, the Greedy campaign optimizes the SMS reminder campaign in every single step in time, ignoring the need to optimize for the entire duration . Finally, we evaluate two variants of the Monte Carlo optimized SMS reminder campaigns - a Naïve one, which does not consider the socio-demographic characteristics of each individual and thus it only optimizes for the timing and volume of reminders sent to each individual based on their clinical statuses (like the Naïve campaign); and a socio-demographic one which applies the socio-demographic-based Monte Carlo optimization technique (as formally described in Section 2.3). Both variants were trained for 10,000 instances before being applied in the following analysis.
Fig. 5 presents the comparison of these five SMS reminder campaigns. The results are shown as the mean standard deviation of simulations. One can notice that the Monte Carlo socio-demographic campaign (the right-most column) results in the lowest average mortality rate. In order to validate this outcome statistically, we computed ANOVA test [63] with a one-sided T-test post-hoc correction [64], obtaining that, indeed, this campaign is statistically better compared to the alternative campaigns with .
3.4 Campaign analysis
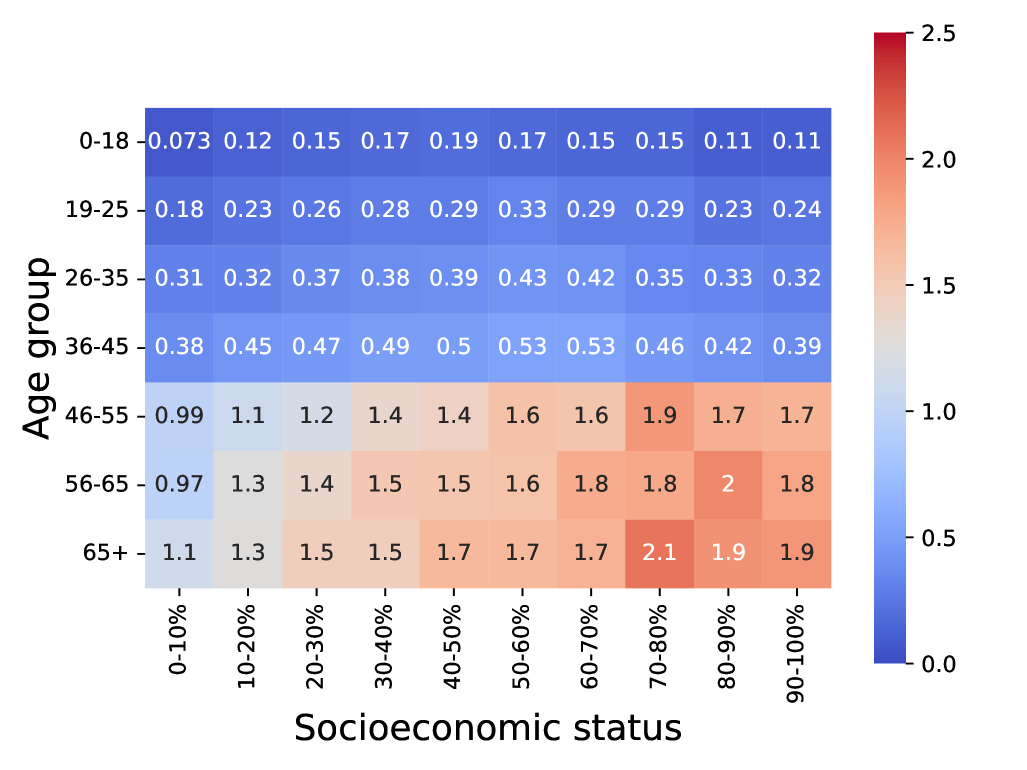
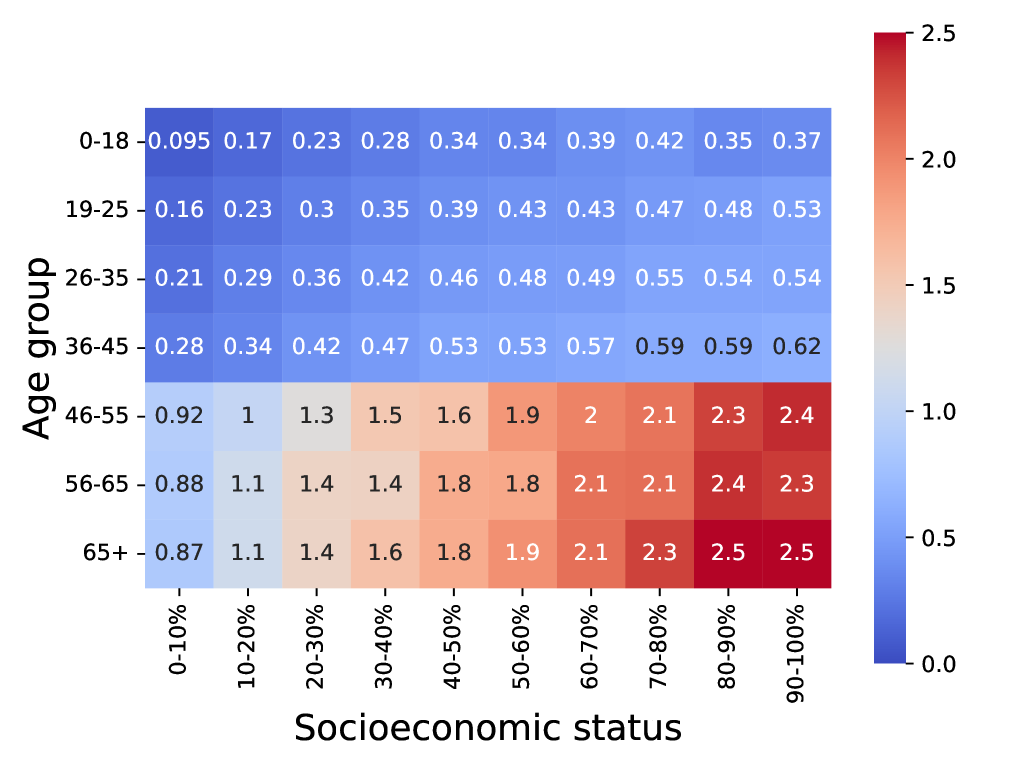
We further explore the best-performing SMS reminder campaign and analyze the relative amount of resources invested in each socio-demographic group. Fig. 6 shows the average yearly number of SMSs an individual in each socio-demographic group would get based on the Monte Carlo socio-demographic SMS reminder campaign, divided into male and female heatmaps. The figure shows that, generally speaking, older individuals with higher socio-economic status require more resources. In particular, a sharp shift in resource allocation is observed around age 45 and the 40% percentile of socio-economic statuses. In addition, for most of the age and socio-economic statuses, females get more reminders. Similar results were obtained when testing for two, five, fifteen, and eighteen million dollars budget with less than a five percent difference in the relative number of SMS an individual in each socio-demographic group gets between the two and eighteen million dollars budget.
4 Discussion
In this study, we proposed a novel framework and simulation that allows for the optimization and investigation of SMS reminder campaigns for cancer check-ups. Considering BC in the US as a representative example, we implemented the framework based on real-world historical data, and derived a Monte Carlo optimized SMS reminder campaign based on individuals’ socio-demographic characteristics. The resulting campaign is shown to favorably compare with sensible alternatives.
Our results first demonstrate the presumed adequacy of our proposed framework, at least in the case of BC. As can observe in Fig. 4, after fitting on historical data, the implemented framework can explain up to of the BC-related mortality variance. Using the currently practiced PPD check-up policy, a near-optimal socio-dempogrhaic SMS reminder campaign is found to be superior to several alternatives as presented in Fig. 5. This result generally agrees with the previous research on this subject [25, 26]. Namely, taking socio-demographic data into consideration leads to better performance of an SMS reminder campaign. Moreover, campaigns that operate for a long duration and consider the population’s clinical distribution seem to operate more favorably compared to greedy approaches which utilize the SMS reminder campaign’s budget quickly, raising much awareness yet in a short amount of time.
The derived campaign was also analyzed to identify the more targeted sub-populations. Fig. 6 suggests that the resource distribution is biased towards females and older individuals with a higher socioeconomic status. First, a sharp increase in the average yearly number of SMSs an individual gets occurred crossing the age of 45 years old. This shift can be easily explained by the practiced PPD check-up policy which indicates that pre-diagnosis check-ups are recommended only for individuals older than 45 years old. As such, up to this age group, the SMS reminder campaign is only required for post-diagnosis testing reminders. In addition, one can notice that the number of SMSs increases with age, as the number of cancer-recovered individuals is also increasing with age following more new cases as well as more individuals that recovered and stay healthy since. The slight increase towards higher socio-economic statuses can be associated with the and parameters of these subpopulations. Namely, individuals of higher socio-economic status may be associated with higher alternative costs to come for a check-up and therefore require more SMSs on average, as also suggested by [65]. Taken jointly, our results suggest that socio-demographic-aware SMS reminder campaigns for cancer PPD check-ups could prove extremely valuable even under strict budget constraints.
This study has important limitations which offer fruitful avenues for future research. First, it is assumed that the PPD check-ups are perfect and produce 100% accurate and reliable results as to an individual’s clinical status. Unfortunately, this is not true for most clinical tests in general, and oncological tests in particular [66]. Thus, our presented results should be treated as slightly over-optimistic of the expected realistic outcomes. In future work, we intend to tackle this shortcoming by integrating PPD check-up accuracy data. Second, alternative optimization techniques could be implemented to derive optimal SMS campaigns or potentially reduce the computational burden of obtaining a near-optimal one. Similarly, the lack of self-explainability of the resulting campaign should be tackled in order to promote its acceptance by stakeholders [67, 68, 69, 70, 71, 72]. Finally, when considering BC specifically, an individual’s occupation, smoking habits, and other contextual characteristics are known to be strong indicators for the risk of developing the disease [73, 74]. Thus, integrating these and similar features to the age, gender, and socioeconomic status which are currently integrated into the framework, might help to obtain even better outcomes.
Declarations
Funding
This research did not receive any specific grant from funding agencies in the public, commercial, or not-for-profit sectors.
Conflicts of interest/Competing interests
None.
Data availability
The data that has been used in this study is available by a formal request from the authors.
References
- [1] R. A. Weinberg. How cancer arises. Scientific American, 275(3):62–70, 1996.
- [2] A. B. Mariotto, K. R. Yabroff, Y. Shao, E. J. Feuer, and M. L. Brown. Projections of the cost of cancer care in the united states: 2010–2020. JNCI: Journal of the National Cancer Institute, 103(2):117–128, 2011.
- [3] K. Yabroff, J. Warren, and M. Brown. Costs of cancer care in the usa: a descriptive review. Nat Rev Clin Oncol, 4:643–656, 2007.
- [4] R. A. Weinberg. How cancer arises. Scientific American, 275(3):62–70, 1996.
- [5] J. D. Schiffman, P. G. Fisher, and P. Gibbs. Early detection of cancer: Past, present, and future. American Society of Clinical Oncology Educational Book, (35):57–65, 2015.
- [6] D. A. Mahvi, R. Liu, M. W. Grinstaff, Y. L. Colson, and C. P. Raut. Local cancer recurrence: The realities, challenges, and opportunities for new therapies. CA: A Cancer Journal for Clinicians, 68(6):488–505, 2018.
- [7] J. L. McCall, M. R. Cox, and D. A. Wattchow. Analysis of local recurrence rates after surgery alone for rectal cancer. Int J Colorect Dis, 10:126–132, 1995.
- [8] T. Sano, M. Sasako, T. Kinoshita, and K. Maruyama. Recurrence of early gastric cancer. follow-up of 1475 patients and review of the japanese literature. Cancer, 72:3174–3178, 1993.
- [9] A. M. Kamat, N. M. Hahn, J. A. Efstathiou, S. P. Lerner, P-U. Malmstrom, W. Choi, C. C. Guo, Y. Lotan, and W. Kassouf. Bladder cancer. The Lancet, 388(10061):2796–2810, 2016.
- [10] D. Crosby, S. Bhatia, K. V. Brindle, L. M. Coussens, C. Dive, M. Emberton, S. Esener, R. C. Fitzgerald, S. S. Gambhir, P. Kuhn, T. R. Rebbeck, and S. Balasubramanian. Early detection of cancer. Science, 375(6586):eaay9040, 2022.
- [11] R. Etzioni, N. Urban, S. Ramsey, M. McIntosh, S. Schwartz, B. Reid, J. Radich, G. Anderson, and L. Hartwell. The case for early detection. Nature Reviews Cancer, 3:243–252, 2003.
- [12] J. Dunstan, F. Villena, J. P. Hoyos, V. Riguelme, M. Royer, H. Ramirez, and J. Peypouquet. Predicting no-show appointments in a pediatric hospital in chile using machine learning. Health Care Management Science, 2023.
- [13] R. Elitzur, D. Krass, and E. Zimlichman. Machine learning for optimal test admission in the presence of resource constraints. Health Care Management Science, 2023.
- [14] P. Yuniar, S. Robinson, R. Moorin, and R. Norman. Economic evaluation of breast cancer early detection strategies in asia: A systematic review. Value in Health Regional Issues, 21:252–263, 2020.
- [15] M. Carles, E. Vilaprinyo, F. Cots, A. Gregori, R. Pla, R. Roman, M. Sala, F. Macia, X. Castells, and M. Rue. Cost-effectiveness of early detection of breast cancer in catalonia (spain). BMC Cancer, 11:192, 2011.
- [16] A. Yaniv-Rosenfeld, E. Savchenko, A. Rosenfeld, and T. Lazebnik. Scheduling bcg and il-2 injections for bladder cancer immunotherapy treatment. Mathematics, 11(5), 2023.
- [17] L. Shami and T. Lazebnik. Financing and managing epidemiological-economic crises: Are we ready for another outbreak? Journal of Policy Modeling, 45(1):74–89, 2023.
- [18] T. Lazebnik, S. Bunimovich-Mendrazitsky, and L. Shami. Pandemic management by a spatio–temporal mathematical model. International Journal of Nonlinear Sciences and Numerical Simulation, 2021.
- [19] Miao Bai, Ying Cui, Guangwen Kong, and Anthony Zhenhuan Zhang. No panic in pandemic: The impact of individual choice on public health policy and vaccine priority. University of Connecticut School of Business Research Paper, (21-02), 2021.
- [20] Facundo Piguillem and Liyan Shi. Optimal COVID-19 quarantine and testing policies. Covid Economics, 27:123–169, 2020.
- [21] H. Heesterbeek, R. M. Anderson, V. Andreasen, S. Bansal, D. De Angelis, C. Dye, K. T. D. Eames, W. J. Edmunds, S. D. W. Frost, S. Funk, T. D. Hollingsworth, T. House, V. Isham, P. Klepac, J. Lessler, J. O. Lloyd-Smith, C. J. E. Metcalf, D. Mollison, L. Pellis, J. R. C. Pulliam, M. G. Roberts, and C. Viboud. Modeling infectious disease dynamics in the complex landscape of global health. Science, 347(6227):aaa4339, 2015.
- [22] D. J. Nokes and R. M.. Anderson. Application of mathematical models to the design of immunization strategies. Reviews in Medical Microbiology, 4(1):1–7, 1993.
- [23] R. Deng, Z. Yang, M-Y. Chow, and J. Chen. A survey on demand response in smart grids: Mathematical models and approaches. IEEE Transactions on Industrial Informatics, 11(3):570–582, 2015.
- [24] T. Lazebnik, N. Aaroni, and S. Bunimovich-Mendrazitsky. Pde based geometry model for bcg immunotherapy of bladder cancer. Biosystems, 200:104319, 2021.
- [25] R. E.C. Evans, H. Brotherstone, A. Miles, and J. Wardle. Gender differences in early detection of cancer. The Journal of Men’s Health and Gender, 2(2):209–217, 2005.
- [26] R. G. Roetzheim, N. Pal, C. Tennant, L. Voti, J. Z. Ayanian, A. Schwabe, and J. P. Krischer. Effects of Health Insurance and Race on Early Detection of Cancer. JNCI: Journal of the National Cancer Institute, 91(16):1409–1415, 1999.
- [27] I. Rao, A. Shaham, A. Yavneh, D. Kahana, I. Ashlagi, M. L. Brandeau, and D. Yamin. Predicting and improving patient-level antibiotic adherence. Health Care Management Science, 23:507–519, 2020.
- [28] A. R. Metasari and A. Nurlina. Effect of health education about check breast self (sadari) on adolescent motivation in early detection of breast cancer. International Journal of Public Health Excellence, 2(1):244–247, 2022.
- [29] C. Pornet, O. Dejardin, F. Morlais, V. Bouvier, and G. Launoy. Socioeconomic determinants for compliance to colorectal cancer screening. a multilevel analysis. Journal of Epidemiology & Community Health, 64(4):318–324, 2010.
- [30] N. Irmayati, S. Yona, and A. Waluyo. Hiv-related stigma, knowledge about hiv, hiv risk behavior and hiv testing motivation among women in lampung, indonesia. Enfermería Clínica, 29:546–550, 2019.
- [31] A. Dube-Pule, B. C. Zanoni, C. Conolly, M. Shabangu, and M. Archary. Evaluation of an sms-based mhealth intervention to enhance early infant diagnosis follow-up testing and assessment of postnatal prophylaxis. Southern African Journal of HIV Medicine, 22(1), 2021.
- [32] K Manakongtreecheep. Sms-reminder for vaccination in africa: research from published, unpublished and grey literature. Pan Afr Med J, 2017.
- [33] G. U. Eze and A. O. Adeleye. Enhancing routine immunization performance using innovative technology in an urban area of nigeria. West African Journal of Medicine, 34(1), 2015.
- [34] L. Mao, A. Buchanan, H. T. H. Wong, and A. Persson. Beyond mere pill taking: Sms reminders for hiv treatment adherence delivered to mobile phones of clients in a community support network in australia. Health & Social Care in the Community, 26(4):486–494, 2018.
- [35] F. Bray, J. Ferlay, I. Soerjomataram, R. L. Siegel, L.A. Torre, and A. Jemal. Global cancer statistics 2018: Globocan estimates of incidence and mortality worldwide for 36 cancers in 185 countries. CA Cancer J Cling, 68(2):394–424, 2018.
- [36] R. L. Siegel, K. D. Miller, N. E. Fuchs, and A. Jemal. Cancer statistics, 2021. CA: A Cancer Journal for Clinicians, 71(1), 2021.
- [37] M. Eylert, L. Hounsome, R. Persad, A. Bahl, E. Jefferies, J. Verne, and H. Mostafid. Falling bladder cancer incidence from 1990 to 2009 is not producing universal mortality improvements. Journal of Clinical Urology, 7(2):90–98, 2014.
- [38] L. Beaugerie, F. Carrat, J-F. Colombel, A-M. Bouvier, H. Sokol, A. Babouri, F. Carbonnel, D. Laharie, J-L. Faucheron, T. Simon, A. de Gramont, and L. Peyrin-Biroulet. Risk of new or recurrent cancer under immunosuppressive therapy in patients with ibd and previous cancer. Gut, 63(9):1416–1423, 2014.
- [39] M. Friedlander and M. Grogan. Guidelines for the Treatment of Recurrent and Metastatic Cervical Cancer. The Oncologist, 7(4):342–347, 2002.
- [40] V. S. Alagar and K. Periyasamy. Extended Finite State Machine, pages 105–128. Springer London, 2011.
- [41] F. Bamba and S. J. Barnes. Sms advertising, permission and the consumer: a study. Business Process Management Journal, 13(6):815–829, 2007.
- [42] E. Zio. Monte Carlo Simulation: The Method, pages 19–58. Springer London, London, 2013.
- [43] Y. Peres, O. Schramm, S. Sheffield, and D. B. Wilson. Random-turn hex and other selection games. arXiv, 2006.
- [44] A. Shapiro and T. Homem-de Mello. On the rate of convergence of optimal solutions of monte carlo approximations of stochastic programs. SIAM Journal on Optimization, 11(1):70–86, 2000.
- [45] T. Lazebnik, L. Shami, and S. Bunimovich-Mendrazitsky. Spatio-temporal influence of non-pharmaceutical interventions policies on pandemic dynamics and the economy: the case of covid-19. Economic Research-Ekonomska Istraživanja, 35(1):1833–1861, 2022.
- [46] Haskell B Curry. The method of steepest descent for non-linear minimization problems. Quarterly of Applied Mathematics, 2(3):258–261, 1944.
- [47] D. W. Zingg. Comparison of high-accuracy finite-difference methods for linear wave propagation. SIAM Journal on Scientific Computing, 22(2):476–502, 2000.
- [48] S. F. Shariat, J. P. Sfakianos, M. J. Droller, P. I. Karakiewicz, S. Meryn, and B. H. Bochner. The effect of age and gender on bladder cancer: a critical review of the literature. BJU International, 105(3):300–308, 2010.
- [49] R. Madeb and E. M. Messing. Gender, racial and age differences in bladder cancer incidence and mortality. Urologic Oncology: Seminars and Original Investigations, 22(2):86–92, 2004.
- [50] P. Gupta, M. Jain, R. Kapoor, K. Muruganandham, A. Srivastava, and A. Mandhani. Impact of age and gender on the clinicopathological characteristics of bladder cancer. Indian J Urol, 25(2):207–210, 2009.
- [51] R. Densmore, M. Hajizadeh, and M. Hu. Trends in socio-economic inequalities in bladder cancer incidence in canada: 1992–2010. Can J Public Health, 110:722–731, 2019.
- [52] N. Mahdavifar, M. Ghoncheh, R. Pakzad, Z. Momenimovahed, and H. Salehiniya. Epidemiology, incidence and mortality of bladder cancer and their relationship with the development index in the world. Asian Pacific Journal of Cancer Prevention, 17:381–386, 2016.
- [53] A. Klapheke, S. A. Yap, K. Pan, and R. D. Cress. Sociodemographic disparities in chemotherapy treatment and impact on survival among patients with metastatic bladder cancer. Urologic Oncology: Seminars and Original Investigations, 36(6):308.e19–308.e25, 2018.
- [54] G. D. Datta, B. Neville, N. S. Datta, and C. Earle. Gender disparities in bladder cancer survival: An assessment of socio-demographic factors. Cancer Epidemiology, Biomarkers & Prevention, 15(12):B38–B38, 2006.
- [55] W. Yip, G. Cacciamani, and S.K. Bhanvadia. Disparities in bladder cancer outcomes based on key sociodemographic characteristics. Curr Urol Rep, 21:24, 2020.
- [56] B. Billah, M. L. King, R. D. Snyder, and A. B. Koehler. Exponential smoothing model selection for forecasting. International Journal of Forecasting, 22(2):239–247, 2006.
- [57] R. Liu, E. Liu, J. Yang, M. Li, and F. Wang. Optimizing the hyper-parameters for svm by combining evolution strategies with a grid search. Intelligent Control and Automation, 344, 2006.
- [58] H. Wang, A.E. Schumacher, C.E. Levitz, A. H. Mokdad, and C. J. L. Murray. Left behind: widening disparities for males and females in us county life expectancy, 1985–2010. Population Health Metrics, 11:8, 2013.
- [59] R. Chetty, M. Stepner, S. Abraham, S. Lin, B. Scuderi, N. Turner, A. Bergeron, and D. Cutler. The association between income and life expectancy in the united states, 2001-2014. JAMA, 315(16):1750–1766, 2016.
- [60] A. Bjorck. Numerical methods for least squares problems. Society for Industrial and Applied Mathematics, 5:497–513, 1996.
- [61] S. MacIntyre and K. Hunt. Socio-economic position, gender and health: How do they interact? Journal of Health Psychology, 2(3):315–334, 1997.
- [62] L. S. Keren, A. Liberzon, and T. Lazebnik. A computational framework for physics-informed symbolic regression with straightforward integration of domain knowledge. Scientific Reports, 13:1249, 2023.
- [63] E. R. Girden. ANOVA: Repeated measures. Number 84. Sage, 1992.
- [64] D. Kalpić, N. Hlupić, and M. Lovrić. Student’s t-Tests, pages 1559–1563. 2011.
- [65] S. Subramanian, G. Bobashev, and R. J. Morris. Modeling the Cost-Effectiveness of Colorectal Cancer Screening: Policy Guidance Based on Patient Preferences and Compliance. Cancer Epidemiology, Biomarkers & Prevention, 18(7):1971–1978, 2009.
- [66] J. Lee, K. K. Won, C. S. Hyun, H. Jimi, and P. S. Ho. Systematic review and meta-analysis of studies evaluating diagnostic test accuracy: A practical review for clinical researchers-part ii. statistical methods of meta-analysis. kjr, 16(6):1188–1196, 2015.
- [67] I. Blkadek and K. Krawiec. Counterexample-driven genetic programming for symbolic regression with formal constraints. IEEE Transactions on Evolutionary Computation, 2022.
- [68] M. Virgolin, T. Alderliesten, A. Bel, C. Witteveen, and P. A. N. Bosman. Symbolic regression and feature construction with gp-gomea applied to radiotherapy dose reconstruction of childhood cancer survivors. In Proceedings of the Genetic and Evolutionary Computation Conference, pages 1395–1402, 2018.
- [69] E. Savchenko and T. Lazebnik. Computer aided functional style identification and correction in modern russian texts. Journal of Data, Information and Management, 4:25–32, 2022.
- [70] G. Kronberger, F. O. de França, B. Burlacu, C. Haider, and M. Kommenda. Shape-constrained symbolic regression—improving extrapolation with prior knowledge. Evolutionary Computation, 30(1):75–98, 2022.
- [71] O. L. Liu, H-S. Lee, C. Hofstetter, and M. C. Linn. Assessing knowledge integration in science: Construct, measures, and evidence. Educational Assessment, 13(1):33–55, 2008.
- [72] A. Best, J. L. Terpstra, G. Moor, B. Riley, C. D. Norman, and R. E. Glasgow. Building knowledge integration systems for evidence‐informed decisions. Journal of Health Organization and Management, 23(6):627–641, 2009.
- [73] S. Bunimovich-Mendrazitsky, V. Pisarev, and E. Kashdan. Modeling and simulation of a low-grade urinary bladder carcinoma. Computers in biology and medicine, 58:118–129, 1996.
- [74] R. C. Reulen, E. Kellen, F. Buntinx, M. Brinkman, and M. P. Zeegers. A meta-analysis on the association between bladder cancer and occupation. Scandinavian Journal of Urology and Nephrology, 42(sup218):64–78, 2008.