Are Human Explanations Always Helpful?
Towards Objective Evaluation of Human Natural Language Explanations
Abstract
Human-annotated labels and explanations are critical for training explainable NLP models. However, unlike human-annotated labels whose quality is easier to calibrate (e.g., with a majority vote), human-crafted free-form explanations can be quite subjective. Before blindly using them as ground truth to train ML models, a vital question needs to be asked: How do we evaluate a human-annotated explanation’s quality? In this paper, we build on the view that the quality of a human-annotated explanation can be measured based on its helpfulness (or impairment) to the ML models’ performance for the desired NLP tasks for which the annotations were collected. In comparison to the commonly used Simulatability score, we define a new metric that can take into consideration of the helpfulness of an explanation for model performance at both fine-tuning and inference. With the help of a unified dataset format, we evaluated the proposed metric on five datasets (e.g., e-SNLI) against two model architectures (T5 and BART), and the results show that our proposed metric can objectively evaluate the quality of human-annotated explanations, while Simulatability falls short.
1 Introduction
Despite the recent advances of large-scale language models (LLM) (Devlin et al., 2019; Qin et al., 2023; Lewis et al., 2019; Raffel et al., 2020), which exhibit close-to-human performance on many natural language processing (NLP) tasks (e.g., Question Answering (Rajpurkar et al., 2016; Kočiskỳ et al., 2018; Mou et al., 2020, 2021; Xu et al., 2022), Natural Language Inference (Bowman et al., 2015; Williams et al., 2017; Wang et al., 2018), and Text Generation (Duan et al., 2017; Yao et al., 2022; Zhao et al., 2022)), humans are eager to know how State-of-the-Art (SOTA) models arrive at a prediction. Researchers working on natural language explanations111In this paper, we use “explanations” and “natural language explanations” to refer to the collective concepts of “free-text rationales” and “natural language explanation”, which differ from “rule-based” or “extractive” explanations. turned to human annotators for help by recruiting crowd-workers or experts to annotate both the labels and corresponding natural language explanations (Camburu et al., 2018; Rajani et al., 2019; Aggarwal et al., 2021; Wang et al., 2019b); Researchers can thus leverage human-annotated explanations to boost models’ prediction performance or train models to generate human-understandable natural language explanations.
However, the quality issue of human-annotated explanations has yet to be explored. Researchers often leverage popular Natural Language Generation (NLG) metrics such as BLEU (Papineni et al., 2002) and ROUGE (Lin, 2004) to evaluate the similarity between model-generated and human-annotated explanations, with a strong assumption that human-annotated ones are the gold standard. Nevertheless, unlike providing labels for classification or multiple-choice QA tasks Chen et al. (2021), different people may come up with distinct natural language explanations for the same observation Gebreegziabher et al. (2023). Two such explanations can be both correct even though the BLEU or ROUGE similarity may be low. Furthermore, human-given natural language explanations can often be subjective and task-dependent Lee et al. (2022). As a result, human-annotated explanations should not be simply treated as the gold standard Muller et al. (2021); instead, we take the view that the core value of explanations should be based on how much help they provide towards the model prediction instead of being based on notions of semantic similarity or word-matching.
| Dataset | Task | Task Format | Data Instances | Average explanation Length (token) | ||
| Train | Valid | Test | ||||
| CoS-E v1.0 | Commonsense QA | 3-choice Multiple-Choice | 7610 | 950 | - | 16.148 |
| CoS-E v1.11 | Commonsense QA | 5-choice Multiple-Choice | 9741 | 1221 | - | 8.996 |
| ECQA | Commonsense QA | 5-choice Multiple-Choice | 7598 | 1098 | 2194 | 63.572 |
| e-SNLI | Natural Language Inference | 3-label Classification | 549367 | 9842 | 9824 | 15.977 |
| ComVE | Commonsense Validation | 2-choice Multiple-Choice | 10000 | 1000 | 1000 | 10.288 |
To summarize our contributions in this paper:
1.
We provide an objective evaluation to quantify the human-annotated explanations’
helpfulness towards model performance.
Our evaluation metric is an extension of the Simulatability score (Doshi-Velez and Kim, 2017)
and we propose a prompt-based unified data format that can convert classification or multiple choice tasks into a unified multiple choice generation task format
to minimize the influence of structural variations across different tasks.
2.
Through an evaluation with five datasets and two models, our metric can rank explanations quality consistently across all five datasets on two model architectures while the Simulatability score (baseline) falls short.
3.
Our evaluation justifies the hypothesis that human explanations can still benefit model prediction, even if they were criticized as low-quality by prior literature’s human evaluation.
2 Related Work
2.1 Natural Language Explanation Datasets
Despite the development of new model architectures and potentially more significant parameters, these “black boxes” unavoidably lack the ability to explain their predictions; this led to increased efforts in the community to leverage human-annotated explanations to either train models with explanations or to teach them to self-rationalize. For example, Wiegreffe and Marasovic (2021) reviewed 65 datasets and provided a 3-class taxonomy of explanations: highlights, free-text, and structured. We focus on five large public datasets with free-text human-annotated explanations at the instance level (Table 1). We double-checked these datasets’ licenses, and no personally identifiable information (PII) exists.
One prominent dataset is CoS-E and its two variants CoS-E v1.0 and CoS-E v1.11(Rajani et al., 2019). It extended the Commonsense Question-Answering (CQA v1.0 and v1.11 versions) dataset (Talmor et al., 2018) by adding human-annotated explanations to the correct answer label. However, a few recent works suggest that the CoS-E’s explanation quality is not good, as Narang et al. (2020) independently hand-labeled some new explanations for CoS-E and found a very low BLEU score between its original explanations and the new ones. To improve the explanation’s quality, ECQA (Aggarwal et al., 2021) collected and summarized single-sentence explanation for each candidate answer into a natural language explanations for every data in the CQA v1.11 dataset. Sun et al. (2022) proved that CoS-E explanations are not as good as ECQA explanations based on human preferences. The fourth dataset is e-SNLI(Camburu et al., 2018), which consists of explanations for the Stanford Natural Language (SNLI) dataset (Bowman et al., 2015). Finally, the fifth dataset is ComVE (Wang et al., 2020), asking which one of two sentences is against commonsense. Later we evaluate the human-annotated explanations in the above-mentioned five datasets with our metric and an established baseline, the Simulatability score.
Worth mentioning that we do not include datasets such as SBIC (Sap et al., 2019) or E--NLI (Brahman et al., 2021). SBIC does not provide explanations for all the data, and E--NLI leverages various sources to augment the -NLI (Rudinger et al., 2020) dataset with explanations instead of providing human annotations.
2.2 Evaluation Metric for Explanations
Many commonly used evaluation metrics for text-based content like BLEU (Papineni et al., 2002) and ROUGE (Lin, 2004) treat human-annotated answers as the absolute gold standard without questioning or attempting to evaluate their quality. One established evaluation metric called Simulatability score derives from Human Simulatability (Doshi-Velez and Kim, 2017) and can examine gold explanations. It simply measures the change in a baseline model prediction performance, depending on whether the explanation is provided as the input. Previous works (Chandrasekaran et al., 2018; Yeung et al., 2020; Hase et al., 2020; Wiegreffe et al., 2020; Poursabzi-Sangdeh et al., 2021; Rajagopal et al., 2021) have demonstrated the usefulness of Simulatability score for evaluating explanation quality. However, this metric has a couple of inherent disadvantages. First, it only considers the helpfulness of explanations on a baseline model, where we show that explanations provide different helpfulness during fine-tuning and inference through our experiment in Section 4. In addition, model performance could also differ when we transform the original task into other tasks, such as turning a classification task into a multiple-choice task with different input data formats.
In order to objectively evaluate human-annotated explanations, we define a new evaluation metric based on the Simulatability score that complements both drawbacks of Simulatability by considering the helpfulness of explanations both at fine-tuning and inference with the help of a unified structure to minimize the impact of task differences. Other works (Carton et al., 2020) attempted to evaluate and categorize different characteristics of explanations, but many of them (Chan et al., 2022a; DeYoung et al., 2020) still treat human-annotated explanations as the gold standard.
2.3 Usage of Explanations for SOTA models
Existing works have been exploring circumstances in which explanations could improve model performance; for example, Hase and Bansal (2021) argues that explanations are most suitable for use as model input for predicting, and Kumar and Talukdar (2020) proposed a system to generate label-specific explanations for the NLI task specifically. Some recent works have tried to generate better explanations with a self-rationalization setting (Wiegreffe et al., 2020; Marasović et al., 2021), where a model is asked to generate the prediction label and explanation simultaneously. We conduct a preliminary experiment to find the best model setting to leverage explanations in Section 4.1.
There exists many recent works (Paranjape et al., 2021; Liu et al., 2021; Chen et al., 2022) that explore the usage of prompts to complete explanations, generate additional information for the original task, or examine whether generated explanations can provide robustness to adversarial attacks. Ye and Durrett (2022) showed that simply plugging explanations into a prompt does not always boost the in-context learning performance, and model-generated explanations can be unreliable for few-shot learning. Another related line of research focuses on extracting or generating explanations with a unified framework (Chan et al., 2022b) or with a teachable reasoning system that generates chains of reasoning (Dalvi et al., 2022).
3 Unified Structure
| Explanations as Input vs Output | Fine-tune Setting | ||
| Baseline | Self-rationalization | Infusion | |
| CoS-E v1.0 | 0.695 | 0.646 | 0.878 |
| ECQA | 0.572 | 0.513 | 0.989 |
While popular metrics like BLEU and ROUGE can evaluate text coherence and similarity, one critical aspect of explanations is how beneficial they can be. Thus, we want to develop a metric that objectively evaluates explanations’ utility towards model performance. Furthermore, we expect that such a metric can systematically demonstrate how good or bad the explanations are; for example, it could objectively measure what ‘noisy’ means in a human study (e.g., from previous works on CoS-E).
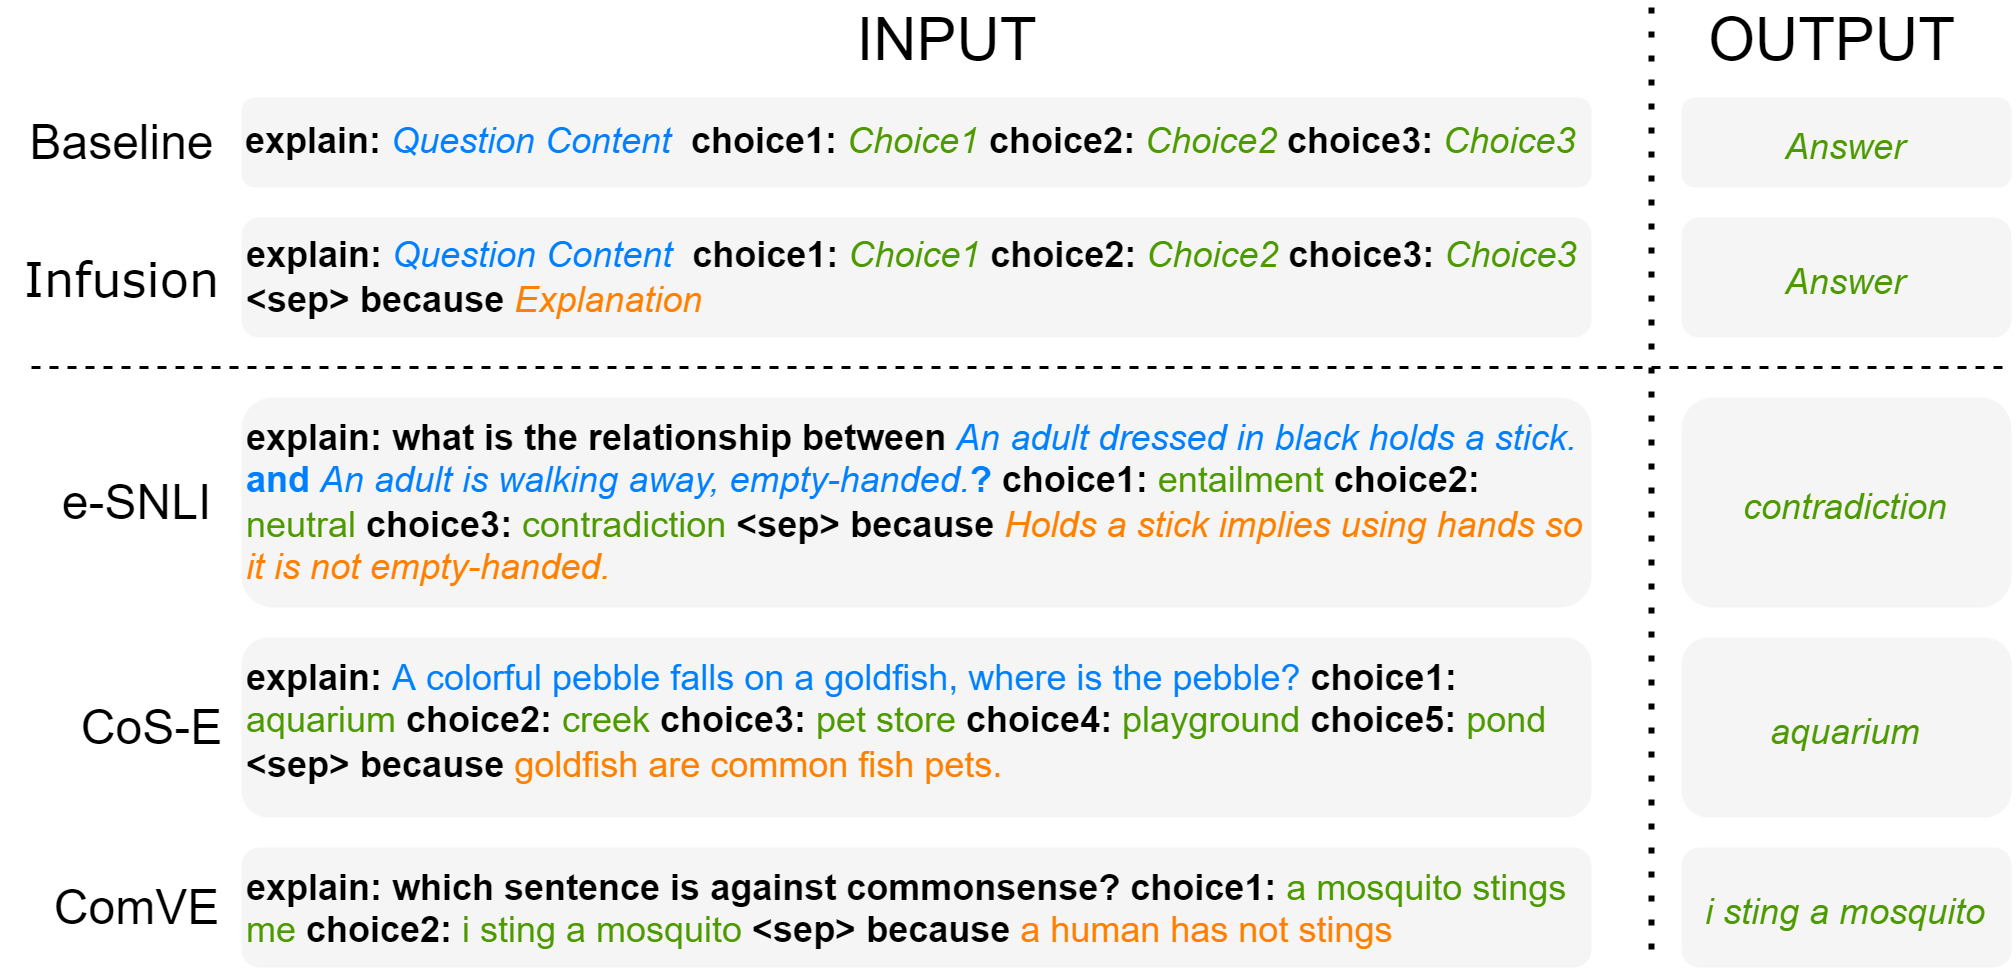
With the advantage of sequence-to-sequence models like T5 that can map different types of language tasks into generation tasks, we can control and minimize the influence of varying task formats on model performance while evaluating the helpfulness of explanations by leveraging a unified data format. We realize that existing datasets with human-annotated explanations are mostly either multiple-choice tasks or classification tasks. The classification task could be viewed as a multiple-choice task where the labels are indeed choices. Inspired by several previous works that manipulated prompts for sequence-to-sequence models (Marasović et al., 2021; Liu et al., 2021), we incorporate a few well-defined words as template-based prompts for the unified data structure to indicate the task content and corresponding explanations.
Examples shown in Figure 1 explain how we map various tasks into a unified multiple-choice generation task. We propose two settings: no explanations (Baseline ) and explanations as additional input (Infusion ). Here we explain how each prompt addresses a different part of the data content: 1) ‘explain:’ is followed by the question content, 2) ‘choice-:’ is followed by each candidate answer, and 3) a special token ‘<sep>’ separates the explanations from the task content, while the explanations in Infusion are led by ‘because’ so that the model knows that the explanation text explains the task content. For datasets like CoS-E and ECQA, we leverage the original task as the question content. On the other hand, we define fixed question prompts for e-SNLI: “what is the relation between [Premise] and [Hypothesis]?”, and for ComVE: “which sentence is against commonsense?” to specify corresponding tasks to models.
4 Preliminary Experiment
4.1 Utilizing Explanations as Part of Input vs Part of Output
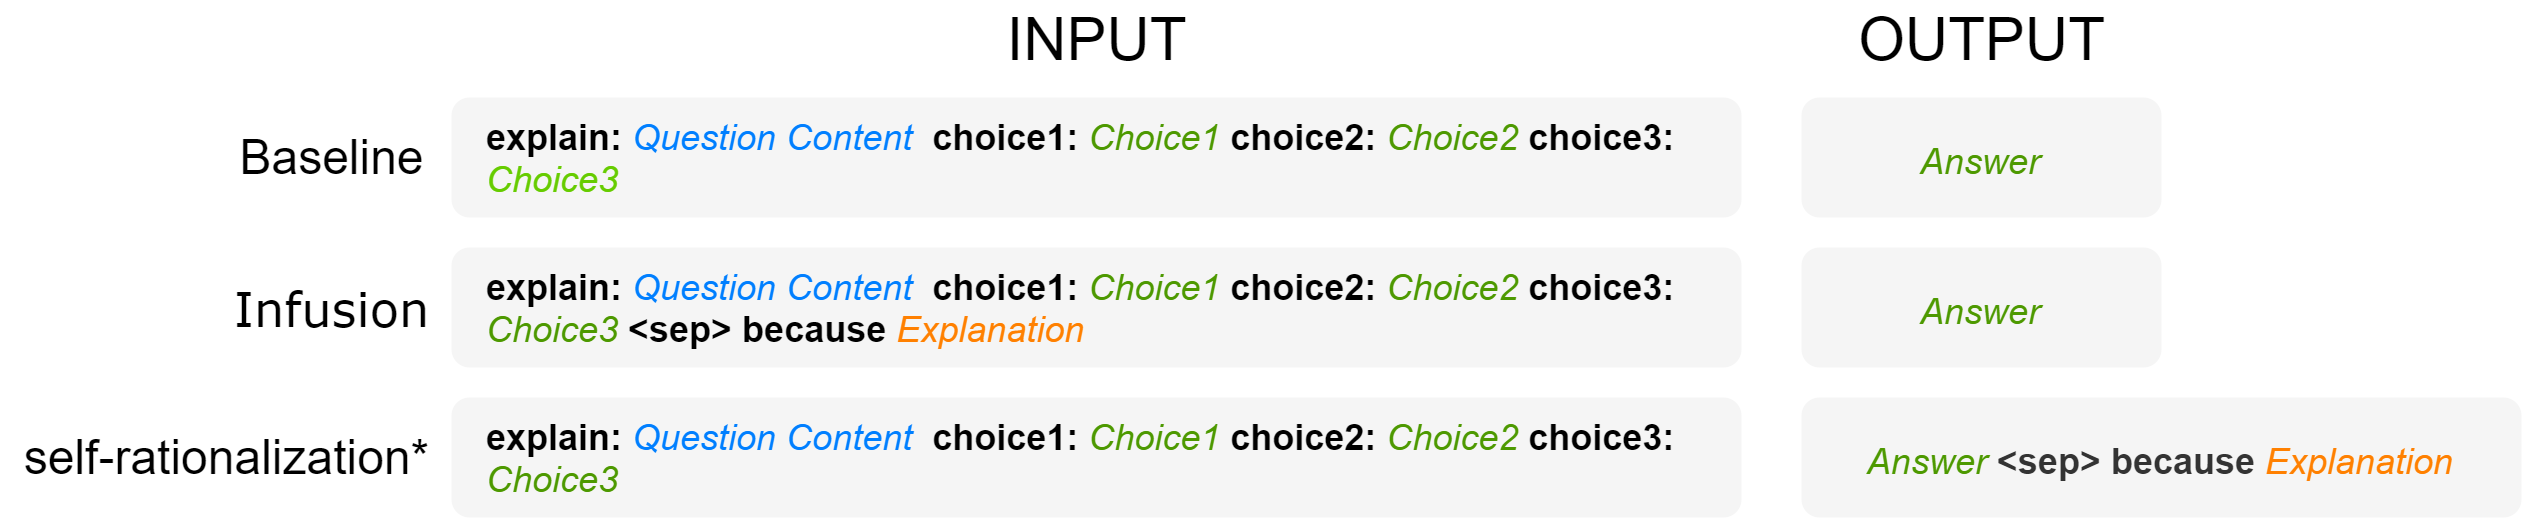
As described in Section 2.3, recent works have been exploring various circumstances that human-annotated explanations could help in different aspects. We hypothesize that leveraging explanations as additional input with the original task input allows models to use explanations for better prediction, while the self-rationalization Marasović et al. (2021) setting, which generate explanations along with labels, complicates the prediction task for the models and may lead to a performance decrease. In addition, the generated explanations from self-rationalization systems are not explicitly being used for label prediction. To justify our hypothesis, we conduct a preliminary experiment on CoS-E v1.0 and ECQA datasets.
We fine-tune three T5-base models on each dataset with three different settings: Baseline , Infusion , and explanations as additional output (Self-Rationalization hereinafter). For each model, we maintain the same setting during fine-tuning and inference. For example, the model fine-tuned with Infusion will also take data under Infusion during inference. We leverage the unified structure for Baseline and Infusion shown in Figure 1 and make minor adjustments for the self-rationalization setting accordingly (shown in Appendix A).
The experiment results are shown in Table 2. We notice that the self-rationalization setting performs worse than the Baseline , which is aligned with our assumption. On the other hand, the Infusion setting surprisingly achieves significant improvement on CoS-E, which was considered ‘noisy’ by previous works, demonstrating that the CoS-E explanations are indeed helpful toward models. The Infusion setting also approaches nearly complete correctness on the ECQA dataset.
4.2 Explanations as Partial Input During Fine-Tuning
To examine the utility of explanations to the models during fine-tuning, we perform an in-depth experiment with the Baseline and Infusion setting while varying the amounts of training data used for fine-tuning. First, we randomly select nine sub-datasets with amounts of data ranging from 10% to 90% of the training data in each dataset used in the first preliminary experiment. Then, for each sub-dataset, we fine-tune three models with different random seeds for sampling and fine-tuning, then acquire the averaged prediction performance. As a result, for each CoS-E v1.0 and ECQA dataset, we get 60 models fine-tuned with varying amounts of data for both the Baseline and Infusion setting, including the models fine-tuned on full training data, then perform prediction with the Baseline and Infusion settings. We maintain the same hyper-parameters across the models fine-tuned for this experiment and report them in Appendix B.1.
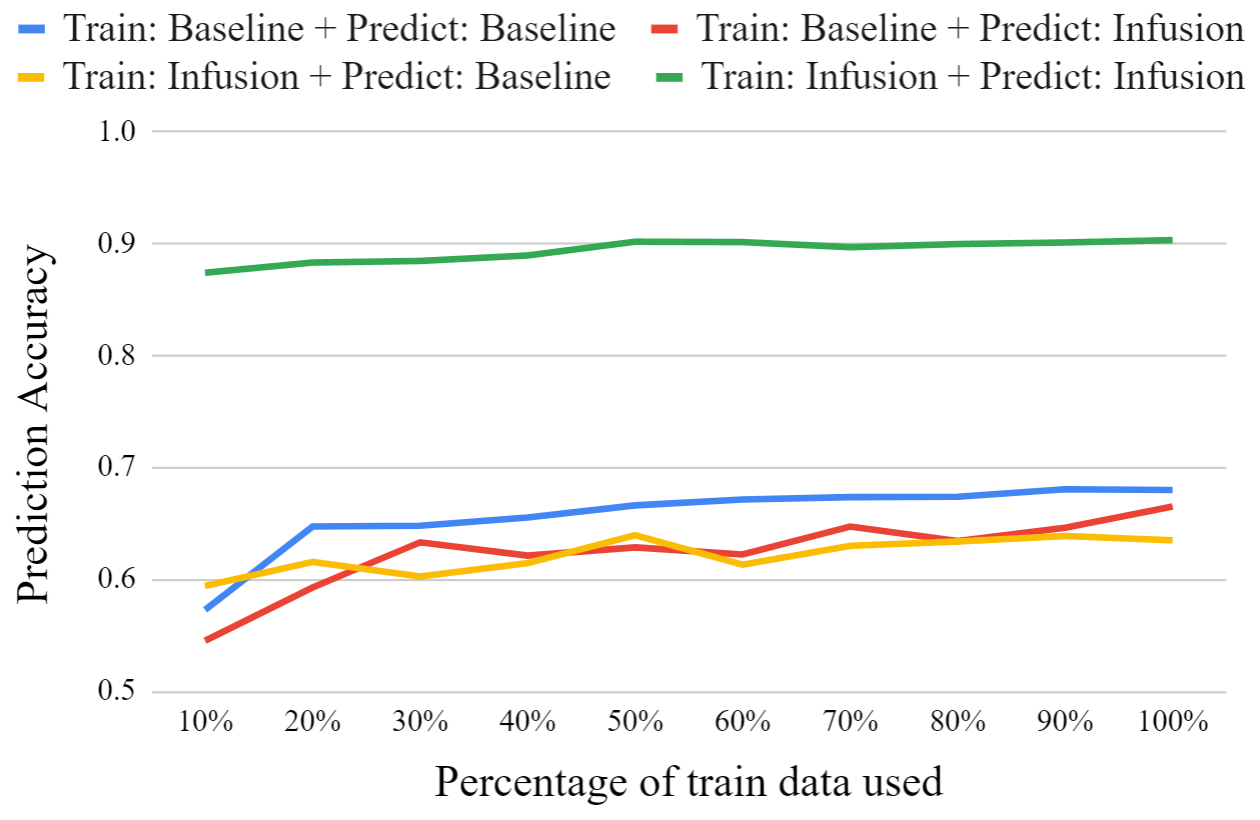
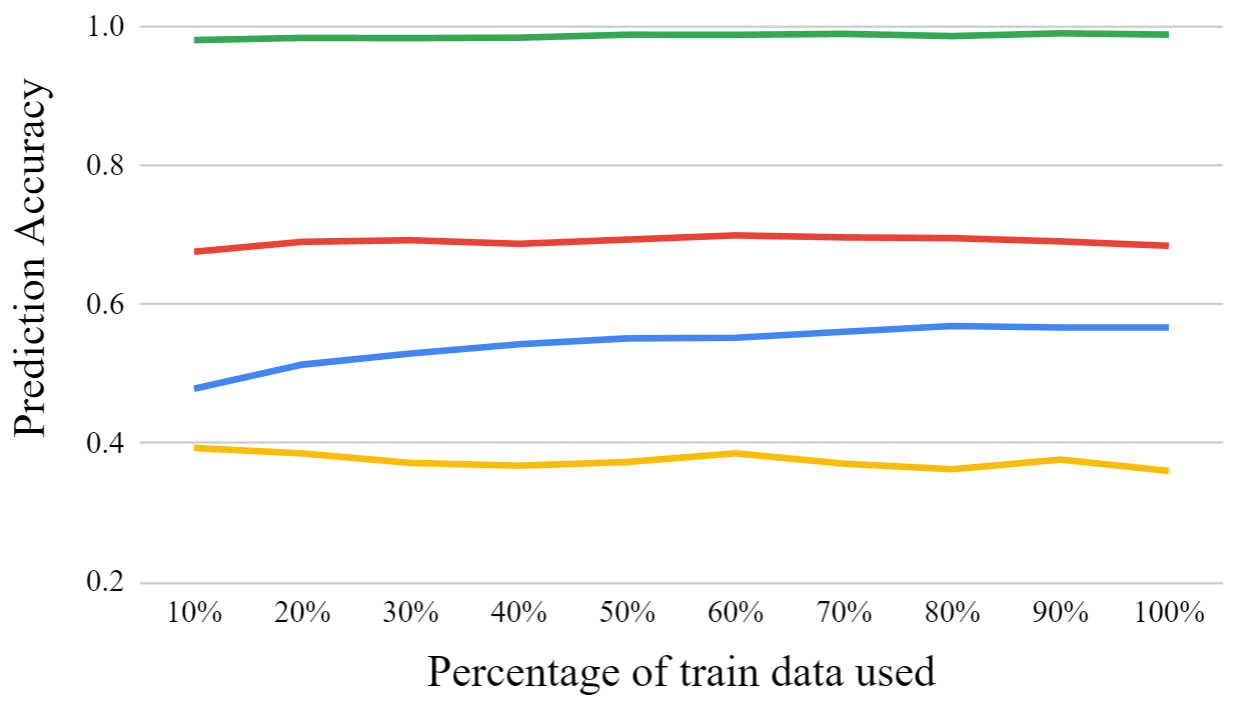
The two diagrams in Figure 2 show the experiment results on two datasets (detailed results in Table 4 in the appendix). Different colors denote different fine-tuning and inference settings. We conclude with a few interesting observations:
1. By looking at yellow (model fine-tuned with Infusion and predict with Baseline ) and green (model fine-tuned and predict with Infusion ) line, we notice adding more training data during fine-tuning does not significantly improve model performance, suggesting that the fine-tuning process is not teaching the model with new knowledge that is
conveyed in the explanations.
2. By comparing yellow and blue (model fine-tuned and predict with Baseline ) line in each diagram, we notice the models fine-tuned with Infusion perform worse than baseline models without explanations during inference, demonstrating that fine-tuning with Infusion teaches the models to rely on the explanations to predict.
3. By comparing red (model fine-tuned with Baseline and predict with Infusion ) and blue line in each diagram, we observe the baseline models for CoS-E perform worse while predicting with explanations. In contrast, the baseline models for ECQA consistently exceed baseline performance significantly, which demonstrates that the helpfulness of explanations on baseline models in CoS-E is much worse than the ones in ECQA, which is aligned with some previous works.
4. By comparing green and blue lines in both diagrams, we notice that explanations in CoS-E can contribute to substantial improvement during inference on models fine-tuned with Infusion setting. This observation shows that explanations in CoS-E are able to provide helpfulness to models during fine-tuning, even though they were considered ‘noisy’ by humans in previous works.
5. By comparing red and green lines in both diagrams, we can observe that in order to take full advantage of explanations, it is beneficial to fine-tune a model even with a small amount of data that incorporates the explanations. Such fine-tuning can lead to a substantial improvement.
This experiment shows that explanations provide different degrees of utility during fine-tuning and inference. Thus, we should consider both situations while evaluating the helpfulness of explanations.
5 Our Metric and Evaluation
5.1 Our Treu Metric
Based on our observations from the preliminary experiments, we propose a novel evaluation metric that extends the Simulatability score. Figure 3 shows the formula of our Treu metric: it evaluates the helpfulness of explanations with the sum of two parts: at fine-tuning, where two models are fine-tuned with Baseline and Infusion settings correspondingly, we calculate the prediction accuracy difference using the same data format that was used during fine-tuning for each model; and at inference, we fine-tune only one model with Baseline setting and calculate the prediction accuracy difference between Infusion and Baseline settings.
The second part of our metric is indeed the Simulatability metric. We observe that fine-tuning a model with data that incorporates explanations can provide substantial benefits. However, the Simulatability score fails to account for this component and only considers the model performance improvement that uses explanations at inference without fine-tuning first. For the models fine-tuned with Baseline setting, we believe pre-trained SOTA large-scale models have the ability to understand the additional content at the input to a certain extent. The addition of explanations at input during inference will show whether it can provide helpfulness to a baseline model without additional supervision, while the models fine-tuned with Infusion setting will rely more on the explanation part of the input for inference.
A positive score demonstrates that the explanations can provide overall helpfulness for better prediction, while a negative score does not necessarily mean the explanations are not helpful. Instead, a negative score indicates that the explanations lead to the model’s performance drop in at least one part of the evaluation. Researchers can further analyze the intermediate score for each part. As a result, the score ranges theoretically from -2 to 2.
| T5-base | Simulatability Score | Treu Score | |||
| ECQA | 0.174 | 0.591 | |||
| CoS-E v1.11 | 0.002 | 0.197 | |||
| CoS-E v1.0 | -0.05 | 0.133 | |||
| e-SNLI | -0.231 | -0.157 | |||
| ComVE | -0.353 | -0.284 |
| BART-base | Simulatability Score | Treu Score | |||
| ECQA | 0.428 | 0.438 | 0.010 | 0.901 | 0.483 |
| CoS-E v1.11 | 0.443 | 0.449 | 0.006 | 0.700 | 0.263 |
| CoS-E v1.0 | 0.512 | 0.486 | -0.026 | 0.790 | 0.252 |
| e-SNLI | 0.888 | 0.658 | -0.23 | 0.978 | -0.14 |
| ComVE | 0.812 | 0.596 | -0.216 | 0.864 | -0.164 |
5.2 Evaluation
We evaluate human-annotated natural language explanations across five popular datasets using our Treu metric and the Simulatability score. To justify that our metric is less biased by different model architectures and to examine the influence of models fine-tuned with different settings towards the prediction performance, we perform experiments on both T5 and BART models. The proposed unified data format is applied to the experiments for our metric and the Simulatability score to make it a more robust baseline.
We maintain the same fine-tuning hyper-parameters for all the experiments (details in Appendix B.2). The only exception is for the e-SNLI dataset, which has about 10x the size (549,367 data instances) of training data compared to the other datasets. Therefore, we only fine-tune models on the e-SNLI dataset with two epochs. Furthermore, we leverage the special token ‘<s>’ for BART that was already used during the pre-training process instead of using and adding the special token ‘<sep>’ to BART tokenizer during fine-tuning. We present the evaluation results in Table 3.
5.3 Findings
Our results justify the intuition that human-annotated explanations can still provide benefits toward model prediction, even if they were evaluated as low-quality by humans in prior literature.
By first comparing the models’ prediction results over two architectures, the result shows all models fine-tuned on T5-base outperform those fine-tuned on BART-base with the same setting, mainly with a significant margin.
Despite apparent performance differences between model architectures, by looking at the orderings of datasets in both tables, which are based on our Treu score, We can easily observe that Treu score provides the same ranking result for the quality of explanations in 5 datasets over two model architectures. Our Treu score (Table 3) ranks the explanation quality of the five datasets in the following order regardless of model architectures:
| ECQA > CoS-E v1.11 > CoS-E v1.0 > e-SNLI > ComVE |
According to the Treu score, explanations in ECQA have the best quality among the five datasets. Especially, explanations in ECQA are much better than the ones in both CoS-E datasets, which is consistent with previous works’ consensus. It is worth noticing that both CoS-E datasets achieve positive Treu scores, though significantly lower than the ones for ECQA, demonstrating that explanations in CoS-E datasets still have positive overall helpfulness for models’ prediction performance even though they are considered ‘low quality and noisy’ from human experiments (Sun et al., 2022).
Our Treu score can rank explanation quality consistently across all five datasets on two models while the Simulatability falls short.
On the other hand, the Simulatability score cannot provide a consistent ranking of explanation quality on the two models. Instead, the Simulatability score provides two distinct rankings:
| T5-base: | |||
| CoS-E v1.0 > e-SNLI > ComVE | |||
| BART-base: | |||
| CoS-E v1.0 > ComVE> e-SNLI |
From Table 3, the Simulatability score ranks e-SNLI and ComVE reversely on BART compared with T5 models, indicating Simulatability score could be more affected by different model architectures even with the unified data structure.
One advantage of using our Treu score to evaluate the quality of explanations is that we can analyze the score by class or intermediate results from fine-tuning or inference. For instance, we observe that the Treu scores for e-SNLI with T5 and BART models are both negative, indicating that the helpfulness of explanations in e-SNLI could be limited. However, by looking into the intermediate results, though the baseline models perform significantly worse while predicting with Infusion than with Baseline setting, the models that are fine-tuned with Infusion still outperform the baseline models while predicting with Infusion , justifying the explanations indeed provide improvements under this setting. When we further decompose the Treu score of e-SNLI by category, we acquire 0.13/-0.483/0.094 on T5-base and 0.015/-0.227/-0.271 on BART-base corresponds to entailment/neutral/contradiction.
We speculate that the helpfulness of human-annotated explanations to models highly depends on the task (e.g., the ‘contradiction’ label categories) and the explanation format (e.g., counter-factorial styles).
We notice that the models fine-tuned on T5 and BART have more than a 40% prediction accuracy drop on data with ‘neutral’ labels when they are fine-tuned with Baseline and predicted with Infusion . In addition, we observe that the fine-tuned BART models have about a 40% prediction accuracy drop on data with ground-truth ‘contradiction’ labels. We suspect human annotators behave differently while providing explanations for different categories in e-SNLI. For instance, humans tend to provide counter-factorial explanations or use negation connotations to explain why two sentences are ‘neutral’ or ‘contradiction’ categories. Some representative examples for each class are provided in Appendix 5. Such behavior’s tendency to use negation connotations in explanations for specific categories may increase the difficulty for the models to interpret the information and lead to false predictions eventually.
From Table 3, ComVE ranks worst among the five datasets in both tables, indicating the explanations in ComVE are the least helpful for the models to either fine-tune or predict with. Since the ComVE task asks models to predict which sentence is more likely against commonsense, the question itself implies a negation connotation. Likewise, many ComVE explanations contain negation, such as the one in Figure 1. The concept of negation has always been a complex concept for machines. Although both T5 and BART models fine-tuned with the Baseline setting can perform relatively well on ComVE, the addition of explanations that largely contain negation during inference is likely to create more difficulties for the models to understand and eventually lead to false prediction.
Our hypothesis on counter-examples or negation annotations in human-annotated explanations can find support from many recent works.
A recent analysis (Joshi et al., 2022) claimed that negation connotations have high necessity but low sufficiency to describe the relation between features and labels. In addition, counterfactually-augmented data may prevent models from learning unperturbed robust features and exacerbate spurious correlations (Joshi and He, 2021). Therefore, we suggest human annotators avoid using counter-examples while providing explanations. Instead, using precise words to describe the degree of relations between concepts will be preferable and provide better helpfulness to models.
Nevertheless, these models can correctly understand explanations for all categories after being fine-tuned with the Infusion setting. Worth pointing out that ECQA explanations are summarized from positive and negative properties for each candidate choice which also contains negation words. However, those negation words mostly appear in negative properties for wrong choices. As a result, we notice the pre-trained baseline models can leverage ECQA explanations with Infusion during the predicting process and achieve performance improvement. Since we are the first to discover such a class-level drop on e-SNLI by using Treu score, we only propose our hypothetical assumption and leave a definitive study for future work.
6 Conclusion
In this paper, we objectively evaluate human-annotated natural language explanations from the perspective of measuring their helpfulness towards models’ prediction. We conduct two preliminary experiments and based on the findings from the preliminary study, we define an evaluation metric that considers the explanations’ helpfulness at both fine-tuning and inference stages; We also propose a unified prompt-based data format that minimizes the influence of task differences by mapping various tasks into a unified multiple-choice generation task. Our experiment with human-annotated explanations in five popular large-scale datasets over two sequence-to-sequence model architectures demonstrates that our metric can consistently reflect the relative ranking of explanation qualities among five datasets while the Simulatability score falls short. Our work lays a stepstone towards a high-quality human-AI collaboration future for data annotation job Wang et al. (2019a), and we recommend researchers perform similar quality checks while collecting human-annotated explanations in the future.
7 Limitations
In this paper, we evaluate the quality of human-annotated natural language explanations towards the models’ prediction performance on multiple datasets. Although it is a natural step that our evaluation metric could be generalized to evaluate the helpfulness of model-generated explanations, we would like to caution that: our metric and evaluation experiment requires the models to generate explanations for the train split data, then use the data with generated explanations to fine-tune the second model with the Infusion setting, which may not be suitable for those systems that are trained on train split data. In addition, we acknowledge that the human-annotated explanations are very expensive to collect, thus, a better mechanism (e.g., Active-Learning approaches Yao et al. (2023)) is needed to improve human annotators’ performance.
8 Ethics Statement
We do not see potential ethical concerns or misuse of the proposed evaluation method. One potential risk, though minimal, could be the misinterpretation of the findings of this paper. We would like to caution readers that a higher score of our metric may not necessarily reflect a higher quality perceived by humans, as the evaluation metric only measures the explanation’s benefit from the modeling perspective, and it is only one of the many possible ways of automatically evaluating the quality of natural language explanations.
Acknowledgements
This work was supported by the Rensselaer-IBM AI Research Collaboration (http://airc.rpi.edu), part of the IBM AI Horizons Network (http://ibm.biz/AIHorizons).
References
- Aggarwal et al. (2021) Shourya Aggarwal, Divyanshu Mandowara, Vishwajeet Agrawal, Dinesh Khandelwal, Parag Singla, and Dinesh Garg. 2021. Explanations for commonsenseqa: New dataset and models. In Workshop on Commonsense Reasoning and Knowledge Bases.
- Bowman et al. (2015) Samuel R Bowman, Gabor Angeli, Christopher Potts, and Christopher D Manning. 2015. A large annotated corpus for learning natural language inference. arXiv preprint arXiv:1508.05326.
- Brahman et al. (2021) Faeze Brahman, Vered Shwartz, Rachel Rudinger, and Yejin Choi. 2021. Learning to rationalize for nonmonotonic reasoning with distant supervision. In Proceedings of the AAAI Conference on Artificial Intelligence, volume 35, pages 12592–12601.
- Camburu et al. (2018) Oana-Maria Camburu, Tim Rocktäschel, Thomas Lukasiewicz, and Phil Blunsom. 2018. e-snli: Natural language inference with natural language explanations. Advances in Neural Information Processing Systems, 31.
- Carton et al. (2020) Samuel Carton, Anirudh Rathore, and Chenhao Tan. 2020. Evaluating and characterizing human rationales. In Proceedings of the 2020 Conference on Empirical Methods in Natural Language Processing (EMNLP), pages 9294–9307, Online. Association for Computational Linguistics.
- Chan et al. (2022a) Aaron Chan, Shaoliang Nie, Liang Tan, Xiaochang Peng, Hamed Firooz, Maziar Sanjabi, and Xiang Ren. 2022a. Frame: Evaluating simulatability metrics for free-text rationales. arXiv preprint arXiv:2207.00779.
- Chan et al. (2022b) Aaron Chan, Maziar Sanjabi, Lambert Mathias, Liang Tan, Shaoliang Nie, Xiaochang Peng, Xiang Ren, and Hamed Firooz. 2022b. Unirex: A unified learning framework for language model rationale extraction. In International Conference on Machine Learning, pages 2867–2889. PMLR.
- Chandrasekaran et al. (2018) Arjun Chandrasekaran, Viraj Prabhu, Deshraj Yadav, Prithvijit Chattopadhyay, and Devi Parikh. 2018. Do explanations make vqa models more predictable to a human? arXiv preprint arXiv:1810.12366.
- Chen et al. (2022) Howard Chen, Jacqueline He, Karthik Narasimhan, and Danqi Chen. 2022. Can rationalization improve robustness? arXiv preprint arXiv:2204.11790.
- Chen et al. (2021) Quan Ze Chen, Daniel S Weld, and Amy X Zhang. 2021. Goldilocks: Consistent crowdsourced scalar annotations with relative uncertainty. Proceedings of the ACM on Human-Computer Interaction, 5(CSCW2):1–25.
- Dalvi et al. (2022) Bhavana Dalvi, Oyvind Tafjord, and Peter Clark. 2022. Towards teachable reasoning systems. arXiv preprint arXiv:2204.13074.
- Devlin et al. (2019) Jacob Devlin, Ming-Wei Chang, Kenton Lee, and Kristina Toutanova. 2019. BERT: Pre-training of deep bidirectional transformers for language understanding. In Proceedings of the 2019 Conference of the North American Chapter of the Association for Computational Linguistics: Human Language Technologies, Volume 1 (Long and Short Papers), pages 4171–4186, Minneapolis, Minnesota. Association for Computational Linguistics.
- DeYoung et al. (2020) Jay DeYoung, Sarthak Jain, Nazneen Fatema Rajani, Eric Lehman, Caiming Xiong, Richard Socher, and Byron C. Wallace. 2020. ERASER: A benchmark to evaluate rationalized NLP models. In Proceedings of the 58th Annual Meeting of the Association for Computational Linguistics, pages 4443–4458, Online. Association for Computational Linguistics.
- Doshi-Velez and Kim (2017) Finale Doshi-Velez and Been Kim. 2017. Towards a rigorous science of interpretable machine learning. arXiv preprint arXiv:1702.08608.
- Duan et al. (2017) Nan Duan, Duyu Tang, Peng Chen, and Ming Zhou. 2017. Question generation for question answering. In Proceedings of the 2017 conference on empirical methods in natural language processing, pages 866–874.
- Gebreegziabher et al. (2023) Simret Araya Gebreegziabher, Zheng Zhang, Xiaohang Tang, Yihao Meng, Elena L Glassman, and Toby Jia-Jun Li. 2023. Patat: Human-ai collaborative qualitative coding with explainable interactive rule synthesis. In Proceedings of the 2023 CHI Conference on Human Factors in Computing Systems, pages 1–19.
- Hase and Bansal (2021) Peter Hase and Mohit Bansal. 2021. When can models learn from explanations? a formal framework for understanding the roles of explanation data. arXiv preprint arXiv:2102.02201.
- Hase et al. (2020) Peter Hase, Shiyue Zhang, Harry Xie, and Mohit Bansal. 2020. Leakage-adjusted simulatability: Can models generate non-trivial explanations of their behavior in natural language? arXiv preprint arXiv:2010.04119.
- Joshi and He (2021) Nitish Joshi and He He. 2021. An investigation of the (in) effectiveness of counterfactually augmented data. arXiv preprint arXiv:2107.00753.
- Joshi et al. (2022) Nitish Joshi, Xiang Pan, and Hengxing He. 2022. Are all spurious features in natural language alike? an analysis through a causal lens. ArXiv, abs/2210.14011.
- Kočiskỳ et al. (2018) Tomáš Kočiskỳ, Jonathan Schwarz, Phil Blunsom, Chris Dyer, Karl Moritz Hermann, Gábor Melis, and Edward Grefenstette. 2018. The narrativeqa reading comprehension challenge. Transactions of the Association for Computational Linguistics, 6:317–328.
- Kumar and Talukdar (2020) Sawan Kumar and Partha Talukdar. 2020. NILE : Natural language inference with faithful natural language explanations. In Proceedings of the 58th Annual Meeting of the Association for Computational Linguistics, pages 8730–8742, Online. Association for Computational Linguistics.
- Lee et al. (2022) Mina Lee, Megha Srivastava, Amelia Hardy, John Thickstun, Esin Durmus, Ashwin Paranjape, Ines Gerard-Ursin, Xiang Lisa Li, Faisal Ladhak, Frieda Rong, et al. 2022. Evaluating human-language model interaction. arXiv preprint arXiv:2212.09746.
- Lewis et al. (2019) Mike Lewis, Yinhan Liu, Naman Goyal, Marjan Ghazvininejad, Abdelrahman Mohamed, Omer Levy, Ves Stoyanov, and Luke Zettlemoyer. 2019. Bart: Denoising sequence-to-sequence pre-training for natural language generation, translation, and comprehension. arXiv preprint arXiv:1910.13461.
- Lin (2004) Chin-Yew Lin. 2004. Rouge: A package for automatic evaluation of summaries. In Text summarization branches out, pages 74–81.
- Liu et al. (2021) Jiacheng Liu, Alisa Liu, Ximing Lu, Sean Welleck, Peter West, Ronan Le Bras, Yejin Choi, and Hannaneh Hajishirzi. 2021. Generated knowledge prompting for commonsense reasoning. arXiv preprint arXiv:2110.08387.
- Marasović et al. (2021) Ana Marasović, Iz Beltagy, Doug Downey, and Matthew E Peters. 2021. Few-shot self-rationalization with natural language prompts. arXiv preprint arXiv:2111.08284.
- Mou et al. (2021) Xiangyang Mou, Chenghao Yang, Mo Yu, Bingsheng Yao, Xiaoxiao Guo, Saloni Potdar, and Hui Su. 2021. Narrative question answering with cutting-edge open-domain QA techniques: A comprehensive study. Transactions of the Association for Computational Linguistics, 9:1032–1046.
- Mou et al. (2020) Xiangyang Mou, Mo Yu, Bingsheng Yao, Chenghao Yang, Xiaoxiao Guo, Saloni Potdar, and Hui Su. 2020. Frustratingly hard evidence retrieval for QA over books. In Proceedings of the First Joint Workshop on Narrative Understanding, Storylines, and Events, pages 108–113, Online. Association for Computational Linguistics.
- Muller et al. (2021) Michael Muller, Christine T Wolf, Josh Andres, Michael Desmond, Narendra Nath Joshi, Zahra Ashktorab, Aabhas Sharma, Kristina Brimijoin, Qian Pan, Evelyn Duesterwald, et al. 2021. Designing ground truth and the social life of labels. In Proceedings of the 2021 CHI conference on human factors in computing systems, pages 1–16.
- Narang et al. (2020) Sharan Narang, Colin Raffel, Katherine Lee, Adam Roberts, Noah Fiedel, and Karishma Malkan. 2020. Wt5?! training text-to-text models to explain their predictions. arXiv preprint arXiv:2004.14546.
- Papineni et al. (2002) Kishore Papineni, Salim Roukos, Todd Ward, and Wei-Jing Zhu. 2002. Bleu: a method for automatic evaluation of machine translation. In Proceedings of the 40th annual meeting of the Association for Computational Linguistics, pages 311–318.
- Paranjape et al. (2021) Bhargavi Paranjape, Julian Michael, Marjan Ghazvininejad, Luke Zettlemoyer, and Hannaneh Hajishirzi. 2021. Prompting contrastive explanations for commonsense reasoning tasks. arXiv preprint arXiv:2106.06823.
- Poursabzi-Sangdeh et al. (2021) Forough Poursabzi-Sangdeh, Daniel G Goldstein, Jake M Hofman, Jennifer Wortman Wortman Vaughan, and Hanna Wallach. 2021. Manipulating and measuring model interpretability. In Proceedings of the 2021 CHI conference on human factors in computing systems, pages 1–52.
- Qin et al. (2023) Chengwei Qin, Aston Zhang, Zhuosheng Zhang, Jiaao Chen, Michihiro Yasunaga, and Diyi Yang. 2023. Is chatgpt a general-purpose natural language processing task solver? arXiv preprint arXiv:2302.06476.
- Raffel et al. (2020) Colin Raffel, Noam Shazeer, Adam Roberts, Katherine Lee, Sharan Narang, Michael Matena, Yanqi Zhou, Wei Li, Peter J Liu, et al. 2020. Exploring the limits of transfer learning with a unified text-to-text transformer. J. Mach. Learn. Res., 21(140):1–67.
- Rajagopal et al. (2021) Dheeraj Rajagopal, Vidhisha Balachandran, Eduard Hovy, and Yulia Tsvetkov. 2021. Selfexplain: A self-explaining architecture for neural text classifiers. arXiv preprint arXiv:2103.12279.
- Rajani et al. (2019) Nazneen Fatema Rajani, Bryan McCann, Caiming Xiong, and Richard Socher. 2019. Explain yourself! leveraging language models for commonsense reasoning. arXiv preprint arXiv:1906.02361.
- Rajpurkar et al. (2016) Pranav Rajpurkar, Jian Zhang, Konstantin Lopyrev, and Percy Liang. 2016. Squad: 100,000+ questions for machine comprehension of text. arXiv preprint arXiv:1606.05250.
- Rudinger et al. (2020) Rachel Rudinger, Vered Shwartz, Jena D Hwang, Chandra Bhagavatula, Maxwell Forbes, Ronan Le Bras, Noah A Smith, and Yejin Choi. 2020. Thinking like a skeptic: Defeasible inference in natural language. In Findings of the Association for Computational Linguistics: EMNLP 2020, pages 4661–4675.
- Sap et al. (2019) Maarten Sap, Saadia Gabriel, Lianhui Qin, Dan Jurafsky, Noah A Smith, and Yejin Choi. 2019. Social bias frames: Reasoning about social and power implications of language. arXiv preprint arXiv:1911.03891.
- Sun et al. (2022) Jiao Sun, Swabha Swayamdipta, Jonathan May, and Xuezhe Ma. 2022. Investigating the benefits of free-form rationales. arXiv preprint arXiv:2206.11083.
- Talmor et al. (2018) Alon Talmor, Jonathan Herzig, Nicholas Lourie, and Jonathan Berant. 2018. Commonsenseqa: A question answering challenge targeting commonsense knowledge. arXiv preprint arXiv:1811.00937.
- Wang et al. (2018) Alex Wang, Amanpreet Singh, Julian Michael, Felix Hill, Omer Levy, and Samuel R Bowman. 2018. Glue: A multi-task benchmark and analysis platform for natural language understanding. arXiv preprint arXiv:1804.07461.
- Wang et al. (2020) Cunxiang Wang, Shuailong Liang, Yili Jin, Yilong Wang, Xiaodan Zhu, and Yue Zhang. 2020. Semeval-2020 task 4: Commonsense validation and explanation. arXiv preprint arXiv:2007.00236.
- Wang et al. (2019a) Dakuo Wang, Justin D Weisz, Michael Muller, Parikshit Ram, Werner Geyer, Casey Dugan, Yla Tausczik, Horst Samulowitz, and Alexander Gray. 2019a. Human-ai collaboration in data science: Exploring data scientists’ perceptions of automated ai. Proceedings of the ACM on human-computer interaction, 3(CSCW):1–24.
- Wang et al. (2019b) Danding Wang, Qian Yang, Ashraf Abdul, and Brian Y Lim. 2019b. Designing theory-driven user-centric explainable ai. In Proceedings of the 2019 CHI conference on human factors in computing systems, pages 1–15.
- Wiegreffe and Marasovic (2021) Sarah Wiegreffe and Ana Marasovic. 2021. Teach me to explain: A review of datasets for explainable natural language processing. In Thirty-fifth Conference on Neural Information Processing Systems Datasets and Benchmarks Track (Round 1).
- Wiegreffe et al. (2020) Sarah Wiegreffe, Ana Marasović, and Noah A Smith. 2020. Measuring association between labels and free-text rationales. arXiv preprint arXiv:2010.12762.
- Williams et al. (2017) Adina Williams, Nikita Nangia, and Samuel R Bowman. 2017. A broad-coverage challenge corpus for sentence understanding through inference. arXiv preprint arXiv:1704.05426.
- Xu et al. (2022) Ying Xu, Dakuo Wang, Mo Yu, Daniel Ritchie, Bingsheng Yao, Tongshuang Wu, Zheng Zhang, Toby Li, Nora Bradford, Branda Sun, Tran Hoang, Yisi Sang, Yufang Hou, Xiaojuan Ma, Diyi Yang, Nanyun Peng, Zhou Yu, and Mark Warschauer. 2022. Fantastic questions and where to find them: FairytaleQA – an authentic dataset for narrative comprehension. In Proceedings of the 60th Annual Meeting of the Association for Computational Linguistics (Volume 1: Long Papers), pages 447–460, Dublin, Ireland. Association for Computational Linguistics.
- Yao et al. (2023) Bingsheng Yao, Ishan Jindal, Lucian Popa, Yannis Katsis, Sayan Ghosh, Lihong He, Yuxuan Lu, Shashank Srivastava, James Hendler, and Dakuo Wang. 2023. Beyond labels: Empowering human with natural language explanations through a novel active-learning architecture. arXiv preprint.
- Yao et al. (2022) Bingsheng Yao, Dakuo Wang, Tongshuang Wu, Zheng Zhang, Toby Li, Mo Yu, and Ying Xu. 2022. It is AI’s turn to ask humans a question: Question-answer pair generation for children’s story books. In Proceedings of the 60th Annual Meeting of the Association for Computational Linguistics (Volume 1: Long Papers), pages 731–744, Dublin, Ireland. Association for Computational Linguistics.
- Ye and Durrett (2022) Xi Ye and Greg Durrett. 2022. The unreliability of explanations in few-shot prompting for textual reasoning. Advances in neural information processing systems.
- Yeung et al. (2020) Arnold Yeung, Shalmali Joshi, Joseph Jay Williams, and Frank Rudzicz. 2020. Sequential explanations with mental model-based policies. arXiv preprint arXiv:2007.09028.
- Zhao et al. (2022) Zhenjie Zhao, Yufang Hou, Dakuo Wang, Mo Yu, Chengzhong Liu, and Xiaojuan Ma. 2022. Educational question generation of children storybooks via question type distribution learning and event-centric summarization. arXiv preprint arXiv:2203.14187.
Appendix
Appendix A Implementation of self-rationalization format
Appendix B Experiment Hyper-Parameters
We perform all the computational experiments on a Google Colab instance with a single Nvidia V100 GPU and 50 Gigabytes of RAM.
B.1 Hyper-parameter for Preliminary Experiment
For the preliminary experiment of utilizing explanations as part of input V.S. part of the output, we leverage the following hyper-parameters for all models with different data structures: , , , , .
For the preliminary experiment of explanations as partial input during fine-tuning, we maintain the following hyper-parameters for all models fine-tuned with partial/full train data of CoS-E and ECQA datasets: , , , , .
B.2 Hyper-parameter for Explanation Evaluation with five Datasets
For the evaluation of human-annotated explanations on 5 different datasets, we maintain the following hyper-parameters for all the models: , , , , . The only exception is the e-SNLI dataset, which has about 10x the size (549,367 data instances) of training data compared to the other datasets. Therefore, we only fine-tune models on the e-SNLI dataset with two epochs.
Appendix C Results for Preliminary Experiment - Explanations as Partial Input During Fine-tuning
We randomly shuffle three seeds to select the subset of data and fine-tune the model for the preliminary experiment of explanations as partial input during fine-tuning. The detailed results of each experiment and average accuracy are reported in Table 4.
| Fine-tune with Baseline on CoS-E v1.0 | ||||||||||
| 10% | 20% | 30% | 40% | 50% | 60% | 70% | 80% | 90% | 1 | |
| Predict Baseline | 0.583 | 0.656 | 0.638 | 0.658 | 0.661 | 0.670 | 0.674 | 0.678 | 0.697 | 0.676 |
| 0.550 | 0.644 | 0.664 | 0.650 | 0.666 | 0.667 | 0.667 | 0.682 | 0.668 | 0.682 | |
| 0.584 | 0.64 | 0.64 | 0.655 | 0.670 | 0.675 | 0.677 | 0.66 | 0.674 | 0.68 | |
| Average | 0.572 | 0.647 | 0.647 | 0.655 | 0.665 | 0.671 | 0.673 | 0.673 | 0.680 | 0.679 |
| Predict Infusion | 0.586 | 0.586 | 0.625 | 0.633 | 0.596 | 0.621 | 0.663 | 0.655 | 0.649 | 0.676 |
| 0.561 | 0.591 | 0.642 | 0.609 | 0.656 | 0.630 | 0.618 | 0.650 | 0.641 | 0.652 | |
| 0.525 | 0.6 | 0.631 | 0.62 | 0.631 | 0.614 | 0.658 | 0.595 | 0.647 | 0.665 | |
| Average | 0.545 | 0.592 | 0.632 | 0.621 | 0.628 | 0.622 | 0.647 | 0.634 | 0.645 | 0.664 |
| Fine-tune with Infusion on CoS-E v1.0 | ||||||||||
| 10% | 20% | 30% | 40% | 50% | 60% | 70% | 80% | 90% | 1 | |
| Predict Baseline | 0.588 | 0.622 | 0.617 | 0.613 | 0.635 | 0.616 | 0.615 | 0.625 | 0.652 | 0.629 |
| 0.592 | 0.614 | 0.573 | 0.610 | 0.650 | 0.592 | 0.632 | 0.64 | 0.610 | 0.64 | |
| 0.601 | 0.609 | 0.615 | 0.618 | 0.631 | 0.629 | 0.641 | 0.635 | 0.652 | 0.634 | |
| Average | 0.594 | 0.615 | 0.602 | 0.614 | 0.639 | 0.612 | 0.629 | 0.633 | 0.638 | 0.634 |
| Predict Infusion | 0.867 | 0.874 | 0.884 | 0.889 | 0.902 | 0.894 | 0.890 | 0.886 | 0.910 | 0.904 |
| 0.875 | 0.888 | 0.881 | 0.890 | 0.898 | 0.901 | 0.9 | 0.901 | 0.896 | 0.895 | |
| 0.877 | 0.885 | 0.887 | 0.887 | 0.903 | 0.907 | 0.898 | 0.910 | 0.894 | 0.908 | |
| Average | 0.873 | 0.882 | 0.884 | 0.889 | 0.901 | 0.901 | 0.896 | 0.899 | 0.900 | 0.902 |
| Fine-tune with Baseline on ECQA | ||||||||||
| 10% | 20% | 30% | 40% | 50% | 60% | 70% | 80% | 90% | 1 | |
| Predict Baseline | 0.495 | 0.522 | 0.528 | 0.553 | 0.550 | 0.550 | 0.554 | 0.569 | 0.561 | 0.562 |
| 0.471 | 0.505 | 0.525 | 0.533 | 0.549 | 0.561 | 0.558 | 0.572 | 0.572 | 0.572 | |
| 0.469 | 0.511 | 0.533 | 0.541 | 0.553 | 0.545 | 0.569 | 0.564 | 0.566 | 0.565 | |
| Average | 0.478 | 0.513 | 0.529 | 0.542 | 0.551 | 0.552 | 0.560 | 0.568 | 0.566 | 0.566 |
| Predict Infusion | 0.664 | 0.672 | 0.710 | 0.716 | 0.692 | 0.702 | 0.708 | 0.722 | 0.684 | 0.701 |
| 0.685 | 0.682 | 0.673 | 0.697 | 0.681 | 0.682 | 0.694 | 0.677 | 0.699 | 0.641 | |
| 0.678 | 0.715 | 0.693 | 0.648 | 0.706 | 0.713 | 0.686 | 0.685 | 0.688 | 0.711 | |
| Average | 0.675 | 0.690 | 0.692 | 0.687 | 0.693 | 0.699 | 0.696 | 0.695 | 0.690 | 0.684 |
| Fine-tune with Infusion on ECQA | ||||||||||
| 10% | 20% | 30% | 40% | 50% | 60% | 70% | 80% | 90% | 1 | |
| Predict Baseline | 0.417 | 0.406 | 0.402 | 0.395 | 0.381 | 0.379 | 0.365 | 0.379 | 0.375 | 0.374 |
| 0.381 | 0.363 | 0.367 | 0.366 | 0.368 | 0.400 | 0.385 | 0.349 | 0.368 | 0.371 | |
| 0.381 | 0.386 | 0.345 | 0.341 | 0.369 | 0.376 | 0.361 | 0.359 | 0.386 | 0.334 | |
| Average | 0.393 | 0.385 | 0.371 | 0.367 | 0.373 | 0.385 | 0.370 | 0.362 | 0.376 | 0.360 |
| Predict Infusion | 0.974 | 0.983 | 0.983 | 0.989 | 0.985 | 0.988 | 0.989 | 0.984 | 0.990 | 0.992 |
| 0.984 | 0.985 | 0.983 | 0.981 | 0.990 | 0.989 | 0.991 | 0.985 | 0.990 | 0.983 | |
| 0.984 | 0.982 | 0.984 | 0.981 | 0.989 | 0.987 | 0.988 | 0.989 | 0.989 | 0.989 | |
| Average | 0.980 | 0.983 | 0.983 | 0.984 | 0.988 | 0.988 | 0.989 | 0.986 | 0.990 | 0.988 |
Appendix D Examples of different explanations for each category in e-SNLI dataset
From our evaluation results, we suspect human annotators behave differently while explaining data with various categories in e-SNLI. For instance, human annotators may explain why two sentences are ‘entailment’ by describing the shared information or similarities conveyed by both sentences, which is easy for models to understand. However, humans tend to provide counter-examples or negations to explain why two sentences are unrelated (neutral) or contradictory rather than explaining their reasoning in a positive way. In Table 5, we show representative examples of data with corresponding explanations for each class.
| Category | Premise | Hypothesis | Explanation | ||||
| entailment |
|
A family is at the beach. | Ocean waves implies the beach. | ||||
|
A man poses in front of an ad. |
|
|||||
|
The man is inside. | In a bar means the man could be inside. | |||||
| neutral |
|
|
Not all advertisements are ad for beer. | ||||
|
The woman is young. |
|
|||||
|
The man is reading the sportspage. |
|
|||||
| contradiction |
|
The woman has been shot. |
|
||||
|
A man playing banjo on the floor. |
|
|||||
|
A couple is sitting on a bench. |
|