SI.pdf
Low-Density Amorphous Ice Contains Crystalline Ice Grains
Abstract
Low-density amorphous ice (LDA) is one of the most common solid materials in the Universe and influences a myriad of cosmological phenomena. In fundamental research, it is the potential key material for understanding the many famous anomalies of liquid water. Despite its significance, the structural nature of LDA remains heavily debated. It is unclear if LDA is a glassy state representing a liquid state or a heavily disordered crystal. Here we show that the experimental structure factor of LDA is best reproduced computationally by small ice grains with amorphous regions at the grain boundaries. Moreover, LDA materials made through different routes crystallise to give ice I with different stacking characteristics. These results suggest LDA is not truly amorphous but instead a partially crystalline material. Going forward, great care is needed in concluding from diffraction data if materials are truly glassy or instead partially crystalline states.
I Introduction
The matrix of life, the universal solvent, a powerful corrosive, and the strangest fluid – these are just some of the names for perhaps the most fascinating and important substance in nature: water. It is the many anomalies of water – over 70 have been compiled LSBUwebsite – that facilitate its multitude of names and moreover shape the face of the Earth. Yet, despite intensive research efforts dating back to antiquity, a complete understanding of water remains a challenge. There are many physical states that water can exist in; for instance, 20 polymorphs of ice have now been created in the laboratory Millot2019 ; SalzIceXIX ; Yamane2021 ; Gasser2021 ; Prakapenka2021 ; Salz2019advances , with many more theoretically predicted ice polymorphs Engel2018 , and under nanoscale confinement water exhibits yet more structures and a different phase diagram Kapil2021mono . Of all water’s forms, the most abundant in the Universe is found in the dense molecular clouds from which stars and planets are born, and as the bulk matter in comets: low-density amorphous ice (LDA) JenniskensBlake1994 ; Burke2010 . LDA is of great scientific interest, in part due to its involvement in many cosmological phenomena (for instance, it is key to promoting the formation of complex molecules in astrochemistry and thus potentially the origin of life Ehrenfreund2000 ), but also due to its potential key role in explaining water’s anomalies. Specifically, whether LDA has a corresponding liquid state is a cornerstone of the heavily debated two-state liquid model, which could account for many of water’s thermodynamic anomalies Poole1992Nature ; mishima1998decompression ; Tse1999 ; Schober2000 ; Debenedetti2003SupercooledReview ; Geil2004rsc ; Limmer2014Theory ; Shephard2017derailed ; Debenedetti2020Science ; tulk2019absence ; Kim2020Science .
The name of LDA originates from the fact that its density of 0.94 g cm-3 is lower than the 1 g cm-3 of liquid water, and because it appears to be an amorphous solid according to diffraction studiesMishima1984Nature . However, despite the importance of LDA, there is ambiguity with respect to its structural nature with some studies pointing towards a more “crystal-like” nature than a purely glassy state Li1997inelastic ; Tse1999 ; Schober2000 ; Andersson2002thermal ; Geil2004rsc ; Andersson2005 ; Andersson2007dielectric ; Tse2008xray ; Elsaesser2010 . Multiple experimental avenues for creating LDA have been discovered: (i) low-temperature deposition of water vapour Burton1935 ; Burton1935Nature ; JenniskensBlake1994 ; (ii) hyper-quenching of micron-sized water droplets Bruggeller1980 ; Mayer1982 ; Mayer1985 ; (iii) decompression or heating high-density amorphous ice (HDA) Mishima1984Nature ; Mishima1985Nature ; (iv) high-energy irradiation of crystalline ice Kouchi1990 ; Baratta1991 ; Leto2003 ; and (v) heating ice VII or VIII at ambient pressure Klug1989 ; Klotz1999 . Experimentally, LDA is identified on the basis of broad features in diffraction. However, discerning the exact structural nature of LDA from diffraction patterns is problematic. Amann-Winkel et al. distinguished three scenarios which are of interest for diffraction patterns of amorphous ice: a purely amorphous material, grains of crystalline ice embedded in an amorphous matrix, and a completely polycrystalline material Amann2016 . The structural nature of LDA is further complicated by subtle differences that can be exhibited by samples depending on their preparation route (e.g. LDA-I, LDA-II and LDA(ice VIII)Winkel2009LDA2 ; shephard2016LDAVIII ).
Computer simulation can provide the atomic scale resolution needed to determine the structure of LDA. A common way to obtain LDA in simulation is to quench liquid water rapidly to avoid crystallisation. Martelli et al. quenched the TIP4P/2005 water model with a cooling rate () of 1 K ns-1 to obtain LDA samples. They searched the LDA model for crystal-ice domains and found none concluding it was indeed fully amorphous Martelli2018searching . Furthermore, by quantifying the large-scale density fluctuations they showed it was nearly hyperuniform Martelli2017uniform . However – as discussed by Limmer and Chandler, Limmer2014Theory and others Giovambattista2004 ; Giovambattista2004b ; Giovambattista2005 ; Gartner2021 – is a key parameter which when varied affects the structural and energetic properties of water glasses. A range of different amorphous LDA samples is thus achievable in simulation. Evidence of multiple configurations corresponding to LDA have also been observed via decompression of HDA Giovambattista2003PRL ; MartelliJPCB2023 and via thermal annealing of HDA / very high-density amorphous ice (vHDA)Guillot2003Polyamorphism . Moreover, given the suggestions of a crystal-like structure in experiment, whether these fully amorphous states achievable in simulation are the best model for the LDA achieved in experiment (and detected in nature) is a key question to resolve.
In this work, we aim to establish the structure of experimental LDA using computational and experimental approaches. Agreement with the structure factor, , of LDA – as measured via wide-angle X-ray scattering by Mariedahl et al. (2018) Mariedahl2018x – is screened across a range of computational models obtained from two diametrically opposed pathways: (i) quenching liquid water at different ; and (ii) constructing large-scale polycrystalline ice structures using Voronoi domains. In the former, the structure of LDA is explored starting from the disordered liquid water state, whilst in the latter it is approached using ordered crystalline ice building blocks. In both pathways, a near exact agreement with experiment is obtained by partially crystalline states consisting of isolated grains of crystalline ice I with amorphous material at the grain boundaries. Experimentally, indirect evidence of LDA’s hybrid crystalline-amorphous nature is found when transforming it to stacking disordered ice I (ice I) upon heating at ambient pressure. LDA samples from different preparation procedures yield ice I with different stacking characteristics. This memory effect is incompatible with a fully disordered and glassy nature of LDA, and thus supports our hybrid structural model.
II Results
II.1 Quenching liquid water indicates that LDA is a partially crystalline state.
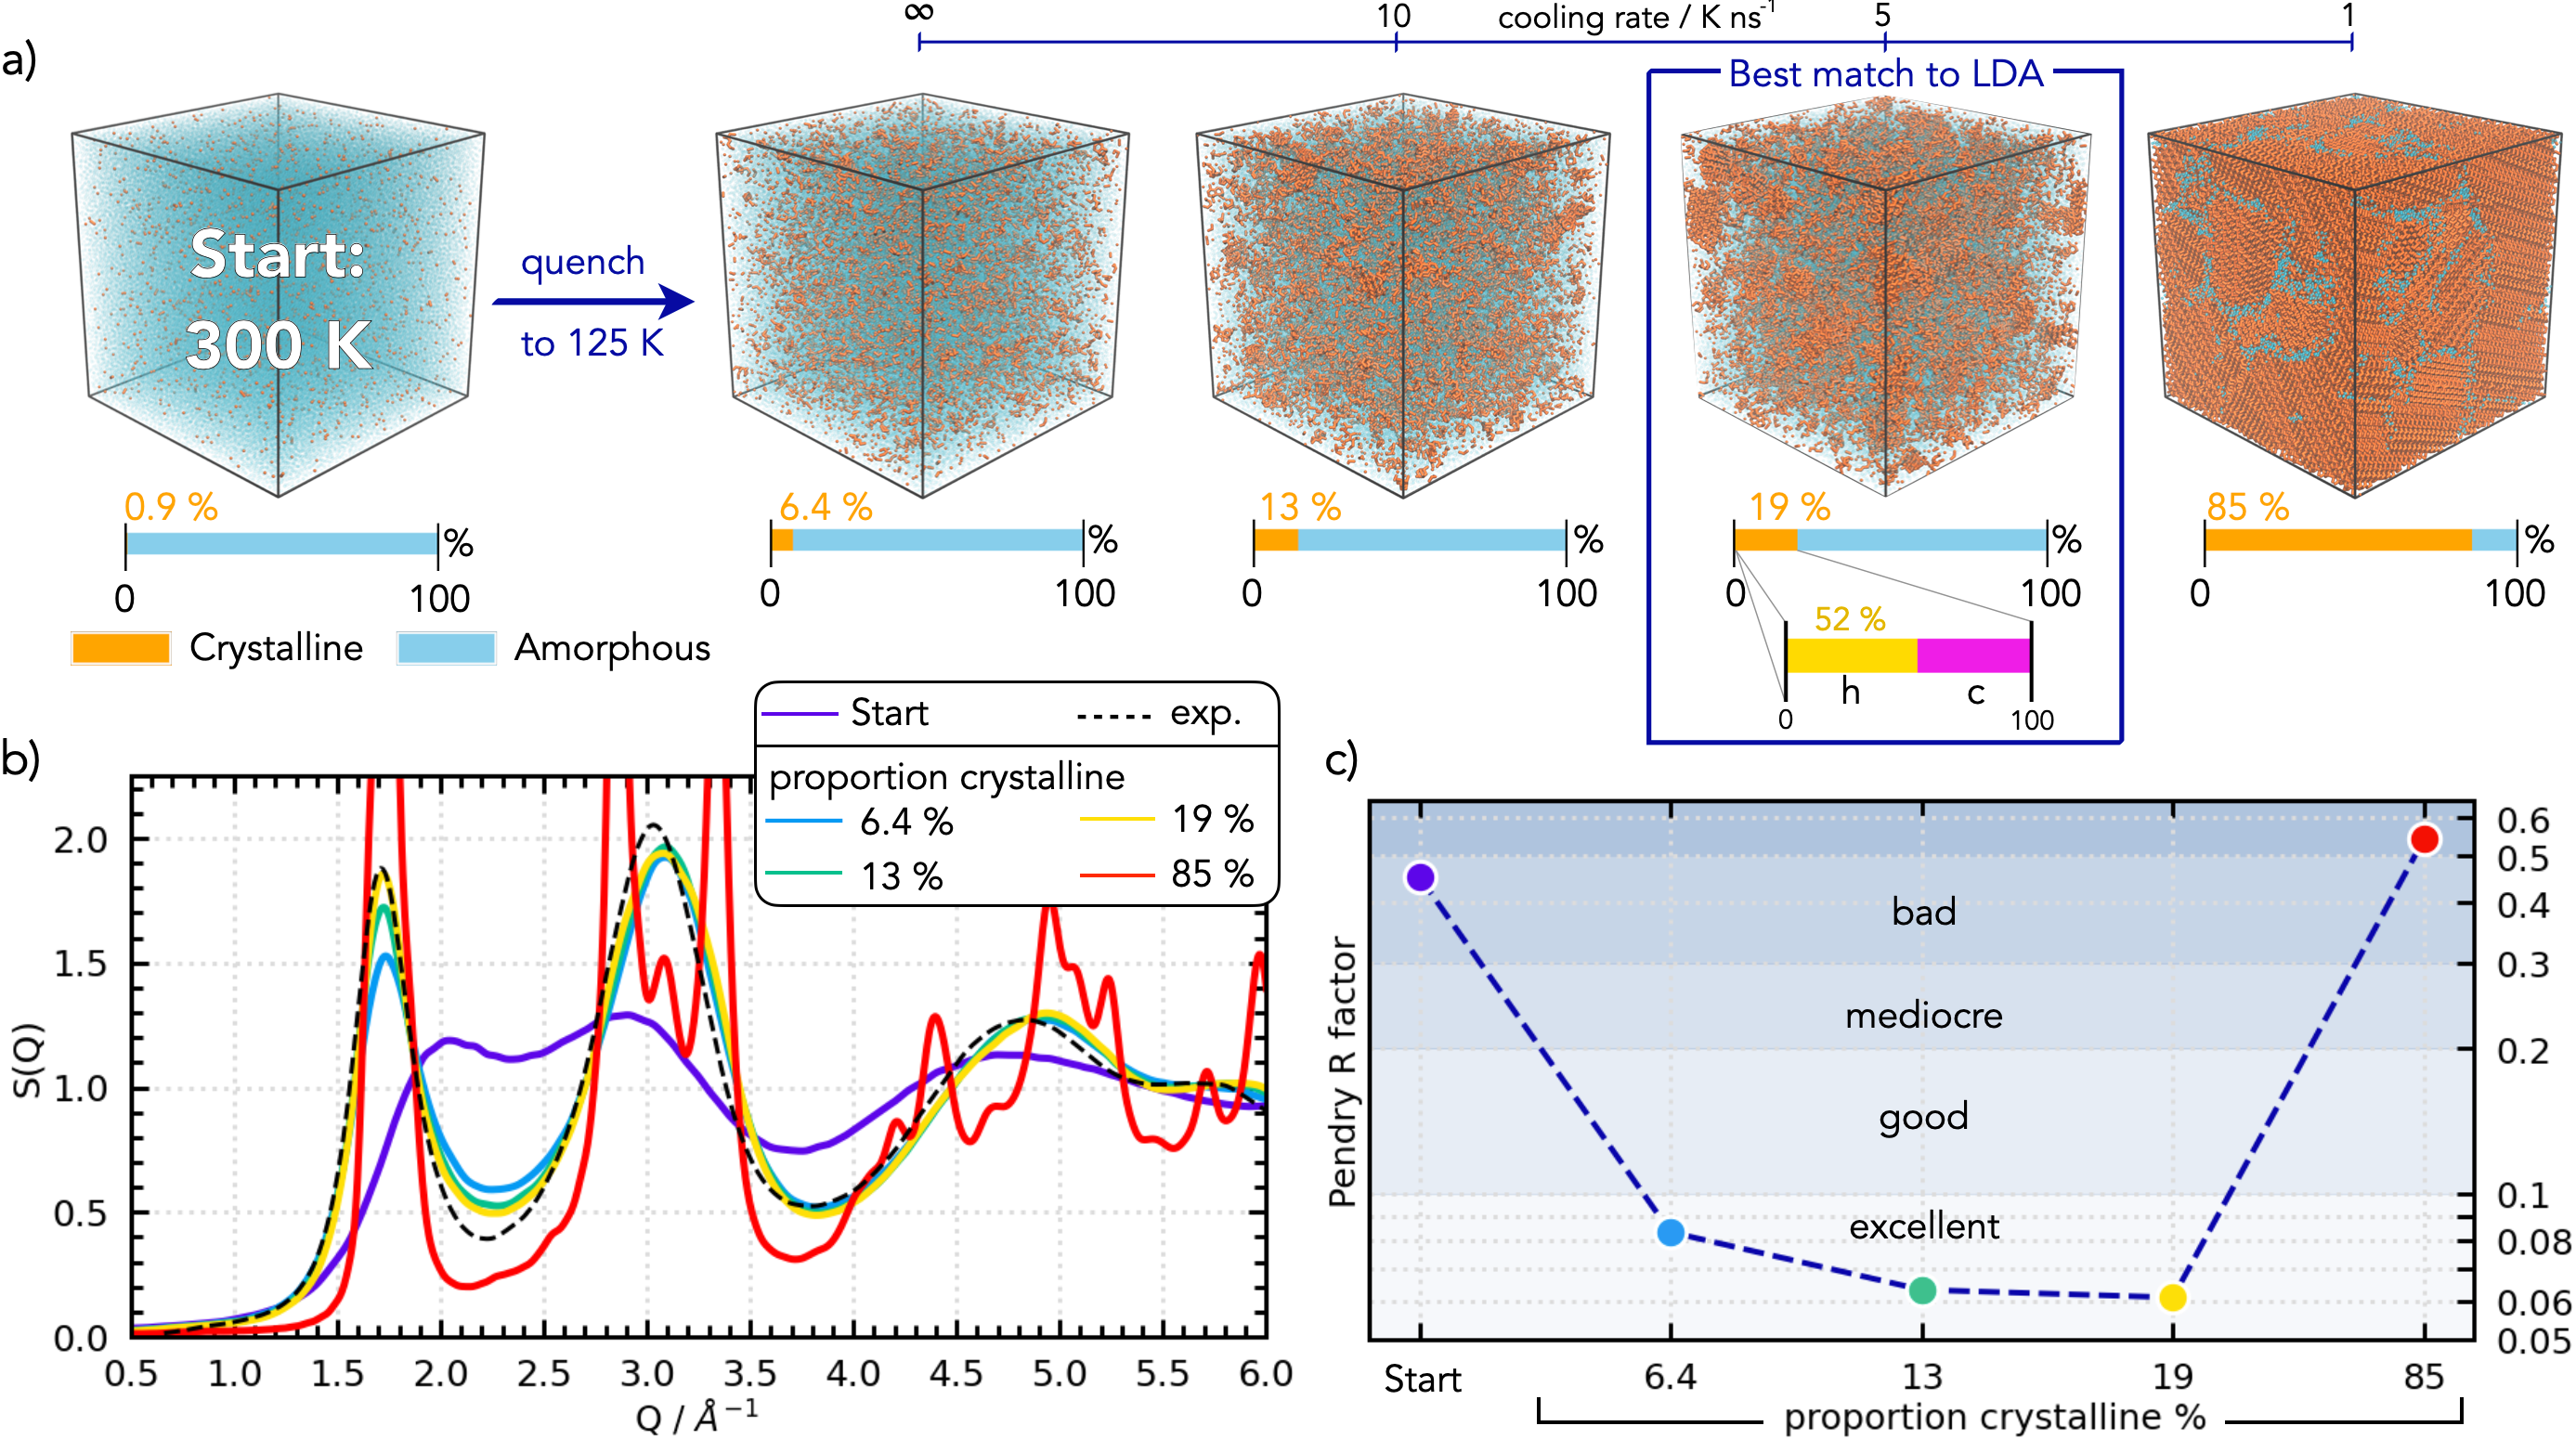
In Fig. 1, we show the results of quenching liquid water from 300 K to 125 K at different cooling rates (). A computationally large periodic box ( nm in ) containing 192,000 mW water molecules was chosen to improve the ability to capture structural anisotropy. Most importantly, multiple local homogeneous nucleation events can be observed at this length scale – for further discussion on the choice of water model see Materials & Methods. of K ns-1 (an instantaneous change of temperature), 10 K ns-1, 5 K ns-1 and 1 K ns-1 were employed. Crystalline (orange) and amorphous (blue) molecules are identified using the local order parameter of Li et al. Li2011 .
The resulting configurations after quenching are shown in Fig. 1a, and can be split into two categories: partially crystallised states and polycrystalline (almost fully crystallised) state. The former are observed for 5 K ns-1, and resemble multiple isolated grains of crystalline ice with thick amorphous regions at the grain boundaries. The latter is obtained with of 1 K ns-1, and resembles multiple grains of ice packed together. The formation of these structures can be explained as follows: As the temperature drops below the melting temperature of ice, the system enters the supercooled liquid state, during which local homogeneous nucleation events stochastically occur resulting in the creation of multiple isolated grains of crystalline ice embedded in liquid water. If the cooling rate is fast enough then before crystallisation can complete, the temperature drops to the point that the kinetic rearrangement of water molecules is extremely limited: the configuration of a partially crystallised state is thus frozen in. The faster the cooling the shorter the time window for nucleation and crystal growth, resulting in a greater proportion of molecules in amorphous environments – as seen in Fig. 1a. Conversely, for slower cooling (e.g. = 1 K ns-1) crystallisation can complete (apart from the amorphous molecules present at the grain boundaries) resulting in polycrystalline ice.
In Fig. 1b the structure factors of the quenched systems are shown. The progressing crystalline nature of the configurations is indicated by a sharpening of the diffraction features. The best agreement with experiment is observed for the partially crystalline state with 19 % crystalline ice present in numerous and diversely sized grains. The proportion of cubic (c) local environments in ice I – termed the “cubicity” – in the ice grains is 48 %, which is close to the expected 50 % cubicity obtained in homogeneous ice nucleation Malkin2012 ; Moore2011 ; AkbariPNAS2015 ; Lupi2017 ; DaviesPNAS2021 . Interestingly, agreement with experiment is observed to be a “goldilocks” scenario with the best model being not too amorphous and not too crystalline. The key effect of the crystallinity in these partially crystalline states is seen with respect to the prominence of the first peak and trough in which reflects more long-range structural characteristics compared to higher Q features.
To quantify the agreement between the computational models and experiment the Pendry R-factor () was employed Pendry1980 over the entire experimental range of Å. was developed and is widely used in low-energy electron diffraction (LEED) to quantify the agreement of computational models with experimental data (see Materials & Methods). A value of = 0 represents perfect agreement whereas values of 0.1 are taken as excellent, 0.2 as good, 0.3 as mediocre, and 0.5 as bad Zanazzi1977 . Fig. 1c shows that the three partially crystallised states have excellent agreement with experiment. This agreement improves as the proportion of molecules in crystalline environments increases from 6.4 to 13 to 19 %. The best model for LDA is the system containing 19 % crystalline ice, which has an value of 0.061 which indicates an extremely high agreement. The ranking given by is shown to qualitatively agree with the coefficient of determination in Fig. S1. Fig. S2 shows for the optimal LDA model and experimental data over the full Å range.
The nucleation rate, which has a per unit time and per unit volume dependence, can be used to physically understand the states achieved from quenching. The former dependency can explain the effect of seen in Fig. 1. The latter is captured by system size. Fig. S3 shows that smaller systems give poorer matches to LDA as a result of the reduced length scale impairing the ability to capture polycrystalline structures. Moreover, different water models exhibit different nucleation rates and thus give different states when subject to the same quenching procedure. This is shown in Fig. S4 by employing the atomistic TIP4P/2005 water model TIP4P2005 . This model’s slower nucleation rate and dynamics results in more highly amorphous states. A poorer match to LDA is found for these more amorphous states, and notably it improves as the system gets closer to a partially crystalline state. This further underpins that experimental LDA is not fully amorphous but instead partially crystalline.
II.2 Models of polycrystalline ice indicate LDA is a partially crystalline state.
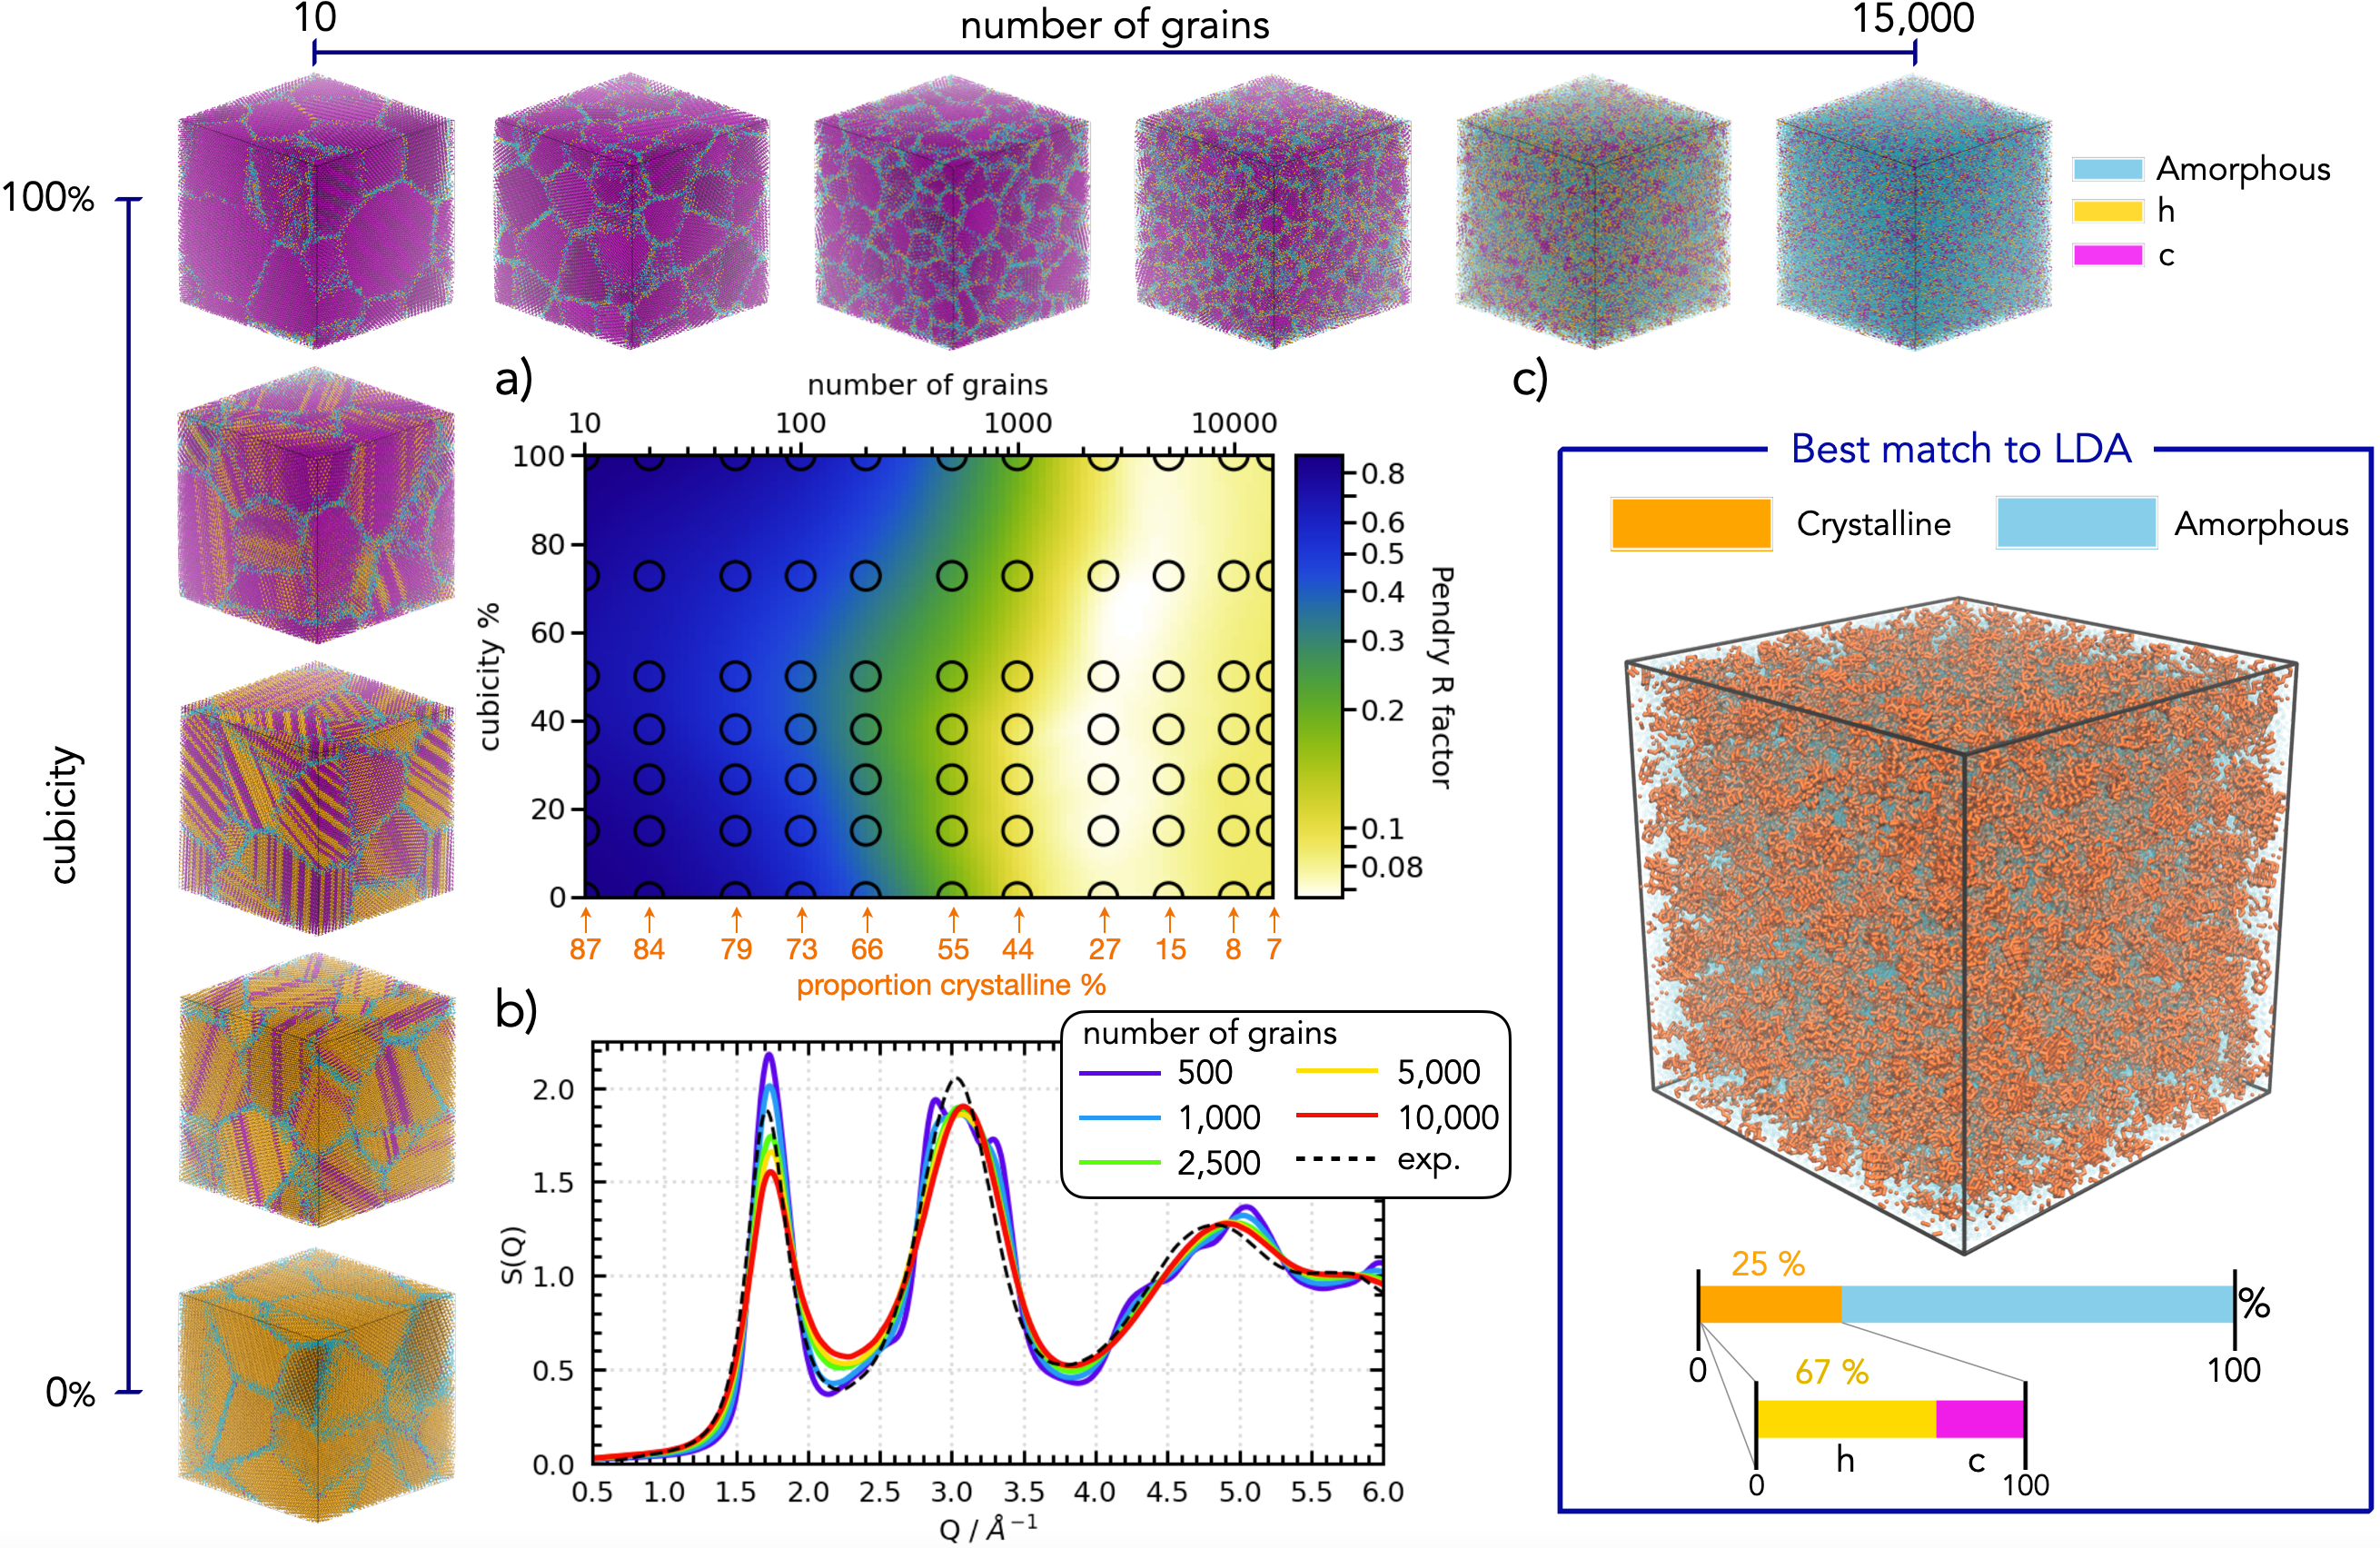
A second pathway to achieve an amorphous-like is through creating highly polycrystalline ice: the random arrangement of many ice grains can broaden the diffraction features of crystalline samples. To this end, periodic polycrystalline structures containing approximately 320,000 mW molecules ( nm in ) with desired levels of polycrystallinity (number of grains) and cubicity were built using Voronoi domains. These were subsequently geometry optimised and annealed at 125 K (see For uHDA and eHDA the “grandparent” phases are also given in brackets. uHDA(I was created using a different experimental procedure to the other uHDA samples (see Materials & Methods). A grid search was set up as illustrated in Fig. 2. Cubicities only refer to the subset of molecules in crystalline environments in the system and are not indicative of the total proportion of molecules that are in crystalline environments. The approximate mean diameters of the grains for each level of polycrystallinity are shown in Fig. S5.
Fig. 2a shows a heatmap of the values of the polycrystalline models against the experimental LDA . A strong dependence of the agreement is seen with polycrystallinity. Fig. 2b shows this is due to the increasing amorphous nature of the diffraction patterns with increasing polycrystallinity. As with the quenching simulations, the “goldilocks” scenario is again observed. The optimal match is found for the 2,500 grain systems which have an optimal value of 0.068. Both lower and higher levels of polycrystallinity (and thus proportion of crystalline versus amorphous) result in poorer matches to experiment. The amorphous regions arise due to the lattice mismatches between the various Voronoi domains. A large number of small domains leads therefore to more amorphous regions. Fig. 2c shows the structure of the best fit. Again, the structure is a partially crystallised state with isolated grains of crystalline ice surrounded by amorphous “filler” regions. This is due to ice being a “soft” molecular material which results in quite thick amorphous regions at the grain boundaries. At this high level of polycrystallinity the system is 25 % crystalline and 75 % amorphous. It thus no longer resembles a “traditional” polycrystalline system – the type highlighted by Amann-Winkel et al. to be of interest but not a probable structure for amorphous ices Amann2016 – which have sharp interfaces at the grain boundaries and are therefore mainly crystalline.
A weak, but noticeable, dependency on the match to experiment is seen for the level of cubicity in Fig. 2a with a best match around 30 % cubicity. The level of cubicity affects and this is more pronounced for highly crystalline systems, resulting in the stronger dependency observed there.
It is interesting to note that the two different approaches – building polycrystalline ice and quenching liquid water – converge to similar structural models of LDA. This gives greater confidence that experimental LDA is indeed partially crystalline. It is also interesting to note the slightly higher crystallinity for the LDA model found from the polycrystalline (25 %) versus the quenched systems (19 %). This difference is due to different distribution of crystalline ice grains in each model. Quenching produces crystalline ice through homogeneous ice nucleation, which is a stochastic process. The polycrystalline structures are similarly built in a stochastic manner, having defined numbers of randomly positioned and orientated nucleation sites which then grow isotropically at the same speed until they impinge on the neighbouring domains. However, the resulting grains of crystalline ice are more uniform in size than achieved through quenching. For randomly orientated grains, a small number of large grains gives a more structured than the same amount of ice broken into many smaller domains. This results in the relatively small difference in crystallinity observed between the two LDA models, which can be taken as approximate upper and lower bounds for the crystallinity of experimental LDA. We also note that there is a slight difference in cubicity (48 % and 33 %) of the crystalline grains in the two LDA models. However, the dependence on the match to LDA with cubicity observed in the polycrystalline systems is minor.
II.3 Exploring the hybrid crystalline-amorphous nature of LDA.
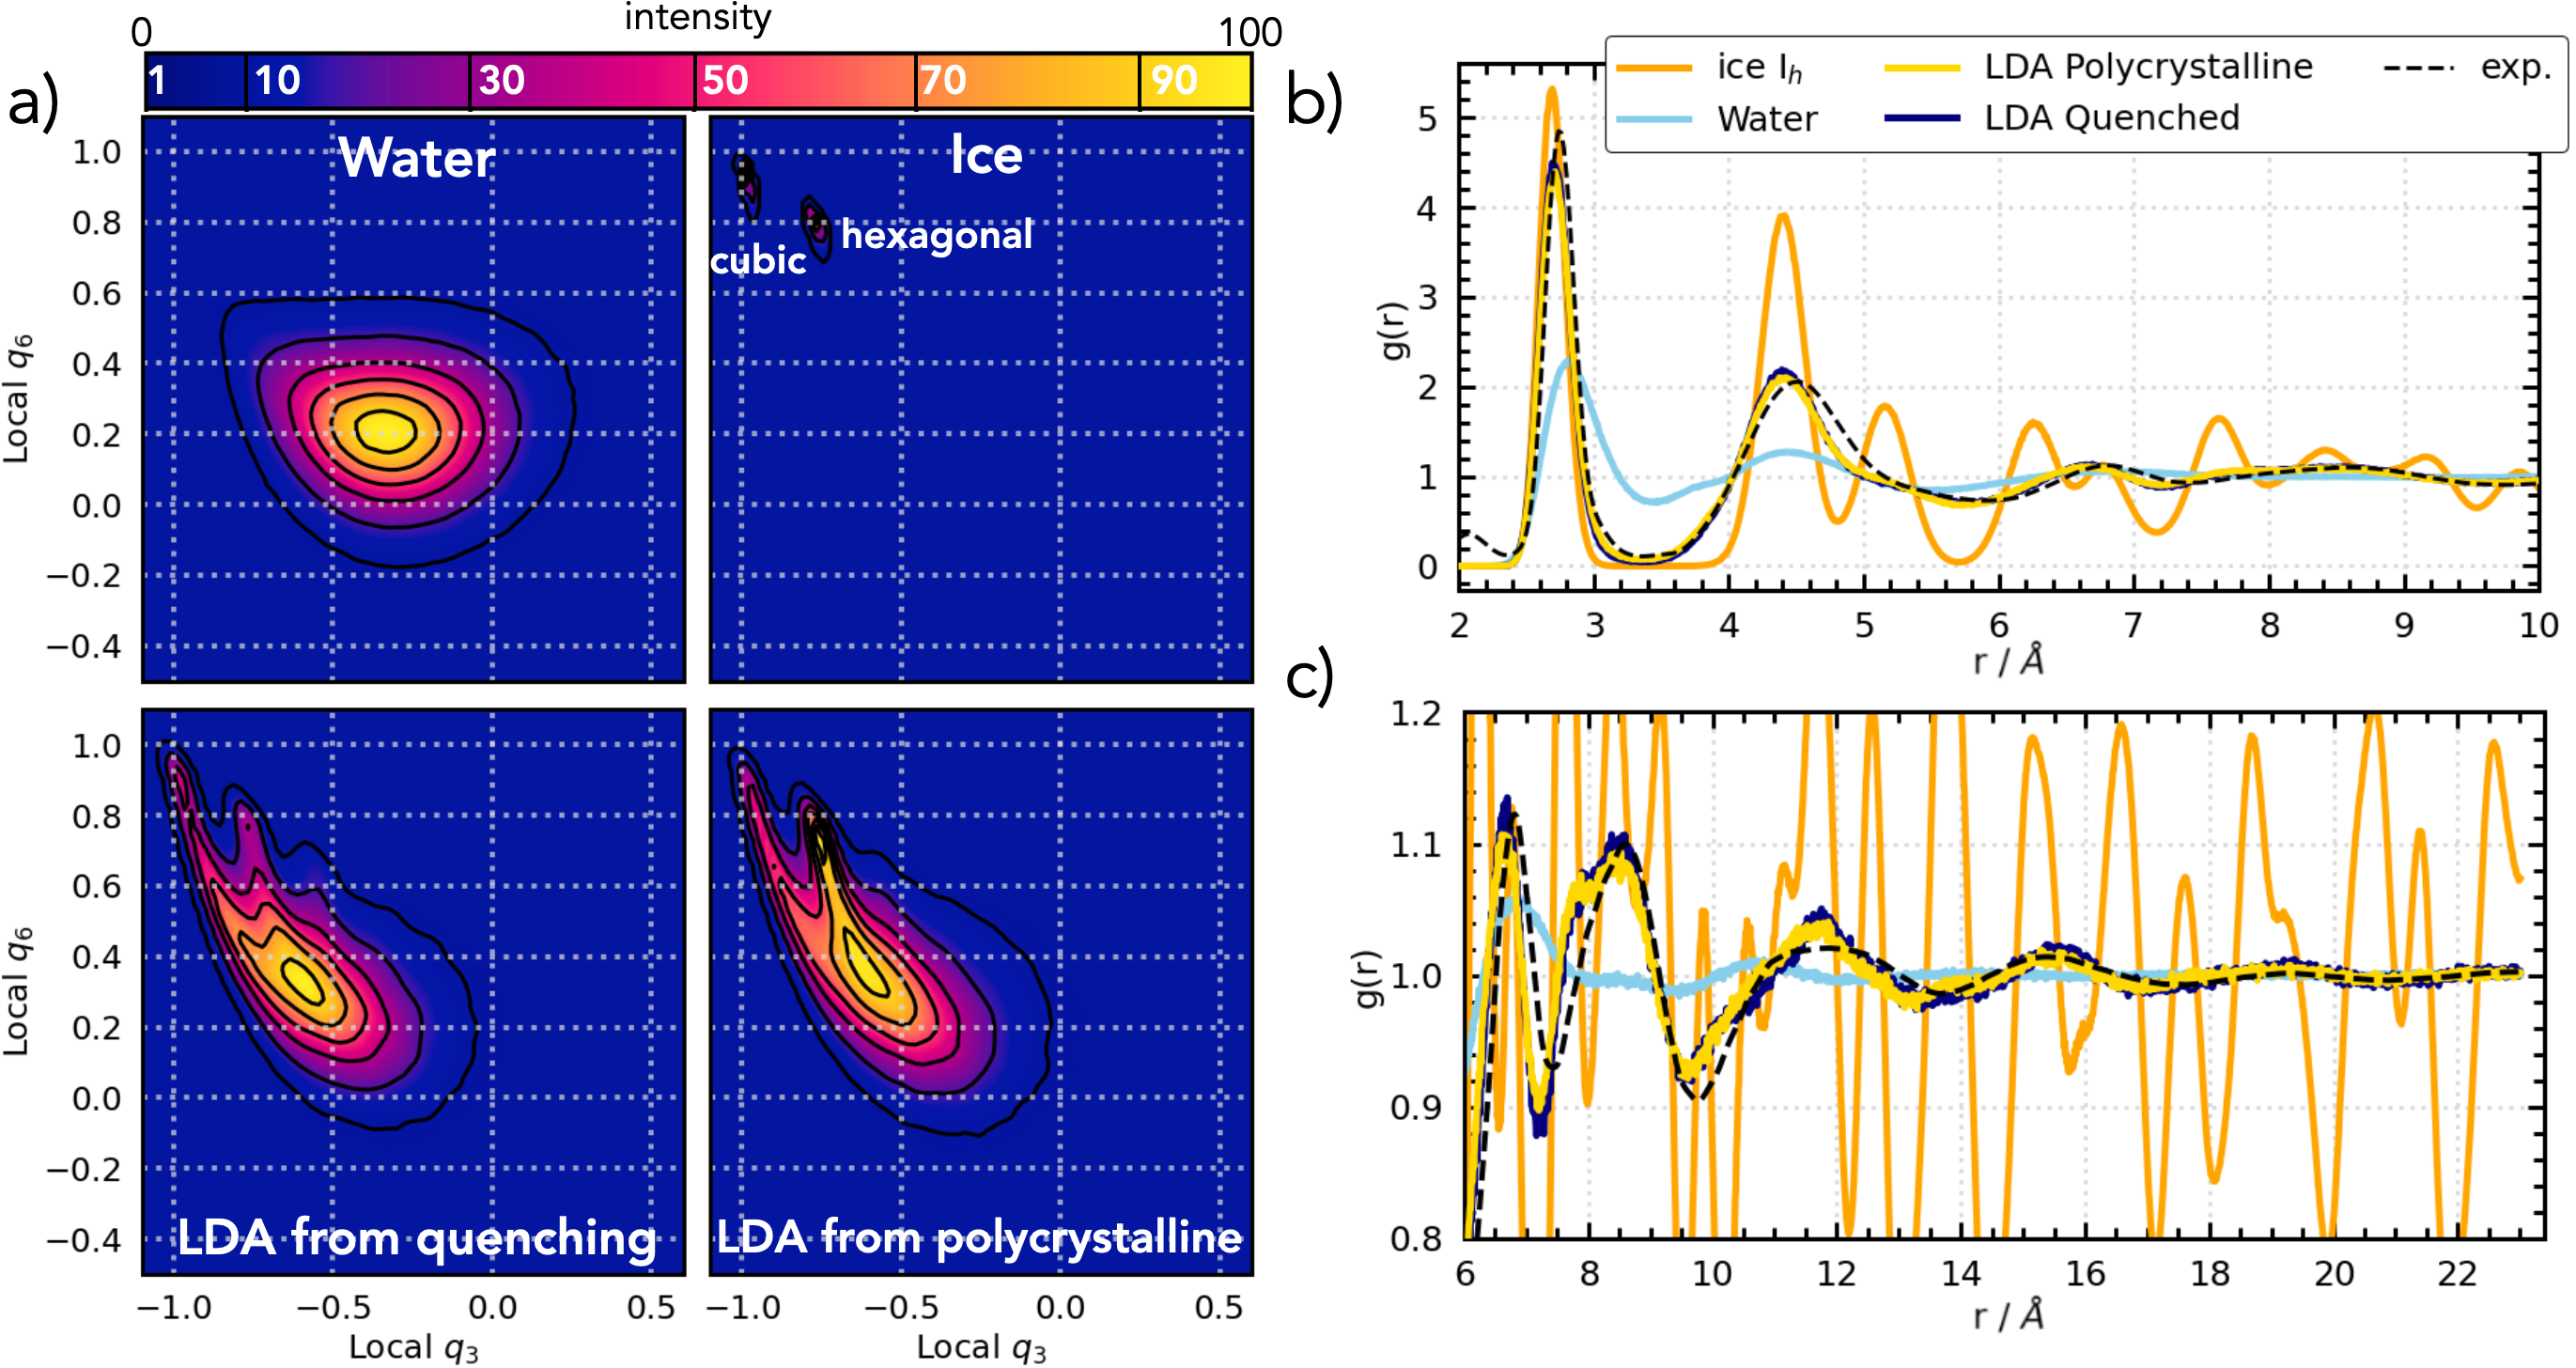
We now further investigate the hybrid crystalline-amorphous nature of the two LDA models by analysing their local structures. In Fig. 3a the distributions of the atomic local environments of water, ice I, ice I, and the LDA models are plotted. Both the local and local competently identify crystalline versus amorphous configurations, with the latter also able to differentiate between cubic and hexagonal environments Li2011 . The local environments of the two LDA models are very similar to each other. They contain significant amounts of highly crystalline and amorphous (as explored by liquid water) atomic local environments, with a smooth distribution of environments explored between these two levels of local order. This is consistent with a hybrid crystalline-amorphous structure.
The hybrid crystalline-amorphous nature of the LDA models is also reflected in their oxygen-oxygen radial distribution functions, , shown in Fig. 3b and c. The two LDA models have near identical and both show a very good agreement to experiment which is well maintained up to the longest range signal measured in experiment of 23 Å. In the short range, up to Å illustrated in Fig. 3b, the first coordination shell of LDA is very similar compared to crystalline ice whereas the feature of the second coordination shell is significantly broadened. From Å onwards LDA’s radial correlations quickly decay leaving it dissimilar to crystalline ice. Interestingly, it also shows subtle dissimilarities to liquid water at this range, as it maintains stronger correlations as illustrated in Fig. 3c. Mariedahl et al. (2018) made similar observations from their experimental signal, stating “it is essential to develop models of amorphous ices that can better describe these intermediate-range correlations” Mariedahl2018x . The strong agreement observed over all ranges probed between the LDA models and experiment shows that this structure is well explained by a partially crystalline state.
Fig. S6 shows the primitive ring distributions of the structures. Both LDA models are very similar, peaking at 6-membered rings (which ice I is entirely comprised of), along with a significant number of 5- and 7-membered rings. Physically, this is consistent with a partially crystallised state: similar distributions have been reported by Haji-Akbari and Debendetti for ice nuclei formed in homogeneous nucleation, and by Fitzner et al. for the most immobile regions of supercooled water where homogeneous nucleation was found to occur AkbariPNAS2015 ; Fitzner2019 .
II.4 Cubicity memory effects in experimental LDA samples can be explained by a hybrid crystalline-amorphous state.
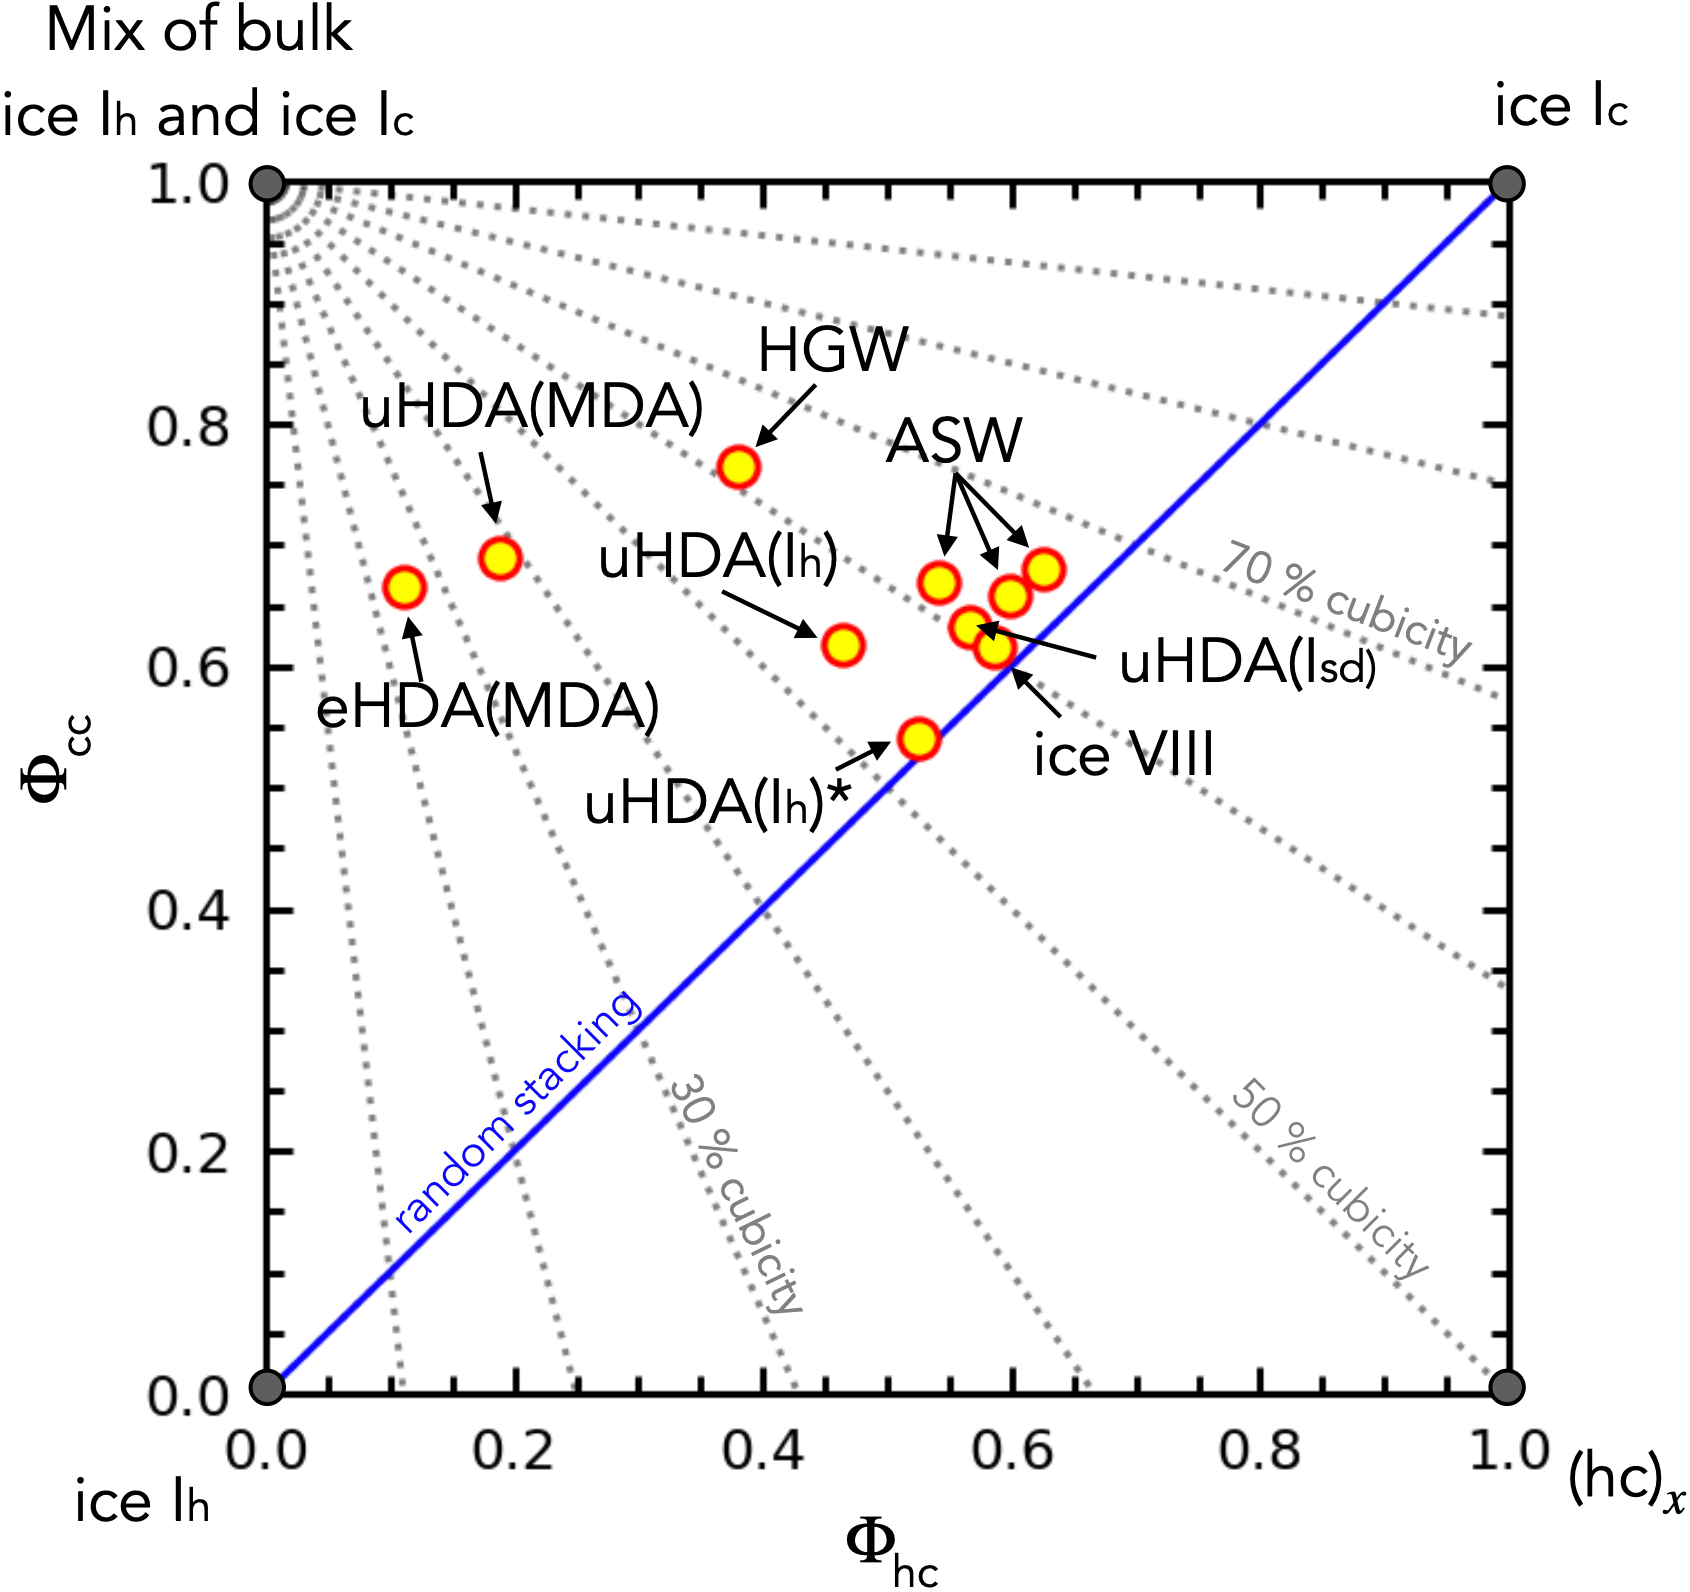
Experimentally, we find indirect evidence for the presence of crystallinity in LDA by heating it to form stacking disordered ice (ice I) and quantifying the stacking probabilities. Fig. 4 shows the remarkable variability in the stacking probabilities of ice I obtained from the various LDA samples. Each LDA sample has a different “parent” phase: unannealed high-density amorphous ice (uHDA) samples formed by compressing ice I, ice I and medium density amorphous ice (MDA) respectively MDA ; expanded high-density amorphous ice (eHDA) formed by compressing MDA to HDA; ice VIII; vapour deposition to give amorphous solid water (ASW); and the hyperquenching, performed by Kohl et al. in ref. 66,Kohl2000hgw of an aerosol of liquid water droplets to give hyperquenched glassy water (HGW). A fully amorphous LDA structure would not be expected to display such memory effects with respect to the parent phase which therefore indicates the presence of crystalline grains with different cubicities in LDA samples. The obtained cubicities range from %. Such a range of cubicity is difficult to explain by nucleation occurring during the crystallisation of a fully amorphous structure – homogeneous ice nucleation results in random stacking with 50 % cubicity Malkin2012 ; Moore2011 ; AkbariPNAS2015 ; Lupi2017 ; DaviesPNAS2021 – and instead indicates that crystal growth from already existing ice seeds is the dominant process. In conjunction, the weak dependence of cubicity observed in the polycrystalline LDA models shows that crystalline ice I grains with different cubicities can be well hidden in the broad diffraction features of LDA samples. Similar differences in the crystallisation behaviour of LDA samples created via different pathways have also been reported by Seidl et al. Seidl2013 and Mariedahl et al. Mariedahl2019RSC , but accurate cubicities have not been reported.
III Discussion
In this work, we have found strong evidence indicating that LDA has a hybrid crystalline-amorphous structure. Computational models with near exact agreement of the structure factors with experiment were found via quenching liquid water and building polycrystalline ice. In both cases, the models resemble a partially crystalline state with grains of crystalline ice surrounded by amorphous “filler regions”. Matching experiment was found to be a “goldilocks” scenario, where the structure is not too amorphous and not too crystalline – containing in the region of ice for the mW water model. Experimentally, indirect evidence of LDA’s hybrid crystalline-amorphous state was found by transforming LDA to ice I: a memory effect with respect to the parent material of LDA is seen in the stacking probabilities that cannot be explained by a fully amorphous LDA state and hence indicates the presence of crystalline ice grains already in the LDA with different cubicities.
The very similar local environments in LDA and ice I are also consistent with their Raman spectra of the O-H stretching modes Carr2014 . In fact, the LDA to ice I phase transition is barely visible in Raman spectroscopy. In Fig. S7, the vibrational density of states for the different levels of polycrystallinity explored in this study are plotted. This shows a qualitative agreement with experiment whereby the spectra show a weak dependence on the level of polycrystallinity and no dependence on the cubicity.
In experiment, Winkel et al. reported the existence of two sub-states of LDA – which they named LDA-I and LDA-II – that exhibit subtle structural differences in their diffraction patterns Winkel2009LDA2 . It has been suggested that LDA-I may contain crystalline ice whilst LDA-II does not; however, no evidence has been provided Elsaesser2010 ; Seidl2013 . In this study, we have looked for computational models to match the X-ray diffraction pattern of LDA-II collected by Mariedahl et al. (2018) Mariedahl2018x . In Fig. S2, the X-ray diffraction patterns of LDA-I and LDA-II measured by Mariedahl et al. (2019) Mariedahl2019RSC are plotted together with the LDA-II pattern of Mariedahl et al. (2018) Mariedahl2018x and the optimal computational LDA models discovered here. We find that the differences between the experimental diffraction patterns of LDA-I and LDA-II samples are very subtle. Indeed, the LDA-I signal lies within the variation of the two different LDA-II measurements, indicating the difference between LDA-I and LDA-II could be down to experimental error. In Raman spectroscopy, no difference could be found between LDA-I and LDA-II Shephard2013anneal . In any case, the high similarity of LDA-I and LDA-II diffraction patterns mean they are both optimally matched by the same computational LDA models discovered in this study. Our conclusion that LDA is best modelled by a partially crystalline state thus holds for both LDA-I and LDA-II. The structural difference between the LDA-I and LDA-II appear to be subtle differences in crystallinity or experimental error or both.
A hybrid-crystalline structure of LDA has potential wide-reaching implications. Being the most abundant form of water in the universe, LDA is important in astronomy; for instance, in astrochemistry LDA is thought to play a key role in promoting the variety, complexity and richness of molecules observed in the stellar-forming regions of space Burke2010 ; Ehrenfreund2000 . In cryopreservation, the vitrification (avoidance of ice crystallisation) of biological matter is thought to be key to cell survival – here a fully amorphous LDA is desired to act as the embedding matrix Huebinger2016 ; NatCryoReview . A fully amorphous LDA is similarly desired in the widely used technique of cryogenic electron microscopy Cressey2017 – achieving a truly amorphous LDA would help prevent sample damage and could help improve resolution. Crucially, LDA is key for our understanding of liquid water. A corresponding liquid state to LDA is central to the two-state model. And whilst a fully amorphous LDA can be achieved in simulation, confirming if a fully amorphous LDA can be achieved experimentally or exists in nature is now of paramount importance – especially given the recent discovery of MDA MDA . To achieve a fully amorphous LDA, novel techniques might need to be employed. For instance, a rapid enough cooling rate might completely avoid crystallisation.
Finally, the findings of this study have implications for the structural nature of other amorphous materials. Of immediate interest are the other amorphous ices, such as HDA; future work to clarify if they are truly amorphous or not is now needed. It also potentially impacts the myriad of glasses that underpin many technologies (e.g. OLEDs and fibre optics). The beneficial application of glasses over crystals here is largely due to their macroscopic homogeneity and absence of grain boundaries Ediger2017perspective . Determining which materials are truly glassy and which ones are not could provide future opportunities for technological innovation. Another question that arises is the nature of “ultrastable glasses” Swallen2007organic ; Ediger2017perspective – a class of material that can exhibit highly desirable properties. The low entropy of these materials could be explained by the presence of crystalline grains that were previously undetected, thereby providing a resolution to the Kauzmann paradox Kauzmann1948nature .
IV Materials & Methods
IV.1 Molecular dynamics (MD) simulations.
MD simulations were performed with the large-scale atomic/molecular massively parallel simulator (LAMMPS) code Plimpton1995 . Cubic simulations boxes periodic in were used. The constant number of molecules, constant pressure, and constant temperature (NPT) canonical ensemble was sampled using 10-fold Nosé-Hoover thermostats and barostats. MD simulations of mW used thermostats and barostats with relaxation times of 500 femtoseconds (fs) and 5 picoseconds (ps) respectively, and integrated the equations of motion with a timestep of 10 fs. MD simulations of TIP4P/2005 used thermostats and barostats with relaxation times of 200 fs and 2 ps, respectively. Simulations of quenching liquid water and of annealing polycrystalline ice employed isotropic and anisotropic barostats, respectively.
There are, of course, many water models. In this study we chose to use mW because it offers the best trade-off between accuracy and computational cost. The choice was based on several reasons: (i) mW accurately captures important properties of water such as the density, structure, melting temperature, and the formation of LDA mWmodel ; (ii) it has been widely and successfully used in studying the nucleation of ice mWmodel ; Li2011 ; Li2013 ; Lupi2014 ; Lupi2017 ; Sosso2016b ; ManyFaces ; DaviesPNAS2021 ; DaviesPNAS2022 ; (iii) it accurately captures the metastability of ice I Quigley2014 ; mWmodel as well as the thermodynamics of stacking faults Lupi2017 ; Hudait2016 ; Hondoh1983 ; (iv) crucially, because it is considerably cheaper than an all-atom model and has faster dynamics mW enables quenching and crystallisation simulations in large system sizes ( particles) – such system sizes are essential for determining the balance of ice-like and amorphous domains. The TIP4P/2005 water model was employed as an atomistic water model as it has also been widely and successfully applied to study water and ice, including the formation of LDA TIP4P2005 ; TIP4PIceTmd ; Sosso2016b ; Martelli2017uniform ; Martelli2018searching ; Debenedetti2020Science .
Quenching simulations were performed in a similar fashion to Gartner et al. Gartner2021 . Water was first equilibrated at 300 K and 0 Pa for 2 ns, prior to generating starting configurations. The desired rate was achieved by smoothly ramping the temperature from 300 K to 125 K over the required time period. For K/ns, the structure was further relaxed (4 ns for mW, and 20 ns for TIP4P/2005).
Using our Stacky program Stacky , a range of ice I supercell structures with 60 layers, 322,560 mW water molecules and cubicities of 1, 0.73, 0.5, 0.37, 0.27, 0.13 and 0 were produced. After transforming the hexagonal to orthorhombic cells, the cell dimensions were 21.5, 21.8 and 22.0 nm in x, y, z. The purpose-written nanoVD program then used these structures to create 5, 10, 20, 50, 100, 200, 500, 1,000, 2,500, 5,000, 10,000 or 15,000 Voronoi domains within a cell of the same size. The center points of the Voronoi domains were randomly chosen. The ice I structures were rotated randomly using a zyz rotation matrix and shifted by random fractions of the cell edges. The latter step is essential to ensure that the final polycrystalline structure reflects the cubicity of the parent structure. The structures were then placed at the centers of the Voronoi domains followed by deleting all molecules that were more than half-way away with respect to the centers of the surrounding Voronoi domains including those located outside the cell through the periodic boundary conditions. As a quality check, it was confirmed for each polycrystalline structure that the number of the mW molecules approximately matched the corresponding number in the start structure.
The various polycrystalline structures with different domain sizes and cubicities were then geometry optimised in LAMMPS using the steepest descent algorithm, then equilibrated at 125 K and 0 Pa for 50 ps with a timestep of 0.25 fs, then for 2 ns with a timestep of 10 fs, prior to undertaking analysis. Fig. S10 shows snapshots of the systems before and after the geometry optimisation plus equilibration.
Structure factors were calculated using the Debyer software (https://github.com/wojdyr/debyer) with a cutoff of half the minimum box dimension, and the sinc-fuction (sin(x)/x) to dampen the cut-off and reduce the Fourier termination effects. Ring statistics were calculated with the Rigorous Investigation of Networks Generated using Simulations (R.I.N.G.S) software RINGS and the primitive rings criterion. The Visual Molecular Dynamics software Humphrey1996 was used to calculate radial distribution functions and to generate images of systems STON1998 .
IV.2 Classifying local environment of water molecules.
The local order parameter of Li et al. was used to classify mW molecules as either crystalline or amorphous Li2011 . The threshold for labelling a particle as crystalline or amorphous was calculated following the methodology used by Espinosa et al. VegaSeedingApproach . Periodic boxes of bulk ice I, ice I, and water containing 184,000, 216,000 and 192,000 mW molecules respectively were simulated at 250 K and 0 Pa, and the corresponding local values were extracted every 200 ps over 2 ns. The distribution of the local values for crystalline and amorphous environments were then taken from the bulk crystalline ice and bulk liquid water simulations respectively. As shown in Fig. S11 the cutoff for the local between crystalline and amorphous environments are then taken where the probability of mislabelling a particle as crystalline when it is amorphous and vice versa is equal: local gives a mislabelling percentage of 0.8 % here. A similar methodology was used to classify molecules as either ice I or ice I, where instead the local values were compared between bulk ice I and ice I. Fig. S12 which shows that local gives a mislabelling percentage of 0.04 % here for the mW model.
The same method was used to distinguish crystalline form amorphous molecules for the TIP4P/2005 model (using the configuration of the oxygens); however an alternative definition of local by Lechner and Dellago Lechner2008 was used as it was found to give a smaller mislabelling percentage here than that of Li et al. Fig. S13 shows a mislabelling percentage of 0.84 % was achieved.
IV.3 Pendry R-factor.
The Pendry reliability factor (“Pendry R-factor”) was calculated as defined by Pendry Pendry1980 . Let be a signal and be its first derivative. To compare with another signal, the logarithmic derivative is employed to give emphasis on the location of the maxima/minima rather than the amplitudes.
| (1) |
A comparison between theory, , and experiment, , using the L functions gives too high an emphasis to zeros; therefore, the Pendry y-function is then employed to give a similar emphasis to troughs and peaks in the signal
| (2) |
The imaginary part of the electron self energy term used in the LEED community, V, was set to two here. The Pendry R factor between theory, , and experiment, , is then defined as
| (3) |
This was employed between computational and experimental over the entire Å range of the experimental signal. was employed due to its popularity in the LEED community in quantifying the agreement of computational models with experiment. In Fig. S1, the results obtained with are shown to qualitatively agree with the coefficient of determination in this study.
IV.4 Experimental procedures for creating the LDA “parent” phases.
All uHDA samples, except from uHDA(I)*, were prepared in a 0.8 cm diameter pressure die lined with indium, pre-cooled to 77 K, and compressed to 1.6 GPa at 5 kN/min. uHDA(I)* was prepared by injecting 0.4 mL H2O into the pre-cooled indium cup, forming ice I, followed by pressure-induced amorphization (PIA) similar to Mishima et al. Mishima1984Nature . In the case of uHDA from MDA, a 77 K-cooled indium cup was filled with MDA and placed into the pressure die where the preparation of MDA can be found in ref. 65.MDA To create the parent phases of ice I and ice I, the 0.4 mL H2O (Milli-Q, Millipore) injected into the cold pressure die was compressed to 0.35 GPa and heated to 200 K forming ice II. Following quenching to 77 K, ice II was decompressed to 100 N whereafter ice I or I was extracted at 182 K or 260 K, respectively as determined by the in situ volume changes during heating. The resultant ice was then transformed to uHDA through PIA. Further steps were taken when creating eHDA, which was made by heating uHDA to 145 K at 0.25 GPa before quenching to 77 K. All samples were extracted in a liquid nitrogen environment for further analysis.
IV.5 Experimental procedure for transforming LDA samples to ice Isdpon heating.
The various samples were transferred under liquid nitrogen into a purpose-built Kapton window sample holder mounted on a Stoe Stadi P diffractometer with Cu K1 radiation at 40 kV, 30 mA and monochromated by a Ge 111 crystal. A Mythen 1K area detector collected data every 10 K from K with a heating rate of 1 K/min as controlled by an Oxford Instruments Cryojet HT. The samples form LDA around 110 K (except ASW and HGW which are already LDA to begin with), and ice I around K, before finally converting to I above 220 K. An example of this heating procedure when applied to uHDA is shown in Fig. S8. The first ice I patterns after the conversion from LDA upon heating were fitted with the MCDIFFaX software Salzmann2015mcdiffax . The software searches for the optimum lattice constants, stacking probabilities, peak profile parameters and zero-shift to reach a convergence and hence best-fit to the experimental data. The resultant fits overlaying the experimental data are shown in Fig. S9.
The MCDIFFaX fits of ice I from ASW and LDA from ice VIII have already been published in ref. 44shephard2016LDAVIII and 97.RosuFinsenThermal2022 All other X-ray data has not been previously published.
V Acknowledgements
We thank S. J. Cox and V. Kapil for stimulating discussions and suggestions, M. Vickers for help with the X-ray diffraction measurements and J. K. Cockcroft for access to a Cryojet HT.
Funding We are grateful to the Materials Chemistry Consortium (Grant EP/L000202) and the UK Materials and Molecular Modelling Hub (Grants EP/P020194/1 and EP/T022213/1) for access to the ARCHER, Thomas, and Young supercomputers. We acknowledge funding from the European Research Council (ERC) under the European Union’s Horizon 2020 research innovation programme grant 725271.
Competing interests Authors declare that they have no competing interests.
Author contributions
Conceptualization: MBD, CGS, AM.
Investigation: MBD, ARF, CGS, AM.
Funding acquisition: CGS, AM.
Software: MBD, CGS.
Visualisation: MBD, CGS.
Writing – original draft: MBD.
Writing – review & editing: MBD, ARF, CGS, AM.
References
- (1) M. Chaplin, “Water structure and science https://water.lsbu.ac.uk,” 2022.
- (2) M. Millot, F. Coppari, J. R. Rygg, A. Correa Barrios, S. Hamel, D. C. Swift, and J. H. Eggert, “Nanosecond X-ray diffraction of shock-compressed superionic water ice,” Nature, vol. 569, no. 7755, pp. 251–255, 2019.
- (3) C. G. Salzmann, J. S. Loveday, A. Rosu-Finsen, and C. L. Bull, “Structure and nature of ice XIX,” Nature communications, vol. 12, no. 1, pp. 1–7, 2021.
- (4) R. Yamane, K. Komatsu, J. Gouchi, Y. Uwatoko, S. Machida, T. Hattori, H. Ito, and H. Kagi, “Experimental evidence for the existence of a second partially-ordered phase of ice VI,” Nature Communications, vol. 12, no. 1, p. 1129, 2021.
- (5) T. M. Gasser, A. V. Thoeny, A. D. Fortes, and T. Loerting, “Structural characterization of ice XIX as the second polymorph related to ice VI,” Nature Communications, vol. 12, no. 1, p. 1128, 2021.
- (6) V. B. Prakapenka, N. Holtgrewe, S. S. Lobanov, and A. F. Goncharov, “Structure and properties of two superionic ice phases,” Nature Physics, vol. 17, no. 11, pp. 1233–1238, 2021.
- (7) C. G. Salzmann, “Advances in the experimental exploration of water’s phase diagram,” The Journal of chemical physics, vol. 150, no. 6, p. 60901, 2019.
- (8) E. A. Engel, A. Anelli, M. Ceriotti, C. J. Pickard, and R. J. Needs, “Mapping uncharted territory in ice from zeolite networks to ice structures,” Nature Communications, vol. 9, no. 1, p. 2173, 2018.
- (9) V. Kapil, C. Schran, A. Zen, J. Chen, C. J. Pickard, and A. Michaelides, “The first-principles phase diagram of monolayer nanoconfined water,” Nature, pp. 1–5, 2022.
- (10) J. Peter and B. D. F., “Structural Transitions in Amorphous Water Ice and Astrophysical Implications,” Science, vol. 265, pp. 753–756, 8 1994.
- (11) D. J. Burke and W. A. Brown, “Ice in space: surface science investigations of the thermal desorption of model interstellar ices on dust grain analogue surfaces,” Phys. Chem. Chem. Phys., vol. 12, no. 23, pp. 5947–5969, 2010.
- (12) P. Ehrenfreund and S. B. Charnley, “Organic molecules in the interstellar medium, comets, and meteorites: a voyage,” Annu. Rev. Astron. Astrophys, vol. 38, pp. 427–483, 2000.
- (13) P. H. Poole, F. Sciortino, U. Essmann, and H. E. Stanley, “Phase behaviour of metastable water,” Nature, vol. 360, no. 6402, pp. 324–328, 1992.
- (14) O. Mishima and H. E. Stanley, “Decompression-induced melting of ice IV and the liquid–liquid transition in water,” Nature, vol. 392, no. 6672, pp. 164–168, 1998.
- (15) J. S. Tse, D. D. Klug, C. A. Tulk, I. Swainson, E. C. Svensson, C.-K. Loong, V. Shpakov, V. R. Belosludov, R. V. Belosludov, and Y. Kawazoe, “The mechanisms for pressure-induced amorphization of ice Ih,” Nature, vol. 400, no. 6745, pp. 647–649, 1999.
- (16) H. Schober, M. M. Koza, A. Tölle, C. Masciovecchio, F. Sette, and F. Fujara, “Crystal-like high frequency phonons in the amorphous phases of solid water,” Physical Review Letters, vol. 85, no. 19, p. 4100, 2000.
- (17) P. G. Debenedetti, “Supercooled and glassy water,” Journal of Physics: Condensed Matter, vol. 15, no. 45, p. R1669, 2003.
- (18) B. Geil, M. M. Koza, F. Fujara, H. Schober, and F. Natali, “Absence of fast precursor dynamics of low-density amorphous ice around its hypothetical glass transition temperature,” Physical Chemistry Chemical Physics, vol. 6, no. 4, pp. 677–679, 2004.
- (19) D. T. Limmer and D. Chandler, “Theory of amorphous ices,” Proceedings of the National Academy of Sciences, vol. 111, no. 26, pp. 9413–9418, 2014.
- (20) J. J. Shephard, S. Ling, G. C. Sosso, A. Michaelides, B. Slater, and C. G. Salzmann, “Is high-density amorphous ice simply a “derailed” state along the ice I to ice IV pathway?,” The Journal of Physical Chemistry Letters, vol. 8, no. 7, pp. 1645–1650, 2017.
- (21) P. G. Debenedetti, F. Sciortino, and G. H. Zerze, “Second critical point in two realistic models of water,” Science, vol. 369, no. 6501, pp. 289–292, 2020.
- (22) C. A. Tulk, J. J. Molaison, A. R. Makhluf, C. E. Manning, and D. D. Klug, “Absence of amorphous forms when ice is compressed at low temperature,” Nature, vol. 569, no. 7757, pp. 542–545, 2019.
- (23) K. H. Kim, K. Amann-Winkel, N. Giovambattista, A. Späh, F. Perakis, H. Pathak, M. L. Parada, C. Yang, D. Mariedahl, T. Eklund, and others, “Experimental observation of the liquid-liquid transition in bulk supercooled water under pressure,” Science, vol. 370, no. 6519, pp. 978–982, 2020.
- (24) O. Mishima, L. D. Calvert, and E. Whalley, “‘Melting ice’I at 77 K and 10 kbar: A new method of making amorphous solids,” Nature, vol. 310, no. 5976, pp. 393–395, 1984.
- (25) J.-C. Li and P. Jenniskens, “Inelastic neutron scattering study of high density amorphous water ice,” Planetary and space Science, vol. 45, no. 4, pp. 469–473, 1997.
- (26) O. Andersson and H. Suga, “Thermal conductivity of amorphous ices,” Physical Review B, vol. 65, no. 14, p. 140201, 2002.
- (27) O. Andersson and A. Inaba, “Thermal conductivity of crystalline and amorphous ices and its implications on amorphization and glassy water,” Physical Chemistry Chemical Physics, vol. 7, no. 7, pp. 1441–1449, 2005.
- (28) O. Andersson, “Dielectric relaxation of low-density amorphous ice under pressure,” Physical review letters, vol. 98, no. 5, p. 57602, 2007.
- (29) J. S. Tse, D. M. Shaw, D. D. Klug, S. Patchkovskii, G. Vankó, G. Monaco, and M. Krisch, “X-ray Raman spectroscopic study of water in the condensed phases,” Physical review letters, vol. 100, no. 9, p. 95502, 2008.
- (30) M. S. Elsaesser, K. Winkel, E. Mayer, and T. Loerting, “Reversibility and isotope effect of the calorimetric glass→ liquid transition of low-density amorphous ice,” Physical Chemistry Chemical Physics, vol. 12, no. 3, pp. 708–712, 2010.
- (31) E. F. Burton and W. F. Oliver, “The crystal structure of ice at low temperatures,” Proceedings of the Royal Society of London. Series A-Mathematical and Physical Sciences, vol. 153, no. 878, pp. 166–172, 1935.
- (32) E. F. Burton and W. F. Oliver, “X-ray diffraction patterns of ice,” Nature, vol. 135, no. 3413, pp. 505–506, 1935.
- (33) P. Brüggeller and E. Mayer, “Complete vitrification in pure liquid water and dilute aqueous solutions,” Nature, vol. 288, no. 5791, pp. 569–571, 1980.
- (34) E. Mayer and P. Brüggeller, “Vitrification of pure liquid water by high pressure jet freezing,” Nature, vol. 298, no. 5876, pp. 715–718, 1982.
- (35) E. Mayer, “New method for vitrifying water and other liquids by rapid cooling of their aerosols,” Journal of applied physics, vol. 58, no. 2, pp. 663–667, 1985.
- (36) O. Mishima, L. D. Calvert, and E. Whalley, “An apparently first-order transition between two amorphous phases of ice induced by pressure,” Nature, vol. 314, no. 6006, pp. 76–78, 1985.
- (37) A. Kouchi and T. Kuroda, “Amorphization of cubic ice by ultraviolet irradiation,” Nature, vol. 344, no. 6262, pp. 134–135, 1990.
- (38) G. A. Baratta, G. Leto, F. Spinella, G. Strazzulla, and G. Foti, “The 3.1 microns feature in ion-irradiated water ice,” Astronomy and Astrophysics, vol. 252, pp. 421–424, 1991.
- (39) G. Leto and G. A. Baratta, “Ly-alpha photon induced amorphization of Ic water ice at 16 Kelvin-Effects and quantitative comparison with ion irradiation,” Astronomy & Astrophysics, vol. 397, no. 1, pp. 7–13, 2003.
- (40) D. D. Klug, Y. P. Handa, J. S. Tse, and E. Whalley, “Transformation of ice VIII to amorphous ice by “melting” at low temperature,” The Journal of Chemical Physics, vol. 90, pp. 2390–2392, 2 1989.
- (41) S. Klotz, J. M. Besson, G. Hamel, R. J. Nelmes, J. S. Loveday, and W. G. Marshall, “Metastable ice VII at low temperature and ambient pressure,” Nature, vol. 398, no. 6729, pp. 681–684, 1999.
- (42) K. Amann-Winkel, R. Böhmer, F. Fujara, C. Gainaru, B. Geil, and T. Loerting, “Colloquium: Water’s controversial glass transitions,” Reviews of Modern Physics, vol. 88, no. 1, p. 11002, 2016.
- (43) K. Winkel, D. T. Bowron, T. Loerting, E. Mayer, and J. L. Finney, “Relaxation effects in low density amorphous ice: Two distinct structural states observed by neutron diffraction,” The Journal of chemical physics, vol. 130, no. 20, p. 204502, 2009.
- (44) J. J. Shephard, S. Klotz, M. Vickers, and C. G. Salzmann, “A new structural relaxation pathway of low-density amorphous ice,” The Journal of Chemical Physics, vol. 144, no. 20, p. 204502, 2016.
- (45) D. Mariedahl, F. Perakis, A. Späh, H. Pathak, K. H. Kim, G. Camisasca, D. Schlesinger, C. Benmore, L. G. M. Pettersson, A. Nilsson, and others, “X-ray scattering and O–O pair-distribution functions of amorphous ices,” The Journal of Physical Chemistry B, vol. 122, no. 30, pp. 7616–7624, 2018.
- (46) F. Martelli, N. Giovambattista, S. Torquato, and R. Car, “Searching for crystal-ice domains in amorphous ices,” Physical Review Materials, vol. 2, no. 7, p. 75601, 2018.
- (47) F. Martelli, S. Torquato, N. Giovambattista, and R. Car, “Large-scale structure and hyperuniformity of amorphous ices,” Physical review letters, vol. 119, no. 13, p. 136002, 2017.
- (48) N. Giovambattista, C. A. Angell, F. Sciortino, and H. E. Stanley, “Glass-transition temperature of water: a simulation study,” Physical review letters, vol. 93, no. 4, p. 47801, 2004.
- (49) N. Giovambattista, H. E. Stanley, and F. Sciortino, “Cooling rate, heating rate, and aging effects in glassy water,” Physical Review E, vol. 69, no. 5, p. 50201, 2004.
- (50) N. Giovambattista, P. G. Debenedetti, F. Sciortino, and H. E. Stanley, “Structural order in glassy water,” Physical Review E, vol. 71, no. 6, p. 61505, 2005.
- (51) T. E. Gartner, S. Torquato, R. Car, and P. G. Debenedetti, “Manifestations of metastable criticality in the long-range structure of model water glasses,” Nature Communications, vol. 12, no. 1, p. 3398, 2021.
- (52) N. Giovambattista, H. E. Stanley, and F. Sciortino, “Potential-energy landscape study of the amorphous-amorphous transformation in H 2 O,” Physical review letters, vol. 91, no. 11, p. 115504, 2003.
- (53) M. Formanek, S. Torquato, R. Car, and F. Martelli, “Molecular Rotations, Multiscale Order, Hyperuniformity, and Signatures of Metastability during the Compression/Decompression Cycles of Amorphous Ices,” The Journal of Physical Chemistry B, 4 2023.
- (54) B. Guillot and Y. Guissani, “Polyamorphism in low temperature water: A simulation study,” The Journal of chemical physics, vol. 119, no. 22, pp. 11740–11752, 2003.
- (55) T. Li, D. Donadio, G. Russo, and G. Galli, “Homogeneous ice nucleation from supercooled water,” Physical Chemistry Chemical Physics, vol. 13, no. 44, pp. 19807–19813, 2011.
- (56) T. L. Malkin, B. J. Murray, A. V. Brukhno, J. Anwar, and C. G. Salzmann, “Structure of ice crystallized from supercooled water,” Proceedings of the National Academy of Sciences, vol. 109, pp. 1041–1045, 1 2012.
- (57) E. B. Moore and V. Molinero, “Is it cubic? Ice crystallization from deeply supercooled water,” Physical Chemistry Chemical Physics, vol. 13, no. 44, p. 20008, 2011.
- (58) A. Haji-Akbari and P. G. Debenedetti, “Direct calculation of ice homogeneous nucleation rate for a molecular model of water,” Proceedings of the National Academy of Sciences, vol. 112, pp. 10582–10588, 8 2015.
- (59) L. Lupi, A. Hudait, B. Peters, M. Grünwald, R. Gotchy Mullen, A. H. Nguyen, and V. Molinero, “Role of stacking disorder in ice nucleation,” Nature, vol. 551, no. 7679, pp. 218–222, 2017.
- (60) M. B. Davies, M. Fitzner, and A. Michaelides, “Routes to cubic ice through heterogeneous nucleation,” Proceedings of the National Academy of Sciences, vol. 118, p. e2025245118, 3 2021.
- (61) J. B. Pendry, “Reliability factors for LEED calculations,” Journal of Physics C: Solid State Physics, vol. 13, no. 5, pp. 937–944, 1980.
- (62) E. Zanazzi and F. Jona, “A reliability factor for surface structure determinations by low-energy electron diffraction,” Surface Science, vol. 62, no. 1, pp. 61–80, 1977.
- (63) J. L. F. Abascal and C. Vega, “A general purpose model for the condensed phases of water: TIP4P/2005,” The Journal of Chemical Physics, vol. 123, p. 234505, 12 2005.
- (64) M. Fitzner, G. C. Sosso, S. J. Cox, and A. Michaelides, “Ice is born in low-mobility regions of supercooled liquid water,” Proceedings of the National Academy of Sciences, vol. 116, pp. 2009–2014, 2 2019.
- (65) A. Rosu-Finsen, M. B. Davies, A. Amon, H. Wu, A. Sella, A. Michaelides, and C. G. Salzmann, “Medium-density amorphous ice,” Science, vol. 379, pp. 474–478, 2 2023.
- (66) I. Kohl, E. Mayer, and A. Hallbrucker, “The glassy water–cubic ice system: a comparative study by X-ray diffraction and differential scanning calorimetry,” Physical Chemistry Chemical Physics, vol. 2, no. 8, pp. 1579–1586, 2000.
- (67) M. Seidl, K. Amann-Winkel, P. H. Handle, G. Zifferer, and T. Loerting, “From parallel to single crystallization kinetics in high-density amorphous ice,” Physical Review B, vol. 88, no. 17, p. 174105, 2013.
- (68) D. Mariedahl, F. Perakis, A. Späh, H. Pathak, K. H. Kim, C. Benmore, A. Nilsson, and K. Amann-Winkel, “X-ray studies of the transformation from high-to low-density amorphous water,” Philosophical Transactions of the Royal Society A, vol. 377, no. 2146, p. 20180164, 2019.
- (69) T. H. G. Carr, J. J. Shephard, and C. G. Salzmann, “Spectroscopic Signature of Stacking Disorder in Ice I,” The Journal of Physical Chemistry Letters, vol. 5, pp. 2469–2473, 7 2014.
- (70) J. J. Shephard, J. S. O. Evans, and C. G. Salzmann, “Structural relaxation of low-density amorphous ice upon thermal annealing,” The Journal of Physical Chemistry Letters, vol. 4, no. 21, pp. 3672–3676, 2013.
- (71) J. Huebinger, H.-M. Han, O. Hofnagel, I. R. Vetter, P. I. H. Bastiaens, and M. Grabenbauer, “Direct Measurement of Water States in Cryopreserved Cells Reveals Tolerance toward Ice Crystallization.,” Biophysical journal, vol. 110, pp. 840–849, 2 2016.
- (72) K. A. Murray and M. I. Gibson, “Chemical approaches to cryopreservation,” Nature Reviews Chemistry, vol. 6, no. 8, pp. 579–593, 2022.
- (73) D. Cressey and E. Callaway, “Cryo-electron microscopy wins chemistry Nobel,” Nature, vol. 550, no. 7675, p. 167, 2017.
- (74) M. D. Ediger, “Perspective: Highly stable vapor-deposited glasses,” The Journal of chemical physics, vol. 147, no. 21, p. 210901, 2017.
- (75) S. F. Swallen, K. L. Kearns, M. K. Mapes, Y. S. Kim, R. J. McMahon, M. D. Ediger, T. Wu, L. Yu, and S. Satija, “Organic glasses with exceptional thermodynamic and kinetic stability,” Science, vol. 315, no. 5810, pp. 353–356, 2007.
- (76) W. Kauzmann, “The nature of the glassy state and the behavior of liquids at low temperatures.,” Chemical reviews, vol. 43, no. 2, pp. 219–256, 1948.
- (77) S. Plimpton, “Fast Parallel Algorithms for Short-Range Molecular Dynamics,” Journal of Computational Physics, vol. 117, no. 1, pp. 1–19, 1995.
- (78) V. Molinero and E. B. Moore, “Water Modeled As an Intermediate Element between Carbon and Silicon,” The Journal of Physical Chemistry B, vol. 113, pp. 4008–4016, 4 2009.
- (79) T. Li, D. Donadio, and G. Galli, “Ice nucleation at the nanoscale probes no man’s land of water,” Nature Communications, vol. 4, no. 1, p. 1887, 2013.
- (80) L. Lupi, A. Hudait, and V. Molinero, “Heterogeneous Nucleation of Ice on Carbon Surfaces,” Journal of the American Chemical Society, vol. 136, pp. 3156–3164, 2 2014.
- (81) G. C. Sosso, J. Chen, S. J. Cox, M. Fitzner, P. Pedevilla, A. Zen, and A. Michaelides, “Crystal Nucleation in Liquids: Open Questions and Future Challenges in Molecular Dynamics Simulations,” Chemical Reviews, vol. 116, no. 12, pp. 7078–7116, 2016.
- (82) M. Fitzner, G. C. Sosso, S. J. Cox, and A. Michaelides, “The Many Faces of Heterogeneous Ice Nucleation: Interplay between Surface Morphology and Hydrophobicity,” Journal of the American Chemical Society, vol. 137, no. 42, pp. 13658–13669, 2015.
- (83) M. B. Davies, M. Fitzner, and A. Michaelides, “Accurate prediction of ice nucleation from room temperature water,” Proceedings of the National Academy of Sciences, vol. 119, no. 31, p. e2205347119, 2022.
- (84) D. Quigley, “Communication: Thermodynamics of stacking disorder in ice nuclei,” The Journal of Chemical Physics, vol. 141, p. 121101, 9 2014.
- (85) A. Hudait, S. Qiu, L. Lupi, and V. Molinero, “Free energy contributions and structural characterization of stacking disordered ices,” Phys. Chem. Chem. Phys., vol. 18, no. 14, pp. 9544–9553, 2016.
- (86) T. Hondoh, T. Itoh, S. Amakai, K. Goto, and A. Higashi, “Formation and annihilation of stacking faults in pure ice,” The Journal of Physical Chemistry, vol. 87, pp. 4040–4044, 10 1983.
- (87) C. Vega and J. L. F. Abascal, “Relation between the melting temperature and the temperature of maximum density for the most common models of water,” The Journal of Chemical Physics, vol. 123, p. 144504, 10 2005.
- (88) H. Y. Playford, T. F. Whale, B. J. Murray, M. G. Tucker, and C. G. Salzmann, “Analysis of stacking disorder in ice I using pair distribution functions,” Journal of Applied Crystallography, vol. 51, no. 4, pp. 1211–1220, 2018.
- (89) S. Le Roux and P. Jund, “Ring statistics analysis of topological networks: New approach and application to amorphous GeS2 and SiO2 systems,” Computational Materials Science, vol. 49, no. 1, pp. 70–83, 2010.
- (90) W. Humphrey, A. Dalke, and K. Schulten, “VMD - Visual Molecular Dynamics,” Journal of Molecular Graphics, vol. 14, pp. 33–38, 1996.
- (91) J. Stone, An Efficient Library for Parallel Ray Tracing and Animation. PhD thesis, Computer Science Department, University of Missouri-Rolla, 4 1998.
- (92) J. R. Espinosa, C. Vega, C. Valeriani, and E. Sanz, “Seeding approach to crystal nucleation,” The Journal of Chemical Physics, vol. 144, p. 34501, 1 2016.
- (93) W. Lechner and C. Dellago, “Accurate determination of crystal structures based on averaged local bond order parameters,” The Journal of Chemical Physics, vol. 129, p. 114707, 9 2008.
- (94) M. Bonomi, D. Branduardi, G. Bussi, C. Camilloni, D. Provasi, P. Raiteri, D. Donadio, F. Marinelli, F. Pietrucci, R. A. Broglia, and M. Parrinello, “PLUMED: A portable plugin for free-energy calculations with molecular dynamics,” Computer Physics Communications, vol. 180, no. 10, pp. 1961–1972, 2009.
- (95) G. A. Tribello, M. Bonomi, D. Branduardi, C. Camilloni, and G. Bussi, “PLUMED 2: New feathers for an old bird,” Computer Physics Communications, vol. 185, no. 2, pp. 604–613, 2014.
- (96) C. G. Salzmann, B. J. Murray, and J. J. Shephard, “Extent of stacking disorder in diamond,” Diamond and Related Materials, vol. 59, pp. 69–72, 2015.
- (97) A. Rosu-Finsen, B. Chikani, and C. G. Salzmann, “Thermal Desorption of H2O-Ice: From Nanoscale Films to the Bulk,” 2022.