Evidence for multiple nucleosynthetic processes from carbon enhanced metal-poor stars in the Carina dwarf spheroidal galaxy
Abstract
Context. Carbon Enhanced Metal-Poor (CEMP) stars () are known to exist in large numbers at low metallicity in the Milky Way halo and are important tracers of early Galactic chemical evolution. However, very few such stars have been identified in the classical dwarf spheroidal (dSph) galaxies, and detailed abundances, including neutron-capture element abundances, have only been reported for 13 stars.
Aims. We aim to derive detailed abundances of six CEMP stars identified in the Carina dSph and compare the abundances to CEMP stars in other dSph galaxies and the Milky Way halo. This is the largest sample of CEMP stars in a dSph galaxy analysed to date.
Methods. 1D LTE elemental abundances are derived via equivalent width and spectral synthesis using high-resolution spectra of the six stars, obtained with the MIKE spectrograph at Las Campanas Observatory.
Results. Abundances or upper limits are derived for up to 27 elements from C to Os in the six stars. The analysis reveals one of the stars to be a CEMP-no star with very low neutron-capture element abundances. In contrast, the other five stars all show enhancements in neutron-capture elements in addition to their carbon enhancement, classifying them as CEMP- and - stars. The six stars have similar and iron-peak element abundances as other stars in Carina, except for the CEMP-no star, which shows enhancement in Na, Mg, and Si. We explore the absolute carbon abundances () of CEMP stars in dSph galaxies and find similar behaviour as is seen for Milky Way halo CEMP stars, but highlight that CEMP- stars primarily have very high values. We also compare the neutron-capture element abundances of the CEMP- stars in our sample to recent -process yields, which provide a good match to the derived abundances.
Key Words.:
Stars: abundances – Galaxies: dwarf – Galaxy: halo1 Introduction
It has long been recognized that a substantial fraction of the metal-poor stars in the Milky Way (MW) halo show moderate to large enhancements in carbon. These stars, which have , are labelled CEMP (Carbon Enhanced Metal-Poor) stars (Aoki et al., 2007; Beers & Christlieb, 2005). Placco et al. (2014) found that 20% of halo stars with are CEMP stars, with the fraction increasing with decreasing metallicity. Hence this abundance signature is pervasive in the early universe, and these stars are important tools for studying early Galactic chemical evolution. The CEMP stars are divided into sub-categories depending on their neutron-capture element abundances: CEMP-no stars, which show no enhancement in neutron-capture elements (), and the CEMP-,-, and - stars, which apart from the carbon also show enhancements in rapid neutron capture process (CEMP-: ), slow neutron-capture process elements (CEMP-: , ), or a combination of both (CEMP-: ) (Beers & Christlieb, 2005).
Radial-velocity monitoring of CEMP-no and CEMP- stars has revealed that the majority of CEMP- stars are part of binary systems while the CEMP-no stars are mostly found to be single stars (Lucatello et al., 2005; Starkenburg et al., 2014; Hansen et al., 2016a, b). These results support the proposed formation scenario for the CEMP- stars, namely that the peculiar abundance pattern of these stars is the result of mass transfer from a companion which has passed through the asymptotic giant branch (AGB) phase, thus producing C and -process elements. The non-binary result for the CEMP-no stars, however, points to these stars likely being second-generation stars with abundance patterns that are fingerprints of nucleosynthesis processes having taken place in the first generations of stars. Limited radial-velocity monitoring of CEMP- stars suggests that these, like the CEMP- stars, are also predominantly found in binary systems (Hansen et al., 2016b). The CEMP-no stars thus provide essential information on the nucleosynthesis of the first stars to form in the Universe, while the CEMP- and likely stars can be used to gain information about neutron-capture processes in the early Universe as well as mass transfer across binary systems.
Although the abundances of CEMP stars in the MW halo have been the focus of multiple studies (e.g., Aoki et al., 2007; Norris et al., 2013; Hansen et al., 2019), initial spectroscopic exploration of the dSph galaxies has not revealed CEMP stars at similar rates as has been found in the halo (Simon et al., 2015; Salvadori et al., 2015). This result is puzzling, as the MW halo is believed to be built via the accretion of surrounding smaller satellite systems (Searle & Zinn, 1978), a conclusion that is strongly supported by the numerous stellar streams discovered in the MW halo in recent large photometric surveys and, in particular, in the data from the Gaia satellite (e.g., Malhan & Ibata, 2018; Li et al., 2019). One possible explanation for the apparent rarity of CEMP stars in dwarf galaxies could be the difference in metallicity selection. Many of the halo studies have targeted stars with , whereas relatively few stars in dSphs with have been studied. Indeed a dedicated search at low metallicity has resulted in 22 CEMP stars being detected in Sculptor, uncovering a CEMP fraction at low metallicity similar to that of the MW halo (Chiti et al., 2018). However, similar dedicated searches for CEMP stars in other dSph galaxies are still lacking.
In addition, to the low number of CEMP stars currently discovered in dSph galaxies, even fewer have been subject to high-resolution abundance studies. Thus, very little is known about the CEMP population in our dwarf galaxy neighbours and whether it is similar to what we see in the MW halo. This paper presents the detailed abundance analysis of six CEMP stars in the Carina dSph galaxy. This is the largest sample of CEMP stars analysed in a dSph galaxy to date. In Section 2, we present the observational data for the six stars. The abundance analysis is outlined in Section 3, and the results presented in Section 4. Section 5 provides a discussion of our results, and a summary is given in Section 6
2 Observations
The sample stars were first observed as part of a larger search for metal-poor stars in Carina and other dSphs carried out with the IMACS spectrograph (Dressler et al., 2011) on the Magellan/Baade telescope at Las Campanas Observatory. In the first stage, low-resolution spectra of a total of candidate Carina stars were obtained with four overlapping slit masks, similar to the process described by Chiti et al. (2018) for Sculptor. Spectroscopic targets were selected from the Carina photometric catalogues available at the Canadian Astronomy Data Centre111https://www.canfar.net/storage/list/STETSON/homogeneous/Carina/ (Stetson, 2000, 2005), which are updated versions of the data originally published by Smecker-Hane et al. (1994). The IMACS spectra were taken through a narrow-band filter targeting the Ca K line to maximize the multiplexing advantage offered by the IMACS field of view. Stars with weak Ca K lines were selected for follow-up observations at medium spectral resolution with the MagE spectrograph (Marshall et al., 2008) on the Magellan/Clay telescope. The MagE spectra cover a wavelength range from 3100Å to 1 micron and were obtained during four observing runs in 2012 February, 2012 December, 2013 February, and 2013 September using the 07 or 10 slits (depending on the seeing) and binning yielding a resolving power of .
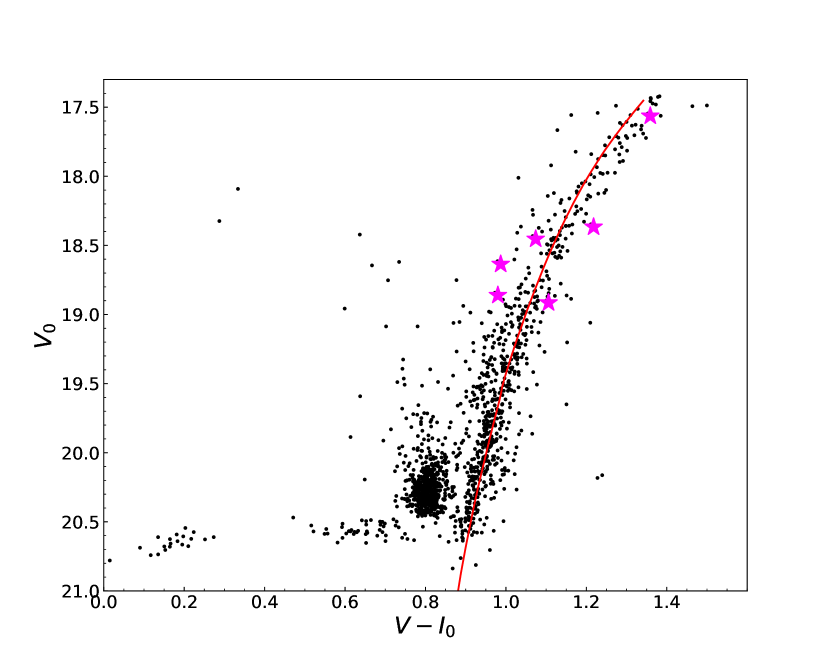
Out of a total of 25 Carina stars observed with MagE, eight exhibited strong C-H features, and we obtained high-resolution spectroscopy of six of those with the MIKE spectrograph (Bernstein et al., 2003) at the Magellan/Clay telescope over two runs in 2016 December and 2019 April. The spectra cover a wavelength range of 3350-5000 Å in the blue and 4900-9500 Å in the red and were obtained using a combination of the and slits and binning yielding typical resolving powers of 35,000 in the blue and 28,000 in the red for the slit and 28,000 in the blue and 22,000 in the red for the slit. The data were reduced with the CarPy MIKE pipeline (Kelson, 2003). Table 1 lists our targets (IDs from Fabrizio et al. (2016)), total exposure times, and signal-to-noise ratios (S/N) of the reduced and co-added spectra. In addition, Figure 1 shows a colour-magnitude diagram of Carina stars using photometry from Fabrizio et al. (2016) with pink star symbols marking the six stars analysed in this work. All photometry has been corrected for reddening using the dustmaps from Schlafly & Finkbeiner (2011). Overplotted in red is a Dartmouth isochrone (Dotter et al., 2008) with , age = 12 Gyr, and , shifted to the distance of Carina using the distance moduli (m-M)V=20.05 mag and (m-M)I=19.98 mag from Mighell (1997), describing the intermediate red giant branch population identified in Fabrizio et al. (2016).
| Stellar ID | RA | Dec | total exp time | SN @ 4500Å | SN @ 6500Å |
|---|---|---|---|---|---|
| 75044 | 06 41 08.58 | 50 47 50.1 | 3h | 20 | 50 |
| 86357 | 06 41 23.27 | 51 13 58.7 | 4h 20min | 10 | 25 |
| 130624 | 06 42 33.03 | 50 53 30.7 | 3h 20min | 15 | 25 |
| 125696 | 06 42 23.94 | 50 54 03.2 | 2h 10min | 12 | 22 |
| 40475 | 06 40 10.95 | 51 01 32.6 | 5h 15min | 15 | 30 |
| 97508 | 06 41 39.95 | 50 42 41.3 | 1h | 7 | 12 |
2.1 Radial Velocities
Heliocentric radial velocities of our target stars were determined via cross-correlation of the spectra. The MIKE spectra were cross-correlated against the standard star HD 122563 ( (Gaia Collaboration, 2018)) employing 20 to 50 orders in each spectrum depending on the S/N.
We also measured velocities from the MagE spectra from cross-correlation with the spectrum of 75044, which has the highest S/N, using 3 to 8 orders. The heliocentric radial velocity for 75044 was determined to be 225.71.9 km s-1 using the IRAF task rvidlines identifying lines of Na (5889,5895), Mg (5183), and Ba (4934, 5853, 6141). Our final radial velocities are listed in Table 2, along with values from the literature. For the MIKE spectra, we list the standard deviation of radial velocities from the individual orders as the error, while for the MagE spectra, we list the 1.9 km s-1 velocity error on our template star and the standard deviation of radial velocities from the individual orders added in quadrature.
| HJD | Vhelio(err) | ref | HJD | Vhelio(err) | ref |
| [km s-1] | [km s-1] | ||||
| 75044 | 86357 | ||||
| 2454122.587 | 222.2(5.7) | 1 | … | 235.6(11.6) | 3 |
| 2456280.828 | 225.7(1.9) | 2 | 2456280.814 | 225.1(2.1) | 2 |
| 2457744.633 | 225.5(1.1) | 2 | 2457744.700 | 227.6(1.3) | 2 |
| 2458599.518 | 225.5(1.0) | 2 | 2457751.599 | 229.5(1.2) | 2 |
| 130624 | 125696 | ||||
| … | 210.2(1.6) | 3 | … | 212.3(8.1) | 3 |
| 2454123.555 | 208.2(6.6) | 1 | 2454122.587 | 214.3(8.1) | 1 |
| 2455982.683 | 211.7(3.8) | 2 | 2456332.566 | 221.8(2.8) | 2 |
| 2457751.698 | 218.5(0.7) | 2 | 2457751.806 | 228.0(0.8) | 2 |
| 2457752.842 | 219.8(1.0) | 2 | |||
| 40475 | 97508 | ||||
| … | 238.4(10.3) | 3 | … | 231.8(14.2) | 3 |
| … | 231.9(1.6) | 4 | 2456331.834 | 229.5(2.2) | 2 |
| 2456329.743 | 233.6(2.0) | 2 | 2457752.803 | 232.3(1.0) | 2 |
| 2457752.656 | 236.2(0.7) | 2 | |||
Inspection of Table 2 reveals that two of the stars, 130624 and 125696, exhibit clear radial-velocity variations consistent with being part of binary systems. We used a test of the probability that each star’s velocity sequence from Table 2 is consistent with a constant velocity to show that for both stars. For 86357 and 40475, the measurements also suggest binary motion, but the uncertainties on some of the measurements are too large to reach firm conclusions. The probabilities for these stars are and , respectively, so more velocity measurements are needed. Finally, our measurements for 97508 () and 75044 () agree with literature values, suggesting no binary motion. However, for 75044 Susmitha et al. (2017) measured radial velocities differing by 30 km s-1 for two epochs for this star222Exact radial velocities are not listed in Susmitha et al. (2017).. Thus this star is also likely a binary.
3 Stellar parameter determination and abundance analysis
Effective temperatures () for the stars have been determined from , , , , and colours using the empirical relations from Casagrande et al. (2010). and magnitudes are from Fabrizio et al. (2016), and 2MASS magnitudes were taken from Cutri et al. (2003). All magnitudes were corrected for reddening using Schlafly & Finkbeiner (2011). The available photometry varies for the six stars. For 75044, 86357, and 130624, two or more colours, including the index, were used, and the final temperature was computed as an average of the individual temperatures. On the other hand, for 125696, 40475, and 97508, only the index could be used. A summary of the photometry and temperature determinations for all stars is listed in Table 9 in the Appendix. magnitudes are also available for the stars (Fabrizio et al., 2016). However, these are known to be affected by the strong CH bands in CEMP stars, so we disregard the colours when determining the temperatures of our stars. Following the determination of , surface gravity (), metallicity (), and microturbulence () were determined spectroscopically from equivalent width (EW) measurements of Fe i and Fe ii lines. Atomic data and individual abundances for the Fe lines used in the analysis are listed in Table B. The final stellar parameters are presented in Table 3. For the one star where we have temperature estimates from multiple colours (see Table 9 in the Appendix), we find a standard deviation of 65 K. However, since, for the majority of stars, fewer colours are used to determine the temperature, we estimate uncertainties on our stellar parameters of 150 K on Teff, 0.3 dex on and 0.2 km s-1 on . For the metallicity, the standard deviation of the Fe ii line abundances is listed in Table 3. The stars 125696, 40475, and 97508 were also analysed by Koch et al. (2006) who finds , , and respectively, which agrees within uncertainties with the values derived in this work 333Note that no radial velocities are presented in Koch et al. (2006), however, the same data are used to determine the velocities presented in Fabrizio et al. (2016), which are included in Table 2.
| Stellar ID | ||||
|---|---|---|---|---|
| (150 K) | (0.3 dex) | (0.2 km s-1) | ||
| 75044 | 4140 | 0.56 | 2.630.11 | 2.68 |
| 86357 | 4329 | 0.97 | 2.870.28 | 2.76 |
| 130624 | 4622 | 0.03 | 2.020.21 | 2.14 |
| 125696 | 4868 | 1.37 | 1.740.22 | 2.04 |
| 40475 | 4546 | 1.16 | 2.730.16 | 2.38 |
| 97508 | 4866 | 1.76 | 2.060.21 | 2.36 |
Abundances for the six stars in Carina have been derived via EW analysis as well as spectral synthesis using the analysis code SMHR 444https://github.com/andycasey/smhr to run the 2017 version of the 1D radiative transfer code MOOG 555https://github.com/alexji/moog17scat(Sneden, 1973; Sobeck et al., 2011), assuming local thermodynamical equilibrium. -enhanced () ATLAS9 model atmospheres (Castelli & Kurucz, 2003) and line lists generated from linemake 666https://github.com/vmplacco/linemake (Placco et al., 2021) updated with C-H lines from Masseron et al. (2014)777https://nextcloud.lupm.in2p3.fr/s/r8pXijD39YLzw5T?path=%2FCH were used as input, and Solar abundances were taken from Asplund et al. (2009). The synthesis also includes isotopic and hyperfine structure broadening, where applicable, employing the -process isotope ratios from Sneden et al. (2008). Table B in the appendix lists the atomic data for the lines used in the analysis, along with the measured EW and abundance of each line. To determine our final abundances and associated uncertainties, we follow the procedure outlined in Ji et al. (2020a), which computes a mean abundance weighted by the S/N of the individual lines analysed, and the uncertainty calculation includes both systematic and statistical uncertainties as well as co-variance terms between stellar parameters.
4 Results
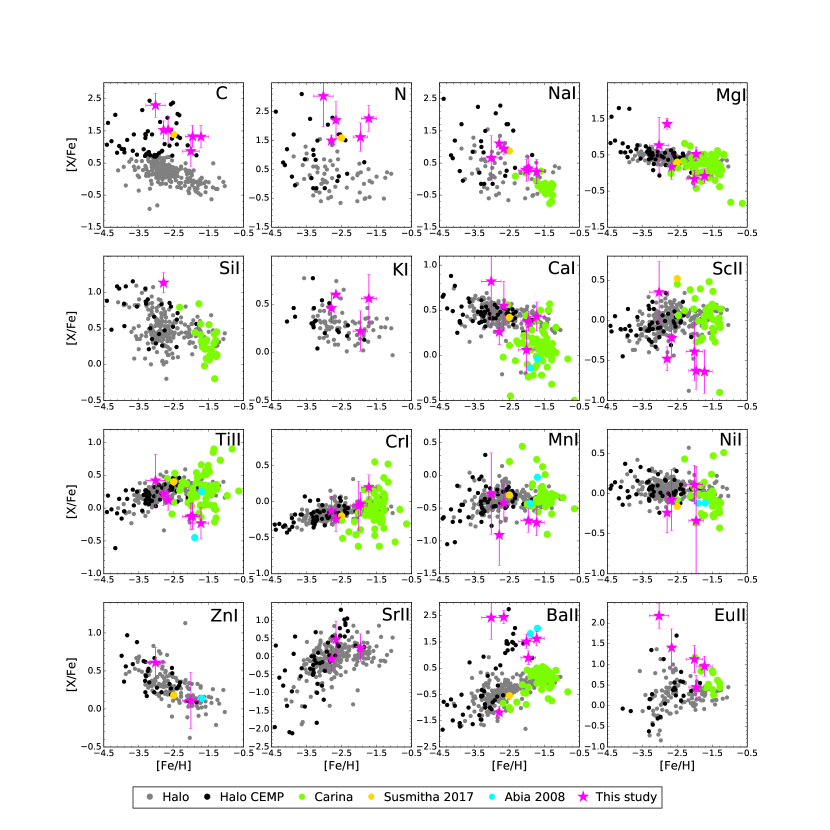
We derive abundances for up to 14 light elements from C to Zn and 13 neutron-capture elements for our six Carina stars. Final abundances are listed in Tables 4 and 4, while Table 4 lists the abundance uncertainties due to stellar parameter uncertainties () and the systematic uncertainties () for each element in each star. is based on the line to line scatter in the abundances and is included to account for systematic uncertainties in, for example, the atomic data or continuum placement. Abundances for selected elements are plotted in Figure 2 along with abundances reported in the literature for carbon-normal and CEMP stars in Carina and the MW halo. The abundances for Carina stars (green filled circles) are mainly from Norris et al. (2017), which includes a re-analysis of the data from Shetrone et al. (2003), Venn et al. (2012), and Lemasle et al. (2012). We have also included abundances for additional stars analysed by Koch et al. (2008) and Fabrizio et al. (2015). For the Carina CEMP stars, the data is taken from Abia et al. (2008) (cyan circles) and Susmitha et al. (2017) (yellow circles), while the MW halo carbon-normal (small grey circles) and CEMP (small black circles) star abundances are from Roederer et al. (2014). We note that Roederer et al. (2014) used spectroscopically derived effective temperatures leading to slightly lower metallicities being derived for the stars compared to photometric temperatures as used in this work. However, Roederer et al. (2014) provides homogeneous abundances for a large number of elements, including C, N, K, Zn, and Eu, which are interesting for comparison to the stars analysed here.
| 75044 | 86357 | 130624 | ||||||||||||||||
| El. | N | (X) | N | (X) | N | (X) | ||||||||||||
| [dex] | [dex] | [dex] | [dex] | [dex] | [dex] | |||||||||||||
| C-H | 1 | 6.89 | 1.54 | 0.43 | 1.12 | 0.42 | … | … | … | … | … | 1 | 7.59 | 0.84 | 0.35 | 1.12 | 0.34 | |
| C2 | 1 | 7.05 | 1.39 | 0.34 | 1.27 | 0.34 | 1 | 7.46 | 0.97 | 0.49 | 2.05 | 0.37 | 1 | 7.39 | 1.04 | 0.17 | 0.92 | 0.16 |
| Ccorr | 7.31 | 1.12 | 0.43 | 1.54 | 0.42 | 7.71 | 0.72 | 0.49 | 2.30 | 0.37 | 1 | 7.80 | 0.63 | 0.35 | 1.33 | 0.34 | ||
| C-N | 1 | 7.39 | 0.44 | 0.63 | 2.21 | 0.63 | 1 | 7.85 | 0.02 | 1.30 | 3.04 | 1.06 | 1 | 7.49 | 0.34 | 0.50 | 1.62 | 0.49 |
| O i | … | … | … | … | … | … | … | … | … | … | … | … | … | … | … | |||
| Na i | 3 | 4.53 | 1.71 | 0.16 | 0.95 | 0.18 | 2 | 3.89 | 2.36 | 0.77 | 0.66 | 0.69 | 2 | 4.62 | 1.63 | 0.39 | 0.33 | 0.37 |
| Mg i | 2 | 5.12 | 2.49 | 0.39 | 0.17 | 0.39 | 2 | 5.36 | 2.25 | 0.88 | 0.77 | 0.70 | 3 | 6.18 | 1.43 | 0.19 | 0.53 | 0.19 |
| Si i | … | … | … | … | … | … | … | … | … | … | … | … | … | … | … | |||
| K i | 1 | 2.98 | 2.05 | 0.32 | 0.60 | 0.30 | 2 | 4.18 | 0.86 | 0.72 | 2.16 | 0.74 | 1 | 3.29 | 1.74 | 0.21 | 0.22 | 0.21 |
| Ca i | 3 | 4.23 | 2.11 | 0.28 | 0.55 | 0.27 | 5 | 4.15 | 2.20 | 0.24 | 0.82 | 0.51 | 8 | 4.77 | 1.58 | 0.09 | 0.38 | 0.11 |
| Sc ii | 3 | 0.29 | 2.86 | 0.18 | 0.22 | 0.23 | 2 | 0.63 | 2.53 | 0.36 | 0.35 | 0.38 | 3 | 0.50 | 2.65 | 0.22 | 0.63 | 0.23 |
| Ti i | 2 | 2.15 | 2.80 | 0.36 | 0.15 | 0.35 | 2 | 1.86 | 3.10 | 0.35 | 0.08 | 0.53 | 6 | 3.00 | 1.95 | 0.14 | 0.01 | 0.15 |
| Ti ii | 8 | 2.44 | 2.52 | 0.13 | 0.12 | 0.15 | 6 | 2.50 | 2.45 | 0.30 | 0.42 | 0.40 | 10 | 2.81 | 2.14 | 0.11 | 0.12 | 0.20 |
| Cr i | 5 | 2.74 | 2.90 | 0.16 | 0.24 | 0.18 | … | … | … | … | … | 8 | 3.65 | 1.99 | 0.16 | 0.03 | 0.16 | |
| Mn i | 2 | 2.36 | 3.07 | 0.29 | 0.42 | 0.28 | 2 | 2.13 | 3.30 | 0.67 | 0.28 | 0.62 | 3 | 2.78 | 2.65 | 0.17 | 0.69 | 0.18 |
| Fe i | 23 | 4.85 | 2.66 | 0.11 | 0.00 | 0.00 | 12 | 4.48 | 3.02 | 0.47 | 0.00 | 0.00 | 46 | 5.54 | 1.96 | 0.08 | 0.00 | 0.00 |
| Fe ii | 3 | 4.87 | 2.63 | 0.11 | 0.00 | 0.00 | 3 | 4.64 | 2.87 | 0.28 | 0.00 | 0.00 | 5 | 5.48 | 2.02 | 0.21 | 0.00 | 0.00 |
| Co i | … | … | … | … | … | … | … | … | … | … | 5 | 4.23 | 1.99 | 0.14 | 0.04 | 0.15 | ||
| Ni i | 3 | 3.49 | 2.73 | 0.38 | 0.08 | 0.38 | … | … | … | … | … | 2 | 2.69 | 2.30 | 0.69 | 0.34 | 0.68 | |
| Zn i | … | … | … | … | … | 1 | 2.41 | 2.15 | 0.18 | 0.86 | 0.46 | … | … | … | … | … | ||
| Sr ii | 1 | 0.71 | 2.16 | 0.52 | 0.48 | 0.51 | … | … | … | … | … | 2 | 1.10 | 1.77 | 0.34 | 0.25 | 0.33 | |
| Y ii | 10 | 0.77 | 1.44 | 0.09 | 1.19 | 0.12 | 3 | 0.06 | 2.15 | 0.38 | 0.72 | 0.39 | 11 | 0.16 | 2.37 | 0.19 | 0.35 | 0.18 |
| Zr ii | 5 | 1.98 | 0.60 | 0.15 | 2.03 | 0.15 | … | … | … | … | … | 4 | 0.78 | 1.80 | 0.23 | 0.22 | 0.23 | |
| Ba ii | 3 | 1.99 | 0.19 | 0.27 | 2.45 | 0.26 | 3 | 1.75 | 0.43 | 0.87 | 2.43 | 0.83 | 4 | 1.05 | 1.13 | 0.35 | 0.90 | 0.26 |
| La ii | 10 | 0.48 | 0.62 | 0.06 | 2.01 | 0.11 | 14 | 0.53 | 0.57 | 0.16 | 2.29 | 0.30 | 15 | 0.20 | 1.30 | 0.08 | 0.72 | 0.20 |
| Ce ii | 13 | 0.92 | 0.66 | 0.09 | 1.98 | 0.13 | 6 | 0.53 | 1.05 | 0.32 | 1.82 | 0.41 | 15 | 0.37 | 1.21 | 0.10 | 0.82 | 0.20 |
| Pr ii | 5 | 0.00 | 0.72 | 0.15 | 1.92 | 0.14 | 3 | 0.18 | 0.55 | 0.40 | 2.32 | 0.44 | 5 | 0.50 | 1.22 | 0.20 | 0.80 | 0.21 |
| Nd ii | 16 | 0.89 | 0.53 | 0.10 | 2.11 | 0.13 | 13 | 0.65 | 0.77 | 0.15 | 2.09 | 0.28 | 13 | 0.27 | 1.15 | 0.16 | 0.87 | 0.18 |
| Sm ii | 9 | 0.14 | 0.82 | 0.10 | 1.81 | 0.14 | 6 | 0.19 | 1.15 | 0.17 | 1.72 | 0.30 | 10 | 0.48 | 1.44 | 0.13 | 0.58 | 0.18 |
| Eu ii | 2 | 0.70 | 1.22 | 0.46 | 1.41 | 0.45 | 4 | 0.16 | 0.68 | 0.18 | 2.18 | 0.30 | 2 | 1.06 | 1.58 | 0.26 | 0.45 | 0.29 |
| Gd ii | 4 | 0.34 | 0.73 | 0.11 | 1.90 | 0.14 | 3 | 0.29 | 0.78 | 0.71 | 2.08 | 0.70 | 2 | 0.05 | 1.02 | 0.29 | 1.00 | 0.32 |
| Tb ii | … | … | … | … | … | … | … | … | … | … | … | … | … | … | … | |||
| Dy ii | 2 | 0.37 | 0.73 | 0.69 | 1.90 | 0.65 | … | … | … | … | … | 1 | 0.41 | 1.51 | 0.37 | 0.51 | 0.31 | |
| Lu ii | 1 | 0.61 | 0.71 | 0.28 | 1.92 | 0.24 | 1 | 0.01 | 0.11 | 0.42 | 2.75 | 0.35 | … | … | … | … | … | |
| Os i | 1 | 0.06 | 1.34 | 0.33 | 1.32 | 0.33 | … | … | … | … | … | … | … | … | … | … | ||
| 125696 | 40475 | 97508 | ||||||||||||||||
| El. | N | (X) | N | (X) | N | (X) | ||||||||||||
| [dex] | [dex] | [dex] | [dex] | [dex] | [dex] | |||||||||||||
| C-H | 1 | 7.91 | 0.52 | 0.38 | 1.20 | 0.35 | 1 | 6.75 | 1.68 | 0.30 | 1.11 | 0.28 | 1 | 7.12 | 1.31 | 0.57 | 0.70 | 0.47 |
| C2 | 1 | 8.20 | 0.23 | 0.19 | 1.49 | 0.18 | 1 | 7.14 | 1.29 | 0.21 | 1.50 | 0.19 | … | … | … | … | … | |
| Ccorr | 8.03 | 0.40 | 0.38 | 1.32 | 0.35 | 7.17 | 1.26 | 0.30 | 1.53 | 0.28 | 7.29 | 1.14 | 0.57 | 0.87 | 0.47 | |||
| C-N | 1 | 8.38 | 0.55 | 0.57 | 2.27 | 0.54 | 1 | 6.96 | 0.87 | 0.49 | 1.92 | 0.47 | … | … | … | … | … | |
| O i | … | … | … | … | … | 4 | 8.02 | 0.67 | 0.11 | 2.12 | 0.15 | … | … | … | … | … | ||
| Na i | 2 | 4.75 | 1.49 | 0.41 | 0.23 | 0.38 | 4 | 4.56 | 1.68 | 0.18 | 1.11 | 0.18 | 2 | 4.50 | 1.74 | 0.42 | 0.27 | 0.34 |
| Mg i | 4 | 5.80 | 1.80 | 0.18 | 0.08 | 0.20 | 5 | 6.17 | 1.43 | 0.15 | 1.36 | 0.15 | 3 | 5.43 | 2.17 | 0.24 | 0.16 | 0.23 |
| Si i | … | … | … | … | … | 2 | 5.85 | 1.66 | 0.13 | 1.13 | 0.14 | … | … | … | … | … | ||
| K i | 1 | 3.87 | 1.16 | 0.25 | 0.56 | 0.25 | 1 | 2.70 | 2.33 | 0.16 | 0.46 | 0.16 | … | … | … | … | … | |
| Ca i | 12 | 5.05 | 1.29 | 0.12 | 0.43 | 0.16 | 8 | 3.82 | 2.53 | 0.14 | 0.26 | 0.14 | 6 | 4.39 | 1.95 | 0.23 | 0.06 | 0.26 |
| Sc ii | 1 | 0.76 | 2.39 | 0.24 | 0.64 | 0.27 | 4 | 0.05 | 3.20 | 0.15 | 0.48 | 0.15 | 3 | 0.70 | 2.45 | 0.34 | 0.39 | 0.36 |
| Ti i | 5 | 3.31 | 1.64 | 0.16 | 0.08 | 0.20 | 4 | 2.42 | 2.53 | 0.27 | 0.26 | 0.25 | … | … | … | … | … | |
| Ti ii | 6 | 2.98 | 1.97 | 0.12 | 0.23 | 0.24 | 7 | 2.45 | 2.50 | 0.26 | 0.22 | 0.18 | 9 | 2.76 | 2.20 | 0.25 | 0.13 | 0.20 |
| Cr i | 6 | 4.12 | 1.52 | 0.12 | 0.20 | 0.17 | 4 | 2.72 | 2.92 | 0.22 | 0.13 | 0.20 | 4 | 3.57 | 2.07 | 0.33 | 0.06 | 0.34 |
| Mn i | 4 | 2.99 | 2.44 | 0.18 | 0.72 | 0.20 | 3 | 1.74 | 3.69 | 0.48 | 0.91 | 0.46 | … | … | … | … | … | |
| Fe i | 30 | 5.78 | 1.72 | 0.12 | 0.00 | 0.00 | 52 | 4.71 | 2.79 | 0.09 | 0.00 | 0.00 | 24 | 5.49 | 2.01 | 0.24 | 0.00 | 0.00 |
| Fe ii | 2 | 5.76 | 1.74 | 0.24 | 0.00 | 0.00 | 5 | 4.77 | 2.73 | 0.16 | 0.00 | 0.00 | 5 | 5.44 | 2.06 | 0.21 | 0.00 | 0.00 |
| Co i | … | … | … | … | … | … | … | … | … | … | … | … | … | … | … | |||
| Ni i | … | … | … | … | … | 2 | 3.19 | 3.03 | 0.26 | 0.24 | 0.25 | 3 | 4.33 | 1.89 | 0.26 | 0.11 | 0.24 | |
| Zn i | … | … | … | … | … | … | … | … | … | … | 1 | 2.67 | 1.89 | 0.33 | 0.11 | 0.38 | ||
| Sr ii | … | … | … | … | … | 1 | 0.08 | 2.79 | 0.32 | 0.06 | 0.32 | … | … | … | … | … | ||
| Y ii | 6 | 0.50 | 1.71 | 0.15 | 0.03 | 0.24 | 2 | 0.74 | 2.95 | 0.27 | 0.22 | 0.23 | 4 | 0.70 | 1.51 | 0.32 | 0.55 | 0.29 |
| Zr ii | 4 | 1.58 | 1.00 | 0.19 | 0.75 | 0.23 | … | … | … | … | … | 3 | 0.96 | 1.62 | 0.23 | 0.44 | 0.25 | |
| Ba ii | 4 | 2.07 | 0.11 | 0.26 | 1.63 | 0.28 | 4 | 1.73 | 3.91 | 0.21 | 1.18 | 0.15 | 5 | 1.64 | 0.55 | 0.36 | 1.52 | 0.26 |
| La ii | 14 | 0.60 | 0.50 | 0.10 | 1.24 | 0.25 | … | … | … | … | … | 8 | 0.70 | 0.40 | 0.25 | 1.66 | 0.23 | |
| Ce ii | 8 | 0.98 | 0.60 | 0.10 | 1.15 | 0.26 | … | … | … | … | … | 9 | 0.78 | 0.80 | 0.15 | 1.27 | 0.20 | |
| Pr ii | 5 | 0.36 | 0.36 | 0.17 | 1.39 | 0.28 | … | … | … | … | … | 3 | 0.18 | 0.54 | 0.33 | 1.52 | 0.25 | |
| Nd ii | 20 | 0.85 | 0.57 | 0.13 | 1.18 | 0.24 | … | … | … | … | … | 8 | 0.83 | 0.59 | 0.21 | 1.47 | 0.21 | |
| Sm ii | 9 | 0.45 | 0.51 | 0.13 | 1.24 | 0.25 | … | … | … | … | … | 7 | 0.29 | 0.67 | 0.29 | 1.39 | 0.22 | |
| Eu ii | 3 | 0.26 | 0.78 | 0.12 | 0.96 | 0.24 | … | … | … | … | … | 2 | 0.41 | 0.93 | 0.38 | 1.13 | 0.33 | |
| Gd ii | 1 | 0.74 | 0.33 | 0.29 | 1.41 | 0.40 | … | … | … | … | … | … | … | … | … | … | ||
| Tb ii | 1 | 0.43 | 0.73 | 0.22 | 1.02 | 0.26 | … | … | … | … | … | … | … | … | … | … | ||
| Dy ii | 1 | 0.57 | 0.54 | 0.43 | 1.21 | 0.37 | … | … | … | … | … | 1 | 0.86 | 0.24 | 0.41 | 1.82 | 0.40 | |
| Lu ii | … | … | … | … | … | … | … | … | … | … | … | … | … | … | … | |||
| Os i | … | … | … | … | … | … | … | … | … | … | 1 | 1.69 | 0.29 | 0.60 | 2.30 | 0.57 | ||
| Stellar ID | El | |||||
|---|---|---|---|---|---|---|
| [dex] | [dex] | [dex] | [dex] | [dex] | ||
| 75044 | C-H | 0.45 | 0.09 | 0.09 | 0.10 | 0.00 |
| 75044 | C2 | 0.36 | 0.00 | 0.00 | 0.06 | 0.00 |
| 75044 | C-N | 0.62 | 0.04 | 0.02 | 0.22 | 0.00 |
| 75044 | Na i | 0.15 | 0.06 | 0.00 | 0.02 | 0.08 |
| 75044 | Mg i | 0.31 | 0.13 | 0.07 | 0.01 | 0.42 |
| 75044 | K i | 0.11 | 0.04 | 0.08 | 0.18 | 0.00 |
| 75044 | Ca i | 0.04 | 0.00 | 0.11 | 0.20 | 0.08 |
| 75044 | Sc ii | 0.13 | 0.06 | 0.06 | 0.09 | 0.10 |
| 75044 | Ti i | 0.37 | 0.06 | 0.01 | 0.05 | 0.10 |
| 75044 | Ti ii | 0.08 | 0.05 | 0.05 | 0.00 | 0.26 |
| 75044 | Cr i | 0.02 | 0.03 | 0.02 | 0.04 | 0.13 |
| 75044 | Mn i | 0.29 | 0.06 | 0.03 | 0.04 | 0.10 |
| 75044 | Fe i | 0.07 | 0.06 | 0.01 | 0.02 | 0.12 |
| 75044 | Fe ii | 0.11 | 0.11 | 0.06 | 0.05 | 0.01 |
| 75044 | Ni i | 0.24 | 0.02 | 0.03 | 0.00 | 0.36 |
| 75044 | Sr ii | 0.03 | 0.04 | 0.14 | 0.02 | 0.00 |
| 75044 | Y ii | 0.06 | 0.09 | 0.00 | 0.01 | 0.03 |
| 75044 | Zr ii | 0.02 | 0.05 | 0.07 | 0.02 | 0.18 |
| 75044 | Ba ii | 0.17 | 0.08 | 0.12 | 0.03 | 0.16 |
| 75044 | La ii | 0.09 | 0.10 | 0.01 | 0.02 | 0.00 |
| 75044 | Ce ii | 0.07 | 0.06 | 0.03 | 0.01 | 0.15 |
| 75044 | Pr ii | 0.02 | 0.09 | 0.02 | 0.04 | 0.16 |
| 75044 | Nd ii | 0.06 | 0.08 | 0.02 | 0.01 | 0.13 |
| 75044 | Sm ii | 0.08 | 0.06 | 0.04 | 0.02 | 0.18 |
| 75044 | Eu ii | 0.08 | 0.07 | 0.02 | 0.07 | 0.43 |
| 75044 | Gd ii | 0.09 | 0.11 | 0.00 | 0.00 | 0.07 |
| 75044 | Dy ii | 0.42 | 0.03 | 0.12 | 0.21 | 0.36 |
| 75044 | Lu ii | 0.21 | 0.08 | 0.00 | 0.12 | 0.00 |
| 75044 | Os i | 0.10 | 0.07 | 0.00 | 0.09 | 0.00 |
4.1 CNO Abundances
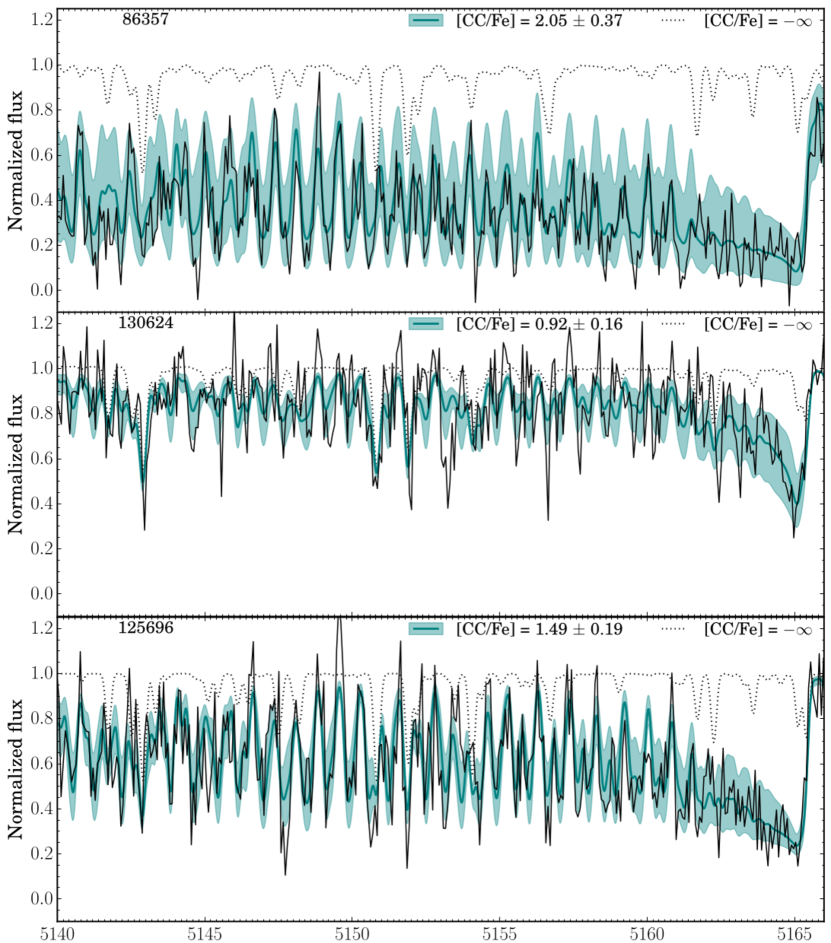
Carbon abundances are derived via synthesis of the C-H -band at 4300 Å and the C2 swan band at 5160 Å, when present. In 86357, the C-H band is saturated, and only the C2 band could be used. Generally, the C abundances are in good agreement between the two bands for the stars when both bands are present and not saturated. Synthesis of the C2 band for three of the sample stars with varying C abundances is shown in Figure 3. An oxygen abundance could only be derived for one of the stars (40475: ) from the 6300 Å feature. 40475 also exhibit large enhancements in other -elements like Mg and Si, while this is not the case for the other stars in the sample. Thus when deriving C abundances for the rest of the stars, a standard oxygen enhancement for metal-poor stars of was assumed. All of the stars are significantly enhanced in C and, as such, can be labelled CEMP stars. In Table 4 and 4, we also list the C abundance corrected for stellar evolutionary effects, Ccorr and these values are plotted in Figure 2. The corrections were made following Placco et al. (2014) and using the C-H abundances for all stars, except for 86357, where the C2 abundance was used.
We also investigated the 12C/13C ratio of the stars by fitting 13C and 12C lines in a region around 4230 Å. We find that using a 12C/13C ratio of 4 gives a good fit to the spectral regions in all of the stars. This ratio is consistent with the equilibrium value for the CNO cycle, suggesting that the material in all of our stars has been well mixed, as is expected for cool red giants. This would equally apply if any of our binary stars experienced mass transfer, as the companion star would also have had a well-mixed outer layer. After determining the C abundances of the stars, N abundances were derived from the C-N band at 4215 Å for five of the stars (excluding 97508, where the S/N was too low). All five stars exhibit an enhancement in N, which is often also found for halo CEMP stars (Hansen et al., 2015).
4.2 Light and Iron Peak Element Abundances
We have derived abundances for Na, Mg, Ca, Sc, Ti, Cr, Mn, and Ni for most of our stars, while a Co abundance could only be derived for one star (130624) and Zn for two stars (97508 and 86357). Our analysis resulted in the first abundances for K derived from any stars in Carina, which displays a spread similar to most other light element abundances in Carina. We were not able to derive abundances for Al or V in any of our stars as the lines were too heavily blended.
4.3 Neutron-Capture Element Abundances
In addition to the C enrichment, all but one of the stars (40475) also display large enhancements in neutron-capture elements. In Table 7, we list the and ratios and the corresponding CEMP classification of the stars following Beers & Christlieb (2005). According to this classification, we find one CEMP-no star, three CEMP- stars, and two CEMP- stars. For the CEMP-no star, abundances of Sr, Y, and Ba are derived, while for the CEMP- and CEMP- stars, we derive abundance for the neutron-capture elements Y, Zr, Ba, La, Ce, Pr, Nd, Sm, Eu, Gd, and Dy and in some stars, we are also able to derive abundances for Sr, Tb, Lu, and Os.
| Stellar ID | CEMP type | ||
|---|---|---|---|
| 75044 | 2.45 | 1.04 | CEMP- |
| 86357 | 2.43 | 0.61 | CEMP- |
| 130624 | 0.90 | 0.45 | CEMP- |
| 125696 | 1.63 | 0.67 | CEMP- |
| 40475 | 1.18 | … | CEMP-no |
| 97508 | 1.52 | 0.39 | CEMP- |
5 Discussion
5.1 Comparison to Abundances of Stars in Carina.
As shown in Figure 2, the and iron-peak element abundances we derive for our six sample stars are similar to those of the CEMP and other Carina stars from the literature. The one outlier is the CEMP-no star in our sample, 40475, which has high Mg and Si abundances and will be discussed below. Abundances for Sr, Ba, and Eu have been derived for a number of stars in Carina. We, therefore, include panels for these elements in Figure 2. From this, we see that the Ba abundance of the CEMP-no star 40475 is in good agreement with Ba abundances for other Carina stars at similar metallicity. Thus, from this sample, the behaviour of dSph galaxy CEMP stars follows that of the MW halo CEMP stars, with and iron-peak element abundances of CEMP- and stars being similar to other metal-poor stars (Norris et al., 2013; Hansen et al., 2015), while some CEMP-no stars also have distinct light element abundances signatures.
5.2 CEMP Stars in dSph Galaxies
The first carbon or CH stars in dwarf galaxies were detected more than 40 years ago from low-resolution spectra and in prism surveys. For example, Cannon et al. (1981) obtained spectra of two of the brightest members of Carina, finding both to exhibit strong C2 bands, while Mould et al. (1982) discovered eight carbon stars in Carina (including the two from Cannon et al. (1981)) in their prism survey. Later, Azzopardi et al. (1985, 1986) carried out an extensive prism survey for carbon stars in the dwarf spheroidals Sculptor, Carina, Leo I, Leo II, Draco, and Ursa Minor and presented a list of spectroscopically confirmed carbon stars in Azzopardi et al. (1986). High-resolution follow-up for detailed chemical analysis was not possible at the time and is still a challenge due to the faint nature of the stars. However, although the sample presented here constitutes the largest sample of CEMP stars in a dSph for which a detailed abundance analysis has been carried out, a few CEMP stars in other dSph galaxies, including stars discovered by Azzopardi et al. (1985), have also been analysed previously. We have searched the literature for stars with both C, and neutron-capture element abundances reported. After correcting the reported C abundances for evolutionary effects following Placco et al. (2014), we find CEMP-no, , and stars in the following dSph galaxies: Carina, Draco, Sextans, Sagittarius, Sculptor, and Ursa Minor.
In Draco, the star 19219 analysed by Cohen & Huang (2009) qualifies as a CEMP star after C correction. These authors derive a Ba abundance of . Hence, the star is a CEMP-no star. Cohen & Huang (2009) reported a radial velocity for the star of km s-1, which is in very good agreement with the recent value of km s-1 reported by Massari et al. (2020), suggesting that the star is not in a close binary system.
One CEMP star, S15-19, located in Sextans, was analysed by (Honda et al., 2011), who found it to be Ba but not Eu enhanced, resulting in a CEMP- label. They also found evidence of radial velocity variations suggesting that the star belongs to a binary system. One CEMP star was also identified in Sagittarius by Sbordone et al. (2020). The authors found that star to have roughly equal enhancements of Ba and Eu, labelling it a CEMP- star. Three consistent radial velocities are reported for the star by Sbordone et al. (2020), providing no evidence for binary motion.
In Sculptor, four CEMP stars have been analysed. First, a CEMP-no star, ET0097, was discovered by Skúladóttir et al. (2015). These authors find that the star has and iron-peak abundances resembling other Sculptor stars but shows an enhancement in the light neutron-capture elements Sr and Y ( and ), leading the authors to suggest that it was polluted by a weak -process. In a later study, the radial-velocity measurements for this star were explored, finding a variation of km-1 over a period of nine years, leading the authors to suggest that it is a binary (Skúladóttir et al., 2017). Salgado et al. (2016) analysed the star Scl-1013644 and found high C and Ba abundances, concluding that it is a CEMP- star. However, the star was previously analysed by Geisler et al. (2005), who derived a similar Ba abundance as Salgado et al. (2016), but also derived an Eu abundance for the star resulting in . Hence, the star is actually a CEMP- star. The other two CEMP stars in Sculptor have high Ba abundances and may be CEMP- stars (Lardo et al., 2016). However, no Eu abundances have been derived for the stars; therefore, an classification can not be excluded. None of these stars has multiple radial velocity measurements reported in the literature, rendering their binary nature unknown.
Three CEMP stars in Ursa Minor have abundances for neutron-capture elements derived. Two stars, UMiJI19 and UMi33533, were analysed by Cohen & Huang (2010), who also found the stars to have low Ba abundances ( and respectively), resulting in a CEMP-no classification. Both stars also have consistent radial velocities reported by the Cohen & Huang (2010) study ( and km s-1, respectively) and the more recent studies by Spencer et al. (2018) ( and km s-1) and Pace et al. (2020) ( and km s-1) suggesting that they are not binaries. In Ursa Minor, Kirby et al. (2015) also found the star Bel60017 to be a CEMP star, and Duggan et al. (2018) later derived a Ba abundance of for the star. Hence, the star is either a CEMP- or star. Three consistent radial velocity measurements are reported in the literature for this star ( km s-1; Armandroff et al. 1995, km s-1; Kirby et al. 2010, and km s-1; Spencer et al. 2018), providing no evidence that the star is a binary.
Finally, abundances from high-resolution spectra have been reported for three CEMP stars in Carina prior to this study. Abia et al. (2008) analysed two carbon-rich stars, ALW-6 and ALW-7, identified by Azzopardi et al. (1986). Abundances for the two stars are plotted as cyan circles in Figure 2. As can be seen, these stars exhibit very high Ba abundances compatible with the stars being CEMP- stars. However, no abundance for Eu was derived. Hence, the stars can also be CEMP- stars. Furthermore, the stars were identified as carbon-rich by Azzopardi et al. (1986), and C/O ratios of 5 and 7 were reported for the stars by Abia et al. (2008), but no ratio has been derived for the stars. More recently, high-resolution spectra of two other stars, ALW-1 and ALW-8, from the Azzopardi et al. (1986) list were obtained by Susmitha et al. (2017), who analysed ALW-8, finding it to be a CEMP-no star. ALW-1 was not analysed because of its binary nature and low S/N spectrum. Interestingly, the star rejected by Susmitha et al. (2017) is included in the sample analysed here, namely 75044. The abundances from Susmitha et al. (2017) for the CEMP-no star are plotted as a yellow circle in Figure 2. These authors find that the star has and iron-peak element abundances similar to other Carina stars and similar to the CEMP-no star in Sculptor, they also find it has a small Y overabundance (). Finally, they do not find evidence of any radial velocity variation for this CEMP-no star (Susmitha et al., 2017).
The results of this literature search combined with the results of the analysis presented here, where we find one CEMP-no, three CEMP-, and two CEMP- stars in Carina, shows us that CEMP stars are indeed present in dSph galaxies. When sample sizes get large enough, CEMP stars of the most common types are indeed detected999It should be noted that the more rare CEMP- type has not yet been detected in a dSph galaxy.. Also, the CEMP stars in dSphs seem to have the same binary properties as the halo CEMP stars. However, CEMP stars, and in particular CEMP-no stars, are predominantly found at low metallicities (), a range that is still not fully explored in many dSph galaxies. Current samples of stars with multiple abundances derived in dSph galaxies primarily contain stars with (e.g. Norris et al., 2017; Shetrone et al., 2003; Hill et al., 2019). In addition, although C abundances can be derived from medium or low-resolution spectra, high-resolution spectra are required to derive abundances for a number of neutron-capture elements, for example, Eu, making it very resource-intensive to gather appropriate samples.
5.3 Carbon Enhancement as CEMP Classifier
Studies of CEMP stars in the MW halo have revealed a strong relation between CEMP classifications and the level of carbon enhancement the stars exhibit. This was first noticed by Spite et al. (2013), who plotted the absolute C abundance of CEMP stars as a function of metallicity and discovered two plateaus: A high C plateau, at primarily populated by CEMP- stars and a low C plateau with with mostly CEMP-no stars. This work was extended by Yoon et al. (2016) to include a larger sample and to also account for the change in C abundance as a result of the evolutionary state of the star (Placco et al., 2014), confirming the initial finding.
In Figure 4, we plot the absolute C abundance () as a function of metallicity for our stars, CEMP stars in the halo (Yoon et al., 2016; Goswami et al., 2021; Karinkuzhi et al., 2021; Shejeelammal et al., 2021; Shejeelammal & Goswami, 2021, 2022), and dSph CEMP stars from the literature. In addition to the stars listed in the previous section, we also include CEMP stars from dSph galaxies for which no neutron-capture element abundances have been derived. In summary, data from the following dSph galaxies are included; Canes Venatici I (Yoon et al., 2020), Carina (Susmitha et al., 2017), Draco (Cohen & Huang, 2009; Kirby et al., 2015; Shetrone et al., 2013), Sagittarius (Sbordone et al., 2020), Sculptor (Skúladóttir et al., 2015; Salgado et al., 2016; Geisler et al., 2005; Lardo et al., 2016; Chiti et al., 2018), Sextans (Honda et al., 2011), and Ursa Minor (Kirby et al., 2015; Duggan et al., 2018; Cohen & Huang, 2010). All abundances have been converted to the Asplund et al. (2009) Solar scale, and C abundances have been corrected for evolutionary effects following Placco et al. (2014). CEMP-no stars are plotted in black symbols, CEMP- stars in green, CEMP- stars in cyan, and CEMP stars with no classification in grey. The high and low plateau values determined by Yoon et al. (2016) are shown as dashed lines. Looking at Figure 4, the abundances of CEMP stars detected in dSph galaxies follow the trend seen in the halo with high values found in CEMP- and CEMP- stars at the higher metallicity range, and lower values found for the more metal-poor CEMP stars. Confirming the unclassified nature of the low stars found at low metallicity in e.g., Sculptor as CEMP-no stars would strengthen this picture. However, while can be used to separate most CEMP-no stars from the bulk CEMP sample, the CEMP- and stars seem to occupy the same range, though with the CEMP- stars having more of a preference for .
To construct Figure 4, we used the classification criteria from Beers & Christlieb (2005), which require an Eu abundance to distinguish between CEMP- and CEMP- stars. However, for a large number of stars, no Eu abundance has been derived. This is true for 75 of the 131 stars labelled as CEMP- stars in Yoon et al. (2016), comprising the majority of the halo sample, and a couple of the stars from the dSph sample (two stars in Sculptor (Lardo et al., 2016) and one in Ursa Minor (Kirby et al., 2015; Duggan et al., 2018)). We have therefore split Figure 4 into two panels. On the left-hand side, stars with a high Ba abundance but no Eu abundance are included as CEMP- stars, while these are removed from the right-hand side plot. This exercise shows that the CEMP- stars constitute a significant fraction of the stars with high . In fact, 40% of the CEMP stars included in the plot with neutron-capture element enhancements are CEMP- stars. Looking at the plot on the right-hand side of Figure 4 also suggests that the CEMP- stars generally have higher values than the CEMP- stars with a broad transition region, which is likely a signature of their progenitors’ surface abundance patterns.
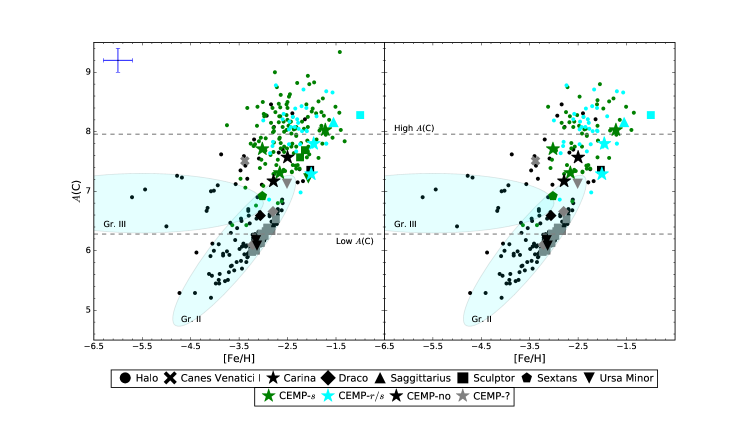
5.3.1 CEMP-no Stars with High Values
From Figure 4, it is evident that the CEMP-no stars, both in the halo and in dSph galaxies, occupy a broad region of the - diagram. This led Yoon et al. (2016) to separate the CEMP-no stars into two groups; group II with average low values and a clear dependence on and group III with higher values but no dependence on . These groups are marked with ellipses in Figure 4 (adapted from Yoon et al. (2016)). Following this grouping of the CEMP-no stars, further radial-velocity studies of CEMP stars found that not only do the CEMP-no and CEMP- stars have different binary properties, but the two groups of CEMP-no stars also seem to have different binary properties. CEMP-no stars with high are more likely to be binaries than CEMP-no stars with low (Arentsen et al., 2019). The two CEMP-no stars in Carina and the one in Sculptor have high values, while the CEMP-no stars in Ursa Minor and Draco have lower values (see Figure 4). The CEMP-no star detected in this work, 40475, is likely a binary, as is the CEMP-no star in Sculptor (Skúladóttir et al., 2017), consistent with their high values. But radial velocity variations have not been detected for the other Carina CEMP-no star, and the Draco and Ursa Minor CEMP-no stars appear to be single as well (see section 5.2) in line with their low values.
In a recent study Yoon et al. (2019) explored the location of dSph CEMP-no stars in the - diagram, and found that the majority of the CEMP-no stars in dSph galaxies fall in group II. As can be seen in Figure 4, this is consistent with our findings. Yoon et al. (2019) suggest this is due to the extended star formation and chemical evolution of the dSph galaxies resulting in a strong metallicity dependence for CEMP stars formed in these environments. They also suggest that this can explain the correlation between and and found for group II halo CEMP-no stars (Yoon et al., 2016). Our CEMP-no star exhibits very high Na, Mg, and Si abundances (see Figure 2). This signature has been seen in several CEMP-no stars found in the MW halo (Yoon et al., 2016, and references therein) and in ultra-faint dwarf galaxies (Boötes I:Lai et al. (2011); Gilmore et al. (2013), Segue 1: Norris et al. (2010), Carina III:Ji et al. (2020b)). However, for the MW stars most of these are group III CEMP-no stars (with low ). The signature has been suggested to be the result of extensive processing and mixing in a massive metal-free spinstar progenitor (Maeder & Meynet, 2015). The other dSph CEMP-no stars do not display this signature, although the CEMP-no stars from Ursa Minor and Draco are enhanced in Al (Cohen & Huang, 2009, 2010), a signature also seen in some of the most metal-poor halo CEMP-no stars (Norris et al., 2013).
One abundance signature most of the dSph CEMP-no stars do have in common is high ratios. All except one of the dSph CEMP-no stars listed in Section 5.2 have (or , as not all stars have a Sr abundance reported in the literature) (Cohen & Huang, 2010; Skúladóttir et al., 2015; Susmitha et al., 2017), with the exception being the CEMP-no star in Draco, which has (Cohen & Huang, 2009). This signature has also been discovered in halo CEMP-no stars by Hansen et al. (2019), who suggested CEMP-no stars could be identified based on their Sr to Ba ratio (. Following the notion of Yoon et al. (2019) that dSph CEMP-no stars mostly fall into group II, we looked at the ratios of the group II CEMP-no stars from Yoon et al. (2016) and identified 18 having . In the future, studies combining kinematic analysis with results from detailed abundances analysis, as done by Zepeda et al. (2022), will provide important information on the possible accretion history of these stars.
5.4 Classification of CEMP- Stars
According to the Beers & Christlieb (2005) classification, two of our sample stars, 130624 and 97508, qualify as CEMP- stars, meaning they are potentially enhanced in a mixture of - and -process elements. The origin(s) of this type of abundance pattern of CEMP stars is still not well understood. First of all, it is still debated how these stars should be classified. The original classification scheme from Beers & Christlieb (2005) is based on the Ba and Eu abundances of the stars (). However, more recently, other classification schemes have been suggested (see Goswami et al. 2021 for a detailed review).
A classification based on the ratios of the CEMP stars was put forward by Hansen et al. (2019). Unfortunately, due to the absorption lines being saturated or heavily blended, we are only able to derive Sr abundances for three of our stars, 40475, 75044, and 130624. They have and , which results in CEMP-no, CEMP-, and CEMP- classifications, respectively. Other studies have pointed out that La is a more reliable measure for the -process contribution in these stars as more absorption lines of La than Ba are available in the spectra, and due to the extreme Ba abundances, the Ba lines are often saturated (Karinkuzhi et al., 2021). In addition, the Ba abundances also suffer from non-local thermodynamical equilibrium (non-LTE) effects (Korotin et al., 2015). Thus, several studies have suggested using the ratios of the stars to separate CEMP- and , where CEMP- stars would have (Frebel, 2018; Goswami et al., 2021; Karinkuzhi et al., 2021) (the upper limit varies depending on the study). Goswami et al. (2021) also found that most CEMP- stars have while CEMP- stars have .
Finally, Karinkuzhi et al. (2021) investigated a classification method based on the distance of the stellar neutron-capture element abundance pattern from the Solar system -process abundance pattern. Stars enhanced in pure -process material are known to exhibit a quite robust abundance pattern for the heavy neutron-capture elements matching that of the scaled Solar system -process abundance pattern (Sneden et al., 2008), so in principle, the more -process dominated a star is, the closer its neutron-capture element abundance pattern will be to the scaled Solar system -process abundance pattern. Karinkuzhi et al. (2021) calculates a distance to the scaled Solar -process pattern, , and finds the CEMP- stars in their sample to have while their CEMP- stars all have . We have determined values and calculated for our stars. The results and re-classifications are listed in Table 8. When calculating , we exclude the light neutron-capture elements Sr, Y, and Zr as the abundances of these elements in -process enhanced stars have been found to display a larger scatter than abundance for elements heavier than Ba (Hansen et al., 2012; Ji et al., 2016) with respect to, e.g. Eu. For the stars in our sample, these two methods agree on the classification, and we end up with three CEMP- stars in our sample (86357, 130624, and 125696) and two CEMP- stars (75044 and 97508), which is slightly different from the Beers & Christlieb (2005) classification and highlights a likely notable contribution to the abundance patterns of these stars from a nucleosynthesis process with a higher neutron flux than the -process.
The uncertainties on the derived abundances, of course, present a limitation to the classification. We have estimated this uncertainty by generating 100 sets of ”new” abundances for the stars drawn from a Gaussian distribution in the range and re-calculating with these ”new” abundances. The result of this exercise is that values for the three CEMP- fluctuate in the range from 0.2 to 0.7 while the values for the two CEMP- stars lie in the range from 0.2 to 0.9. Thus while the values vary a great deal, the CEMP- stars still stay below (or just at) the found to be the lower limit for CEMP- stars in Karinkuzhi et al. (2021).
| Stellar ID | CEMP type | ||
|---|---|---|---|
| 75044 | 0.72 | 0.60 | CEMP- |
| 86357 | 0.30 | 0.11 | CEMP- |
| 130624 | 0.59 | 0.27 | CEMP- |
| 125696 | 0.54 | 0.28 | CEMP- |
| 97508 | 0.73 | 0.53 | CEMP- |
5.5 Origin of CEMP- Stars
Many attempts have been made to understand the origin(s) of the CEMP- stars’ peculiar abundance pattern, steadily assuming that both the - and the -process indeed contribute to these unusual patterns. Most of the invoked scenarios involve various combinations of - and -process events polluting the star or the gas it formed from. For example, forming a binary system from gas already polluted by an -process event and then invoking mass transfer in the binary system to get the additional C and -process enrichment (see Jonsell et al. 2006 and Abate et al. 2016 for reviews). Sbordone et al. (2020) found that the latter scenario best explained the abundance pattern of the CEMP- star in the Sagittarius dSph. However, so far, it has only been possible to match a combined - and -process pattern to the abundance pattern of one CEMP- star in the MW halo (Gull et al., 2018), which the authors suggest to re-label as CEMP- to reflect the actual contributions of both of these processes. Hence in recent years, the suggestion that a process with a neutron flux intermediate between the - and -process, the so-called -process (Cowan & Rose, 1977) could create this signature has gained ground (e.g., Hampel et al. 2016).
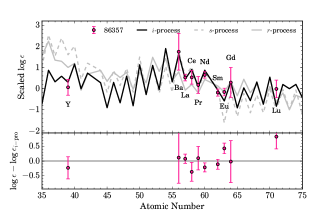
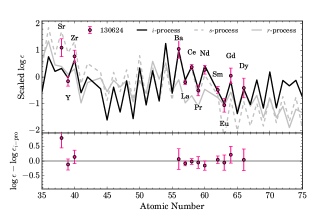
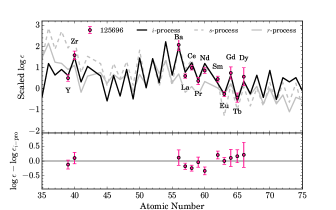
Currently, various processes in very metal-poor, low mass AGB stars (Campbell & Lattanzio, 2008; Cristallo et al., 2009; Campbell et al., 2010; Stancliffe et al., 2011; Choplin et al., 2021) and super-AGB stars (Doherty et al., 2015; Jones et al., 2016) are suggested as -process sources. In addition, conditions required for the -process have also been hypothesized in accreting white dwarfs (Denissenkov et al., 2019) and during the He shell burning phase of metal-free massive stars (Banerjee et al., 2018). Some of these suggested -process sites imply that the CEMP- stars were polluted via mass transfer in a binary system, while others do not. No dedicated radial-velocity monitoring campaign has been published for the CEMP- stars. However, of the three CEMP- stars included in Hansen et al. (2016b), all were found to exhibit radial-velocity variations consistent with belonging to binary systems. For the CEMP- stars detected here, two (125696 and 130624) show clear radial-velocity variations. Thus, it is likely that the observed signature is a result of binary mass transfer similar to that of the CEMP- signature. This is largely in good agreement with -process conditions being found in specific AGB stars, as mentioned above. In addition, Hampel et al. (2016) compared the abundance patterns of 20 CEMP- stars to -process model yields from thermally pulsing AGB stars. They found that the -process yields successfully reproduced the neutron/capture abundance pattern of the CEMP- stars, further supporting this scenario. This study, however, did not include C abundances as a constraint. In the future, it would be interesting to see if the proposed sites of the -process also can produce the high C enhancement seen in CEMP- stars.
In Figure 5, we compare the neutron-capture element abundance patterns of our CEMP- stars to the most recent -process yield available in the literature from Choplin et al. (2022) and the Solar - and -process abundance patterns from Sneden et al. (2008). The Solar - and -process patterns have been scaled to the stellar Ba and Eu abundances, respectively, while the average difference between yields and stellar abundances from Ba to Dy has been used to scale the -process yields. The best fits were obtained using the yields from model M1.0z2.3 with initial mass 1 M⊙ and metallicity for the stars 86357 and 125696, and yields from model M1.0z2.5 with initial mass 1 M⊙ and metallicity for the star 130624. For all three stars, the -process model yields are generally a good match to the stellar abundances in the element range from Ba to Dy, while some larger discrepancies are seen for the lighter elements Sr, Y, and Zr and for Lu in 86357. In comparison, neither the Solar nor -process patterns display a good match to the stellar abundances. Choplin et al. (2022) also provides yields for C, which for the two models used in Figure 5 is (C) = 9.26 (M1.0z2.5) and 9.29 (M1.0z2.3). Scaling these using the same scaling as for the neutron-capture elements, we find (C) = 7.24, 7.56, and 7.65 for 86357, 12569, and 130624, respectively, which are slightly lower than but almost within uncertainties of the C abundances we derive for the stars ((Ccorr) = 7.71, 8.03, and 7.80, respectively).
6 Summary
We present detailed abundances for six CEMP stars in the Carina dSph galaxy. This is the largest sample of CEMP stars in any dSph for which detailed abundances have been derived. Our sample is comprised of one CEMP-no star, three (two) CEMP-, and two (three) CEMP- stars (depending on the classification criteria).
We find that the CEMP stars have similar and iron-peak element abundances as the carbon-normal Carina stars, except for the CEMP-no star, which is highly enhanced in Na, Mg, and Si, a feature also seen in some halo CEMP-no stars. Plotting the absolute C abundance of CEMP stars in dSph galaxies as a function of shows a similar trend as what is seen for halo CEMP stars with two groups, where the CEMP- and stars mostly occupy the higher plateau and the CEMP-no stars the lower plateau. We find, however, that the CEMP- stars primarily occupy the highest range with though with a notable overlap region between the CEMP- and stars. The considerable overlap in values for these two types of CEMP stars highlights the need for neutron-capture element abundances being derived to identify the CEMP- stars, which will lead to a better understanding of this abundances signature.
Finally, we match the neutron-capture element abundance pattern and C abundances of our CEMP- stars (Karinkuzhi et al. (2021) classification) to -process yield from metal-poor low mass AGB models (Choplin et al., 2022), finding a good match for the elements in the range from Ba to Dy, which strengthens the hypothesis that CEMP- stars show the signature of an intermediate neutron-capture process. The models, however, have some trouble reproducing the observed abundances for the light elements and also produce slightly less C compared to the stellar abundances. Hence some work is still needed to understand the nature of the full abundance pattern of these stars.
Acknowledgements.
The authors thank the anonymous referee for their comments, which have improved the manuscript We thank Josh Adams for his work on the MagE observing program from which the targets of this study were selected. The authors thank Asa Skuladottir for useful discussions on CEMP stars in dwarf galaxies. TTH acknowledges support from the Swedish Research Council (VR 2021-05556). JDS and TTH were partially supported by the NSF through grant AST-1714873. AF acknowledges support from NSF CAREER grant AST-1255160 and NSF grant AST-1716251. TSL acknowledges financial support from Natural Sciences and Engineering Research Council of Canada (NSERC) through grant RGPIN-2022-04794. This paper includes data gathered with the 6.5 meter Magellan Telescopes located at Las Campanas Observatory, Chile. This research made extensive use of the SIMBAD database operated at CDS, Strasbourg, France (Wenger et al., 2000), arXiv.org, and NASA’s Astrophysics Data System for bibliographic information.References
- Abate et al. (2016) Abate, C., Stancliffe, R. J., & Liu, Z.-W. 2016, A&A, 587, A50
- Abia et al. (2008) Abia, C., de Laverny, P., & Wahlin, R. 2008, A&A, 481, 161
- Aoki et al. (2007) Aoki, W., Beers, T. C., Christlieb, N., et al. 2007, ApJ, 655, 492
- Arentsen et al. (2019) Arentsen, A., Starkenburg, E., Shetrone, M. D., et al. 2019, A&A, 621, A108
- Armandroff et al. (1995) Armandroff, T. E., Olszewski, E. W., & Pryor, C. 1995, AJ, 110, 2131
- Asplund et al. (2009) Asplund, M., Grevesse, N., Sauval, A. J., & Scott, P. 2009, ARA&A, 47, 481
- Azzopardi et al. (1985) Azzopardi, M., Lequeux, J., & Westerlund, B. E. 1985, A&A, 144, 388
- Azzopardi et al. (1986) Azzopardi, M., Lequeux, J., & Westerlund, B. E. 1986, A&A, 161, 232
- Banerjee et al. (2018) Banerjee, P., Qian, Y.-Z., & Heger, A. 2018, ApJ, 865, 120
- Beers & Christlieb (2005) Beers, T. C. & Christlieb, N. 2005, ARA&A, 43, 531
- Belmonte et al. (2017) Belmonte, M. T., Pickering, J. C., Ruffoni, M. P., et al. 2017, ApJ, 848, 125
- Bernstein et al. (2003) Bernstein, R., Shectman, S. A., Gunnels, S. M., Mochnacki, S., & Athey, A. E. 2003, in Society of Photo-Optical Instrumentation Engineers (SPIE) Conference Series, Vol. 4841, Instrument Design and Performance for Optical/Infrared Ground-based Telescopes, ed. M. Iye & A. F. M. Moorwood, 1694–1704
- Biémont et al. (2011) Biémont, É., Blagoev, K., Engström, L., et al. 2011, MNRAS, 414, 3350
- Campbell & Lattanzio (2008) Campbell, S. W. & Lattanzio, J. C. 2008, A&A, 490, 769
- Campbell et al. (2010) Campbell, S. W., Lugaro, M., & Karakas, A. I. 2010, A&A, 522, L6
- Cannon et al. (1981) Cannon, R. D., Niss, B., & Norgaard-Nielsen, H. U. 1981, MNRAS, 196, 1
- Casagrande et al. (2010) Casagrande, L., Ramírez, I., Meléndez, J., Bessell, M., & Asplund, M. 2010, A&A, 512, A54
- Castelli & Kurucz (2003) Castelli, F. & Kurucz, R. L. 2003, in Modelling of Stellar Atmospheres, ed. N. Piskunov, W. W. Weiss, & D. F. Gray, Vol. 210, A20
- Chiti et al. (2018) Chiti, A., Simon, J. D., Frebel, A., et al. 2018, ApJ, 856, 142
- Choplin et al. (2021) Choplin, A., Siess, L., & Goriely, S. 2021, A&A, 648, A119
- Choplin et al. (2022) Choplin, A., Siess, L., & Goriely, S. 2022, A&A, 667, A155
- Cohen & Huang (2009) Cohen, J. G. & Huang, W. 2009, ApJ, 701, 1053
- Cohen & Huang (2010) Cohen, J. G. & Huang, W. 2010, ApJ, 719, 931
- Cowan & Rose (1977) Cowan, J. J. & Rose, W. K. 1977, ApJ, 212, 149
- Cristallo et al. (2009) Cristallo, S., Straniero, O., Gallino, R., et al. 2009, ApJ, 696, 797
- Cutri et al. (2003) Cutri, R. M., Skrutskie, M. F., van Dyk, S., et al. 2003, VizieR Online Data Catalog, II/246
- Den Hartog et al. (2003) Den Hartog, E. A., Lawler, J. E., Sneden, C., & Cowan, J. J. 2003, ApJS, 148, 543
- Den Hartog et al. (2006) Den Hartog, E. A., Lawler, J. E., Sneden, C., & Cowan, J. J. 2006, ApJS, 167, 292
- Den Hartog et al. (2019) Den Hartog, E. A., Lawler, J. E., Sneden, C., Cowan, J. J., & Brukhovesky, A. 2019, ApJS, 243, 33
- Den Hartog et al. (2011) Den Hartog, E. A., Lawler, J. E., Sobeck, J. S., Sneden, C., & Cowan, J. J. 2011, ApJS, 194, 35
- Den Hartog et al. (2014) Den Hartog, E. A., Ruffoni, M. P., Lawler, J. E., et al. 2014, ApJS, 215, 23
- Denissenkov et al. (2019) Denissenkov, P. A., Herwig, F., Woodward, P., et al. 2019, MNRAS, 488, 4258
- Doherty et al. (2015) Doherty, C. L., Gil-Pons, P., Siess, L., Lattanzio, J. C., & Lau, H. H. B. 2015, MNRAS, 446, 2599
- Dotter et al. (2008) Dotter, A., Chaboyer, B., Jevremović, D., et al. 2008, ApJS, 178, 89
- Dressler et al. (2011) Dressler, A., Bigelow, B., Hare, T., et al. 2011, PASP, 123, 288
- Duggan et al. (2018) Duggan, G. E., Kirby, E. N., Andrievsky, S. M., & Korotin, S. A. 2018, ApJ, 869, 50
- Fabrizio et al. (2016) Fabrizio, M., Bono, G., Nonino, M., et al. 2016, ApJ, 830, 126
- Fabrizio et al. (2015) Fabrizio, M., Nonino, M., Bono, G., et al. 2015, A&A, 580, A18
- Frebel (2018) Frebel, A. 2018, Annual Review of Nuclear and Particle Science, 68, 237
- Gaia Collaboration (2018) Gaia Collaboration. 2018, VizieR Online Data Catalog, I/345
- Geisler et al. (2005) Geisler, D., Smith, V. V., Wallerstein, G., Gonzalez, G., & Charbonnel, C. 2005, AJ, 129, 1428
- Gilmore et al. (2013) Gilmore, G., Norris, J. E., Monaco, L., et al. 2013, ApJ, 763, 61
- Goswami et al. (2021) Goswami, P. P., Rathour, R. S., & Goswami, A. 2021, A&A, 649, A49
- Gull et al. (2018) Gull, M., Frebel, A., Cain, M. G., et al. 2018, ApJ, 862, 174
- Hampel et al. (2016) Hampel, M., Stancliffe, R. J., Lugaro, M., & Meyer, B. S. 2016, ApJ, 831, 171
- Hansen et al. (2019) Hansen, C. J., Hansen, T. T., Koch, A., et al. 2019, A&A, 623, A128
- Hansen et al. (2012) Hansen, C. J., Primas, F., Hartman, H., et al. 2012, A&A, 545, A31
- Hansen et al. (2015) Hansen, T., Hansen, C. J., Christlieb, N., et al. 2015, ApJ, 807, 173
- Hansen et al. (2016a) Hansen, T. T., Andersen, J., Nordström, B., et al. 2016a, A&A, 586, A160
- Hansen et al. (2016b) Hansen, T. T., Andersen, J., Nordström, B., et al. 2016b, A&A, 588, A3
- Hill et al. (2019) Hill, V., Skúladóttir, Á., Tolstoy, E., et al. 2019, A&A, 626, A15
- Honda et al. (2011) Honda, S., Aoki, W., Arimoto, N., & Sadakane, K. 2011, PASJ, 63, 523
- Ivans et al. (2006) Ivans, I. I., Simmerer, J., Sneden, C., et al. 2006, ApJ, 645, 613
- Ivarsson et al. (2001) Ivarsson, S., Litzén, U., & Wahlgren, G. M. 2001, Phys. Scr, 64, 455
- Ji et al. (2016) Ji, A. P., Frebel, A., Simon, J. D., & Chiti, A. 2016, ApJ, 830, 93
- Ji et al. (2020a) Ji, A. P., Li, T. S., Hansen, T. T., et al. 2020a, AJ, 160, 181
- Ji et al. (2020b) Ji, A. P., Li, T. S., Simon, J. D., et al. 2020b, ApJ, 889, 27
- Jones et al. (2016) Jones, S., Ritter, C., Herwig, F., et al. 2016, MNRAS, 455, 3848
- Jonsell et al. (2006) Jonsell, K., Barklem, P. S., Gustafsson, B., et al. 2006, A&A, 451, 651
- Karinkuzhi et al. (2021) Karinkuzhi, D., Van Eck, S., Goriely, S., et al. 2021, A&A, 645, A61
- Kelson (2003) Kelson, D. D. 2003, PASP, 115, 688
- Kirby et al. (2010) Kirby, E. N., Guhathakurta, P., Simon, J. D., et al. 2010, ApJS, 191, 352
- Kirby et al. (2015) Kirby, E. N., Guo, M., Zhang, A. J., et al. 2015, ApJ, 801, 125
- Koch et al. (2008) Koch, A., Grebel, E. K., Gilmore, G. F., et al. 2008, AJ, 135, 1580
- Koch et al. (2006) Koch, A., Grebel, E. K., Wyse, R. F. G., et al. 2006, AJ, 131, 895
- Korotin et al. (2015) Korotin, S. A., Andrievsky, S. M., Hansen, C. J., et al. 2015, A&A, 581, A70
- Kramida et al. (2018) Kramida, A., Ralchenko, Y., Nave, G., & Reader, J. 2018, in APS Meeting Abstracts, Vol. 2018, APS Division of Atomic, Molecular and Optical Physics Meeting Abstracts, M01.004
- Kurucz & Bell (1995) Kurucz, R. & Bell, B. 1995, Atomic Line Data (R.L. Kurucz and B. Bell) Kurucz CD-ROM No. 23. Cambridge, 23
- Lai et al. (2011) Lai, D. K., Lee, Y. S., Bolte, M., et al. 2011, ApJ, 738, 51
- Lardo et al. (2016) Lardo, C., Battaglia, G., Pancino, E., et al. 2016, A&A, 585, A70
- Lawler et al. (2001a) Lawler, J. E., Bonvallet, G., & Sneden, C. 2001a, ApJ, 556, 452
- Lawler & Dakin (1989) Lawler, J. E. & Dakin, J. T. 1989, Journal of the Optical Society of America B Optical Physics, 6, 1457
- Lawler et al. (2006) Lawler, J. E., Den Hartog, E. A., Sneden, C., & Cowan, J. J. 2006, ApJS, 162, 227
- Lawler et al. (2013) Lawler, J. E., Guzman, A., Wood, M. P., Sneden, C., & Cowan, J. J. 2013, ApJS, 205, 11
- Lawler et al. (2015) Lawler, J. E., Sneden, C., & Cowan, J. J. 2015, ApJS, 220, 13
- Lawler et al. (2009) Lawler, J. E., Sneden, C., Cowan, J. J., Ivans, I. I., & Den Hartog, E. A. 2009, ApJS, 182, 51
- Lawler et al. (2001b) Lawler, J. E., Wickliffe, M. E., Cowley, C. R., & Sneden, C. 2001b, ApJS, 137, 341
- Lawler et al. (2001c) Lawler, J. E., Wickliffe, M. E., den Hartog, E. A., & Sneden, C. 2001c, ApJ, 563, 1075
- Lawler et al. (2001d) Lawler, J. E., Wyart, J. F., & Blaise, J. 2001d, ApJS, 137, 351
- Lemasle et al. (2012) Lemasle, B., Hill, V., Tolstoy, E., et al. 2012, A&A, 538, A100
- Li et al. (2007) Li, R., Chatelain, R., Holt, R. A., et al. 2007, Phys. Scr, 76, 577
- Li et al. (2019) Li, T. S., Koposov, S. E., Zucker, D. B., et al. 2019, MNRAS, 490, 3508
- Ljung et al. (2006) Ljung, G., Nilsson, H., Asplund, M., & Johansson, S. 2006, A&A, 456, 1181
- Lucatello et al. (2005) Lucatello, S., Tsangarides, S., Beers, T. C., et al. 2005, ApJ, 625, 825
- Maeder & Meynet (2015) Maeder, A. & Meynet, G. 2015, A&A, 580, A32
- Malhan & Ibata (2018) Malhan, K. & Ibata, R. A. 2018, MNRAS, 477, 4063
- Marshall et al. (2008) Marshall, J. L., Burles, S., Thompson, I. B., et al. 2008, in Society of Photo-Optical Instrumentation Engineers (SPIE) Conference Series, Vol. 7014, Ground-based and Airborne Instrumentation for Astronomy II, ed. I. S. McLean & M. M. Casali, 701454
- Massari et al. (2020) Massari, D., Helmi, A., Mucciarelli, A., et al. 2020, A&A, 633, A36
- Masseron et al. (2014) Masseron, T., Plez, B., Van Eck, S., et al. 2014, A&A, 571, A47
- McWilliam (1998) McWilliam, A. 1998, AJ, 115, 1640
- Meléndez & Barbuy (2009) Meléndez, J. & Barbuy, B. 2009, A&A, 497, 611
- Mighell (1997) Mighell, K. J. 1997, AJ, 114, 1458
- Mould et al. (1982) Mould, J. R., Cannon, R. D., Aaronson, M., & Frogel, J. A. 1982, ApJ, 254, 500
- Muñoz et al. (2006) Muñoz, R. R., Majewski, S. R., Zaggia, S., et al. 2006, ApJ, 649, 201
- Norris et al. (2010) Norris, J. E., Gilmore, G., Wyse, R. F. G., Yong, D., & Frebel, A. 2010, ApJ, 722, L104
- Norris et al. (2013) Norris, J. E., Yong, D., Bessell, M. S., et al. 2013, ApJ, 762, 28
- Norris et al. (2017) Norris, J. E., Yong, D., Venn, K. A., et al. 2017, ApJS, 230, 28
- O’Brian et al. (1991) O’Brian, T. R., Wickliffe, M. E., Lawler, J. E., Whaling, W., & Brault, J. W. 1991, Journal of the Optical Society of America B Optical Physics, 8, 1185
- Pace et al. (2020) Pace, A. B., Kaplinghat, M., Kirby, E., et al. 2020, MNRAS, 495, 3022
- Pehlivan Rhodin et al. (2017) Pehlivan Rhodin, A., Hartman, H., Nilsson, H., & Jönsson, P. 2017, A&A, 598, A102
- Pickering et al. (2001) Pickering, J. C., Thorne, A. P., & Perez, R. 2001, ApJS, 132, 403
- Pickering et al. (2002) Pickering, J. C., Thorne, A. P., & Perez, R. 2002, ApJS, 138, 247
- Placco et al. (2014) Placco, V. M., Frebel, A., Beers, T. C., & Stancliffe, R. J. 2014, ApJ, 797, 21
- Placco et al. (2021) Placco, V. M., Sneden, C., Roederer, I. U., et al. 2021, Research Notes of the American Astronomical Society, 5, 92
- Quinet et al. (2006) Quinet, P., Palmeri, P., Biémont, É., et al. 2006, A&A, 448, 1207
- Roederer et al. (2008) Roederer, I. U., Lawler, J. E., Sneden, C., et al. 2008, ApJ, 675, 723
- Roederer et al. (2012) Roederer, I. U., Lawler, J. E., Sobeck, J. S., et al. 2012, ApJS, 203, 27
- Roederer et al. (2014) Roederer, I. U., Preston, G. W., Thompson, I. B., et al. 2014, AJ, 147, 136
- Ruffoni et al. (2014) Ruffoni, M. P., Den Hartog, E. A., Lawler, J. E., et al. 2014, MNRAS, 441, 3127
- Salgado et al. (2016) Salgado, C., Da Costa, G. S., Yong, D., & Norris, J. E. 2016, MNRAS, 463, 598
- Salvadori et al. (2015) Salvadori, S., Skúladóttir, Á., & Tolstoy, E. 2015, MNRAS, 454, 1320
- Sbordone et al. (2020) Sbordone, L., Hansen, C. J., Monaco, L., et al. 2020, A&A, 641, A135
- Schlafly & Finkbeiner (2011) Schlafly, E. F. & Finkbeiner, D. P. 2011, ApJ, 737, 103
- Searle & Zinn (1978) Searle, L. & Zinn, R. 1978, ApJ, 225, 357
- Shejeelammal & Goswami (2021) Shejeelammal, J. & Goswami, A. 2021, ApJ, 921, 77
- Shejeelammal & Goswami (2022) Shejeelammal, J. & Goswami, A. 2022, arXiv e-prints, arXiv:2208.01258
- Shejeelammal et al. (2021) Shejeelammal, J., Goswami, A., & Shi, J. 2021, MNRAS, 502, 1008
- Shetrone et al. (2003) Shetrone, M., Venn, K. A., Tolstoy, E., et al. 2003, AJ, 125, 684
- Shetrone et al. (2013) Shetrone, M. D., Smith, G. H., Stanford, L. M., Siegel, M. H., & Bond, H. E. 2013, AJ, 145, 123
- Simon et al. (2015) Simon, J. D., Jacobson, H. R., Frebel, A., et al. 2015, ApJ, 802, 93
- Skúladóttir et al. (2017) Skúladóttir, Á., Tolstoy, E., Salvadori, S., Hill, V., & Pettini, M. 2017, A&A, 606, A71
- Skúladóttir et al. (2015) Skúladóttir, Á., Tolstoy, E., Salvadori, S., et al. 2015, A&A, 574, A129
- Smecker-Hane et al. (1994) Smecker-Hane, T. A., Stetson, P. B., Hesser, J. E., & Lehnert, M. D. 1994, AJ, 108, 507
- Sneden et al. (2008) Sneden, C., Cowan, J. J., & Gallino, R. 2008, ARA&A, 46, 241
- Sneden et al. (2009) Sneden, C., Lawler, J. E., Cowan, J. J., Ivans, I. I., & Den Hartog, E. A. 2009, ApJS, 182, 80
- Sneden (1973) Sneden, C. A. 1973, PhD thesis, University of Texas, Austin
- Sobeck et al. (2011) Sobeck, J. S., Kraft, R. P., Sneden, C., et al. 2011, AJ, 141, 175
- Sobeck et al. (2007) Sobeck, J. S., Lawler, J. E., & Sneden, C. 2007, ApJ, 667, 1267
- Spencer et al. (2018) Spencer, M. E., Mateo, M., Olszewski, E. W., et al. 2018, AJ, 156, 257
- Spite et al. (2013) Spite, M., Caffau, E., Bonifacio, P., et al. 2013, A&A, 552, A107
- Stancliffe et al. (2011) Stancliffe, R. J., Dearborn, D. S. P., Lattanzio, J. C., Heap, S. A., & Campbell, S. W. 2011, ApJ, 742, 121
- Starkenburg et al. (2014) Starkenburg, E., Shetrone, M. D., McConnachie, A. W., & Venn, K. A. 2014, MNRAS, 441, 1217
- Stetson (2000) Stetson, P. B. 2000, PASP, 112, 925
- Stetson (2005) Stetson, P. B. 2005, PASP, 117, 563
- Susmitha et al. (2017) Susmitha, A., Koch, A., & Sivarani, T. 2017, A&A, 606, A112
- Venn et al. (2012) Venn, K. A., Shetrone, M. D., Irwin, M. J., et al. 2012, ApJ, 751, 102
- Walker et al. (2009) Walker, M. G., Mateo, M., & Olszewski, E. W. 2009, AJ, 137, 3100
- Wenger et al. (2000) Wenger, M., Ochsenbein, F., Egret, D., et al. 2000, A&AS, 143, 9
- Wickliffe et al. (2000) Wickliffe, M. E., Lawler, J. E., & Nave, G. 2000, J. Quant. Spec. Radiat. Transf., 66, 363
- Wood et al. (2013) Wood, M. P., Lawler, J. E., Sneden, C., & Cowan, J. J. 2013, ApJS, 208, 27
- Wood et al. (2014) Wood, M. P., Lawler, J. E., Sneden, C., & Cowan, J. J. 2014, ApJS, 211, 20
- Yoon et al. (2016) Yoon, J., Beers, T. C., Placco, V. M., et al. 2016, ApJ, 833, 20
- Yoon et al. (2019) Yoon, J., Beers, T. C., Tian, D., & Whitten, D. D. 2019, ApJ, 878, 97
- Yoon et al. (2020) Yoon, J., Whitten, D. D., Beers, T. C., et al. 2020, ApJ, 894, 7
- Yu & Derevianko (2018) Yu, Y. & Derevianko, A. 2018, Atomic Data and Nuclear Data Tables, 119, 263
- Zepeda et al. (2022) Zepeda, J., Beers, T. C., Placco, V. M., et al. 2022, arXiv e-prints, arXiv:2209.12224
Appendix A Photometry
| Stellar ID | ||||||||||
|---|---|---|---|---|---|---|---|---|---|---|
| 75044 | 17.708 | 16.284 | 15.235 | 14.557 | 14.295 | 4139 | 4140 | … | … | … |
| 86357 | 18.524 | 17.235 | 16.270 | 15.630 | 15.510 | 4332 | 4347 | 4238 | 4308 | 4419 |
| 130624 | 18.629 | 17.476 | 16.551 | 16.039 | … | 4672 | 4595 | 4599 | … | … |
| 125696 | 18.814 | 17.747 | … | … | … | 4868 | … | … | … | … |
| 40475 | 19.054 | 17.885 | … | … | … | 4546 | … | … | … | … |
| 97508 | 19.013 | 17.965 | … | … | … | 4866 | … | … | … | … |
Appendix B Atomic data
| Stellar ID | Species | EW | Ref | |||||
|---|---|---|---|---|---|---|---|---|
| (Å) | (eV) | (mÅ) | (mÅ) | (dex) | ||||
| 75044 | 11.0 | 5688.20 | 2.10 | 0.41 | 53.18 | 6.77 | 4.46 | 1 |
| 75044 | 11.0 | 5889.95 | 0.00 | 0.11 | 481.72 | 10.48 | 4.66 | 1 |
| 75044 | 11.0 | 5895.92 | 0.00 | 0.19 | 368.27 | 8.08 | 4.52 | 1 |
| 75044 | 12.0 | 5172.68 | 2.71 | 0.36 | 246.40 | 12.37 | 4.60 | 2 |
| 75044 | 12.0 | 5183.60 | 2.72 | 0.17 | 455.35 | 13.94 | 5.43 | 2 |
| 75044 | 19.0 | 7698.96 | 0.00 | 0.18 | synth | synth | 2.98 | 1 |
| 75044 | 20.0 | 6102.72 | 1.88 | 0.81 | synth | synth | 4.07 | 3 |
| 75044 | 20.0 | 6122.22 | 1.89 | 0.33 | synth | synth | 4.25 | 3 |
| 75044 | 20.0 | 6161.29 | 2.52 | 1.35 | synth | synth | 4.11 | 3 |
| 75044 | 21.1 | 4324.99 | 0.60 | 0.44 | synth | synth | 0.23 | 4 |
| 75044 | 21.1 | 4374.47 | 0.62 | 0.46 | synth | synth | 0.33 | 4 |
| 75044 | 21.1 | 4400.39 | 0.61 | 0.54 | synth | synth | 0.29 | 4 |
| 75044 | 22.0 | 4840.87 | 0.90 | 0.43 | 45.81 | 5.04 | 2.20 | 5 |
| 75044 | 22.0 | 5210.38 | 0.05 | 0.82 | synth | synth | 1.89 | 5 |
| 75044 | 22.1 | 4443.80 | 1.08 | 0.71 | synth | synth | 2.44 | 6 |
| 75044 | 22.1 | 4450.48 | 1.08 | 1.52 | synth | synth | 2.15 | 6 |
| 75044 | 22.1 | 4501.27 | 1.12 | 0.77 | synth | synth | 2.89 | 6 |
| 75044 | 22.1 | 4571.97 | 1.57 | 0.31 | synth | synth | 2.05 | 6 |
| 75044 | 22.1 | 5226.54 | 1.57 | 1.26 | synth | synth | 2.61 | 7 |
| 75044 | 22.1 | 5336.79 | 1.58 | 1.60 | synth | synth | 2.76 | 6 |
(1) Kramida et al. (2018); (2) Pehlivan Rhodin et al. (2017); (3) Yu & Derevianko (2018); (4) Lawler & Dakin (1989), using hfs from Kurucz & Bell (1995); (5) Lawler et al. (2013); (6) Wood et al. (2013); (7) Pickering et al. (2001), with corrections given in Pickering et al. (2002); (8) Sobeck et al. (2007); (9) Den Hartog et al. (2011) for both log(gf) value and hfs; (10) O’Brian et al. (1991); (11) Den Hartog et al. (2014); (12) Belmonte et al. (2017); (13) Ruffoni et al. (2014); (14) Den Hartog et al. (2019); (15) Meléndez & Barbuy (2009); (16) Lawler et al. (2015) for log(gf) values and HFS; (17) Wood et al. (2014); (18) Roederer et al. (2012); (19) Biémont et al. (2011); (20) Ljung et al. (2006); (21) Kramida et al. (2018), using HFS/IS from McWilliam (1998) when available; (22) Lawler et al. (2001a), using HFS from Ivans et al. (2006); (23) Lawler et al. (2009); (24) Li et al. (2007), using HFS from Sneden et al. (2009); (25) (Ivarsson et al. 2001), using HFS from Sneden et al. (2009); (26) Den Hartog et al. (2003), using HFS/IS from Roederer et al. (2008); (27) Lawler et al. (2006), using HFS/IS from Roederer et al. (2008); (28) Lawler et al. (2001c), using HFS/IS from Ivans et al. (2006); (29) Den Hartog et al. (2006); (30) Lawler et al. (2001b), using HFS from Lawler et al. (2001d); (31) Wickliffe et al. (2000); (32) Lawler et al. (2009) for values and HFS; (33) Quinet et al. (2006) . 101010The complete version of this Table is available online only. A subset is shown here to illustrate its form and content.