Fashionpedia-Taste: A Dataset towards Explaining Human Fashion Taste
Abstract
Existing fashion datasets don’t consider the multi-facts that cause a consumer to like or dislike a fashion image. Even two consumers like a same fashion image, they could like this image for total different reasons. In this paper, we study the reason why a consumer like a certain fashion image. Towards this goal, we introduce an interpretability dataset, Fashionpedia-taste, consist of rich annotation to explain why a subject like or dislike a fashion image from the following 3 perspectives: 1) localized attributes; 2) human attention; 3) caption. Furthermore, subjects are asked to provide their personal attributes and preference on fashion, such as personality and preferred fashion brands. Our dataset makes it possible for researchers to build computational models to fully understand and interpret consumers’ fashion taste from different humanistic perspectives and modalities. Fashionpedia-taste is available at: 111Fashionpedia project page: fashionpedia.github.io/home/
![[Uncaptioned image]](/html/2305.02307/assets/x1.png)
1 Introduction
Why users click ‘like’ on a fashion image shown on social platforms? They use ‘like’ to express their preference for fashion. In the context of fashion, apparel represents second highest e-commerce shopping category. Therefore, fully understand users’ fashion taste could play an important role on the fashion E-commerce.
To increase the chance for a consumer to buy fashion products, a various of recommendation systems have been developed and they have delivered decent results. However, even a recommendation system makes a correct recommendation for a consumer, does that mean the model really understand the reason why this user like this image? The answer is not clear to us. Furthermore, even two consumers like a same image, they could like this image for totally different reasons, as illustrated in Fig. 1. To our knowledge, no previous study has explored this problem before.
In this paper, we introduce an explainable fashion taste dataset, Fashionpedia-Taste, which asked the subjects to provide rationale explainations for the reasons that they like or dislike a fashion image from 3 perspectives: 1) localized attribute; 2) human attention; 3) caption. Additionally, we also collect the extra personal preference information from the subjects, such as preferred dress length, personality, brands, and fine-grained categories while buying a dress. Because these information might also correlate a user’s preference for a fashion image.
The aim of this work is to enable future studies and encourage more investigation to interpretability research of fashion taste and narrow the gap between human and machine understanding of images. The contributions of this work are: 1) an explainable fashion taste dataset consists of 10,000 expressions (like or dislike of an image), 52,962 selected attributes, 20,000 human attentions, and 20,000 captions to explain subjects’ fashion taste, over 1500 unique images, and 100 unique subjects; 2) we formalize a new task that not only requires models to predict whether a subject like or dislike a fashion image, but also explain the reasons from 3 different perspectives (localized attribute, human attention, and caption).
2 Related Work
| Task | Dataset name |
| Recognition | iMat [3], Deep [15], Clothing [29], F-MNIST [27], |
| F-550k [11], F-128 [21], F-14 [23], Hipster [14] | |
| Detection | ModaNet [32], Deep2 [2], Main [19] |
| Data Mining | Vintage [9], Chic [28], Ups [5], Latent [6], Geo [16] |
| F-144k [20], F-200K [4], Street [17], Runway [25] | |
| Retrieval | DARN [10], WTBI [13], Zappos [30], Deep [15] |
| Capsule [7], POG [1], VIBE [8], IQ [26] | |
| Attribute | Fashionpedia [12] |
| Localization | |
| Explainability | Fashionpedia-Taste |
| & Reasoning | |
Fashion dataset Most of the previous fashion datasets focus on recognition, detection, data mining, or retrieval tasks (Table 1). In the domain of interaction between users and fashion images, Fashion IQ [26] provides human-generated captions that distinguish similar pair of garment images through natural language feedback. ViBE [8] introduces a dataset to understand users’ fashion preference based on her specific body shape. Fashionpedia-Ads studied the correlation between ads and fashion taste among users. Unlike Fashion IQ, ViBE and Fashionpedia-Ads, our dataset focuses on explaining and reasoning on users’ fashion preference based on both visual and textual signal. Beyond fashion domain, the most relevant work is VCR [31], which requires models to answer correctly and then provide a rationale justificatoin to its answer. Unlike VCR, our dataset requires models to complete more complicated multi-stage reasoning through different modalities (task1/2/3/4) for subjects’ fashion taste, as illustrated in Fig. 1.
3 Fashion Taste Annotation from Subjects
Subjects and Annotation pipeline We recruited 100 female subjects from a U.S. university. Our user annotation process consists of 2 parts: 1) collect subjects’ basic information (Sec. 3.1); 2) collect subjects’ fashion taste for given dress length categories (Sec. 3.2). All the subjects are required to complete these two process.
3.1 Basic Information Survey
This survey is used to collect the subjects’: 1) basic information (gender, ethnicity, age); 2) personality; 3) basic fashion preference (favorite fashion brands, fashion attributes and categories); 4) favorite dress length, which is used to determine the images from which dress length should be assigned to each subject for the survey mentioned in Sec. 3.2.
Personality Similar to [18], we use the 10-item multiple-choice questions to measure subjects’ personality. We collect personality data because we want to see whether there is a correlation between subjects’ personality and their fashion taste.
Basic fashion preference We collect users’ fashion preference (fashion categories, fashion attributes, and brands) because we are curious whether this self-reported fashion preference is aligned with their preference measured in Sec. 3.2.
3.2 Fashion Taste Survey
Task Design In the fashion taste survey, the subjects are given 100 dress images based on their favourite dress lengths reported in their basic information survey (Sec. 3.1). They are required to tell whether they like these dresses and provide the reasons why they like or dislike these dresses. For each given dress image, they need to complete the following 4 tasks:
-
•
Task 1: judge whether they like or dislike a given dress.
-
•
Task 2-Attribute selection: explain which aspects make them like and dislike a given dress.
-
•
Task 3-Human attention: indicate (draw polygons) the regions of the dress that make them like and dislike a given dress.
-
•
Task 4-Textual explanation: explain why the regions they draw from task 3 make them like and dislike a given dress.
Why we design these 4 tasks Task 2, 3 and 4 allow the subjects to explain their fashion taste from 3 different perspectives and modalities. Task 2 allows the subjects to explain their fashion taste on the perspective of fine-grained attributes. However, Task 2 might miss to capture some information that can only be explained visually. Task 3 is used to address this issue and simulates human gaze capture, allowing the subjects to explain their fashion taste visually. Furthermore, to fully understand the area that subjects draw in task 3, we use Task 4 to allow the subjects to further explain why their draw the areas in Task 3 textually.
Imbalanced likes and dislikes: we expect it will have big data imbalance if we only ask the subjects to explain the reasons that make them like a dress. To address this issue, we asked users to explain both the aspects that make them like and dislike a given image for task 2, 3, and 4.
4 Dataset Analysis
4.1 User annotation analysis
User basic info
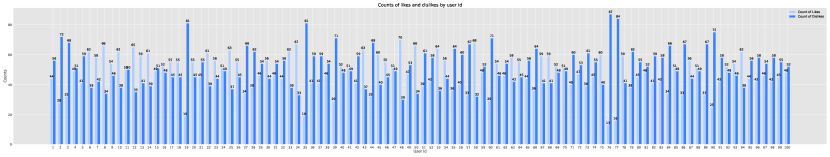
Task1-Like / dislike We collect 4766 likes and 5234 dislikes, over 1500 unique images, and 100 unique users. The frequency of likes and dislikes selected by each user is shown in Fig. 2, indicating most of the users have fairly balanced like and dislike ratio. Balanced like and dislike ratio could potentially help train less biased models.
Task2-Attribute selection Table 2 breaks down the frequency of liked and disliked attributes selected by each user into different dress lengths. The average liked attributes (3.9397) is nearly 3 times more than disliked attributes (1.4565). This indicates most of the users tend to select the attributes that they like rather than dislike while explaining why they like/dislike a dress.
Table 3 displays the details of annotated attributes into their corresponding fine-grained categories (super-categories). ’Silhouette’ contains highest percentage of liked attributes (21.9 %). This indicates most of users’ fashion preference is determined by the shape of a dress. In contrast, ’textile finishing and manufacturing technique’ (Tex fini, manu-tech) contains highest percentage of disliked attributes (23.9 %). This suggests a user could dislike a dress because of this category even she likes the ’silhouette’ of a dress.
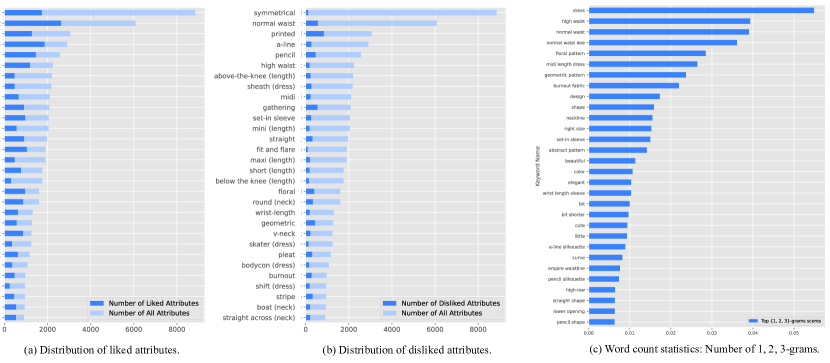
Fig. 3. (a) & (b) shows the distribution of liked and disliked attributes annotated by the users. The results show ’printed’ and ’normal waist’ are the main reason that causes some users to like a dress. However, these attributes can also be the factor that causes users dislike a dress. Because a user could like a certain type of printed pattern but dislike another type of printed pattern. To better explain a user’s fashion taste, it requires to train a model to not only understand users’ preference on a specific attribute, but also the pixel-level pattern on the area that this attribute is located. For this purpose, we asked the users to conduct task 3.
| Length Type | Selection type | # Total | # Average |
| all lengths | Liked | 38397 | 3.9397 |
| all lengths | Disliked | 14565 | 1.4565 |
| mini | Liked | 7991 | 3.89 |
| mini | Disliked | 3117 | 1.52 |
| above | Liked | 8001 | 3.63 |
| above | Disliked | 3076 | 1.39 |
| below | Liked | 6312 | 3.60 |
| below | Disliked | 2561 | 1.46 |
| midi | Liked | 8463 | 4.03 |
| midi | Disliked | 3076 | 1.46 |
| maxi | Liked | 7630 | 4.01 |
| maxi | Disliked | 2735 | 1.43 |
| Super-category | # Liked | Freq. | # Disliked | Freq. |
| attribute | attribute | |||
| Dress Style | 2385 | 6.2 % | 1132 | 7.7 % |
| Silhouette | 8419 | 21.9 % | 1786 | 12.2 % |
| Textile Pattern | 3194 | 8.3 % | 2031 | 13.9 % |
| Tex fini, manu-tech | 5656 | 14.7 % | 3493 | 23.9 % |
| None-Textile Type | 49 | 0.1 % | 49 | 0.33 % |
| Neckline Style | 6611 | 17.2 % | 2283 | 15.6 % |
| Collar Style | 387 | 1 % | 101 | 0.7 % |
| Lapel Style | 28 | 0.1 % | 4 | 0.02 % |
| Sleeve Style | 2179 | 5.6 % | 726 | 4.9 % |
| Sleeve length | 1917 | 4.9 % | 592 | 4.1 % |
| Pocket Style | 236 | 0.6 % | 84 | 0.5 % |
| Opening Type | 691 | 1.8 % | 453 | 3.1 % |
| Waistline | 4146 | 10.7 % | 849 | 5.8 % |
| Dress length | 2499 | 6.5 % | 982 | 6.7 % |
Task3-Human attention Table 4 shows the number of total human attention annotated by the users for each dress length. The number of annotated attention is evenly distributed across different dress length.
| Length Type | # Total gaze |
| all lengths | 20000 |
| mini | 4100 |
| above | 4400 |
| below | 3500 |
| midi | 4200 |
| maxi | 3800 |
Task4-Textual explanation for task 3 Task 4 contains 11.3 words in average per user and 5.6 words in average per subtask (task 4.1 for liked explanation and task 4.2 for disliked explanation).
Word count statistics: we use SGRank from Textacy [24] to calculate the frequency of words. Fig. 3.(c) shows the most frequent 1, 2, 3 grams for our dataset. Waistline (high, normal, and empire waist) and pattern (floral, geometric, abstract) related words are high frequency words used by the users to explain the attention that they draw for Task3.
Linguistic statistics: we use part-of-speech (POS) tagging from Spacy [22] to tag noun, propn, and adj of the captions annotated in Task 4. Table 5 shows the number of most frequent unique words by POS. We find the most frequent common nouns are more associated with high level description of a dress, such as neckline, pattern and waistline. In contrast, the most frequent proper nouns are more related to detailed description of a dress, such as applique, bead, and peter pan collar. This shows the linguistic diversity of our dataset.
| POS Type | Word |
| Noun | dress, neck, length, neckline, design, shape, pattern, |
| waist, color, sleeve, curve, waistline, fabric, skirt | |
| Propn | maxi, applique, bead, kimono, peter pan, pleat, tiered |
| halter, dolman, slit, tent, stripe, cutout, cheetah | |
| Adj | elegant, beautiful, nice, cute, high, straight, perfect |
| floral, loose, graceful, sexy, fit, attractive, charming | |
5 Conclusion
In this work, we studied the problem of human taste in fashion product image. we introduce an explainable fashion taste dataset, Fashionpedia-Taste, with a purpose to understand fashion taste from 3 perspectives: 1) localized attribute; 2) human attention; 3) caption. The aim of this work is to enable future studies and encourage more investigation to interpretability research of fashion taste and narrow the gap between human and machine understanding of images.
References
- [1] Wen Chen, Pipei Huang, Jiaming Xu, Xin Guo, Cheng Guo, Fei Sun, Chao Li, Andreas Pfadler, Huan Zhao, and Binqiang Zhao. Pog: personalized outfit generation for fashion recommendation at alibaba ifashion. In Proceedings of the 25th ACM SIGKDD international conference on knowledge discovery & data mining, pages 2662–2670, 2019.
- [2] Yuying Ge, Ruimao Zhang, Xiaogang Wang, Xiaoou Tang, and Ping Luo. Deepfashion2: A versatile benchmark for detection, pose estimation, segmentation and re-identification of clothing images. In CVPR, 2019.
- [3] Sheng Guo, Weilin Huang, Xiao Zhang, Prasanna Srikhanta, Yin Cui, Yuan Li, Hartwig Adam, Matthew R Scott, and Serge Belongie. The imaterialist fashion attribute dataset. In ICCV Workshops, 2019.
- [4] Xintong Han, Zuxuan Wu, Phoenix X. Huang, Xiao Zhang, Menglong Zhu, Yuan Li, Yang Zhao, and Larry S. Davis. Automatic spatially-aware fashion concept discovery. In ICCV, 2017.
- [5] Ruining He and Julian McAuley. Ups and downs: Modeling the visual evolution of fashion trends with one-class collaborative filtering. In WWW, 2016.
- [6] Wei-Lin Hsiao and Kristen Grauman. Learning the latent “look”: Unsupervised discovery of a style-coherent embedding from fashion images. In ICCV, 2017.
- [7] Wei-Lin Hsiao and Kristen Grauman. Creating capsule wardrobes from fashion images. In Proceedings of the IEEE conference on computer vision and pattern recognition, pages 7161–7170, 2018.
- [8] Wei-Lin Hsiao and Kristen Grauman. Vibe: Dressing for diverse body shapes. In Proceedings of the IEEE/CVF Conference on Computer Vision and Pattern Recognition, pages 11059–11069, 2020.
- [9] Wei-Lin Hsiao and Kristen Grauman. From culture to clothing: Discovering the world events behind a century of fashion images. In Proceedings of the IEEE/CVF International Conference on Computer Vision, pages 1066–1075, 2021.
- [10] Junshi Huang, Rogerio Feris, Qiang Chen, and Shuicheng Yan. Cross-domain image retrieval with a dual attribute-aware ranking network. In ICCV, 2015.
- [11] Naoto Inoue, Edgar Simo-Serra, Toshihiko Yamasaki, and Hiroshi Ishikawa. Multi-label fashion image classification with minimal human supervision. In ICCV, 2017.
- [12] Menglin Jia, Mengyun Shi, Mikhail Sirotenko, Yin Cui, Claire Cardie, Bharath Hariharan, Hartwig Adam, and Serge Belongie. Fashionpedia: Ontology, segmentation, and an attribute localization dataset. In European conference on computer vision, pages 316–332. Springer, 2020.
- [13] M. H. Kiapour, X. Han, S. Lazebnik, A. C. Berg, and T. L. Berg. Where to buy it: Matching street clothing photos in online shops. In ICCV, 2015.
- [14] M Hadi Kiapour, Kota Yamaguchi, Alexander C Berg, and Tamara L Berg. Hipster wars: Discovering elements of fashion styles. In ECCV, 2014.
- [15] Ziwei Liu, Ping Luo, Shi Qiu, Xiaogang Wang, and Xiaoou Tang. Deepfashion: Powering robust clothes recognition and retrieval with rich annotations. In CVPR, 2016.
- [16] Utkarsh Mall, Kevin Matzen, Bharath Hariharan, Noah Snavely, and Kavita Bala. Geostyle: Discovering fashion trends and events. In Proceedings of the IEEE/CVF International Conference on Computer Vision, pages 411–420, 2019.
- [17] Kevin Matzen, Kavita Bala, and Noah Snavely. StreetStyle: Exploring world-wide clothing styles from millions of photos. arXiv preprint arXiv:1706.01869, 2017.
- [18] Nils Murrugarra-Llerena and Adriana Kovashka. Cross-modality personalization for retrieval. In Proceedings of the IEEE/CVF Conference on Computer Vision and Pattern Recognition, pages 6429–6438, 2019.
- [19] Antonio Rubio, LongLong Yu, Edgar Simo-Serra, and Francesc Moreno-Noguer. Multi-modal embedding for main product detection in fashion. In ICCV, 2017.
- [20] Edgar Simo-Serra, Sanja Fidler, Francesc Moreno-Noguer, and Raquel Urtasun. Neuroaesthetics in fashion: Modeling the perception of fashionability. In CVPR, 2015.
- [21] Edgar Simo-Serra and Hiroshi Ishikawa. Fashion style in 128 floats: Joint ranking and classification using weak data for feature extraction. In CVPR, 2016.
- [22] Spacy. Industrial-strength natural language processing. https://spacy.io/, 2022.
- [23] Moeko Takagi, Edgar Simo-Serra, Satoshi Iizuka, and Hiroshi Ishikawa. What makes a style: Experimental analysis of fashion prediction. In ICCV, 2017.
- [24] Textacy. Textacy: Nlp, before and after spacy. https://textacy.readthedocs.io/en/latest/, 2022.
- [25] S. Vittayakorn, K. Yamaguchi, A. C. Berg, and T. L. Berg. Runway to realway: Visual analysis of fashion. In WACV, 2015.
- [26] Hui Wu, Yupeng Gao, Xiaoxiao Guo, Ziad Al-Halah, Steven Rennie, Kristen Grauman, and Rogerio Feris. Fashion iq: A new dataset towards retrieving images by natural language feedback. In Proceedings of the IEEE/CVF Conference on Computer Vision and Pattern Recognition, pages 11307–11317, 2021.
- [27] Han Xiao, Kashif Rasul, and Roland Vollgraf. Fashion-mnist: a novel image dataset for benchmarking machine learning algorithms. arXiv preprint arXiv:1708.07747, 2017.
- [28] Kota Yamaguchi, Tamara L Berg, and Luis E Ortiz. Chic or social: Visual popularity analysis in online fashion networks. In ACM MM, 2014.
- [29] Kota Yamaguchi, M Hadi Kiapour, Luis E Ortiz, and Tamara L Berg. Parsing clothing in fashion photographs. In CVPR, 2012.
- [30] Aron Yu and Kristen Grauman. Semantic jitter: Dense supervision for visual comparisons via synthetic images. In ICCV, 2017.
- [31] Rowan Zellers, Yonatan Bisk, Ali Farhadi, and Yejin Choi. From recognition to cognition: Visual commonsense reasoning. In Proceedings of the IEEE/CVF conference on computer vision and pattern recognition, pages 6720–6731, 2019.
- [32] Shuai Zheng, Fan Yang, M Hadi Kiapour, and Robinson Piramuthu. Modanet: A large-scale street fashion dataset with polygon annotations. In ACM MM, 2018.